former dixie coca-cola bottling plant...former dixie coca-cola bottling plant 1913 west state -...
TRANSCRIPT

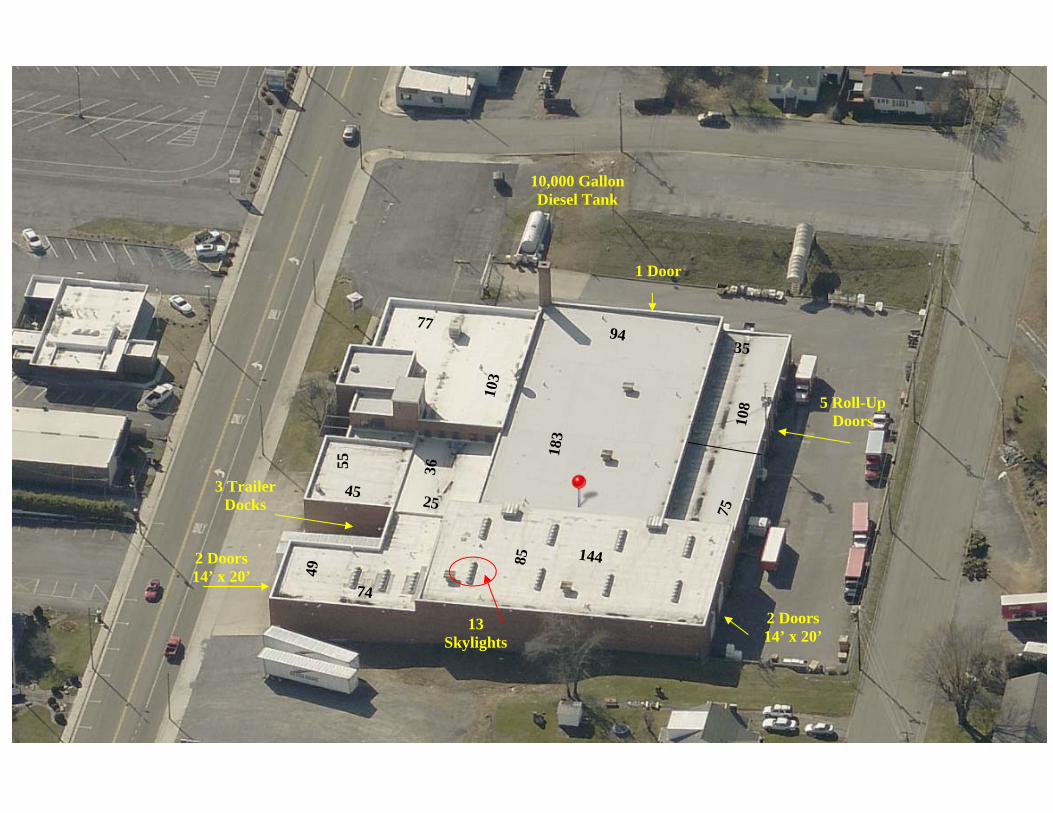
Former Dixie Coca-Cola Bottling Plant 1913 West State - Bristol, VA
For More Information Contact:
Kelly Graham, CCIM Graham & Associates PO Box 2044 126 Edgemont Ave. Bristol, TN 423-968-2276
Website: www.KellyGraham.com Email: [email protected]
4.13 Acres 45,500 SF Warehouse Space
8,000 SF Office & Storage Space Large Truck Repair Shop
with 5 Roll-Up Doors 3 Tractor Trailer Docks
5 Large Drive-Thru Doors 13’ & 22’ Ceilings Clearances
in Warehouse Gas Space Heaters in Warehouse
$600,000


103
183
94
85 144
49
74
25
36 55
45
77
75
35
108
2 Doors 14’ x 20’
2 Doors 14’ x 20’
3 Trailer Docks
1 Door
5 Roll-Up Doors
13 Skylights
10,000 Gallon Diesel Tank


Executive Summary1913 W State St, Bristol, Virginia, 24201 Prepared By Graham & Associates - CCIMRings: 1, 3, 5 mile radii Latitude: 36.59560
Longitude: -82.20320
1 mile 3 miles 5 milesPopulation
2000 Population 7,051 32,445 50,6822010 Population 6,889 32,300 51,8832018 Population 6,736 32,101 52,1252023 Population 6,596 31,912 52,0882000-2010 Annual Rate -0.23% -0.04% 0.23%2010-2018 Annual Rate -0.27% -0.07% 0.06%2018-2023 Annual Rate -0.42% -0.12% -0.01%2018 Male Population 47.7% 47.9% 48.0%2018 Female Population 52.3% 52.1% 52.0%2018 Median Age 43.4 43.9 44.8
In the identified area, the current year population is 52,125. In 2010, the Census count in the area was 51,883. The rate of change since 2010 was 0.06% annually. The five-year projection for the population in the area is 52,088 representing a change of -0.01% annually from 2018 to 2023. Currently, the population is 48.0% male and 52.0% female.
Median Age
The median age in this area is 43.4, compared to U.S. median age of 38.3.Race and Ethnicity
2018 White Alone 90.5% 90.6% 92.3%2018 Black Alone 4.3% 5.0% 3.8%2018 American Indian/Alaska Native Alone 0.4% 0.4% 0.3%2018 Asian Alone 0.9% 0.8% 0.9%2018 Pacific Islander Alone 0.0% 0.0% 0.0%2018 Other Race 1.4% 1.0% 0.8%2018 Two or More Races 2.4% 2.3% 1.9%2018 Hispanic Origin (Any Race) 3.5% 2.6% 2.2%
Persons of Hispanic origin represent 2.2% of the population in the identified area compared to 18.3% of the U.S. population. Persons of Hispanic Origin may be of any race. The Diversity Index, which measures the probability that two people from the same area will be from different race/ethnic groups, is 18.3 in the identified area, compared to 64.3 for the U.S. as a whole.
Households2000 Households 3,179 14,174 21,7532010 Households 3,021 14,010 22,3442018 Total Households 2,919 13,899 22,3832023 Total Households 2,846 13,775 22,3082000-2010 Annual Rate -0.51% -0.12% 0.27%2010-2018 Annual Rate -0.42% -0.10% 0.02%2018-2023 Annual Rate -0.51% -0.18% -0.07%2018 Average Household Size 2.27 2.24 2.28
The household count in this area has changed from 22,344 in 2010 to 22,383 in the current year, a change of 0.02% annually. The five-year projection of households is 22,308, a change of -0.07% annually from the current year total. Average household size is currently 2.28, compared to 2.26 in the year 2010. The number of families in the current year is 13,904 in the specified area.
Data Note: Income is expressed in current dollarsSource: U.S. Census Bureau, Census 2010 Summary File 1. Esri forecasts for 2018 and 2023. Esri converted Census 2000 data into 2010 geography.
October 05, 2018
©2018 Esri Page 1 of 2

Executive Summary1913 W State St, Bristol, Virginia, 24201 Prepared By Graham & Associates - CCIMRings: 1, 3, 5 mile radii Latitude: 36.59560
Longitude: -82.20320
1 mile 3 miles 5 milesMedian Household Income
2018 Median Household Income $30,121 $34,491 $38,6252023 Median Household Income $33,570 $37,808 $42,9792018-2023 Annual Rate 2.19% 1.85% 2.16%
Average Household Income
2018 Average Household Income $38,804 $48,353 $54,9072023 Average Household Income $44,800 $56,321 $63,9772018-2023 Annual Rate 2.92% 3.10% 3.10%
Per Capita Income2018 Per Capita Income $17,727 $21,674 $24,1472023 Per Capita Income $20,355 $25,060 $27,9752018-2023 Annual Rate 2.80% 2.95% 2.99%
Households by IncomeCurrent median household income is $38,625 in the area, compared to $58,100 for all U.S. households. Median household income is projected to be $42,979 in five years, compared to $65,727 for all U.S. households
Current average household income is $54,907 in this area, compared to $83,694 for all U.S. households. Average household income is projected to be $63,977 in five years, compared to $96,109 for all U.S. households
Current per capita income is $24,147 in the area, compared to the U.S. per capita income of $31,950. The per capita income is projected to be $27,975 in five years, compared to $36,530 for all U.S. households Housing
2000 Total Housing Units 3,518 15,589 23,6332000 Owner Occupied Housing Units 1,798 8,879 15,2032000 Renter Occupied Housing Units 1,381 5,295 6,5512000 Vacant Housing Units 339 1,415 1,879
2010 Total Housing Units 3,480 15,757 24,8252010 Owner Occupied Housing Units 1,671 8,396 15,0602010 Renter Occupied Housing Units 1,350 5,614 7,2842010 Vacant Housing Units 459 1,747 2,481
2018 Total Housing Units 3,486 15,970 25,3082018 Owner Occupied Housing Units 1,500 7,917 14,5432018 Renter Occupied Housing Units 1,418 5,982 7,8402018 Vacant Housing Units 567 2,071 2,925
2023 Total Housing Units 3,505 16,137 25,6752023 Owner Occupied Housing Units 1,498 7,996 14,7302023 Renter Occupied Housing Units 1,349 5,779 7,5782023 Vacant Housing Units 659 2,362 3,367
Currently, 57.5% of the 25,308 housing units in the area are owner occupied; 31.0%, renter occupied; and 11.6% are vacant. Currently, in the U.S., 56.0% of the housing units in the area are owner occupied; 32.8% are renter occupied; and 11.2% are vacant. In 2010, there were 24,825 housing units in the area - 60.7% owner occupied, 29.3% renter occupied, and 10.0% vacant. The annual rate of change in housing units since 2010 is 0.86%. Median home value in the area is $121,780, compared to a median home value of $218,492 for the U.S. In five years, median value is projected to change by 3.04% annually to $141,423.
Data Note: Income is expressed in current dollarsSource: U.S. Census Bureau, Census 2010 Summary File 1. Esri forecasts for 2018 and 2023. Esri converted Census 2000 data into 2010 geography.
October 05, 2018
©2018 Esri Page 2 of 2