full year 2014 results - schneider electric strategy and business update 19 finance presentation 30...
TRANSCRIPT

Full year 2014 Results
1
Full year 2014 Results
February 19, 2015
DisclaimerAll forward-looking statements are Schneider Electric management’s present expectations of future events and are subject to a
number of factors and uncertainties that could cause actual results to differ materially from those described in the forward-looking
statements. For a detailed description of these factors and uncertainties, please refer to the section “Risk Factors” in our Annual
Registration Document (which is available on www.schneider-electric.com). Schneider Electric undertakes no obligation to publicly
update or revise any of these forward-looking statements.
This presentation includes information pertaining to our markets and our competitive positions therein. Such information is based
on market data and our actual revenues in those markets for the relevant periods. We obtained this market information from various
2Schneider Electric – Investor Relations –Full year 2014 results – 19 February 2015
on market data and our actual revenues in those markets for the relevant periods. We obtained this market information from various
third party sources (industry publications, surveys and forecasts) and our own internal estimates. We have not independently
verified these third party sources and cannot guarantee their accuracy or completeness and our internal surveys and estimates
have not been verified by independent experts or other independent sources.

Strategy and business update4
Finance presentation19
30 Connect Update
3Schneider Electric – Investor Relations –Full year 2014 results – 19 February 2015
32 Full year 2015 Targets
34 Appendices
30 Connect Update

Strategy and business update
4Schneider Electric – Investor Relations –Full year 2014 results – 19 February 2015
Strategy and business update

Solid execution delivered full year targets Invensys integration well on track � Strong H2 performance lifted full year revenues gro wth• Early cycle businesses together with IT drove growth, Infrastructure improved• Improvement in mature countries balance new economies. • Services kept their pace
� Gross margin up, adj EBITA margin improved at consta nt FX1
• Continued strong industrial productivity• Positive net price (price less raw materials impact)
+6.6% in 2014,
+1.4% organically, +3.2% excl. Infrastructure
Gross margin +20 bps, +60 bps excl. FX.
Adj. EBITA margin 13.9%, +40 bps 1 excl. FX
5Schneider Electric – Investor Relations –Full year 2014 results – 19 February 2015
� Invensys integration well on track• Organic growth in revenues, strong margin expansion and cash generation• Highly EPS3 accretive to the Group
Revenues +2% org, adj. EBITA margin +5.5 ptsDouble Digit EPS accretion to the Group
� Net income growth despite unfavorable FX� Solid free cash flow
Net income +3%, c.+11% at constant FX2
Free cash flow of €1.7bn
1 Comparing to Group proforma 2013 of 13.9% , see page 232 Excluding post-tax FX impact on adjusted EBITA and FX gains and losses in financials3 Based on reported EPS

Strong H2 performance drove full year revenues up 1.4% organically, 3.2% excluding Infrastructure
4.33.5
Full year 2014 organic growth, %Group organic growth, %
2.5 2.5
+3.2% organic growth excluding Infrastructure
Group+1.4% org.
Focus on growth initiatives and project execution in a turbulent market
6Schneider Electric – Investor Relations –Full year 2014 results – 19 February 2015
IT Infrastructure
-4.4
Industry
1.1
Buildings & Partner
3.5
1.6
Q2 2014 Q3 2014
-1.1
Q1 2014 Q4 2014

Buildings & Partner kept its growth pace in H2
3.43.5
Organic growth, %
Buildings and Partner
Buildings & Partner H2 performance:
� Dynamic construction and data center markets in the US
� Slowdown in China while Australia and India improved
� Western Europe stabilized
� Rest of the World grew with mixed trends
7Schneider Electric – Investor Relations –Full year 2014 results – 19 February 2015
H2 2014H1 2014Medium range Miniature Circuit Breaker for new
economiesSmart connected
panelboard

Industry continued to grow in H2 though at a slightly lower pace, due to high comparison base
5.1
Organic growth, %
Industry
Industry H2 performance:
� Solid OEM demand in US
� Soft China market offset by growth in Japan and Australia
� Sustained export-oriented OEMs demand in Western Europe
8Schneider Electric – Investor Relations –Full year 2014 results – 19 February 2015
3.5
H2 2014H1 2014
M580: World’s first ePAC1 with built-in
ethernet
Machine Solution –Next Controller
Generation
1 PAC: Programmable Automation Controller

Solid execution in H2 lifted up full year IT growth
3.9
Organic growth, %
IT
IT H2 performance:
� Good growth in the US driven by both products and solutions
� Continued active IT market in Western Europe
� Active IT investments in Australia and South East Asia
9Schneider Electric – Investor Relations –Full year 2014 results – 19 February 2015
-2.0
H2 2014H1 2014 Power Bankfor portable reliability
Prefabricated data centerfor quick deployment

Infrastructure showed signs of improvement towards the end of the year
0.3
Organic growth, %
Infrastructure
Infrastructure H2 performance:
� Utility market remains weak in Western Europe
� Active datacenter and services in the US
� Growth in Australia and India thanks to project execution
� Mixed trends in Rest of the World
10Schneider Electric – Investor Relations –Full year 2014 results – 19 February 2015
-5.8
-8.9
-3.7
Q4 2014Q3 2014Q2 2014Q1 2014 Premset medium voltage switchgear
modular and compact
E-house modular power substationIntegrated solution with complete
Group offers

Mature countries accelerated their growth in H2, balancing the lower growth from new economies
Mature countries’ organic growth, % New Economies organic growth, %
• Slow down in China3
• Mid single digit growth in the US
• Improvement in Western Europe
3
11Schneider Electric – Investor Relations –Full year 2014 results – 19 February 2015
• Slow down in China3
-1
H2 2014H1 2014
2
H2 2014H1 2014

Services continued to be the growth engine thanks to focused investments
2014 investments
� Continued efforts to improve installed base tracking
� Recruitment of around 500 field service experts
� Launch of an Enterprise IoT platform (Schneider
8.0
0.7
2014 organic growth, %
12Schneider Electric – Investor Relations –Full year 2014 results – 19 February 2015
Electric Cloud), a key enabler of digital services
Software as a service
> Weather intelligence for NSTAR, a
U.S. electricity and natural gas utility> Enabling better anticipation of
potential outages & faster power
restoration
Field service
> Modernization & energy
monitoring system for 5-building campus in South Africa
> Uptime improvement & up to
30% energy savings
ServicesRest of Group

Invensys strategic fit confirmed and integration well on track
� Invensys fully integrated in the Industry business
� Value proposition updated for targeted segments
� Reinforce industrial automation capabilities
� Boost Group’s positions in
INTEGRATION HIGHLIGHTSTRATEGIC FIT
13Schneider Electric – Investor Relations –Full year 2014 results – 19 February 2015
� Value proposition updated for targeted segments
to include Invensys offers
� Invensys software embedded in the Group’s offer
(StruxureWare suites & digital service platform)
� Boost Group’s positions in
key electro-intensive segments
� Strengthen software for customer
operational efficiency
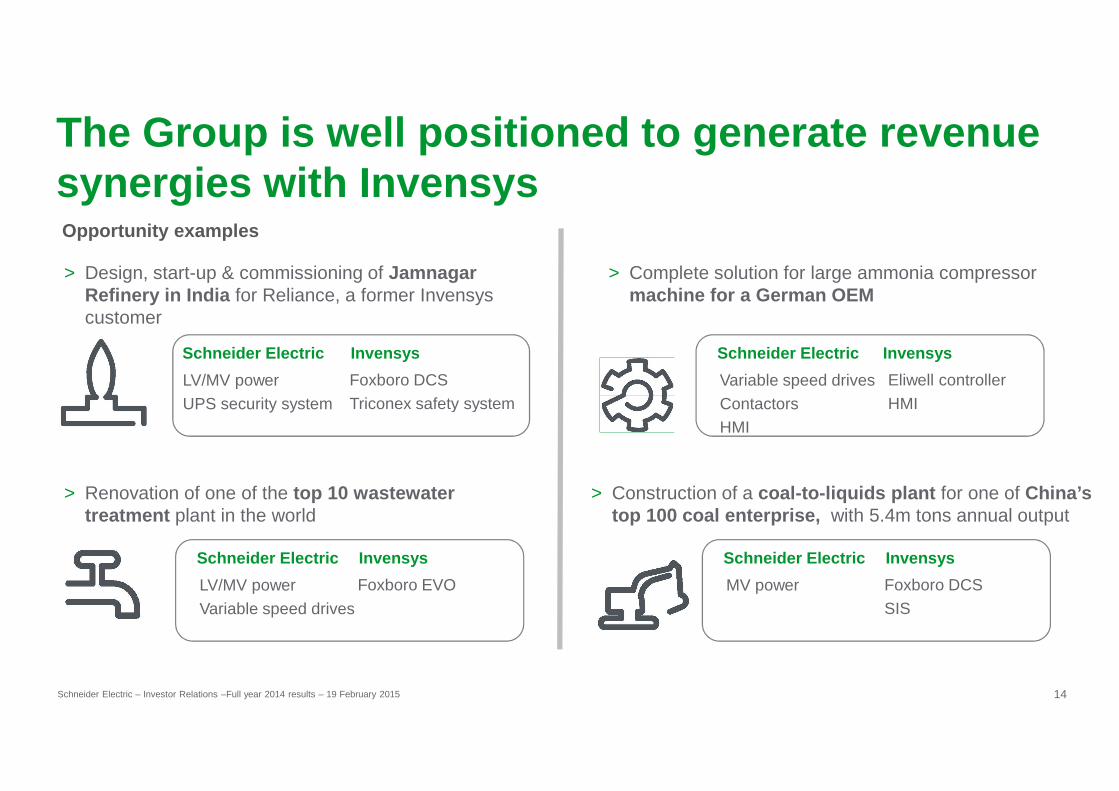
The Group is well positioned to generate revenue synergies with Invensys
> Design, start-up & commissioning of Jamnagar Refinery in India for Reliance, a former Invensys customer
> Complete solution for large ammonia compressor machine for a German OEM
Schneider Electric
Foxboro DCS
Triconex safety systemLV/MV power
UPS security system
Invensys Schneider Electric
Eliwell controller
HMIVariable speed drives
Contactors
Invensys
Opportunity examples
14Schneider Electric – Investor Relations –Full year 2014 results – 19 February 2015
> Renovation of one of the top 10 wastewater treatment plant in the world
> Construction of a coal-to-liquids plant for one of China’s top 100 coal enterprise, with 5.4m tons annual output
Triconex safety systemUPS security system
Schneider Electric
Foxboro EVOLV/MV power
Variable speed drives
Invensys
HMIContactorsHMI
Schneider Electric
Foxboro DCS
SISMV power
Invensys
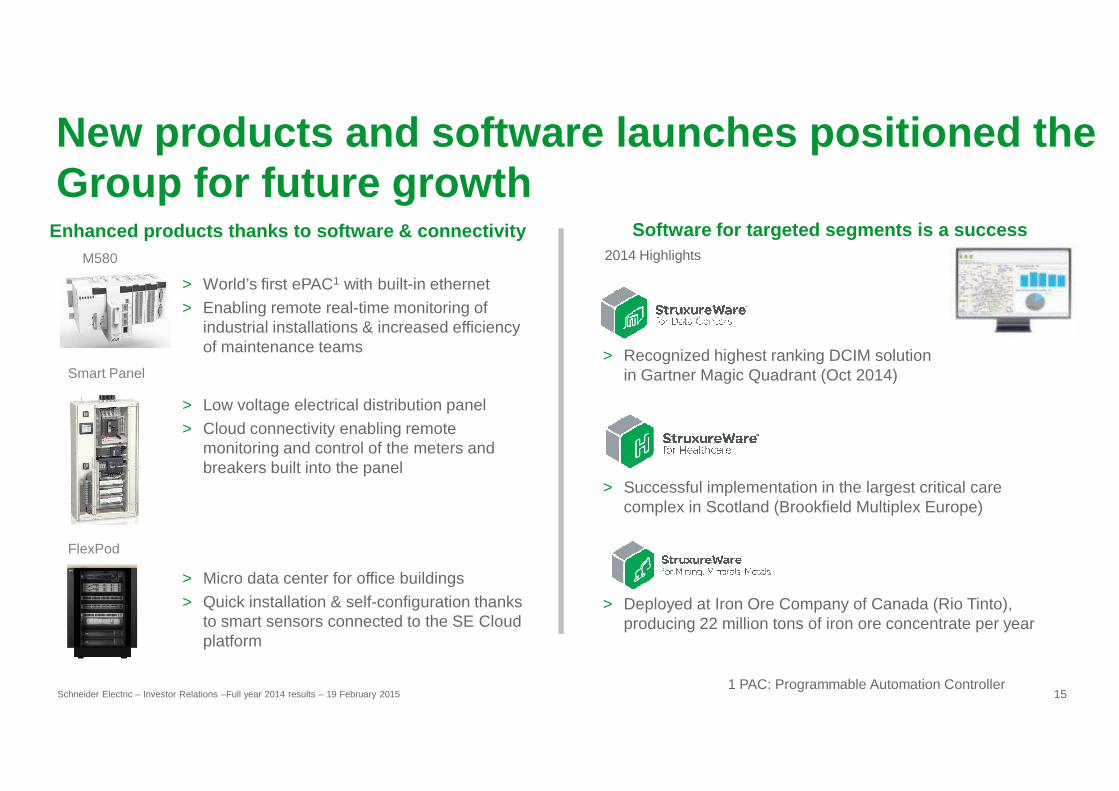
New products and software launches positioned the Group for future growth
Enhanced products thanks to software & connectivity Software for targeted segments is a success
> Recognized highest ranking DCIM solution in Gartner Magic Quadrant (Oct 2014)
> World’s first ePAC1 with built-in ethernet
> Enabling remote real-time monitoring of industrial installations & increased efficiency of maintenance teams
M580 2014 Highlights
Smart Panel
15Schneider Electric – Investor Relations –Full year 2014 results – 19 February 20151 PAC: Programmable Automation Controller
> Micro data center for office buildings
> Quick installation & self-configuration thanks to smart sensors connected to the SE Cloud platform
FlexPod
> Successful implementation in the largest critical care complex in Scotland (Brookfield Multiplex Europe)
> Deployed at Iron Ore Company of Canada (Rio Tinto), producing 22 million tons of iron ore concentrate per year
> Low voltage electrical distribution panel
> Cloud connectivity enabling remote monitoring and control of the meters and breakers built into the panel

We continued to improve our supply chain efficiency
Industrial Productivity (€bn)
€1bn AccumulatedSince 2012
Inventory to Revenues Ratio1 (%)
16Schneider Electric – Investor Relations –Full year 2014 results – 19 February 2015
0.360.36
0.29
201420132012 2014
~2 pts
2011
1 Excluding Invensys

At the end of Connect, our Planet & Society barometer reached 9.52/10
8
6
4
10
3.87
8
3.94
4.94
9.52/10
6.42 6.25 6.09 6.38
Q4 2014 target
5.50
Performance of our Planet & Society barometer 7.51
8.048.85
9.20
17Schneider Electric – Investor Relations –Full year 2014 results – 19 February 2015
2
0
2014
4
2013Q1 Q3 Q4
2012Q1Q2 Q2 Q3 Q1 Q2 Q3 Q4Q4
A performing Planet & Society barometer● With a final score of 9.52/10, the Planet & Society barometer has exceeded by far its 3-year target of 8/10, for the period 2012-2014.● Among the 14 indicators of the Planet & Society barometer, 10 indicators have reached 10/10 and 3 other have reached 8/10.
3.85
See detailed results page 38
Target
Actual

Our performance and commitment have been recognized
Profit
Planet
Q3 2014 Q4 2014
Selected indicators
● 10% CO2 savings on transportation
● 10% energy consumption savings
16%
12.8% 13%
15.4%
Highlights of the yearIndicators and objectives 2014
Member of “The A list”CDP Climate Performance and Disclosure indices 99/100 in disclosure and “A” in performance
“Industry Leader”of the Dow Jones Sustainability World & Europe for the second year
18Schneider Electric – Investor Relations –Full year 2014 results – 19 February 2015
Profit
Selected indicators
● 90% of our recommended suppliersembrace ISO 26000 guidelines
● 300 sites recognized “Cool sites ” 290 355
42.9% 63%
People
Selected indicators
● 30% reduction in the Medical Incident Rate (MIR)
● 63% result in our Employee EngagementIndex
61%
61% 61%
62%Top 10 - Newsweek Green Rankingand 2nd industrial company
Top 10 - Global 100 most sustainable corporations in the worldfor the second year (Jan 2015)
EthisphereWorld's most ethical companiesfor the fourth year

Finance presentation
19Schneider Electric – Investor Relations –Full year 2014 results – 19 February 2015
Finance presentation

2014 revenues up 1.4% with all regions excluding Western Europe showing growth
Analysis of change in Group revenues (in €m)
24,939+6.6%
Fx-2.4%
Scope+7.6%
Organic+1.4%
20Schneider Electric – Investor Relations –Full year 2014 results – 19 February 2015
1 2013 figures were restated for Delixi full consolidation, CST reclassification in discontinued operations and other minor changes
2014
Rest of World+3%
North America+2%
Asia-Pacific+3%
Western Europe-2%
2013 restated1
23,392

Gross margin improved on positive net price and strong productivity
Analysis of change of gross margin (%)
+0.4-0.5 37.7+20bps
-0.4
-0.9+1.4
+0.20.037.5
� Industrial productivity is the key gross margin improvement driver
� Net price contributed 0.2pt
21Schneider Electric – Investor Relations –Full year 2014 results – 19 February 2015
Inflation & Others
Mix 2014CurrencyScopeProductivityNet PriceVolume
0.0
2013 Restated 1
37.5 � Net price contributed 0.2pt
� Negative mix driven by the strong growth of mid-market offers, negative geographical mix notably due to decline in Western Europe and impact of solutions growth in H2
� Invensys contributed positively to Group gross margin, offsetting the negative FX impact
1 2013 figures were restated for Delixi full consolidation, CST reclassification in discontinued operations and other minor changes

Adjusted EBITA grew high single digit at constant FX despite SFC investments
In €m 2013 Restated1 2014 Change Organic
changeChange at
constant FX
22Schneider Electric – Investor Relations –Full year 2014 results – 19 February 2015
Gross Profit 8,763 9,407 +7.4% +1.7% +10%
Support function costs
(5,407) (5,944) +9.9% +2.4%
Adjusted EBITA 3,356 3,463 +3.2% +0.6% +8%
1 2013 figures were restated for Delixi full consolidation, CST reclassification in discontinued operations and other minor changes

40 bps Adjusted EBITA margin improvement at constant FX and current scope
+0.4 -0.4
13.913.9
-0.414.3-0.214.5
Analysis of change of adjusted EBITA (%)
23Schneider Electric – Investor Relations –Full year 2014 results – 19 February 2015
2013 Proforma1 Margin improvement
at constant FX
FXInvensys impact
2013 restatedCST & Delixi impact
20142013 reported
1 The Proforma includes the calendarized 2013 results of Invensys, the restatement due to the reclassification of CST in discontinued operations, the full consolidation of Delixi (previously consolidated proportionally at 50%) and some additional scope adjustment
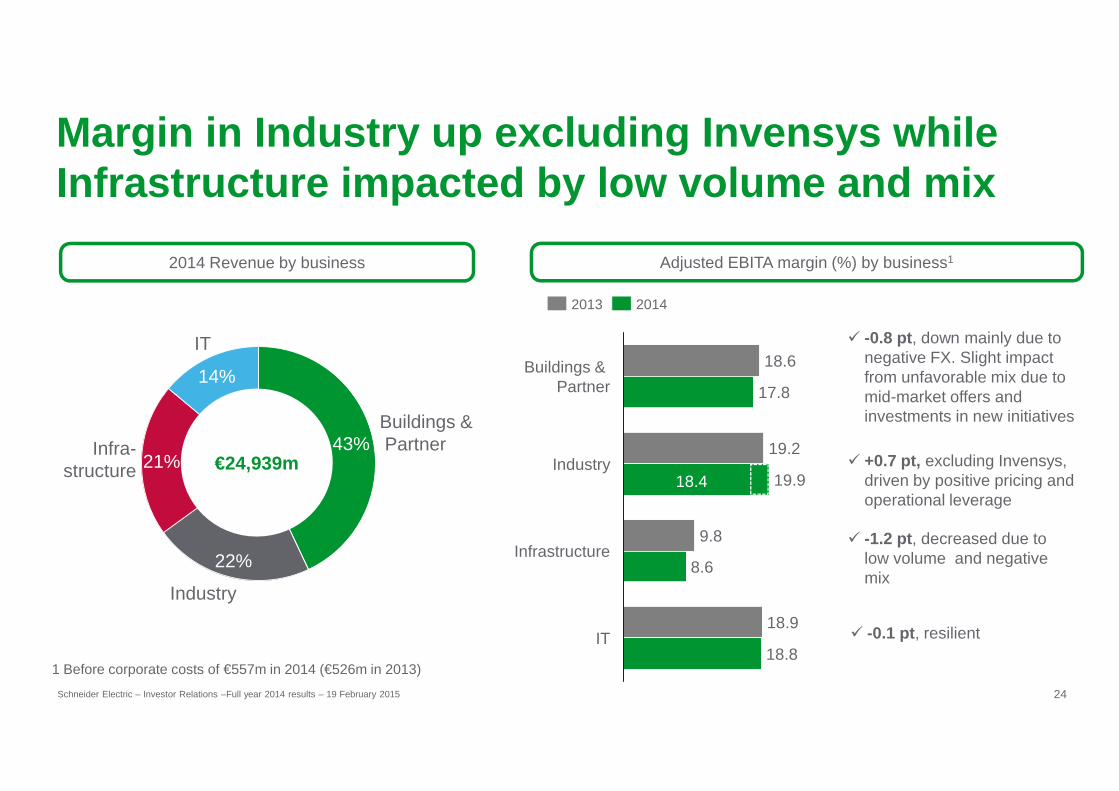
Margin in Industry up excluding Invensys while Infrastructure impacted by low volume and mix
� -0.8 pt , down mainly due to negative FX. Slight impact from unfavorable mix due to mid-market offers and
Buildings & Partner 17.8
18.6
20142013
14%
IT
2014 Revenue by business Adjusted EBITA margin (%) by business1
24Schneider Electric – Investor Relations –Full year 2014 results – 19 February 2015
1 Before corporate costs of €557m in 2014 (€526m in 2013)
mid-market offers and investments in new initiatives
� -1.2 pt , decreased due to low volume and negative mix
� -0.1 pt , resilient 18.8
IT18.9
Infrastructure8.6
9.8
Industry19.9
19.2
Partner 17.8
Infra-structure 21%
Industry
Buildings &Partner
22%
43%€24,939m � +0.7 pt, excluding Invensys,
driven by positive pricing and operational leverage
18.4

Net income is up c. 11% at constant FX and 6% adjusted for Invensys acquisition & integration cos ts
In €m 2013Restated 2014 y-o-y
ChangeChange at
constant FX
Adjusted EBITA 3,356 3,463 +3%Other income and expenses 71 (106)Restructuring (173) (202)
EBITA 3,254 3,155 -3%
Amortization & impairment of purchase accounting intangibles (215) (259)
Decreased cost of debt despite increase
Mainly due to Invensys integration costs
25Schneider Electric – Investor Relations –Full year 2014 results – 19 February 2015
purchase accounting intangibles
Net financial expense (484) (467)Income tax (651) (551)Discontinued operations 61 169Equity investments 20 14Minority interests (97) (120)
Net income (group share) 1,888 1,941 +3% c.+11%
Post-tax Invensys acquisition & integration costs adjustment1 10 62
Net income before Invensys acquisition & integration costs 1,898 2,003 +6%
Effective tax rate 22.7%, benefiting from Invensys
1 costs related to the one-off acquisition and integration costs from Invensys. Calculated post-Tax using each year ETR
debt despite increase in gross debt
Includes mainly the gain on disposal of CST and Invensys Appliance

Free Cash Flow generation at €1.7bn, cash conversion remains high at 96% 2
Stable excluding US office investments in 2014 and one-off building disposal gain in 2013
Analysis of debt change in €m 2013 Restated 2014
Net debt at opening (4,398) (3,326)
Operating cash flow 2,628 2,640
Capital expenditure – net (706) (829)Change in trade working capital 278 (162)Change in non-trade working capital (40) 55
Working capital: the good performance in inventory was
26Schneider Electric – Investor Relations –Full year 2014 results – 19 February 2015
Change in non-trade working capital (40) 55
Free cash flow 2,160 1,704
Free cash flow excluding Invensys integration costs 2,160 1,774
Dividends (1,056) (1,205)Acquisitions – net1 (233) (1,743)Capital increase & Share buybacks 235 (134)Effect of exchange rates and others (34) (318)(Increase) / Decrease in net debt 1,072 (1,696)Net debt at December 31st (3,326) (5,022)
FX-impact increased net debt by €199m
performance in inventory was offset by the decrease of account payables on high comparison base in 2013
1 Includes cash flow from effect of discontinued operations sold in 2014 2 see page 28

Invensys performed strongly in 2014 and contributed double -digit accretion to Group EPS in 2014
1,742
2014 1,683
2013 � Solid revenue growth in systems and software; and regionally in North America and Asia Pacific
� Adjusted EBITA margin up 5.5pts to 14.8% in 2014, driven by gross margin improvement and cost synergies, despite SFC investments
c. €140m
Order intake (€m)
Revenues ( €m)
Invensys performance
c. flat org.excl. unusuallarge orders
27Schneider Electric – Investor Relations –Full year 2014 results – 19 February 2015
159
2014
2013
254
� Strong free cash-flow generation of c. €140m
� Double digit EPS 1 accretion in 2014
� c.€75m cost savings achieved by the end of 2014. €140m total cost savings2 confirmed, targeting c.75% by end of 2015 and 100% by end of 2016
� €500m tax synergies confirmed, of which more than €300m realized by 2016, contributing to 3 to 4 pts reduction in effective tax-rate from 2014 to 2016
� Confirming integration costs of €150m by the end of 2015, out of which €81m were incurred in 2014
Revenues ( €m)
Adjusted EBITA (€m)
Targets achieved in 2014, confirming next 2 years targets
+5.5pts
+2% org.
1,713
1,701
2014
2013
1 Based on reported Earnings per Share2 Including savings from Patriot plan announced by Invensys in 2013

Solid cash conversion and improvement in ROCE despite negative FX impact
116
1069621041
Cash conversion (Free Cash Flow / Net income)
ROCE(in %)
12.1%
� Invensys contributed double-digit ROCE thanks to strong margin improvement and tax-benefit
28Schneider Electric – Investor Relations –Full year 2014 results – 19 February 2015
2014
96
20132012
11.0%
2014
11.7%
2013 proforma
10.9%
2013
12.1%
1 Based on the adjusted net income of €1,996m (before impairment of goodwill)2 Based on net income excluding discontinued operations
ROCE improved 80bps adjusted for FX and by 10bps compared to the 2013 proforma

Dividend history
Proposed dividend up 3% at €1.92, reflecting growth and strong contribution of Invensys
72.0
DPS (€)
Dividend Yield (%) 1
29Schneider Electric – Investor Relations –Full year 2014 results – 19 February 2015
1 Based on share price as of date of dividend payment, or Feb.16 for 2014 dividend2 Subject to shareholder approval on April 21, 2015
2.8%
1.70 1.8721.87
0
1
2
3
4
5
61.5
1.0
0.5
0.0
20142
1.921.65
2006
1.50
2005
1.13
2013
1.87
2012
1.87
2011
1.70
2010
1.60
2009
1.03
2008
1.73
2007

30Schneider Electric – Investor Relations –Full year 2014 results – 19 February 2015

We achieved most of our Connect targets by the end of 2014
Solutions Adj. EBITA
+1 pt vs 2011
Service growth rate
Outgrew rest of group by average 7 points (on organic basis)
+2 ptsvs 2011
+5 ptsp.a. vs rest of Group
Program target End of 2014 achievement
31Schneider Electric – Investor Relations –Full year 2014 results – 19 February 2015
COGS Productivity
Support function costs
EBITA
€1bn of cumulated productivity
Savings from optimizing R&D, maximizing commercial and back office efficiency
partially fund investments
vs 2011
Inventory efficiency ~2 points reduction of inventory to revenues ratio
€1bn to €1.1bn
Continued focus on optimizing R&D, maximizing commercial and
back office efficiency
vs 2011
~2 pts reduction 1
vs 2011
1 Excluding Invensys

Full year 2015 Targets
32Schneider Electric – Investor Relations –Full year 2014 results – 19 February 2015
Full year 2015 Targets

2015 targets
The Group expects North America to continue to grow, while Western Europe could show signs of stabilization.
New economies will show a mixed picture: India should accelerate while Russia will face a difficult environment.
China is expected to have a soft start of the year and should gradually improve during the year. Invensys is
expected to continue to contribute to the Group performance. Group performance in Q1 will be impacted by a
high base of comparison notably in China and for Invensys which may result in like-for-like decline in revenues in
the quarter.
33Schneider Electric – Investor Relations –Full year 2014 results – 19 February 2015
the quarter.
In this context, the Group targets for 2015:
> Low single-digit organic growth in revenues
> Adjusted EBITA margin at 14-14.5% assuming no negative FX impact on margin
> An expected significantly positive FX impact, estimated based on current rates at c. €1.5bn on revenues with
no material impact on the adjusted EBITA margin

Appendices
34Schneider Electric – Investor Relations –Full year 2014 results – 19 February 2015
Appendices

Definitions
● EBITA: EBIT before amortization and impairment of purchase accounting intangibles and impairment of goodwill
● Adjusted EBITA: EBITA before restructuring and other operating income and expenses
● EBITDA: EBIT before depreciation, amortization, provisions and before share-based compensation cost
● Adjusted EBITDA: Adjusted EBITA before depreciation, amortization, provisions and before share-based
35Schneider Electric – Investor Relations –Full year 2014 results – 19 February 2015
● Adjusted EBITDA: Adjusted EBITA before depreciation, amortization, provisions and before share-based compensation cost
● Cash conversion: Free cash flow / Net income (Group share)
● Free cash flow: Operating cash flow less change in working capital less net capital expenditures
● ROCE: Return On Capital Employed

Adjusted EBITA grew mainly thanks to volume, positive net pricing, productivity and scope
Analysis of change of adjusted EBITA (in €m)
255356
105-215
3,356 -59
-129
-67
3,463
27
-166
36Schneider Electric – Investor Relations –Full year 2014 results – 19 February 2015
MixVolume2013 restated
SFCProduction, Labor &
Other costs
Productivity2Net Price1
27
2014Currency effectsNet acquisition impact
Other
1 Net Price includes Price -45 and Raw material +72 2 Of which Purchasing: 239, Lean Manufacturing: 63, Rebalancing: 30, Fixed manufacturing costs: 24
• Net price positive• Continued investment in
services, R&D, and geographic coverage
• FX negatively impacted adj. EBITA margin by 40bps• Negative mix driven by the
strong growth of mid-market offers, negative geographical mix notably due to decline in Western Europe and impact of solutions growth in H2

ROCEAfter-tax adjusted EBITA / Average Capital EmployedROCE calculation
2013 2014P&L items Reported Reported
EBITA (1) 3,309 3,155Restructuring costs (2) -176 -202Other operating income & expenses (3) 73 -106= Adjusted EBITA (4) = (1)-(2)-(3) 3,412 3,463x Effective tax rate of the perio (5) 25.0% 22.7%= After-tax Adjusted EBITA (A) = (4) x (1-(5)) 2,559 2,678
37Schneider Electric – Investor Relations –Full year 2014 results – 19 February 2015
2013 2014 2013 2014Balance sheet items Reported reported Avg of 4
quartersAvg of 4 quarters
Shareholders' equity 17,363 20,151 (B) 16,963 19,070Net financial debt 3,331 5,022 (C) 4,532 5,847Adjustment for Associates and Financial assets (at historical value) -326 -600 (D) -408 -476- Electroshield Samara (before 100% consolidation) 0 0 67 0
- Sunten Electric Equipment (40% stake) 65 65 80 65
- Fuji Electric FA Components & Systems (36.8% stake) 84 84 84 84
- NVC Lighting (9.2% stake) 115 115 115 115
- CST Holding 75 0 38
- Other non-current financial investments 62 261 62 175
= Capital Employed 20,368 24,573 (E) = (B)+(C)+(D) 21,088 24,441
= ROCE (A) / (E) 12.1% 11.0%

The Planet & Society barometerOur 2012-2014 detailed sustainability scorecard
The Planet & Society Barometer(objectives for 2014)
Overall score (out of 10)
Start01/2012
-
63%
-
3.00
Target12/2014
8/10
Pla
net
10% CO2 savings on transportation
75% of our product revenue achieved with Green Premium
10% energy consumption savings
Carbon
Products & Solutions
Energy
10%
75%
10%
9.20
15.4%
73.2%
12.8%
Results Q3 2014
9.52
16%
79%
13%
ResultsQ4 2014
38Schneider Electric – Investor Relations –Full year 2014 results – 19 February 2015
Peo
ple
Safety
Engagement
Diversity
Training
Access to energyCommunities
30% reduction in the Medical Incident Rate (MIR)
63% result in our Employee Engagement Index 1
30% women in the talent pool (~ 2,500 people)
1 day of training for each employee every year
30,000 people at the BoP trained in energy management
300 missions achieved with the “Schneider Electric Teachers ” NGO
Profit
Pro
fit
7 pts growth revenue with EcoXperts above Group growth revenue
1 million households at the Base of the Pyramid have access to energy
90% of our recommended suppliers embrace ISO 26000 guidelines
3 major ethical stock market indices choose Schneider Electric
300 sites recognized “Cool sites ”
Green growth
Access to Energy
Suppliers
Governance
Best practices
-
0
0
3
0
7 pts
1,000,000
90%
3
300
-
-
23%
-
0
0
30%
63%
30%
100%
30,000
300
The arrow shows if the indicator has risen, stayed the same or fallen compared to the previous quarter. The colour shows if the indicator is above or below the objective of 8/10. 1: New objective set in January 2014
10.47 pts
1,018,765
42.9%
3
290
62%
61%
28%
63%
50,050
338
10.48 pts
1,095,806
63%
3
355
61%
61%
28%
79%
60,232
460

Q4 revenues details
39Schneider Electric – Investor Relations –Full year 2014 results – 19 February 2015
Q4 revenues details

Analysis of change in Group revenues (€m)
6,954+12.5%
Fx+2.3%Scope
+7.7%
IT+6.5%
Infrastructure+0.3%
IndustryBuildings &
Partner
Organic+2.5%
Organic growth for all businesses in Q4
40Schneider Electric – Investor Relations –Full year 2014 results – 19 February 2015
Q4 2014
+6.5%+0.3%+1.8%Partner+2.7%
Q4 2013
6,181

Fx+3.5%
Scope+3.0%
2,890+9.2%
Organic+2.7%
Analysis of change in Q4 Revenues (€m)
Buildings & Partner grew driven by US while China slowed down
� North America achieved good growth, benefiting from dynamic construction and data center market in the US and some recovery in Mexico.
� Western Europe was slightly up, driven by focused execution in France and Germany.
� Asia-Pacific was flat with mixed trends. China was down
41Schneider Electric – Investor Relations –Full year 2014 results – 19 February 2015
Q4 2014
+2.7%
Q4 2013
2,647� Asia-Pacific was flat with mixed trends. China was down
reflecting continued weakness in construction market, while Australia and India grew.
� Rest of the World was solid, driven by Africa, Middle East and Russia.
41% of Q4 revenues

Scope+46.6%
Fx+2.3%
1,466+50.7%
Industry grew thanks to good performance in OEMs and services
� Industry grew at a slower pace compared to previous quarter, due to the slowdown in China and high base of comparison. Rest of Asia-Pacific was up, driven by South-East Asia, Australia and Japan.
� Western Europe was slightly down due to weak French market, while demand from export-oriented OEMs continued to be active in Germany, Spain and Italy.
Analysis of change in Q4 Revenues (€m)
42Schneider Electric – Investor Relations –Full year 2014 results – 19 February 2015
973
Q4 2014
Organic+1.8%
Q4 2013
in Germany, Spain and Italy.
� North America experienced lower growth compared to last quarter. While U.S. OEM market remained robust, investment in unconventional oil & gas slowed down in the region.
� Rest of the World was strong, benefiting from OEM demand and project execution.
� Services were strong across the board.21%
of Q4 revenues

1,684 Fx-0.6%
1,640-2.6%
Scope-2.3%
Organic+0.3%
Infrastructure was flat as utility market in Wester n Europe stabilized but remained weak
� Performance was mainly penalized by continued weak utility market in Western Europe.
� Asia-Pacific was flat as slowdown in China and South-East Asia was offset by growth in India.
� North America performed well driven by growth in the US in data centers and services.
Analysis of change in Q4 Revenues (€m)
43Schneider Electric – Investor Relations –Full year 2014 results – 19 February 2015
Q4 2014Q4 2013
centers and services.
� Rest of the World was flat as growth in Russia and Middle East was dragged down by decline in South America.
� Services continued to perform strongly in the quarter.
24% of Q4 revenues

958+9.3%
Fx+5.0%Scope
-2.2%Organic+6.5%
IT performed well driven by demand in mature markets
� North America performed well thanks to good growth in products business and mid-sized datacenters investments. Large and extra-large data centers market remained active, benefiting IT and other businesses.
� Western Europe posted good growth, driven by continued IT investments in datacenter systems and service.
� Asia-Pacific was down as China faced a high base of
Analysis of change in Q4 Revenues (€m)
44Schneider Electric – Investor Relations –Full year 2014 results – 19 February 2015
Q4 2014Q4 2013
877 � Asia-Pacific was down as China faced a high base of comparison.
� Rest of World was up driven by growth in the Middle East.
� Services continued to grow well in the quarter.
14% of Q4 revenues

Q4 revenues by geography
Analysis of change in Group revenues (€m)
6,95412.5%
Fx+2.3%Scope
+7.7%
Rest of WorldNorth America
Organic+2.5%
Western Europe
26%
Q4 revenues
45Schneider Electric – Investor Relations –Full year 2014 results – 19 February 2015
Q4 2014
Rest of World+5%
North America+8%Asia-Pacific
-1%Western Europe
-1%
Q4 2013
6,181Europe
AsiaPacific
North America
Rest of the World
26%
28%
26%
20%

Contacts & agendaAnthony Song – Head of Investor Relations
Tel: [email protected]
Alexis Denaud – Senior Investor Relations Manager Tel: +33-1-41-29-51-24
46Schneider Electric – Investor Relations –Full year 2014 results – 19 February 2015
Apr 21, 2015 Q1 2015 Revenues and Annual General Meeting
Conference call and Meeting

Help people make the most of their energy
47Schneider Electric – Investor Relations –Full year 2014 results – 19 February 2015
Help people make the most of their energy