fwec church road tce site final 7-21-2010 version · health consultation foster wheeler energy...
TRANSCRIPT
Health Consultation FOSTER WHEELER ENERGY CORPORATION
CHURCH ROAD TCE SITE
MOUNTAIN TOP LUZERNE COUNTY PENNSYLVANIA
EPA FACILITY ID PAD003031788
Prepared by the Pennsylvania Department of Health
JULY 27 2010
Prepared under a Cooperative Agreement with the US DEPARTMENT OF HEALTH AND HUMAN SERVICES
Agency for Toxic Substances and Disease Registry Division of Health Assessment and Consultation
Atlanta Georgia 30333
Health Consultation A Note of Explanation
A health consultation is a verbal or written response from ATSDR or ATSDRrsquos Cooperative Agreement Partners to a specific request for information about health risks related to a specific site a chemical release or the presence of hazardous material In order to prevent or mitigate exposures a consultation may lead to specific actions such as restricting use of or replacing water supplies intensifying environmental sampling restricting site access or removing the contaminated material
In addition consultations may recommend additional public health actions such as conducting health surveillance activities to evaluate exposure or trends in adverse health outcomes conducting biological indicators of exposure studies to assess exposure and providing health education for health care providers and community members This concludes the health consultation process for this site unless additional information is obtained by ATSDR or ATSDRrsquos Cooperative Agreement Partner which in the Agencyrsquos opinion indicates a need to revise or append the conclusions previously issued
You May Contact ATSDR Toll Free at 1-800-CDC-INFO
or Visit our Home Page at httpwwwatsdrcdcgov
HEALTH CONSULTATION
FOSTER WHEELER ENERGY CORPORATION CHURCH ROAD TCE SITE
MOUNTAIN TOP LUZERNE COUNTY PENNSYLVANIA
EPA FACILITY ID PAD003031788
Prepared By
Pennsylvania Department of Health Division of Environmental Health Epidemiology
Under Cooperative Agreement with the Agency for Toxic Substances and Disease Registry
Table of Contents
Summary 3 Introduction 3
Background and Statement of Issues 7 Background 7 Site Description 8 Site Visit 8
Public Health Involvement 8 Exposure Pathway Analysis 9 ATSDR Comparison Values 10 Sampling Data and Results 13
Residential Well Sampling and Results 13 Surface Water Sampling and Results 13 Indoor Air Sampling and Results 14
Exposure Scenarios and Dose Calculations 15 Public Health Implications 16
Cancer Effects 16 Non-cancer Effects 18
Contaminant Evaluation 18 TCE 19 Vapor Intrusion 20
Cancer Incidence Data Analysis 22 Sources of Data 22 Methods 23
Child Health Considerations 25 Conclusions 26 Recommendations 28 References 30 Certification 32 Authors Technical Advisors 33 Figures 34 Tables 37
2
Summary
Introduction At the request of concerned community members the Pennsylvania Department of Health (PADOH) and the Agency for Toxic Substances and Disease Registry (ATSDR) prepared this Health Consultation (HC) document for the former Foster Wheeler Energy Corporation (FWEC) and Church Road trichloroethylene (TCE) site (collectively called the FWECChurch Road TCE site or lsquothe sitersquo) in Mountain Top Wright Township Pennsylvania Since 2004 PADOH and ATSDR have been reviewing environmental sampling data for the site and providing consultation to the local community the Pennsylvania Department of Environmental Protection (PADEP) and the Environmental Protection Agency (EPA) The purpose of this HC is to determine if exposure to site-related TCE could harm peoplersquos health To that end PADOH and ATSDR reviewed the residential well sampling data surface water sampling data and limited residential indoor airvapor intrusion sampling data In addition PADOH and ATSDR analyzed the cancer incidence data for the Mountain Top area to determine if the rates of cancer that are associated with exposures to TCE are elevated compared to the Commonwealth of Pennsylvania as a whole In April 2009 the site was proposed to the EPA National Priorities List (NPL) In communities where hazardous chemicals exist PADOH and ATSDRrsquos primary goal for the community is to evaluate whether a community is being exposed has been exposed or will be exposed to levels of contaminants that may harm their health as well as to ensure that the community has the best information possible to safeguard their health PADOH worked under a cooperative agreement with ATSDR to complete this Health Consultation document
3
Upon reviewing the available environmental sampling data and cancer Conclusions incidence data PADOH and ATSDR conclude the following for the FWECChurch Road TCE site
Conclusion 1 Exposure to TCE in residential well water is not expected to harm peoplersquos health
Basis for Residential well water samples collected in 2004 showed levels of TCE conclusion above the current Environmental Protection Agencyrsquos (EPA) maximum
contaminant level (MCL) for drinking water However since 2004 the residents have been supplied with alternative drinking water and subsequently hooked up to public water supply with the exception of one residential property and are not a current pathway of exposure Ingestion of residential well water represents a past pathway of exposure but long-term well sampling data are not available Guardian wells installed and monitored by EPA and FWEC are located outside the current area of TCE contamination and do not show that the plume has migrated to other residential areas
Next Steps PADOH and ATSDR will review additional well sampling data if requested and issuing a public health conclusion
Conclusion 2 The levels of TCE detected in surface water samples are not expected to harm peoplersquos health
Basis for TCE was detected in surface water samples collected by EPA above the EPA conclusion MCL for drinking water but PADOH and ATSDR do not anticipate the public
would be using the surface water for drinking purposes The public however could breathe TCE volatilizing from the surface water However given the measured TCE the processes of diffusion volatilization and the likely exposure durations by the public the resulting levels in the ambient air are not expected to be at levels that could harm peoplersquos health
Next Steps PADOH and ATSDR will consider reviewing additional surface water sampling data if requested and issuing a public health conclusion
Conclusion 3 Breathing the TCE levels detected in the residential indoor air samples is not expected to harm peoplersquos health
Basis for EPA and FWEC conducted indoor airvapor intrusion sampling at ten residences conclusion along Church Road The highest detected indoor air level of TCE was 7 microgm3
This TCE level is more than 70 times lower than MRLIntermediate EMEG CV for TCE of 500 microgm3 and more than 1400 times lower than the ATSDR acute
4
Next Steps
Conclusion 4
Basis for conclusion
Next Steps
minimum risk level (MRL) CV for TCE of 10000 microgm3 This residence had a plumbing leak which was later repaired resulting in non-detectable levels of TCE However since the residential vapor intrusion sampling data is very limited and can fluctuate over time due to various conditions additional vapor intrusion sampling is recommended if multiple lines of evidence suggest a vapor intrusion potential is exist at homes along Church Road to determine if VI is occurring and if exposure to any detected VOCs could harm peoplersquos health
PADOH and ATSDR will review additional vapor intrusion sampling and issue a public health conclusion
Based on estimated exposure dose calculations for inhalation dermal and ingestion exposure to TCE at the site is not expected to cause an observable increase in cancers and non-cancer health effects
PADOH and ATSDR calculated an estimated exposure dose based on the residential well sampling data for TCE collected along Church Road The exposure doses using EPArsquos cancer slope factor (CSF) for TCE were used to compute a theoretical excess cancer risk The highest theoretical excess cancer risk (calculated using the highest EPA cancer slope factor and assuming 30 years of exposure) of approximately 572E-04 falls within the range of low increased cancer risk Since the residents do not currently use the groundwater for drinking the theoretical cancer level is likely much lower In addition the estimated exposure dose for both adults and children were below levels documented in the scientific literature to show non-cancerous health effects in laboratory animals
PADOH and ATSDR will review sampling data and issue a public health conclusion
Conclusion 5 Based on a review of the cancer incidence data rates of cancers within the Mountaintop ZIP code were generally not statistically elevated compared to the Commonwealth population as a whole
Basis for PADOH and ATSDR reviewed the Pennsylvania Cancer registry data for the conclusion Mountaintop community for the reporting years 1996 to 2007 for all reportable
cancers The analysis indicated no statistically elevated rates for specific cancers that are thought (based on current scientific literature and sources) to be potentially associated with TCE exposure (eg hepatic or liver cancer renal or kidney cancer) Overall the rates of all reportable cancers for the community were less than the expected rates based on Commonwealth population as a whole The analysis did indicate that the rates for one specific cancer types (Thyroid cancer in females only) were statistically elevated for the Mountaintop ZIP code when compared to the Commonwealth population as a whole However this cancer is not thought or known based on current scientific
5
Next Steps
literature and sources to be potentially associated with TCE exposure or toxicity
PADOH and ATSDR will consider updating the cancer incidence data with additional reporting years in the future and issuing a public health comment
For More If you have concerns about your health you should contact your health care provider For questions or concerns about the Foster Wheeler Energy Information CorporationChurch Road TCE site please contact the Pennsylvania Department of Health Division of Environmental Health Epidemiology at (717) 346-3285
6
Background and Statement of Issues
Background
TCE contamination was first discovered at the former Foster Wheeler Energy Corporation (FWEC) located in Mountaintop in 1985 as a result of a real estate transaction In 1988 FWEC entered into a consent order with EPA and PADEP requiring additional site investigation activities and implementation of remedial measures Since 1993 FWEC has implemented remedial measures consisting of a groundwater treatment system On-site groundwater samples are collected on an annual basis from groundwater monitoring wells on the former FWEC property TCE levels have decreased from a high of 180000 microgL prior to the installation of the groundwater treatment system to an on-site maximum concentration of 17000 microgL in 2008 [1]
In 1986 residential well sampling data collected from seven residential wells located along Church Road by the Pennsylvania Department of Environmental Resources (now called the Pennsylvania Department of Environmental Protection) did not detect volatile organic compounds (VOCs) including TCE above the EPA maximum contaminant level (MCL) A 2004 groundwater sampling event however detected TCE in 14 residential wells along Church Road exceeding the EPA MCL for TCE of 5 microgL Community members and elected officials have expressed their concerns that exposure to TCE in the Mountaintop community could cause adverse health effects [6]
Based on the 2004 TCE residential well results EPA and FWEC offered affected residents alternative water supplies (ie bottled water and installation of whole house carbon filter in the residences) to mitigate human exposure to VOCs in groundwater In November 2004 to ensure the carbon filters were properly removing TCE FWEC and EPA collected tap samples from 34 homes The results indicated that the filters were effective in removing TCE [8] In August 2005 Foster Wheeler and EPA entered into an Administrative Settlement Agreement and Order on Consent requiring Foster Wheeler to connect 36 impacted residents to a public water line to eliminate ingestion exposure to TCE All residents except one were connected to the public water line in July 2007 and the impacted wells were later disconnected and abandoned [1] One resident who refused to agree to be connected to the public water line and continues to utilize a carbon filtration system for drinking water [8]
In April 2009 The FWEC siteChurch Road TCE site (collectively called the site) was proposed to the EPA National Priorities List (NPL) [2] The NPL is a national list of sites where hazardous substances could impact human health andor the environment Listing the site on the NPL assists with determining the magnitude and extent of the groundwater contamination and ensures long-term monitoring of the site NPL sites first undergo a thorough investigation to determine the full nature and extent of contamination Next EPA or the parties responsible for the contamination then address the potential risks the sites might pose to human health and the environment Once a site has been proposed for the NPL there is a 60-day comment period with a final decision on the site made after EPA evaluates and responds to all the public comments in writing [3]
In 2010 the EPA began a remedial investigation and feasibility study (RIFS) for the site which consists of groundwater monitoring well installation and sampling regional and local geological evaluations soil sampling vapor intrusion testing and pilot-scale testing of remedial technologies Residential vapor intrusion sampling should be completed in 2011 and depending on the sampling
7
results the RIFS should be finished between 2012 and 2013 In addition a baseline risk assessment will also be developed to identify the existing or potential risks to human health and the environment at the site
Site Description
The Foster Wheeler Energy CorporationChurch Road TCE Site consists of the former Foster Wheeler facility and the Church Road TCE site located in Mountain Top Wright Township Luzerne County Pennsylvania (Figure 1) FWEC site is a 105 acre site located in the Crestwood Industrial Park and is surrounded by residences and business (Figure 2) This facility was active from 1953 until 1984 and manufactured large pressure vessels utilizing Trichloroethylene (TCE) as a degreaser and machine parts oil remover The facility has been inactive since 1984 The Church Road TCE site has residential homes located approximately 1 mile south of the former Foster Wheeler facility and is referred to as the Affected Area The Affected Area of homes extends from east to west along Church Road and Watering Run encompassing approximately 295 acres [1] There are 29 residential wells near the site that are contaminated with TCE above EPAs Safe Drinking Water MCL There are an additional 7 wells that contain TCE but are not above the EPA MCL [6]
Site Visit
In January 2010 the PADOH Health Assessment Program (HAP) personnel met with the PADEP Northeast Regional Office to discuss site background information environmental sampling and community concerns In addition a site visit of the former facility and tour of the surrounding community was conducted
Public Health Involvement Since September 2004 ATSDR and PADOH have been collaborating with PADEP and EPA to evaluate environmental sampling data and community concerns related to the FWECChurch Road TCE site [4] PADOH and ATSDR has reviewed evaluated and provided comment on residential sampling data collected by PADEP EPA and FWEC The following is a summary of ATSDR and PADOH involvement with the site
1 October 2004 ndash ATSDR Region 3 evaluated groundwater sample data from 14 residential wells in Mountaintop and found that the TCE levels found in the samples exceeded the MCL of 5 microgL The sample levels ranged from 76 to 160 microgL ATSDR concurred with EPA that alternate water supplies are necessary to mitigate human exposures to contaminated groundwater at this site In addition ATSDR recommended that the residents limit the length of showers and baths to less than five minutes until whole-house treatment units are installed and evaluated for effectiveness ATSDR recommended that EPA conduct a well survey in the area to determine if any other wells were contaminated with TCE
2 June 2005 - ATSDR Region 3 evaluated one surface water sample from a spring on a residential property The reported TCE level in the surface water was 26 microgL which is between 1000 and 10000 times below levels shown to cause health effects via ingestion ATSDR concluded that exposure to the reported level posed no apparent public health hazard
8
3 May 2006 ndash ATSDR Region 3 evaluated indoor air sampling data results collected from a residence and found that the reported TCE levels (13 ppb or 7 microgm3) were more than 1000 times below levels shown to cause adverse effects in animals (either cancerous or nonshycancerous) and approximately 100 times below the levels that are estimated to cause harm in humans via inhalation The minimum risk level (MRL) for acute exposure to TCE is 2000 ppb (10000 microgm3) and for intermediate exposure is 100 ppb (500 microgm3) ATSDR concluded that exposure to the reported level posed no apparent public health hazard [4]
4 August 2008 ndash PADOH prepared a technical assist (TA) document and factsheet (FS) for the site The TA and FS documents included (1) A review of residential sampling data and previous health assessment activities (2) A review of cancer incidence data for the Mountaintop community for all reportable cancer from 1996 to 2005 and (3) A review of general health information of the community collected by an area citizen The cancer incidence analysis did not detect statistically elevated rates of cancer know to be potentially associated with TCE exposure The community-collected health information listed a tally of certain diseases (cancer liver damage heath disease and autoimmune disease) however this data could not be quantitatively evaluated nor correlated to exposure and disease because the information provided lacked sufficient detail Such details include specific time frames location of resident distance of residence from site possible exposure pathway environmental sampling or exposure levels length of time residing at residence past occupational exposures heredity and medical history and residence at time of diagnosis [4]
Exposure Pathway Analysis An exposure pathway is how a person comes in contact with contaminants originating from a site A completed pathway requires that all five elements be present 1) a source of contamination 2) an environmental medium that transports contaminants 3) a point of exposure 4) a route of human exposure and 5) a receptor population PADOH and ATSDR consider the air pathway to be a completed pathway as described in the table below The presence of a completed exposure pathway does not however necessarily mean that adverse health effects will occur or have occurred in the past as a result of such exposure
Currently because the groundwater for drinking and showering has been essentially eliminated via filterspublic water the primary current exposure pathway of concern for residents is inhalation of TCE via vapor intrusion from contaminated groundwater (see the Exposure Pathway tables on the following) The public could also be exposed to TCE volatilizing from surface water However given the processes of diffusion and volatilization the resulting levels of TCE in ambient air would be low The likely exposure duration by the public from surface water is expected to be limited therefore this is not the pathway of greatest concern at the site
9
Current Exposure Pathways
Source of Contamination
Transport via Environmental
Medium
Point of Exposure
Route of Exposure
Receptor Population
FWECChurch Road TCE site
Contaminated groundwater via vapor intrusion
Ambient indoor air
Inhalation or breathing
Residents with impacted water near Church Rd
FWECChurch Road TCE site
Surface water Ambient outdoor air
Inhalation or breathing
Residents with impacted water near Church Rd
In addition ingestion of residential well water represents a past exposure pathway for residents The residents along Church Road have been hooked up to public water supply with the exception of one residential property Based on the 2004 TCE residential well sampling results affected residents were provided alternative water (ie bottle water and installed carbon filter in the residences) and residents (except one) were later connected to the public water supply Therefore ingestion of residential drinking water is not a current exposure pathway for the site but represents a past exposure for most residents In 2004 ATSDR recommended the affected resident limit showers and baths to 5 minutes to reduce any potential inhalation exposures from TCE
Past Exposure Pathways
Source of Contamination
Transport via Environmental
Medium
Point of Exposure
Route of Exposure
Receptor Population
FWECChurch Road TCE site
Contaminated groundwater with volatilization during household use
Ambient indoor air
Inhalation or breathing
Residents with impacted water near Church Rd
FWECChurch Road TCE site
Ingestion via contaminated groundwater
Residential drinking water
Drinking or ingestion
Residents with impacted water near Church Rd
ATSDR Comparison Values
To evaluate whether the public might be exposed to contaminant concentrations that could cause adverse health effects PADOH and ATSDR evaluated the sampling data against ATSDR Comparison Values (CVs) ATSDR has developed CVs to determine the likelihood of possible health effects from exposure to site-specific contaminants [10] CVs are health guidelines or environmental guidelines set well below levels that are known or anticipated to result in adverse health effects ATSDR developed
10
these values to help make consistent decisions about what substance concentrations or dose levels associated with site exposures might require further assessment and evaluation CVs are not thresholds of toxicity and cannot be used to predict adverse health effects Although concentrations at or below the relevant CV may reasonably be considered safe it does not automatically follow that any environmental concentration that exceeds a comparison value would be expected to produce adverse health effects In general CVs are derived for substances for which adequate toxicity data exist based on route of exposure CVs are typically available for three specified exposure periods acute (14 days or less) intermediate (15 to 364 days) and chronic (365 days or more) [10]
How Are ATSDR Comparison Values Used
Comparison values are doses (health guidelines) or substance concentrations (environmental guidelines) set well below levels that are known or anticipated to result in adverse health effects ATSDR and other government agencies have developed these values to help assess substance concentrations or dose levels associated with site exposures that might require a closer look Comparison values are derived for substances for which adequate toxicity data exist for the exposure route of interest if available However comparison values are not thresholds of toxicity and are not used to predict adverse health effects These values serve only as guidelines to provide an initial screen of human exposure to substances Although concentrations at or below the relevant comparison value may reasonably be considered safe it does not automatically follow that any environmental concentration that exceeds a comparison value would be expected to produce adverse health effects
PADOH and ATSDR compared the sampling data to the available CVs and these are described in detail in the table on the following page For cancerous effects ATSDR has established Cancer Risk Guides (CREGs) For non-cancerous effects ATSDR utilizes several CVrsquos including Environmental Media Evaluation Guide (EMEG) Minimum Risk Level (MRL) and Reference Dose Media Evaluation Guides (RMEGs) [10]
11
Type of CV Description
Environmental Media Evaluation Guides (EMEGs)
EMEGs are estimated contaminant concentrations that are not expected to result in adverse noncarcinogenic health effects based on ATSDR evaluation EMEGs are based on ATSDR MRLs and conservative assumptions about exposure such as intake rate exposure frequency and duration and body weight
Cancer Risk Guides (CREGs)
CREGS are estimated contaminant concentrations that would be expected to cause no more than one excess cancer in a million (10-6) persons exposed during their lifetime (70 years) ATSDRs CREGs are calculated from EPAs cancer slope factors (CSFs) for oral exposures or unit risk values for inhalation exposures These values are based on EPA evaluations and assumptions about hypothetical cancer risks at low levels of exposure
Reference Dose Media Evaluation Guides (RMEGs)
RMEGs are values derived from EPAs oral reference doses which are developed based on EPA evaluations RMEGs represent the concentration in water or soil at which daily human exposure is unlikely to result in adverse noncarcinogenic effects
Minimal Risk Levels (MRLs)
MRL is an estimate of daily human exposure to a substance that is likely to be without noncarcinogenic health effects during a specified duration of exposure based on ATSDR evaluations MRLs are set well below toxic effect levels in order to provide an added measure of safety
TCE is considered to be the contaminant of greatest concern at the site However ATSDR does not currently have a CREG value for inhalation exposure or a CV for ingestion exposure Other ATSDR CVs including intermediate EMEG CVMRL for inhalation exposure as well as EPA and California EPA screening levels were used for comparison of the environmental sampling data PADOH and ATSDR summarized the available CVs in the table below
ATSDR Comparison Values and EPA Reference Values used for evaluating TCE exposure at the FWECChurch Road TCE site
Route of Exposure Source Type Level
IngestionDrinking
EPA MCL 5 microgL
InhalationAir ATSDR Intermediate EMEG CV and MRL 500 microgm3
ATSDR Acute MRL 10000 microgm3
EPA RfC (proposed) 40 microgm3
CalEPA Chronic REL 600 microgm3
12
Sampling Data and Results
Residential Well Sampling and Results
In 2004 EPA and FWEC sampled residential well water for volatile organic compounds (VOCs) semi-volatile organic compounds (SVOCs) and metals TCE was discovered in 15 residential wells along Church Road above the EPA MCL and PADEP Act 2 Medium Specific Concentrations (MSC) of 5 microgL with an average level of 59 microgL In the 2004 and subsequent additional sampling events by FWEC and EPA the TCE levels in the residential wells ranged from non-detect to 270 microgL (Table 1) The concentrations of TCE vary from east to west along Church Road with concentrations in the east east ranging from non-detect to approximately 76 microgL wells in the center of the Affected Area from approximately 100 microgL to 270 microgL and wells in the western portion of the Affected Area from non-detect to 30 microgL A background well sample was collected approximately 2 miles north to northeast and up-gradient of the FWEC Sampling results of the background well sample showed a TCE level of 1 microgL [16] In total there are 29 residential wells near the site that are contaminated with TCE above EPAs Safe Drinking Water Act maximum contaminant level (MCL) There are an additional seven wells that contain TCE but are not above the EPA MCL [6]
Other VOCs were detected in the residential well samples including bromodichloromethane bromoform carbon tetrachloride chloroform dibromochloromethane 12-dichloroethane 12shydichloropropane dichlorodifluoromethane methylene chloride tetrachlorothene and trichlorofluoromethane (Table 2) Methylene chloride (maximum concentration of 41 microgL) and 12shydichloropropane (maximum concentration of 59 microgL) were the only other VOCs detected above EPA MCLs and PADEP Act 2 medium specific concentration (MSC) of 5 microgL for each compound Some of the VOCs (bromodichloromethane bromoform carbon tetrachloride and 12-dichloroethane) were above their respective ATSDR CREG CV Arsenic was the only metal detected above the ATSDR CV (Table 2) The maximum arsenic level of 10 microgL exceeded the ATSDR CREG of 002 microgL However the residents are not currently utilizing the well water for drinking as described further in the Background Section Residential groundwater and exposure via ingestion to VOCs SVOCs and metals is not a current pathway of exposure and thus is not a current public health concern [16]
Guardian Wells Sampling and Results
EPA and FWEC have selected six private residential well locations outside the current affected area to serve as guardian wells that ensure the plume has not migrated to other residential wells [7] Since October 2004 EPA and FWEC have conducted quarterly monitoring of the guardian wells TCE levels in the guardian wells have been below the corresponding laboratory method detection limits at the time of the laboratory analysis (ie 018 microgL 04 microgL and 10 microgL) [9] Based on this data it does not appear the TCE contamination plume has migrated beyond the currently known affected areas and homes EPA and FWEC will continue to monitor the guardian wells to detect and identify if the TCE plume migrates
Surface Water Sampling and Results
During 2004 and 2005 EPA collected surface water samples in the affected residential areas and in the Watering Run Watershed for VOCs TCE was detected in 20 of the 65 surface water samples collected ranging from non-detect to 87 microgL In November 2007 and March 2008 EPA collected surface water
13
samples at 11 locations for VOCs (table 3) During both sampling events the maximum TCE concentration in the surface water samples was 160 microgL [17] Generally the highest levels of contamination correspond with highest well sample results It is unlikely that the general public would utilize surface water for drinking It is possible people could be directly exposed to the surface water and could breathe TCE volatilizing or evaporating from the surface water However given the processes of diffusion volatilization and the likely limited exposure frequency by residents the resulting levels of TCE in the ambient air would be very low Exposure to the reported levels of TCE in the surface water is not expected to cause adverse health effects in children or adults In addition since TCE has a low tendency to bioaccumulation (or build up) in fish ingestion of fish in surface water is not a likely exposure pathway for the site PADOH and ATSDR are not aware of people swimming in the streams PADOH and ATSDR will evaluate results of additional environmental sampling ifwhen they become available to verify the validity of the above conclusions [12]
Indoor Air Sampling and Results
In addition to residential well contamination there is also the potential for VOCs vapors from the contaminated groundwater to enter the overlying residents in a process called vapor intrusion (VI) Additional details on the VI pathway are discussed in the Contaminant Evaluation Section Since November 2004 EPA has collected soil gas samples at nine (9) homes TCE vapors were detected at trace concentrations at two (2) residences and at a higher concentration at a third (13 ppb or 7 microgm3) in an unfinished basement of the home The higher vapor concentration in the third home was determined to be attributable to a plumbing leak which was later repaired TCE contaminated groundwater was also found in a residentrsquos sump pump water in the basement An investigation led by EPA determined that TCE-contaminated groundwater was getting into the basementrsquos sump pump due to a cracked waterline The waterline was repaired to mitigate the release of impacted groundwater into the basement All other homes sampled were non-detect for TCE vapors [8]
In 2006 EPA and FWEC collected indoor air sampling which was performed to confirm that the repairs at the residence stopped the TCE contaminated groundwater from getting into the basement and to confirm that the residents are not being exposed to TCE at levels of concern at this residence EPA collected 24-hour indoor air samples (SUMMA canisters) from four locations (two from the unfinished basement one from the finished basement and one in the first floor dining room) at a single residence and in December 2006 FWEC collected seven indoor air samples at the same residence (Table 4) The highest level of TCE detected was 18 microgm3 In addition to TCE the air samples were analyzed for several VOCs including acetone benzene carbon disulfide dichlorodifluoromethane ethylbenzene4-ethyltoluene 2-butanone styrene toluene trichlorofluoromethane 124shytrimethylbenzene and xylenes The levels of VOCs did not exceed ATSDRrsquos available CV levels
During the residential air sampling event the highest detected TCE level was 7 microgm3 This TCE level is more than 70 times lower than MRLIntermediate EMEG CV for TCE of 500 microgm3 and more than 1400 times lower than the ATSDR acute MRL CV for TCE of 10000 microgm3 In addition indoor TCE levels are well below the proposed EPA RfC value of 40 microgm3 and CalEPA Chronic REL value of 600 microgm3 The maximum reported levels of the above mentioned other VOCs did not exceed their respective chronic EMEGMRL values Exposure to reported levels of TCE and other VOCs in indoor air at this site is not expected to cause adverse health effects in children or adults [12 14]
14
The movement of VOCs from subsurface (soil andor groundwater) into an enclosed structure can vary by season Factors that can influence such VOC migration include temperature barometric pressure and precipitation Because of these and other variables VOC concentrations in samples collected during a single sampling event may not accurately represent year-round conditions [14] Therefore PADOH and ATSDR recommend that additional indoor air samples in both the basement and first floor of the homes along Church Road at varying seasons be collected to better determine the potential exposure levels It is the understanding of PADOH and ATSDR that EPA and FWEC are planning to collect additional indoor air samples during the RIFS Additional information on the indoor air and the vapor intrusion pathway are discussed in the Contaminant Evaluation Section below
Exposure Scenarios and Dose Calculations Estimating an exposure dose requires identifying how much how often and how long a person may come in contact with some chemical in a specific medium (air water soil) PADOH and ATSDR calculated estimated exposure doses for the site The equation used to estimate exposure doses from ingestion of TCE in water is below
Equation 1 Exposure Dose Equation for Ingestion
D = C times IR times EF times CF BW
Where D = exposure dose (mgkgday) C = chemical concentration (μgL) IR = intake rate in liters per day (Lday) EF = exposure factor (unitless = 2) CF = conversion factor 1times10
-3
(mgμg) and BW = body weight in kilograms (kg)
Doses from ingestion inhalation and dermal contact with TCE at residential locations for both adults and children for past exposures are shown in Table 5 below The doses are presented in units of milligrams of TCE per kilogram of body weight (mgkgday) based on the average TCE concentration (584 microgL) during the 2004 residential well sampling data The exposure dose calculations assume that exposure occurred in a residential setting that exposure was continuous (24 hours per day 365 days per year) and all water consumed was from affected wells Exposures are assumed to have occurred over a 30 year timeframe Adult doses are estimated assuming a person drinks 2 liters of water per day (from the household source) and weighs 70 kg (154 pounds) Doses for children assume 1 liter per day and a weight of 16 kg (35 pounds) In addition to the oral dose from affected drinking water a person may also absorb TCE directly from contaminated water through the skin (dermal dose) and breathe the compound in the air (inhalation dose) These secondary exposures to the TCE in drinking water essentially represent a doubling of the ingestion dose (or an exposure factor of 2)
Table 5 ndash Past exposure past dose for ingestion inhalation and dermal contact to TCE
Body Weight (kg)
Ingestion Rate (Lday)
Exposure Factor
Average TCE (microgL)
Exposure Duration
Dose (mgkgday)
Adult 70 2 2 584 30 years 00033
Child 16 1 2 584 30 years 00073
15
Public Health Implications
Cancer Effects
There are several reports of an increased occurrence of cancer from ingestion and inhalation of TCE by animals and humans [12] Human health studies suggest an increased incidence of cancer of various types (eg bladder lymphoma kidney respiratory tract cervix skin liver and stomach) from exposure to TCE however no studies provide clear unequivocal evidence that exposure is linked to increased cancer risk in humans[12] The available studies suffer from inadequate characterization of exposure small numbers of subjects and the fact that subjects were likely exposed to other potentially carcinogenic chemicals There is however sufficient evidence that TCE exposure results in cancer development in animals although animal studies may not be relevant for evaluating health hazard to humans [12]
In 1989 EPA withdrew its cancer assessment for TCE which was based primarily on animal studies because more recent pharmacokinetic and mechanistic data for TCE became available [22] An updated approach to TCE cancer assessment using existing animal data and state-of-the-science papers has been proposed [22] This approach which is supported by high-dose animal studies does not appear entirely relevant for evaluating the health hazard of low-dose human environmental exposures for several reasons First cancer in animals appears to result from species-specific mechanisms that are not entirely relevant to humans [12] Second the animals used in these studies were exposed to very high doses of TCE compared to those at the FWECChurch Rd TCE and the overall death rate in the animal studies was high The surviving animals were not likely to have been in good health and therefore would have been more susceptible to adverse effects from TCE exposure (like infections and illnesses) than healthy animals Third the overall findings from animal studies are inconsistent some studies report an increased incidence of cancer while an equal number do not report an increase at similar levels of exposure Fourth the studies used pure TCE and did not evaluate the effect of exposure to stabilizers and impurities in TCE these things may also be carcinogenic [12]
Based on the exposure doses calculated presented in the previous section PADOH and ATSDR computed a theoretical excess cancer risk based on EPArsquos cancer slope factor (CSF) A CSF is an estimate of possible increases in cancer cases in a population A CSF is expressed in dose units [(mgkgday)-1] to allow for comparison with calculated oral doses Only adult doses are used to estimate cancer risk because the risks are based on lifetime exposures Child exposures and intakes occur over a small portion of the assumed lifetime It should be noted that the theoretical cancer risk does not predict if an exposed person will get cancer [9] Again because the user of a TCE contaminated water supply would also have exposure through inhalation as TCE volatilizes into the air inhalation exposure must be included as part of the exposure Most of this inhalation exposure takes place during and after showering as time spent in the bathroom To consider both pathways of exposure and their additive effect we double the (x 2) ingestion For potential carcinogenic health effects (from past exposure) the doses are multiplied by the contaminant-specific cancer slope factor (Table 6) to determine the theoretical excess cancer risk
Equation 2 Estimation of Theoretical Excess Cancer Risk
CR = D x CSF x EY70 years
ndash1
Where CR= Theoretical cancer risk D= dose (mgkgday) CSF = Cancer Slope Factor (mgkgday) and EY=
Exposure years (30 years)
16
The theoretical excess cancer risks in Table 6 below represents the expected increase in cancer risk due to (past) exposure to TCE Note that the TCE cancer risks in Table 6 include estimated excess risk calculated with two different cancer slope factors a lower bound value (04 (mgkgday)-1) or more conservative and an upper bound (002 (mgkgday)-1) or less conservative value The EPA TCE Health Risk Assessment has identified several cancer slope factors with most between 2x10⁻² and 4x10⁻¹ per mgkg-d [21] As there is no scientific consensus on a specific CSF the EPA recommends using a range of CSFs and presenting a range of estimated excess cancer risks Consequently the highest estimated excess cancer risks due to 30 years of TCE exposure range from about 572E-04 or 572 excess cancers in 10000 exposed to about 780E-05 or 78 excess cancers in 100000 exposed
Table 6 ndash Excess theoretical cancer risk calculations for ingestion inhalation and dermal exposure
Cancer Slope Factor (mgkgday)-1
Adult Dose (mgkgday)
Theoretical Excess Cancer Risk
04 (Lower bound) 00033 572E-04
002 (Upper bound) 00033 780E-05
The theoretical cancer risk can never be zero (ie any exposure to a carcinogen could potentially have some cancer risk) so exposures are described in terms such as low moderate or high risks For example exposures that could cause one additional case of cancer in a population of one million are considered to have a slight cancer risk while exposures that could cause one additional case in 10000 have a low cancer risk All of the uncertainties and conservative exposure assumptions associated with the dose calculations are included in the risk estimation as well as the uncertainty in deriving the cancer slope factor [21] The risk estimates in Table 7 cannot be interpreted as evidence that any of the ldquositerdquo receptors will develop cancer as a result of TCE exposure The highest theoretical excess cancer risk (calculated using the highest cancer slope factor and assuming 30 years of exposure) of approximately 572E-04 risk fall within the range of low increased risk as presented in the table of risk category definitions on the following page [22] These low risk estimates indicate that TCE exposure in the Affected Area currently is not likely to cause an observable increase in cancers In addition since the residents do not currently use the groundwater for drinking the theoretical cancer level is likely much lower
Risk Category Definitions
Category Theoretical Excess Cancer Risk
No Increased Risk lt1E-05
No Apparent Increased Risk 100E-06
Low Increased Risk 100E-04 Moderate Increased Risk 100E-03
High Increased Risk 100E-02
Very High Increased Risk gt1E-02
17
Non-cancer Effects
ATSDR has derived a health guideline of 02 mgkgday for ingestion of TCE based on an acute-duration (less than 14 days) study showing developmental and behavioral changes in mouse pups administered 50 mgkgday of TCE In this study the TCE was dissolved in oil and administered by stomach tube [22] The findings of this study are not entirely relevant for evaluating health hazard for Area B site neighbors exposed to TCE in well water for several reasons First gavage doses in the animal study were administered as one large dose per day while residents in Affected area were likely to have been exposed to TCE in drinking water several times a day The body handles a single large dose much differently than it does a series of small estimated TCE doses as described in the previous section Second the total dose entering the body is higher and maintained for a longer time when TCE is dissolved in oil than when it is dissolved in water Lastly exposure to TCE in the animal study lasted less than 14 days while maximum exposures at the site may have occurred over a period of many years For ingestion EPA has set a maximum contaminant level (MCL) of 5microgL in drinking water The World Health Organization (WHO) recommended drinking water limit for TCE is 30 microgL [14] Although residential well sampling data did exceed the current EPA MCL consumption of residential well water is not a current pathway of exposure Despite these limitations the estimated exposure doses in the Affected area from past exposure to well water (000333 mgkgday for adults and 00073 for children mgkgday) are much lower than doses documented in the literature for adverse non-cancerous health effects and in the above referenced ATSDR health guideline
For non-cancerous health effects from inhalation PADOH and ATSDR compared the air sampling data to the ATSDR MRL EPA Inhalation reference concentrations (RfCs) and California EPA (CalEPA) reference exposure level (REL) for TCE The EPA RfC of 40 microgm3 is based on the critical effects in the central nervous system liver and secretion system and is the concentration in air below which non-cancerous harmful effects are unlikely over a lifetime exposure (ie 70 years) The REL is a concentration at or below which adverse health effects are not likely to occur [15] The highest TCE level observed in the residential vapor intrusion was 7 microgm3 in the residence with a broken sewer pipe and 18 microgm3 the next highest concentration Therefore based on the limited vapor intrusion air sampling at this time PADOH and ATSDR do not expect these levels to harm peoplersquos health Additional sampling data will better delineate exposure levels and the potential for adverse health effects associated with vapor intrusion of TCE
Contaminant Evaluation This section provides more information on the chemicals detected during the sampling events The majority of information summarized below including context for how the levels for the various CVs were developed has been extracted from ATDSRrsquos chemical-specific Toxicological Profile for TCE For more information about each chemical please refer to these online profiles at httpwwwatsdrcdcgovtoxprofilestp19html
As explained in the above sections based on the sampling data evaluated by PADOH and ATSDR exposure to the levels of TCE in indoor air groundwater and surface water would not be expected to cause adverse health effects That being said the adverse health effects documented in the toxicological literature and summarized here are based on much higher levels than were observed in communities along Church Road and are usually based on occupational exposures in humans or laboratory animal studies Some studies with mice and rats have suggested that high levels of TCE may cause liver kidney or lung cancer Some studies of people exposed over long periods to high
18
levels of trichloroethylene in drinking water or in workplace air have found evidence of increased cancer Although there are some concerns about the studies of people who were exposed to TCE some of the effects found in people were similar to effects in animals
An overview of the vapor intrusion pathwayindoor air and the potential health effects associated with inhalation of TCE is discussed Although the levels of TCE in indoor air are not at levels that would result in health effects the vapor intrusion sampling events are very limited and additional samples from indoor air and sub-slab soil would better delineate the TCE levels and the potential residential exposures Lastly it is important to note that simply being exposed to a hazardous substance does not make it a hazard The magnitude frequency timing and duration of exposure and the toxicity characteristics of individual substances affect the degree of hazard if any
TCE
Trichloroethylene (TCE) is a nonflammable colorless liquid at room temperature with a somewhat sweet odor and a sweet burning taste TCE is mainly used as a solvent to remove grease from metal parts to make other chemicals and can be found in some household products including wood stains typewriter correction fluid varnishes lubricants paint removers adhesives and cleaners TCE can also be found in industrial settings in homes undergoing renovations and in homes using private wells located near TCE disposal or contamination sites in which TCE vapors seep through basement structures and cracks [10] TCE was once used as an anesthetic for surgery [12]
TCE has been found in ambient air surface water and groundwater TCE is heavier than water and therefore is likely to move downward through the subsurface into groundwater and can persist in groundwater due to high solubility Biodegradation of TCE under anaerobic conditions is slow making TCE relatively persistent in subsurface waters In settings where groundwater charges surface water contaminated groundwater can lead to contaminated surface water and sediment TCE can volatilize from water at a rate that depends on temperature water movement and aeration When released into the air TCE may be moderately degraded through reaction with photochemically-produced hydroxyl radicals to then form phosgene dichloroacetyl chloride and formyl chloride The half-life of TCE in air is approximately 7 days
An EPA Groundwater Supply Survey of 945 drinking water systems nationwide using groundwater sources found TCE in 91 water systems or 10 with a median level of approximately 1 μgL [12] TCE has been detected in outdoor air at concentrations of 016 microgm3 in ruralremote areas 248 microgm3
in urbansuburban areas and 647microgm3 in areas near industrial emission sources of TCE [12] In addition a survey of indoor air showed median concentrations of TCE as high as 27 microgm3 in a North Carolina office building 074 microgm3in a Washington DC school and 082 microgm3 in a Washington DC home for the elderly [12]
Exposure to TCE is associated with a number of potential health effects including neurotoxicity immunotoxicity developmental liver kidney and endocrine effects In experimental rodent studies high doses of TCE administered to mice resulted in tumors of the lungs liver and testes The effects reported at high levels include liver and kidney damage and changes in heart beat The levels at which these effects occur in humans are not well characterized Animals that were exposed to moderate levels of TCE had enlarged livers and high-level exposure caused liver and kidney damage [12] Based on the limited data in humans regarding TCE exposure and cancer and evidence that high doses of TCE can cause cancer in animals the International Agency for Research on Cancer (IARC)
19
and the WHO have determined that TCE is probably carcinogenic to humans Many studies reviewed by the IARC examined the relationship between TCE exposure and kidney and liver cancer mortality or incidence [11] The EPA Integrated Risk Information System (IRIS) is currently producing an assessment of TCE and will include analysis of noncancerous and cancer effects IRIS is a human health assessment program that evaluates quantitative and qualitative risk information on effects that may result from exposure to environmental contaminants [17]
Vapor Intrusion
Vapor intrusion (VI) a rapidly developing field of science and policy is the migration of volatile organic compounds (VOCs) from the subsurface into overlying buildings through the basement foundation and cracks (see the figure below) VOCs in buried wastes andor contaminated groundwater can emit vapors that may migrate through subsurface soil and into air spaces of overlying building or homes through volatilization and move to other levels and areas of the home Inhalation exposures are not limited to buildings with basements but can also occur for slab-on-grade and suspended floor (or crawl-space) designs as well In most cases chemical concentrations of VOCs are low or depending on site-specific conditions vapors may not be present at detectable concentrations VI of TCE can be a public health concern because TCE is readily absorbed by the lungs [13] It is important to note that exposure to VOCs due to vapor intrusion does not necessarily mean that adverse health effects will occur Whether or not a person experiences health effects depends on several factors including the length of exposure (short-term or acute versus long-term or chronic) the amount of exposure (ie dose) the frequency of exposure the toxicity of the chemical and the individuals sensitivity to the chemical [14]
Overview of Vapor Intrusion Pathway
20
A complicating factor in evaluating the potential risk from vapor intrusion is the potential presence of some of the same chemicals at or above background concentrations In addition to contaminated groundwater indoor air can be contaminated with VOCs due to the wide use in household chemicals and other products such as cigarette smoke paint wood stoves scented candles floor wax perfumes pesticides off-gassing from new furniture and automotive exhaust from an attached garage Similarly VOCs can be in the outdoor air that enters a home or place of business from certain commercial and industrial facilities such as gasoline stations and dry cleaners Vehicle exhaust is another example of VOCs in outdoor air Indoor and outdoor sources of VOCs can make evaluating VI migration complicated [14]
Soil vapor also referred to as soil gas is the air found in the pore spaces between soil particles Soil vapor containing VOCs can enter a building through cracks or perforations in slabs or basement floors and walls Underground conduits such as sewer lines and utility pipes fractures in bedrock or cracks in the basement slab can serve as preferential pathways for vapor migration into the home In addition heating ventilation or air-conditioning (HVAC) systems andor the operation of large mechanical appliances (eg exhaust fans dryers etc) may create a negative pressure that can draw soil vapor into the building Predicting the extent of soil vapor contamination from soil or groundwater contamination as well as the potential for human exposure from soil vapor intrusion into buildings is complicated by factors that can affect soil vapor migration and intrusion For example soil vapor contaminant plumes may not mimic groundwater contaminant plumes since different factors affect the migration pattern of each medium [18]
Indoor air sampling provides the most direct estimate of potential inhalation exposures to residents [14] However indoor air sampling data are subject to vast variation due to seasonal variations changes in the HVAC contaminant biodegradation processes contaminant migration and the presence of VOCs in indoor air from home products Other types of sampling data that can be used to address VI issues include using sub- slab (ie soil vapor samples immediately beneath the foundation or slab of a building) soil vapor samples (ie soil vapor samples not beneath the foundation or slab of a building) or groundwater to indoor air attenuation modelsfactors These sampling data types provide an indirect measurement of potential indoor air level and can depend on building characteristics chemical type soil type depth of the source time of year and a host of other factors Potential vapors can be reduced or eliminated through engineered controls and containment systems (sub-slab deshypressurization soil vacuum extraction vapor barriers) ventilation systems (building pressurization indoor air purifiers) avoidance (temporary or permanent receptor relocation) removal actions to reduce the concentrations of subsurface chemicals sealing preferential pathways and installation of sub-slab vapor mitigation system similar to the type used for radon gas control [14]
In November 2002 the EPA Office of Solid Waste and Emergency Response (OSWER) issued a draft guidance for Evaluating the Vapor Intrusion to Indoor Air Pathway from Groundwater and Soils (Subsurface Vapor Intrusion Guidance) The draft provides technical and policy recommendations and guidance on conducting a screening evaluation to determine if the vapor intrusion pathway poses an unacceptable risk to human health at cleanup sites In the document EPA recommends a site-specific evaluation be performed simultaneously with the subsurface assessment such as the collection of sub-slab soil vapor if indoor air concentrations exceed target levels [14] To evaluate carcinogenic effects of TCE for site-specific assessments a TCE level in air of 12microgm3 would represent an upper bound life-time cancer risk to an individual of 10-6 (or no apparent increased risk) and a TCE level in air of 120 microgm3 would correspond to the lower bound life-time cancer risk to an individual of 10-4 (or low increased risk) The TCE air levels were derived based on residential scenario of exposure (24
21
hoursday 350 daysyear) for 30 years averaged over a 70 year lifetime In addition to the proposed EPA Rfc value of 40 microgm3 for TCE the OSWER also identified two values in evaluating systemic toxicity at a site from vapor intrusioninhalation exposure [14] The first developed by the New York State Department of Health (NYSDOH) of 10 microgm3 is based on laboratory data and reports in occupational exposures The second value is a chronic reference exposure level (REL) of 600 microgm3
developed by CalEPA based on self-reported neurological effects from occupational exposures [14] The limited site-specific indoor air sampling for TCE (maximum value of 7 microgm3) was below the above mentioned comparison values (ie EPA Rfc of 40 microgm3 NYSDOH value of 10 microgm3 and CalEPA REL of 600 microgm3)
Cancer Incidence Data Analysis
Due to community concerns about potential elevated disease rates in the community PADOH and ATSDR reviewed the available cancer incidence data for the community to determine if there are an excess number of cancer cases currently associated with exposure to TCE
Sources of Data
The Commonwealth of Pennsylvania maintains health outcome databases including vital statistics and cancer registries [19] For this HC The Pennsylvania Cancer Registry (PCR) provided PADOH Bureau of Epidemiology Division of Community Epidemiology with cancer incidence data for a twelve-year period (1996-2007) for all reportable cancer sites (Table 7) Multiple-year data are generally used in analyses because cases collected in a single year are subject to a large amount of chance variation from year-to-year The health outcome analysis centers the population data around the available US Census data which occurs every ten years with the most recent Census occurring in 2000
The PCR relies on coding sites and histology using International Classification of Disease (ICD) system specifically using the ICD Oncology Code 3rd edition (ICD0-3) This data is submitted to the PADOH Bureau of Health Statistics and Research [20] The Registry receives monthly reports from all acute care hospitals and pathology laboratory electronically and represents cancer incidence rates The PCR also incorporates cancer mortality using ICD 10th revision codes (ICD-10) when the underlying cause of death is determined to be cancer For this HC the number of cancers refers to the number of primary sites reported not the number of people Although some individuals may have more than one cancer during the period of interest in general the number of primary sites is expected to be relatively similar to the number of persons with cancer
To detect increases in cancer risk for a relatively rare cancer the population of a ZIP Code needs to be large enough to reliably calculate and compare the relevant cancer incidence rates and to rule out fluctuations in cancer rates due to chance variation The 18707 ZIP code has an approximate population of 16000 persons and geographically includes but is not limited to in whole or in part to the neighborhoods areas and communities of Albert Fairview Heights Glen Summit Lindbergh Mountain Top Nuangola Nuangola Station Penobscot Pine View Reilly Rippletown Rita Slocum Slocum Corners Welch Corners and Wright The ldquoobserved casesrdquo (or study area) for the entire ZIP code represents the number of cancers reported for Mountaintop The ldquoexpected casesrdquo (or comparison area) represent the number of expected cases if the study area had experienced rates of cancer similar to the rest of Commonwealth of Pennsylvania as a whole during the same timeframe
22
Methods
A statistical analysis was conducted for all cancers combined and for specific cancer sites for males females and total (males amp females combined) To determine whether there is an excess of cancer in the community the observed number of cancers in the Mountain Top ZIP code were compared to the ldquoexpectedrdquo number of cases based on the Commonwealth of Pennsylvania data during the same timeframe The cancer rate for the Commonwealth as a whole was used to calculate an expected number of cancer rates that would have hypothetically occurred in the study ZIP codes over the same period of time The observed cases theoretically should not vary significantly from the Commonwealth data as a whole The information was further standardized to eliminate possible effects due to differences in race gender and age between the study area and the rest of the Commonwealth Statewide sex gender and site-specific incidence rates were multiplied by age-groups (0-4 5-14 15- 24 hellip 85+ years) The statistical significance of the indirectly age-adjusted incidence rates was calculated in accordance with the methodology recommended by Selven et al [20]
The evaluation of cancer incidence was performed using the Standard Incidence Ratio (SIR) or the ratio of the observed number of cancer incidence divided by the expected number (OE) A SIR ratio of 10 indicates that the number of cases observed in the population is the same as the expected or Commonwealth rate A SIR ratio greater than 10 indicates that more cases occurred than expected and a ratio less than 10 indicates that fewer cases occurred than expected Accordingly a ratio of 15 is interpreted as 50 more cases than expected and a ratio of 09 indicates 10 fewer cases than would be expected [20]
The Z-score a tool used to determine statistical significance indicates how far and in what direction the observed rates deviate from the mean expressed in units of standard deviation Z-scores are utilized to help rule out the possibility that the results are due to chance variation A Z-score of 196 equates to a 95 level of statistical significance or a 1 in 20 chance that the results are due to random variation alone (plt005) The 95 CI is the range of estimated ratio values that has a 95 probability of including the true ratio for the population and is a statistical measure of precision Statistically significant means there is less than 5 chance that the observed difference is merely the result of random fluctuation If a confidence interval Z-score is above + 196 it implies there is a statistically significantly higher rate than would be expected Similarly if the confidence interval Z-score is below - 196 then the number of cases is statistically significantly lower than expected [20]
Results
PADOH and ATSDR reviewed the cancer incidence health outcome data analysis for the Mountaintop community for all reportable cancers from 1996-2007 (Tables 5) The cancers most likely based on current scientific knowledge related to or associated with exposure to TCE in drinking water are hepatic (liver) and renal (kidney) cancer However the toxicological profile for TCE carcinogenicity and specific target organs is still somewhat less well-developed than those for certain other compounds
Mountaintop had zero reported cases of liverintrahepatic bile duct cancer compared to 1122 expected cases based on Commonwealth as a whole data In other words the incidence rate of liver cancer in the Mountaintop community was less than expected and statistically significant less than expected with a Z-score of -338 A Z-score of 196 equates to a 95 level of statistical significance or a 1 in 20 chance that the results are due to random variation alone (plt005) A Z-score greater than 196 the
23
difference between the observed and expected values is probably due to some other set of factors and unlikely a result of chance variation For kidney and renal pelvis cancers there were 31 cases in Mountaintop compared to an expected 312 cases based on the Commonwealth population Therefore the number of kidney and renal pelvis cancers in the community is not elevated and is similar to rates observed in the Commonwealth as whole
Overall during the 1996-2007 reporting years the total number of cases for all reportable cancers in Mountaintop (952) was significantly less than the expected number of cases (107142) based on Commonwealth as a whole data In other words the number of cancer cases in the community was less than expected and statistically less than expected with a Z-score of -404 Thyroid cancer was the only cancer that was statistically elevated in the community with 25 observed cases compared to 2325 expected cases with a resulting Z-score of +316 (statistically elevated in females and total population but not in males) However based on the current scientific literature and data thyroid cancer is not believed to be associated with exposure to TCE Lastly several other cancers were statistically less than expected in the Mountaintop community including larynx bronchuslung breast cervix prostate non-Hodgkin lymphoma and multiple myeloma Therefore based on a review of the available cancer incidence data PADOH and ATSDR did not observe elevated levels of cancer in the Mountaintop ZIP code with the exception of the above-mentioned thyroid cancer data However cancer incidence data is not without limitations and a summary of such limitations is discussed in detail in the next section
Limitations of Cancer Incidence Data
Cancer is a common illness and its occurrence in a population increases with age Depending on the type of cancer a population with no known environmental exposure could be expected to have a substantial number of cancer cases Approximately 1 in 3 people living in the United States will develop cancer at some point in their lives [21]
Health outcome data evaluations are measures of disease occurrence in a defined population Such evaluations can help to provide an overall picture of community health and can potentially identify or confirm excess disease in a community However there are many limitations like any statistical analysis to using the existing data to examine the relationship between environmental exposures and chronic diseases such as cancer Most of these limitations would make it less likely (as opposed to more likely) that this health outcome data analysis would identify any potentially elevated rates due to TCE exposure Such limitations include
The cancer incidence analysis was based on an analysis of the entire Mountaintop ZIP code However in actuality only a small percentage of the community (in this case 32 homes) were potentially exposed to TCE It is difficult to perform cancer incidence analysis when the sample size is small (ie the population of given area is small) or when the cancer type is very rare Therefore a larger sample size is used and increases the overall confidence in the analysis This issue of adequate sample size is a common problem faced in epidemiology and statistical analysis also referred to as low statistical power
The quality of the information is directly related to the accuracy of the reporting system and under reporting of cases is very possible However in general Pennsylvania is considered to
24
have a highly reliable cancer registry A contaminant can contribute to illness or disease without being reflected in the available health outcome data
Cancer incidence data can only determine whether there is an increased rate of cancer in the ZIP code area Cause and effect relationships cannot be established because other factors that may contribute to the observation such as heredity lifestyle environmental exposures from other sources and occupational exposures are unable to be accounted for
The cancer registry uses only the residence of the individual at the time of diagnosis Information on previous residence and length of residency are not included in the cancer registry Population mobility and changes in population can greatly affect the results of this analysis
Cancer can have a long latency period (ie 30 years) Any elevated incidence rates detected by the analysis provide information on historical exposures potentially related to the site but do not reflect current site conditions or exposure levels and
The interpretation of the SIR has inherent limitations Any conclusions drawn from the ratios depend on both the ratio value and the total number of observed and expected cases Two ratios can have the same value but be interpreted differently For example a ratio of 15 based on 2 expected cases and 3 observed cases indicates a 50 excess in cancer but the excess is actually only a single case However a ratio of 15 based on 200 expected cases and 300 observed cases represents the same 50 excess in cancer but because it is based upon a greater number of cases the estimate is less likely to be attributable to chance
Child Health Considerations ATSDR and PADOH recognize that children are especially sensitive when exposed to many contaminants A childrsquos lower body weight and higher intake rate results in a greater dose of hazardous substance per unit of body weight If toxic exposure levels are high enough during critical growth stages the developing body systems of children can sustain permanent damage PADOH and ATSDR have taken into account the unique vulnerabilities of infants and children to environmental contaminants during the evaluation of this public health issue and the preparation of this health consultation specifically to through possible inhalation to children off-site
There is some data on potential health effects from ingestion of TCE but as discussed further above the levels of TCE are not at levels expected to cause adverse health effects PADOH and ATSDR would not expect health effects in children from the reported level of TCE However further research needs to be conducted to better define potential health effects from exposure to TCE in children [12]
Studies suggest that birth defects may occur when mothers drink water containing TCE People who used water for several years from two wells that had high levels of TCE may have had a higher incidence of childhood leukemia than other people but these findings are not conclusive In another study of TCE exposure from well water increased numbers of children were reported to be born with heart defects which are supported by data from some animal studies showing developmental effects of TCE on the heart However other chemicals were also in the water from this well and may have contributed to these effects One study reported a higher number of children with a rare defect in the
25
respiratory system and eye defects Children listed in the National Exposure Subregistry of persons exposed to TCE were reported to have higher rates of hearing and speech impairment There are many questions regarding these reports due to the small number of children in the study [12]
Developmental experimental animal studies have focused on TCE exposure during pregnancy Observed effects include increased fetal death altered glucose metabolism in brain or behavior in offspring delayed organ and bone development and altered cardiac development Changes in the immune system have been observed in rat offspring exposed to TCE during pregnancy and lactation changes included decreased B cell responses increased delayed-type hypersensitivity responses (involving T lymphocytes) and thymocyte changes in the thymus [12] PADOH and ATSDR evaluated potential childhood exposure to TCE as discussed in the Exposure Scenarios and Dose Calculations Section Based on the dose calculations and the available residential sampling data PADOH and ATSDR would not expect current exposures to harm childrenrsquos health
Conclusions
Based on a review of the sampling and cancer incidence data PADOH and ATSDR conclude the following
1 Exposure to TCE in residential well water is not expected to harm peoplersquos health Residential well water samples collected in 2004 showed levels of TCE above the current Environmental Protection Agencyrsquos (EPA) maximum contaminant level (MCL) for drinking water However since 2004 the residents have been supplied with alternative drinking water and subsequently hooked up to public water supply with the exception of one residential property and are not a current pathway of exposure Ingestion of residential well water represents a past pathway of exposure but long-term well sampling data are not available Guardian wells installed and monitored by EPA and FWEC are located outside the current area of TCE contamination and do not show that the plume has migrated to other residential areas
2 Exposure to TCE levels detected in surface water samples are not expected to harm peoplersquos health TCE was detected in surface water samples collected by EPA above the EPA MCL for drinking water but PADOH and ATSDR do not anticipate the public would be using the surface water for drinking purposes The public however could breathe TCE volatilizing from the surface water However given the measured TCE the processes of diffusion volatilization and the likely exposure durations by the public the resulting levels in the ambient air are not expected to be at levels that could harm peoplersquos health
3 Breathing the TCE levels detected in the residential indoor air samples (to date) is not expected to harm the publics health EPA and FWEC conducted indoor airvapor intrusion sampling at ten residences along Church Road The highest detected indoor air level of TCE was 7 microgm3 This TCE level is more than 70 times lower than MRLIntermediate EMEG CV for TCE of 500 microgm3 and more than 1400 times lower than the ATSDR acute MRL CV for TCE of 10000 microgm3 This residence had a plumbing leak which later repaired resulted in non-detect levels of TCE However since the residential vapor intrusion sampling data is very limited and can fluctuate over time due to various conditions Additional vapor intrusion sampling is recommended if multiple lines of evidence suggest a vapor intrusion potential be
26
performed at homes along Church Road to determine if VI is occurring and if exposure to any detected VOCs could harm peoplersquos health
4 Based on estimated exposure dose calculations for inhalation dermal and ingestion exposure to TCE at the site is not expected to cause an observable increase in cancers and non-cancer health effects PADOH and ATSDR calculated an estimated exposure dose based on the residential well sampling data for TCE collected along Church Road The exposure doses using EPArsquos cancer slope factor (CSF) for TCE were used to compute a theoretical excess cancer risk The highest theoretical excess cancer risk (calculated using the highest EPA cancer slope factor and assuming 30 years of exposure) of approximately 572Eshy04 (or 572 excess cancers in 10000 exposed) falls within the range of low increased cancer risk The estimated exposure dose for both adults and children were below levels documented in the scientific literature to show non-cancerous health effects in laboratory animals In addition the since the residents do not currently use the groundwater for drinking the theoretical cancer level is likely much lower
5 Based on a review of the cancer incidence data rates of cancers within the Mountaintop ZIP code were generally not statistically elevated compared to the Commonwealth population as a whole PADOH and ATSDR reviewed the Pennsylvania Cancer registry data for the Mountaintop community for the all reportable cancers for the years 1996 to 2007 The analysis indicated no statistically elevated rates for specific cancers that are thought based on current scientific literature and sources to be potentially associated with TCE exposure (eg hepatic - liver renal - kidney) Overall the rates of all reportable cancers for the community were less than and statistically significant the expected rates based on Commonwealth population as a whole The analysis did indicate that the rates for one specific cancer types (Thyroid cancer in females only) were statistically elevated for the Mountaintop ZIP code when compared to the Commonwealth population as a whole However this cancer is not thought or known based on current scientific literature and sources to be potentially associated with TCE exposure or toxicity
27
Recommendations
PADOH and ATSDR recommend that additional indoor air samples in both the basement and first floor of the homes along Church Road at varying seasons be collected to evaluate potential exposure via vapor intrusion
PADOH and ATSDR recommend continued groundwater monitoring to ensure the TCE plume has not migrated to other residential areas
PADOH and ATSDR recommend that EPA and PADEP continue to educate and reach out to the community and local officials on the TCE sampling in the community and residential homes
Public Health Action Plan The public health action plan for the proposed site contains a description of actions that have been or will be taken by PADOH ATSDR and other government agencies at the site The purpose of the public health action plan is to ensure that this health consultation both identifies public health hazards and provides a plan of action designed to mitigate and prevent harmful human health effects resulting from exposure to or breathing of hazardous substances Included is a commitment on the part of PADOH and ATSDR to follow up on this plan to ensure that it is implemented
Public health actions that have been taken include
PADOH conducted a site visit of the former facility and the surrounding community
PADOH met with the PADEP Northeast Regional staff to discuss site background information environmental sampling and community concerns
PADOH attended a meeting with the concerned community members
PADOH and ATSDR produced a fact sheet which was posted on the EPA Foster Wheeler website
PADOH and ATSDR updated the cancer incidence data analysis for Mountaintop PA with data from additional reporting years
PADOH and ATSDR completed this health consultation
Public health action that is currently being implemented or will be implemented
PADOH and ATSDR will provide and discuss this HC with the PADEP EPA and other community members as feasible and appropriate
PADOH and ATSDR will continue to be available to discuss concerns associated with the FWEC and Church Road TCE site with community members and local authorities as appropriate
28
PADOH and ATSDR will provide review and consultation to environmental sampling data if requested and deemed appropriate and issue an appropriate public health response
PADOH and ATSDR will provide education and outreach to the local community and physicians
29
References
1 EPA Region 3 Frequently Asked Questions for FWECChurch Road TCE Site November 2008 httpwwwepaoscorgsites4146filesfwecshychurch20road20fact20sheet20november202008pdf
2 EPA Foster Wheeler Energy CorporationChurch Road TCE NPL site April 2009 httpwwwepagovreg3hscdsupersitesPAD003031788indexhtm
3 EPA News release - Foster Wheeler proposed to the NPL April 2009 httpyosemiteepagovopaadmpressnsfd985312f6895893b852574ac005f1e4062d736ac7b1 a8b438525759200670dc4OpenDocument
4 PADOH Technical Assist Document ndash Foster Wheeler August 2008 httpwwwepaoscorgsites4146filesfoster20wheeler20tce_mountaintop_technical20as sistpdf
5 PADOH Community Factsheet for Foster Wheeler August 2008 httpwwwepaoscorgsites4146filesfoster20wheeler20health20fspdf
6 EPA Foster WheelerChurch Road TCE Site HRS Documentation April 2009 httpwwwepagovsuperfundsitesdocrecpdoc1794pdf
7 EPA Region 3 Newsletter on Emergency Response Action at Foster Wheeler Energy Corporation Church Road TCE site May 2005 httpwwwepaoscorgsites4146fileschurchroad05-01bpdf
8 EPA Region 3 Church Road TCE site Chronology of Work Completed September 2008 httpwwwepaoscorgsites4146filesupdated20cr20timeline20-20revisedpdf
9 EPA Sampling results for Guardian wells through November 2009 for Mountaintop PA shyhttpwwwepaoscorgsites4146filesMountain20Top20
20Guardian20Well20TCE20Laboratory20Results20Through20December2012 202009pdf
10 ATSDR Public Health Assessment Guidance Manual 2005 httpwwwatsdrcdcgovHACPHAmanualtochtml
11 ATSDR Case Studies in Environmental Medicine ndash TCE November 2007 httpwwwatsdrcdcgovcsemtcetcecontentshtml
12 ATSDR Toxicological Profile for TCE September 1997 httpwwwatsdrcdcgovtoxprofilestp19html
13 ATSDR Health Consultation ndash Econocare Cleaners Vapor Intrusion Investigation Green Bay Brown County Wisconsin September 2006 httpwwwatsdrcdcgovHACphaEconoCareCleanersEconocareCleanersHC093006pdf
14 EPA Office of Solid Waste and Emergency Response Interim Recommended TCE Toxicity Values to Assess Human Health Risk and Recommendation for the Vapor Intrusion Pathway Washington DC November 2002 httpwwwepagovwastehazardcorrectiveactioneisvaporhtm
30
15 EPA Teach Chemical Summary ndash TCE September 2007 httpwwwepagovteachchem_summTCE_summarypdf
16 Foster Wheeler Energy Corporation Draft Final Data Gap Analysis for FWEC Church Road TCE site September 2009 httpwwwfweccrcompdfDraftFinalDataGapAnalysisReportSeptember172009pdf
17 ATSDR Health Consultation ndash TMC Cleaner Evaluation follow-up Indoor Air Sampling City of Olympia Thruston County Washington March 2005 httpwwwatsdrcdcgovhacphaTMCcleaners031105-WATMCcleaners031105-WApdf
18 New York State Department of Health Guidance for Evaluating Soil Vapor Intrusion in the State of New York October 2006 httpwwwhealthstatenyusenvironmentalinvestigationssoil_gassvi_guidancedocssvi_mai npdf
19 PADOH Cancer Registry 2010 httpwwwportalstatepausportalserverptopen=514ampobjID=590073ampmode=2
20 ATSDR Health Consultation ndash Health Outcome Data Analysis 1996-2005 Borit Site Borough of Ambler Montgomery County Pennsylvania January 2009
21 ATSDR Cancer Factsheet August 2002 httpwwwatsdrcdcgovcomcancer-fshtml 22 ATSDR Health Consultation - Fort Detrick Area B Groundwater Public Health Assessment
Final Release Evaluation of Drinking Water Well Exposures via Confirmed Off-Site Contamination Fredrick Maryland December 2009
shyhttpwwwatsdrcdcgovHACphaFtDetrickAreaBGroundwaterFortDetrickPHAFinal12-092009pdf
31
Authors Technical Advisors Pennsylvania Department of Health Bureau of Epidemiology Division of Environmental Health Epidemiology Health Assessment Program
PADOH Authors
Christine Lloyd MS Epidemiology Program Specialist
Farhad Ahmed MPH MBBS Program DirectorEpidemiologist
Barbara Allerton MPH RN Epidemiology Research Associate
ATSDR Reviewers
Lora Siegmann-Werner MPH Senior Regional Representative ATSDR Region 3
Alan Parham MPH REHS Technical Project Officer Division of Health Assessment and Consultation ATSDR
33
Figures
Figure 1 ndash Arial view of the former FWEC facility and Church Road TCE Site
34
Figure 2- Sample location of residential private wells along Church Road and up-gradient background well sample location
35
Figure 3 - Location of guardian wells outside the Church Road TCE plume
36
Tables Table 1- Residential private well (Church Rd) and background sampling results for TCE
Sample ID Date Collected TCE ( microgL) Notes
14TD-KSK 1142004 10 Background sample
130_C 9142004 63 142_C 9142004 200 146_C 9142004 420 158_C 9142004 220 166_C 9142004 76 168_C 9142004 600 170_C 9142004 1300 171_C 9142004 1500 ML 172_C 9142004 1400 174_C 9142004 1000 175_C 9142004 1600 178_C 9142004 540 179_C 9142004 820 192_C 9142004 1100 201C-KSP 10162004 190 205C-OF 10182004 1100 ML 207C-KSK 10182004 610 212C-OS 10162004 1000 216C-BSK 10212004 770 218C-BSP 10212004 630 220C-B-OS 10162004 820 222C-B-BTS 10162004 520 224C-B-BTS 10182004 820 234C-OF 10222004 32 238C-BSP 10162004 140 242C-OF 1112004 37 23S-BSP 10182004 260 19E-BSP 10182004 270 25E-BSP 10182004 210 386SMOF 10252004 220 390SM-BSP 11172004 150 CS+G_UKF 10292004 65
Average (minus background) 584
ML= estimated value due to low recovery in matrix spike duplicated and reported concentration may be low
37
Table 2 - Residential well sampling results for VOCs SVOCs and metals
Contaminant
Detection Limit or Minimum (microgL)
Maximum (microgL) CV (microgL)
VOCs Bromodichloromethane lt02 48 EMEG=700 CREG=06 Bromoform lt02 21 EMEG=700 CREG=4 2-Butanone lt02 170 Carbon tetrachloride lt03 29 CREG = 03 Chloroform lt02 44 EMEG=400 Chloromethane lt03 3 Dibromochloromethane lt02 09 EMEG=3000 CREG=04 11-Dichloroethene lt03 08 12- Dichlorobenzene lt03 09 EMEG = 10000 14-Dichlorobenzene lt04 017 EMEG=2000 12-Dichloroethane lt03 38 CREG=04 Dichlorodifluoromethane lt03 47 RMEG= 7000 cis-12-Dichloroethene lt03 11 Intermediate EMEG= 10000 trans-12-Dichloroethene lt03 02 Intermediate EMEG= 7000 12-Dichloropropane lt03 59 EMEG=900 cis-13-Dichloropropene lt01 016 Ethylbenzene lt03 08 Intermediate EMEG=20000 2-Hexanone lt1 031 Methyl tert-butyl ether lt05 023 Intermediate EMEG= 10000 Methylene Chloride lt04 41 EMEG=2000 CREG=5 Tetrachlorethene lt04 18 RMEG=400 Toluene lt03 1 Intermediate EMEG=700 Trihalomethanes (total) lt02 49 MCL = 80 111-Trichloroethane lt03 2 Intermediate EMEG= 700000 Trichloroethylene lt04 270 MCL=5 Trichlorofluoromethane lt02 22 RMEG=10000 112- Trichloro-122-trifluoroethane lt05 11 RMEG=1000000 Xylene (total) lt02 19 EMEG=7000
SVOCs Bis (2-ethylhexyl)phthalate lt5 11 Caprolactam lt5 11 RMEG=20000
Metals Arsenic lt32 10 EMEG=10 CREG=002 Barium lt17 269 EMEG=7000 Cadmium lt04 1 EMEG=400 Calcium lt43 12900 Chromium (total) lt16 022 EMEG=40 (Chromium VI) Cobalt lt1 009 Intermediate EMEG=400 Copper 82 163 Intermediate EMEG=400 Iron lt392 414 Lead lt12 79 MCL=15 Magnesium lt416 2200 Manganese lt12 265 RMEG=2000 Nickel lt24 53 RMEG=700 Potassium lt315 672 Selenium lt22 044 EMEG=200 Silver lt1 15 RMEG=200 Sodium 2350 34800 Vanadium lt1 38 Intermediate EMEG=100 Zinc lt58 826 EMEG=10000
EMEG = Environmental Media Evaluation Guide RMEG= Reference Dose Media Evaluation Guide MCL = Maximum Contaminant Level (EPA)
38
Table 3 ndash Surface water sampling results
Contaminant Detection Limit or Minimum (microgL)
Maximum (microgL)
Acetone lt5 94
Bromodichloromethane lt02 073
Bromoform lt02 25
2-Butanone lt13 17
Carbon disulfide lt05 19
Carbon tetrachloride lt03 039
Chloroform lt02 29
Chloromethane lt03 041
Dibromochloromethane lt012 012
11-Dichlorethane lt03 044
11-Dichlorethene lt03 05 12-Dichloro-1122shytetrafluoroethane 13 12
cis-12-Dichloroethene lt03 89
Dichlorofluoromethane lt03 47
Methyl tert-butyl ether lt05 021
Methylene Chloride lt04 37
Tetrachlorethene lt04 022
Toluene lt03 12
111-Trichloroethane lt03 12
112- Trichloro-122-trifluoroethane lt05 15
Trichloroethylene lt04 160
Trichlorofluoromethane lt02 88
Vinyl chloride lt02 22
39
Table 4 ndash Residentail indoor air (vapor intrusion) sampling resutls
Contaminant Minimum (microgm3)
Maximum (microgm3) CV (microgm3)
Acetone 12 36 Chronic EMEGMRL=30000
Benzene 1 17 Chronic EMEGMRL=10 CREG=01
Carbon Disulfide 27 27 Chronic EMEGMRL= 900
Dichlorodifluoromethane 21 28
Ethylbenzene 069 09 Chronic EMEGMRL=1000
4-Ethyltoluene 1 11
2-Butanone 13 47 Rfc = 5000
Styrene 074 2 Chronic EMEGMRL = 900
Toluene 068 18 Chronic EMEGMRL = 300
Trichloroethylene 042
7 (18 next highest since pipe repaired) Rfc = 40
Trichlorofluoromethane 18 21 Intermediate EMEGMRL=500
124-Trimethylbenzene 099 23
Xylenes (Total) 15 45 Chronic EMEGMRL=200
40
Table 5 ndash Cancer incidence data analysis for Mountaintop 1996-2007
41
- Screened Lowerer Rate (Z-Score less than or equal to- 196)
Cases = Number of newly diagnosed cases during the reporting period Expected = Number of expected cases if study area had experienced average PA state rates during 1996-2007 SIR = Standard Incidence Ratio (observedexpected cases) ST Rate = Average annual state rate per 100000 population during reporting period CR Rate = Average annual crude rate per 100000 population for study area during reporting period ADJ Rate = Average annual age-adjusted per 100000 population for study area during reporting Z-score = Statistical significance of study area compared to state during reporting period (a Z-score of 196 equates to a 95 level of statistical significance or a 1 in 20 chance that the results are due to random variation)
+ Screened Higher Rate (Z-Score greater than or equal to 196)
42

Next Steps
literature and sources to be potentially associated with TCE exposure or toxicity
PADOH and ATSDR will consider updating the cancer incidence data with additional reporting years in the future and issuing a public health comment
For More If you have concerns about your health you should contact your health care provider For questions or concerns about the Foster Wheeler Energy Information CorporationChurch Road TCE site please contact the Pennsylvania Department of Health Division of Environmental Health Epidemiology at (717) 346-3285
6
Background and Statement of Issues
Background
TCE contamination was first discovered at the former Foster Wheeler Energy Corporation (FWEC) located in Mountaintop in 1985 as a result of a real estate transaction In 1988 FWEC entered into a consent order with EPA and PADEP requiring additional site investigation activities and implementation of remedial measures Since 1993 FWEC has implemented remedial measures consisting of a groundwater treatment system On-site groundwater samples are collected on an annual basis from groundwater monitoring wells on the former FWEC property TCE levels have decreased from a high of 180000 microgL prior to the installation of the groundwater treatment system to an on-site maximum concentration of 17000 microgL in 2008 [1]
In 1986 residential well sampling data collected from seven residential wells located along Church Road by the Pennsylvania Department of Environmental Resources (now called the Pennsylvania Department of Environmental Protection) did not detect volatile organic compounds (VOCs) including TCE above the EPA maximum contaminant level (MCL) A 2004 groundwater sampling event however detected TCE in 14 residential wells along Church Road exceeding the EPA MCL for TCE of 5 microgL Community members and elected officials have expressed their concerns that exposure to TCE in the Mountaintop community could cause adverse health effects [6]
Based on the 2004 TCE residential well results EPA and FWEC offered affected residents alternative water supplies (ie bottled water and installation of whole house carbon filter in the residences) to mitigate human exposure to VOCs in groundwater In November 2004 to ensure the carbon filters were properly removing TCE FWEC and EPA collected tap samples from 34 homes The results indicated that the filters were effective in removing TCE [8] In August 2005 Foster Wheeler and EPA entered into an Administrative Settlement Agreement and Order on Consent requiring Foster Wheeler to connect 36 impacted residents to a public water line to eliminate ingestion exposure to TCE All residents except one were connected to the public water line in July 2007 and the impacted wells were later disconnected and abandoned [1] One resident who refused to agree to be connected to the public water line and continues to utilize a carbon filtration system for drinking water [8]
In April 2009 The FWEC siteChurch Road TCE site (collectively called the site) was proposed to the EPA National Priorities List (NPL) [2] The NPL is a national list of sites where hazardous substances could impact human health andor the environment Listing the site on the NPL assists with determining the magnitude and extent of the groundwater contamination and ensures long-term monitoring of the site NPL sites first undergo a thorough investigation to determine the full nature and extent of contamination Next EPA or the parties responsible for the contamination then address the potential risks the sites might pose to human health and the environment Once a site has been proposed for the NPL there is a 60-day comment period with a final decision on the site made after EPA evaluates and responds to all the public comments in writing [3]
In 2010 the EPA began a remedial investigation and feasibility study (RIFS) for the site which consists of groundwater monitoring well installation and sampling regional and local geological evaluations soil sampling vapor intrusion testing and pilot-scale testing of remedial technologies Residential vapor intrusion sampling should be completed in 2011 and depending on the sampling
7
results the RIFS should be finished between 2012 and 2013 In addition a baseline risk assessment will also be developed to identify the existing or potential risks to human health and the environment at the site
Site Description
The Foster Wheeler Energy CorporationChurch Road TCE Site consists of the former Foster Wheeler facility and the Church Road TCE site located in Mountain Top Wright Township Luzerne County Pennsylvania (Figure 1) FWEC site is a 105 acre site located in the Crestwood Industrial Park and is surrounded by residences and business (Figure 2) This facility was active from 1953 until 1984 and manufactured large pressure vessels utilizing Trichloroethylene (TCE) as a degreaser and machine parts oil remover The facility has been inactive since 1984 The Church Road TCE site has residential homes located approximately 1 mile south of the former Foster Wheeler facility and is referred to as the Affected Area The Affected Area of homes extends from east to west along Church Road and Watering Run encompassing approximately 295 acres [1] There are 29 residential wells near the site that are contaminated with TCE above EPAs Safe Drinking Water MCL There are an additional 7 wells that contain TCE but are not above the EPA MCL [6]
Site Visit
In January 2010 the PADOH Health Assessment Program (HAP) personnel met with the PADEP Northeast Regional Office to discuss site background information environmental sampling and community concerns In addition a site visit of the former facility and tour of the surrounding community was conducted
Public Health Involvement Since September 2004 ATSDR and PADOH have been collaborating with PADEP and EPA to evaluate environmental sampling data and community concerns related to the FWECChurch Road TCE site [4] PADOH and ATSDR has reviewed evaluated and provided comment on residential sampling data collected by PADEP EPA and FWEC The following is a summary of ATSDR and PADOH involvement with the site
1 October 2004 ndash ATSDR Region 3 evaluated groundwater sample data from 14 residential wells in Mountaintop and found that the TCE levels found in the samples exceeded the MCL of 5 microgL The sample levels ranged from 76 to 160 microgL ATSDR concurred with EPA that alternate water supplies are necessary to mitigate human exposures to contaminated groundwater at this site In addition ATSDR recommended that the residents limit the length of showers and baths to less than five minutes until whole-house treatment units are installed and evaluated for effectiveness ATSDR recommended that EPA conduct a well survey in the area to determine if any other wells were contaminated with TCE
2 June 2005 - ATSDR Region 3 evaluated one surface water sample from a spring on a residential property The reported TCE level in the surface water was 26 microgL which is between 1000 and 10000 times below levels shown to cause health effects via ingestion ATSDR concluded that exposure to the reported level posed no apparent public health hazard
8
3 May 2006 ndash ATSDR Region 3 evaluated indoor air sampling data results collected from a residence and found that the reported TCE levels (13 ppb or 7 microgm3) were more than 1000 times below levels shown to cause adverse effects in animals (either cancerous or nonshycancerous) and approximately 100 times below the levels that are estimated to cause harm in humans via inhalation The minimum risk level (MRL) for acute exposure to TCE is 2000 ppb (10000 microgm3) and for intermediate exposure is 100 ppb (500 microgm3) ATSDR concluded that exposure to the reported level posed no apparent public health hazard [4]
4 August 2008 ndash PADOH prepared a technical assist (TA) document and factsheet (FS) for the site The TA and FS documents included (1) A review of residential sampling data and previous health assessment activities (2) A review of cancer incidence data for the Mountaintop community for all reportable cancer from 1996 to 2005 and (3) A review of general health information of the community collected by an area citizen The cancer incidence analysis did not detect statistically elevated rates of cancer know to be potentially associated with TCE exposure The community-collected health information listed a tally of certain diseases (cancer liver damage heath disease and autoimmune disease) however this data could not be quantitatively evaluated nor correlated to exposure and disease because the information provided lacked sufficient detail Such details include specific time frames location of resident distance of residence from site possible exposure pathway environmental sampling or exposure levels length of time residing at residence past occupational exposures heredity and medical history and residence at time of diagnosis [4]
Exposure Pathway Analysis An exposure pathway is how a person comes in contact with contaminants originating from a site A completed pathway requires that all five elements be present 1) a source of contamination 2) an environmental medium that transports contaminants 3) a point of exposure 4) a route of human exposure and 5) a receptor population PADOH and ATSDR consider the air pathway to be a completed pathway as described in the table below The presence of a completed exposure pathway does not however necessarily mean that adverse health effects will occur or have occurred in the past as a result of such exposure
Currently because the groundwater for drinking and showering has been essentially eliminated via filterspublic water the primary current exposure pathway of concern for residents is inhalation of TCE via vapor intrusion from contaminated groundwater (see the Exposure Pathway tables on the following) The public could also be exposed to TCE volatilizing from surface water However given the processes of diffusion and volatilization the resulting levels of TCE in ambient air would be low The likely exposure duration by the public from surface water is expected to be limited therefore this is not the pathway of greatest concern at the site
9
Current Exposure Pathways
Source of Contamination
Transport via Environmental
Medium
Point of Exposure
Route of Exposure
Receptor Population
FWECChurch Road TCE site
Contaminated groundwater via vapor intrusion
Ambient indoor air
Inhalation or breathing
Residents with impacted water near Church Rd
FWECChurch Road TCE site
Surface water Ambient outdoor air
Inhalation or breathing
Residents with impacted water near Church Rd
In addition ingestion of residential well water represents a past exposure pathway for residents The residents along Church Road have been hooked up to public water supply with the exception of one residential property Based on the 2004 TCE residential well sampling results affected residents were provided alternative water (ie bottle water and installed carbon filter in the residences) and residents (except one) were later connected to the public water supply Therefore ingestion of residential drinking water is not a current exposure pathway for the site but represents a past exposure for most residents In 2004 ATSDR recommended the affected resident limit showers and baths to 5 minutes to reduce any potential inhalation exposures from TCE
Past Exposure Pathways
Source of Contamination
Transport via Environmental
Medium
Point of Exposure
Route of Exposure
Receptor Population
FWECChurch Road TCE site
Contaminated groundwater with volatilization during household use
Ambient indoor air
Inhalation or breathing
Residents with impacted water near Church Rd
FWECChurch Road TCE site
Ingestion via contaminated groundwater
Residential drinking water
Drinking or ingestion
Residents with impacted water near Church Rd
ATSDR Comparison Values
To evaluate whether the public might be exposed to contaminant concentrations that could cause adverse health effects PADOH and ATSDR evaluated the sampling data against ATSDR Comparison Values (CVs) ATSDR has developed CVs to determine the likelihood of possible health effects from exposure to site-specific contaminants [10] CVs are health guidelines or environmental guidelines set well below levels that are known or anticipated to result in adverse health effects ATSDR developed
10
these values to help make consistent decisions about what substance concentrations or dose levels associated with site exposures might require further assessment and evaluation CVs are not thresholds of toxicity and cannot be used to predict adverse health effects Although concentrations at or below the relevant CV may reasonably be considered safe it does not automatically follow that any environmental concentration that exceeds a comparison value would be expected to produce adverse health effects In general CVs are derived for substances for which adequate toxicity data exist based on route of exposure CVs are typically available for three specified exposure periods acute (14 days or less) intermediate (15 to 364 days) and chronic (365 days or more) [10]
How Are ATSDR Comparison Values Used
Comparison values are doses (health guidelines) or substance concentrations (environmental guidelines) set well below levels that are known or anticipated to result in adverse health effects ATSDR and other government agencies have developed these values to help assess substance concentrations or dose levels associated with site exposures that might require a closer look Comparison values are derived for substances for which adequate toxicity data exist for the exposure route of interest if available However comparison values are not thresholds of toxicity and are not used to predict adverse health effects These values serve only as guidelines to provide an initial screen of human exposure to substances Although concentrations at or below the relevant comparison value may reasonably be considered safe it does not automatically follow that any environmental concentration that exceeds a comparison value would be expected to produce adverse health effects
PADOH and ATSDR compared the sampling data to the available CVs and these are described in detail in the table on the following page For cancerous effects ATSDR has established Cancer Risk Guides (CREGs) For non-cancerous effects ATSDR utilizes several CVrsquos including Environmental Media Evaluation Guide (EMEG) Minimum Risk Level (MRL) and Reference Dose Media Evaluation Guides (RMEGs) [10]
11
Type of CV Description
Environmental Media Evaluation Guides (EMEGs)
EMEGs are estimated contaminant concentrations that are not expected to result in adverse noncarcinogenic health effects based on ATSDR evaluation EMEGs are based on ATSDR MRLs and conservative assumptions about exposure such as intake rate exposure frequency and duration and body weight
Cancer Risk Guides (CREGs)
CREGS are estimated contaminant concentrations that would be expected to cause no more than one excess cancer in a million (10-6) persons exposed during their lifetime (70 years) ATSDRs CREGs are calculated from EPAs cancer slope factors (CSFs) for oral exposures or unit risk values for inhalation exposures These values are based on EPA evaluations and assumptions about hypothetical cancer risks at low levels of exposure
Reference Dose Media Evaluation Guides (RMEGs)
RMEGs are values derived from EPAs oral reference doses which are developed based on EPA evaluations RMEGs represent the concentration in water or soil at which daily human exposure is unlikely to result in adverse noncarcinogenic effects
Minimal Risk Levels (MRLs)
MRL is an estimate of daily human exposure to a substance that is likely to be without noncarcinogenic health effects during a specified duration of exposure based on ATSDR evaluations MRLs are set well below toxic effect levels in order to provide an added measure of safety
TCE is considered to be the contaminant of greatest concern at the site However ATSDR does not currently have a CREG value for inhalation exposure or a CV for ingestion exposure Other ATSDR CVs including intermediate EMEG CVMRL for inhalation exposure as well as EPA and California EPA screening levels were used for comparison of the environmental sampling data PADOH and ATSDR summarized the available CVs in the table below
ATSDR Comparison Values and EPA Reference Values used for evaluating TCE exposure at the FWECChurch Road TCE site
Route of Exposure Source Type Level
IngestionDrinking
EPA MCL 5 microgL
InhalationAir ATSDR Intermediate EMEG CV and MRL 500 microgm3
ATSDR Acute MRL 10000 microgm3
EPA RfC (proposed) 40 microgm3
CalEPA Chronic REL 600 microgm3
12
Sampling Data and Results
Residential Well Sampling and Results
In 2004 EPA and FWEC sampled residential well water for volatile organic compounds (VOCs) semi-volatile organic compounds (SVOCs) and metals TCE was discovered in 15 residential wells along Church Road above the EPA MCL and PADEP Act 2 Medium Specific Concentrations (MSC) of 5 microgL with an average level of 59 microgL In the 2004 and subsequent additional sampling events by FWEC and EPA the TCE levels in the residential wells ranged from non-detect to 270 microgL (Table 1) The concentrations of TCE vary from east to west along Church Road with concentrations in the east east ranging from non-detect to approximately 76 microgL wells in the center of the Affected Area from approximately 100 microgL to 270 microgL and wells in the western portion of the Affected Area from non-detect to 30 microgL A background well sample was collected approximately 2 miles north to northeast and up-gradient of the FWEC Sampling results of the background well sample showed a TCE level of 1 microgL [16] In total there are 29 residential wells near the site that are contaminated with TCE above EPAs Safe Drinking Water Act maximum contaminant level (MCL) There are an additional seven wells that contain TCE but are not above the EPA MCL [6]
Other VOCs were detected in the residential well samples including bromodichloromethane bromoform carbon tetrachloride chloroform dibromochloromethane 12-dichloroethane 12shydichloropropane dichlorodifluoromethane methylene chloride tetrachlorothene and trichlorofluoromethane (Table 2) Methylene chloride (maximum concentration of 41 microgL) and 12shydichloropropane (maximum concentration of 59 microgL) were the only other VOCs detected above EPA MCLs and PADEP Act 2 medium specific concentration (MSC) of 5 microgL for each compound Some of the VOCs (bromodichloromethane bromoform carbon tetrachloride and 12-dichloroethane) were above their respective ATSDR CREG CV Arsenic was the only metal detected above the ATSDR CV (Table 2) The maximum arsenic level of 10 microgL exceeded the ATSDR CREG of 002 microgL However the residents are not currently utilizing the well water for drinking as described further in the Background Section Residential groundwater and exposure via ingestion to VOCs SVOCs and metals is not a current pathway of exposure and thus is not a current public health concern [16]
Guardian Wells Sampling and Results
EPA and FWEC have selected six private residential well locations outside the current affected area to serve as guardian wells that ensure the plume has not migrated to other residential wells [7] Since October 2004 EPA and FWEC have conducted quarterly monitoring of the guardian wells TCE levels in the guardian wells have been below the corresponding laboratory method detection limits at the time of the laboratory analysis (ie 018 microgL 04 microgL and 10 microgL) [9] Based on this data it does not appear the TCE contamination plume has migrated beyond the currently known affected areas and homes EPA and FWEC will continue to monitor the guardian wells to detect and identify if the TCE plume migrates
Surface Water Sampling and Results
During 2004 and 2005 EPA collected surface water samples in the affected residential areas and in the Watering Run Watershed for VOCs TCE was detected in 20 of the 65 surface water samples collected ranging from non-detect to 87 microgL In November 2007 and March 2008 EPA collected surface water
13
samples at 11 locations for VOCs (table 3) During both sampling events the maximum TCE concentration in the surface water samples was 160 microgL [17] Generally the highest levels of contamination correspond with highest well sample results It is unlikely that the general public would utilize surface water for drinking It is possible people could be directly exposed to the surface water and could breathe TCE volatilizing or evaporating from the surface water However given the processes of diffusion volatilization and the likely limited exposure frequency by residents the resulting levels of TCE in the ambient air would be very low Exposure to the reported levels of TCE in the surface water is not expected to cause adverse health effects in children or adults In addition since TCE has a low tendency to bioaccumulation (or build up) in fish ingestion of fish in surface water is not a likely exposure pathway for the site PADOH and ATSDR are not aware of people swimming in the streams PADOH and ATSDR will evaluate results of additional environmental sampling ifwhen they become available to verify the validity of the above conclusions [12]
Indoor Air Sampling and Results
In addition to residential well contamination there is also the potential for VOCs vapors from the contaminated groundwater to enter the overlying residents in a process called vapor intrusion (VI) Additional details on the VI pathway are discussed in the Contaminant Evaluation Section Since November 2004 EPA has collected soil gas samples at nine (9) homes TCE vapors were detected at trace concentrations at two (2) residences and at a higher concentration at a third (13 ppb or 7 microgm3) in an unfinished basement of the home The higher vapor concentration in the third home was determined to be attributable to a plumbing leak which was later repaired TCE contaminated groundwater was also found in a residentrsquos sump pump water in the basement An investigation led by EPA determined that TCE-contaminated groundwater was getting into the basementrsquos sump pump due to a cracked waterline The waterline was repaired to mitigate the release of impacted groundwater into the basement All other homes sampled were non-detect for TCE vapors [8]
In 2006 EPA and FWEC collected indoor air sampling which was performed to confirm that the repairs at the residence stopped the TCE contaminated groundwater from getting into the basement and to confirm that the residents are not being exposed to TCE at levels of concern at this residence EPA collected 24-hour indoor air samples (SUMMA canisters) from four locations (two from the unfinished basement one from the finished basement and one in the first floor dining room) at a single residence and in December 2006 FWEC collected seven indoor air samples at the same residence (Table 4) The highest level of TCE detected was 18 microgm3 In addition to TCE the air samples were analyzed for several VOCs including acetone benzene carbon disulfide dichlorodifluoromethane ethylbenzene4-ethyltoluene 2-butanone styrene toluene trichlorofluoromethane 124shytrimethylbenzene and xylenes The levels of VOCs did not exceed ATSDRrsquos available CV levels
During the residential air sampling event the highest detected TCE level was 7 microgm3 This TCE level is more than 70 times lower than MRLIntermediate EMEG CV for TCE of 500 microgm3 and more than 1400 times lower than the ATSDR acute MRL CV for TCE of 10000 microgm3 In addition indoor TCE levels are well below the proposed EPA RfC value of 40 microgm3 and CalEPA Chronic REL value of 600 microgm3 The maximum reported levels of the above mentioned other VOCs did not exceed their respective chronic EMEGMRL values Exposure to reported levels of TCE and other VOCs in indoor air at this site is not expected to cause adverse health effects in children or adults [12 14]
14
The movement of VOCs from subsurface (soil andor groundwater) into an enclosed structure can vary by season Factors that can influence such VOC migration include temperature barometric pressure and precipitation Because of these and other variables VOC concentrations in samples collected during a single sampling event may not accurately represent year-round conditions [14] Therefore PADOH and ATSDR recommend that additional indoor air samples in both the basement and first floor of the homes along Church Road at varying seasons be collected to better determine the potential exposure levels It is the understanding of PADOH and ATSDR that EPA and FWEC are planning to collect additional indoor air samples during the RIFS Additional information on the indoor air and the vapor intrusion pathway are discussed in the Contaminant Evaluation Section below
Exposure Scenarios and Dose Calculations Estimating an exposure dose requires identifying how much how often and how long a person may come in contact with some chemical in a specific medium (air water soil) PADOH and ATSDR calculated estimated exposure doses for the site The equation used to estimate exposure doses from ingestion of TCE in water is below
Equation 1 Exposure Dose Equation for Ingestion
D = C times IR times EF times CF BW
Where D = exposure dose (mgkgday) C = chemical concentration (μgL) IR = intake rate in liters per day (Lday) EF = exposure factor (unitless = 2) CF = conversion factor 1times10
-3
(mgμg) and BW = body weight in kilograms (kg)
Doses from ingestion inhalation and dermal contact with TCE at residential locations for both adults and children for past exposures are shown in Table 5 below The doses are presented in units of milligrams of TCE per kilogram of body weight (mgkgday) based on the average TCE concentration (584 microgL) during the 2004 residential well sampling data The exposure dose calculations assume that exposure occurred in a residential setting that exposure was continuous (24 hours per day 365 days per year) and all water consumed was from affected wells Exposures are assumed to have occurred over a 30 year timeframe Adult doses are estimated assuming a person drinks 2 liters of water per day (from the household source) and weighs 70 kg (154 pounds) Doses for children assume 1 liter per day and a weight of 16 kg (35 pounds) In addition to the oral dose from affected drinking water a person may also absorb TCE directly from contaminated water through the skin (dermal dose) and breathe the compound in the air (inhalation dose) These secondary exposures to the TCE in drinking water essentially represent a doubling of the ingestion dose (or an exposure factor of 2)
Table 5 ndash Past exposure past dose for ingestion inhalation and dermal contact to TCE
Body Weight (kg)
Ingestion Rate (Lday)
Exposure Factor
Average TCE (microgL)
Exposure Duration
Dose (mgkgday)
Adult 70 2 2 584 30 years 00033
Child 16 1 2 584 30 years 00073
15
Public Health Implications
Cancer Effects
There are several reports of an increased occurrence of cancer from ingestion and inhalation of TCE by animals and humans [12] Human health studies suggest an increased incidence of cancer of various types (eg bladder lymphoma kidney respiratory tract cervix skin liver and stomach) from exposure to TCE however no studies provide clear unequivocal evidence that exposure is linked to increased cancer risk in humans[12] The available studies suffer from inadequate characterization of exposure small numbers of subjects and the fact that subjects were likely exposed to other potentially carcinogenic chemicals There is however sufficient evidence that TCE exposure results in cancer development in animals although animal studies may not be relevant for evaluating health hazard to humans [12]
In 1989 EPA withdrew its cancer assessment for TCE which was based primarily on animal studies because more recent pharmacokinetic and mechanistic data for TCE became available [22] An updated approach to TCE cancer assessment using existing animal data and state-of-the-science papers has been proposed [22] This approach which is supported by high-dose animal studies does not appear entirely relevant for evaluating the health hazard of low-dose human environmental exposures for several reasons First cancer in animals appears to result from species-specific mechanisms that are not entirely relevant to humans [12] Second the animals used in these studies were exposed to very high doses of TCE compared to those at the FWECChurch Rd TCE and the overall death rate in the animal studies was high The surviving animals were not likely to have been in good health and therefore would have been more susceptible to adverse effects from TCE exposure (like infections and illnesses) than healthy animals Third the overall findings from animal studies are inconsistent some studies report an increased incidence of cancer while an equal number do not report an increase at similar levels of exposure Fourth the studies used pure TCE and did not evaluate the effect of exposure to stabilizers and impurities in TCE these things may also be carcinogenic [12]
Based on the exposure doses calculated presented in the previous section PADOH and ATSDR computed a theoretical excess cancer risk based on EPArsquos cancer slope factor (CSF) A CSF is an estimate of possible increases in cancer cases in a population A CSF is expressed in dose units [(mgkgday)-1] to allow for comparison with calculated oral doses Only adult doses are used to estimate cancer risk because the risks are based on lifetime exposures Child exposures and intakes occur over a small portion of the assumed lifetime It should be noted that the theoretical cancer risk does not predict if an exposed person will get cancer [9] Again because the user of a TCE contaminated water supply would also have exposure through inhalation as TCE volatilizes into the air inhalation exposure must be included as part of the exposure Most of this inhalation exposure takes place during and after showering as time spent in the bathroom To consider both pathways of exposure and their additive effect we double the (x 2) ingestion For potential carcinogenic health effects (from past exposure) the doses are multiplied by the contaminant-specific cancer slope factor (Table 6) to determine the theoretical excess cancer risk
Equation 2 Estimation of Theoretical Excess Cancer Risk
CR = D x CSF x EY70 years
ndash1
Where CR= Theoretical cancer risk D= dose (mgkgday) CSF = Cancer Slope Factor (mgkgday) and EY=
Exposure years (30 years)
16
The theoretical excess cancer risks in Table 6 below represents the expected increase in cancer risk due to (past) exposure to TCE Note that the TCE cancer risks in Table 6 include estimated excess risk calculated with two different cancer slope factors a lower bound value (04 (mgkgday)-1) or more conservative and an upper bound (002 (mgkgday)-1) or less conservative value The EPA TCE Health Risk Assessment has identified several cancer slope factors with most between 2x10⁻² and 4x10⁻¹ per mgkg-d [21] As there is no scientific consensus on a specific CSF the EPA recommends using a range of CSFs and presenting a range of estimated excess cancer risks Consequently the highest estimated excess cancer risks due to 30 years of TCE exposure range from about 572E-04 or 572 excess cancers in 10000 exposed to about 780E-05 or 78 excess cancers in 100000 exposed
Table 6 ndash Excess theoretical cancer risk calculations for ingestion inhalation and dermal exposure
Cancer Slope Factor (mgkgday)-1
Adult Dose (mgkgday)
Theoretical Excess Cancer Risk
04 (Lower bound) 00033 572E-04
002 (Upper bound) 00033 780E-05
The theoretical cancer risk can never be zero (ie any exposure to a carcinogen could potentially have some cancer risk) so exposures are described in terms such as low moderate or high risks For example exposures that could cause one additional case of cancer in a population of one million are considered to have a slight cancer risk while exposures that could cause one additional case in 10000 have a low cancer risk All of the uncertainties and conservative exposure assumptions associated with the dose calculations are included in the risk estimation as well as the uncertainty in deriving the cancer slope factor [21] The risk estimates in Table 7 cannot be interpreted as evidence that any of the ldquositerdquo receptors will develop cancer as a result of TCE exposure The highest theoretical excess cancer risk (calculated using the highest cancer slope factor and assuming 30 years of exposure) of approximately 572E-04 risk fall within the range of low increased risk as presented in the table of risk category definitions on the following page [22] These low risk estimates indicate that TCE exposure in the Affected Area currently is not likely to cause an observable increase in cancers In addition since the residents do not currently use the groundwater for drinking the theoretical cancer level is likely much lower
Risk Category Definitions
Category Theoretical Excess Cancer Risk
No Increased Risk lt1E-05
No Apparent Increased Risk 100E-06
Low Increased Risk 100E-04 Moderate Increased Risk 100E-03
High Increased Risk 100E-02
Very High Increased Risk gt1E-02
17
Non-cancer Effects
ATSDR has derived a health guideline of 02 mgkgday for ingestion of TCE based on an acute-duration (less than 14 days) study showing developmental and behavioral changes in mouse pups administered 50 mgkgday of TCE In this study the TCE was dissolved in oil and administered by stomach tube [22] The findings of this study are not entirely relevant for evaluating health hazard for Area B site neighbors exposed to TCE in well water for several reasons First gavage doses in the animal study were administered as one large dose per day while residents in Affected area were likely to have been exposed to TCE in drinking water several times a day The body handles a single large dose much differently than it does a series of small estimated TCE doses as described in the previous section Second the total dose entering the body is higher and maintained for a longer time when TCE is dissolved in oil than when it is dissolved in water Lastly exposure to TCE in the animal study lasted less than 14 days while maximum exposures at the site may have occurred over a period of many years For ingestion EPA has set a maximum contaminant level (MCL) of 5microgL in drinking water The World Health Organization (WHO) recommended drinking water limit for TCE is 30 microgL [14] Although residential well sampling data did exceed the current EPA MCL consumption of residential well water is not a current pathway of exposure Despite these limitations the estimated exposure doses in the Affected area from past exposure to well water (000333 mgkgday for adults and 00073 for children mgkgday) are much lower than doses documented in the literature for adverse non-cancerous health effects and in the above referenced ATSDR health guideline
For non-cancerous health effects from inhalation PADOH and ATSDR compared the air sampling data to the ATSDR MRL EPA Inhalation reference concentrations (RfCs) and California EPA (CalEPA) reference exposure level (REL) for TCE The EPA RfC of 40 microgm3 is based on the critical effects in the central nervous system liver and secretion system and is the concentration in air below which non-cancerous harmful effects are unlikely over a lifetime exposure (ie 70 years) The REL is a concentration at or below which adverse health effects are not likely to occur [15] The highest TCE level observed in the residential vapor intrusion was 7 microgm3 in the residence with a broken sewer pipe and 18 microgm3 the next highest concentration Therefore based on the limited vapor intrusion air sampling at this time PADOH and ATSDR do not expect these levels to harm peoplersquos health Additional sampling data will better delineate exposure levels and the potential for adverse health effects associated with vapor intrusion of TCE
Contaminant Evaluation This section provides more information on the chemicals detected during the sampling events The majority of information summarized below including context for how the levels for the various CVs were developed has been extracted from ATDSRrsquos chemical-specific Toxicological Profile for TCE For more information about each chemical please refer to these online profiles at httpwwwatsdrcdcgovtoxprofilestp19html
As explained in the above sections based on the sampling data evaluated by PADOH and ATSDR exposure to the levels of TCE in indoor air groundwater and surface water would not be expected to cause adverse health effects That being said the adverse health effects documented in the toxicological literature and summarized here are based on much higher levels than were observed in communities along Church Road and are usually based on occupational exposures in humans or laboratory animal studies Some studies with mice and rats have suggested that high levels of TCE may cause liver kidney or lung cancer Some studies of people exposed over long periods to high
18
levels of trichloroethylene in drinking water or in workplace air have found evidence of increased cancer Although there are some concerns about the studies of people who were exposed to TCE some of the effects found in people were similar to effects in animals
An overview of the vapor intrusion pathwayindoor air and the potential health effects associated with inhalation of TCE is discussed Although the levels of TCE in indoor air are not at levels that would result in health effects the vapor intrusion sampling events are very limited and additional samples from indoor air and sub-slab soil would better delineate the TCE levels and the potential residential exposures Lastly it is important to note that simply being exposed to a hazardous substance does not make it a hazard The magnitude frequency timing and duration of exposure and the toxicity characteristics of individual substances affect the degree of hazard if any
TCE
Trichloroethylene (TCE) is a nonflammable colorless liquid at room temperature with a somewhat sweet odor and a sweet burning taste TCE is mainly used as a solvent to remove grease from metal parts to make other chemicals and can be found in some household products including wood stains typewriter correction fluid varnishes lubricants paint removers adhesives and cleaners TCE can also be found in industrial settings in homes undergoing renovations and in homes using private wells located near TCE disposal or contamination sites in which TCE vapors seep through basement structures and cracks [10] TCE was once used as an anesthetic for surgery [12]
TCE has been found in ambient air surface water and groundwater TCE is heavier than water and therefore is likely to move downward through the subsurface into groundwater and can persist in groundwater due to high solubility Biodegradation of TCE under anaerobic conditions is slow making TCE relatively persistent in subsurface waters In settings where groundwater charges surface water contaminated groundwater can lead to contaminated surface water and sediment TCE can volatilize from water at a rate that depends on temperature water movement and aeration When released into the air TCE may be moderately degraded through reaction with photochemically-produced hydroxyl radicals to then form phosgene dichloroacetyl chloride and formyl chloride The half-life of TCE in air is approximately 7 days
An EPA Groundwater Supply Survey of 945 drinking water systems nationwide using groundwater sources found TCE in 91 water systems or 10 with a median level of approximately 1 μgL [12] TCE has been detected in outdoor air at concentrations of 016 microgm3 in ruralremote areas 248 microgm3
in urbansuburban areas and 647microgm3 in areas near industrial emission sources of TCE [12] In addition a survey of indoor air showed median concentrations of TCE as high as 27 microgm3 in a North Carolina office building 074 microgm3in a Washington DC school and 082 microgm3 in a Washington DC home for the elderly [12]
Exposure to TCE is associated with a number of potential health effects including neurotoxicity immunotoxicity developmental liver kidney and endocrine effects In experimental rodent studies high doses of TCE administered to mice resulted in tumors of the lungs liver and testes The effects reported at high levels include liver and kidney damage and changes in heart beat The levels at which these effects occur in humans are not well characterized Animals that were exposed to moderate levels of TCE had enlarged livers and high-level exposure caused liver and kidney damage [12] Based on the limited data in humans regarding TCE exposure and cancer and evidence that high doses of TCE can cause cancer in animals the International Agency for Research on Cancer (IARC)
19
and the WHO have determined that TCE is probably carcinogenic to humans Many studies reviewed by the IARC examined the relationship between TCE exposure and kidney and liver cancer mortality or incidence [11] The EPA Integrated Risk Information System (IRIS) is currently producing an assessment of TCE and will include analysis of noncancerous and cancer effects IRIS is a human health assessment program that evaluates quantitative and qualitative risk information on effects that may result from exposure to environmental contaminants [17]
Vapor Intrusion
Vapor intrusion (VI) a rapidly developing field of science and policy is the migration of volatile organic compounds (VOCs) from the subsurface into overlying buildings through the basement foundation and cracks (see the figure below) VOCs in buried wastes andor contaminated groundwater can emit vapors that may migrate through subsurface soil and into air spaces of overlying building or homes through volatilization and move to other levels and areas of the home Inhalation exposures are not limited to buildings with basements but can also occur for slab-on-grade and suspended floor (or crawl-space) designs as well In most cases chemical concentrations of VOCs are low or depending on site-specific conditions vapors may not be present at detectable concentrations VI of TCE can be a public health concern because TCE is readily absorbed by the lungs [13] It is important to note that exposure to VOCs due to vapor intrusion does not necessarily mean that adverse health effects will occur Whether or not a person experiences health effects depends on several factors including the length of exposure (short-term or acute versus long-term or chronic) the amount of exposure (ie dose) the frequency of exposure the toxicity of the chemical and the individuals sensitivity to the chemical [14]
Overview of Vapor Intrusion Pathway
20
A complicating factor in evaluating the potential risk from vapor intrusion is the potential presence of some of the same chemicals at or above background concentrations In addition to contaminated groundwater indoor air can be contaminated with VOCs due to the wide use in household chemicals and other products such as cigarette smoke paint wood stoves scented candles floor wax perfumes pesticides off-gassing from new furniture and automotive exhaust from an attached garage Similarly VOCs can be in the outdoor air that enters a home or place of business from certain commercial and industrial facilities such as gasoline stations and dry cleaners Vehicle exhaust is another example of VOCs in outdoor air Indoor and outdoor sources of VOCs can make evaluating VI migration complicated [14]
Soil vapor also referred to as soil gas is the air found in the pore spaces between soil particles Soil vapor containing VOCs can enter a building through cracks or perforations in slabs or basement floors and walls Underground conduits such as sewer lines and utility pipes fractures in bedrock or cracks in the basement slab can serve as preferential pathways for vapor migration into the home In addition heating ventilation or air-conditioning (HVAC) systems andor the operation of large mechanical appliances (eg exhaust fans dryers etc) may create a negative pressure that can draw soil vapor into the building Predicting the extent of soil vapor contamination from soil or groundwater contamination as well as the potential for human exposure from soil vapor intrusion into buildings is complicated by factors that can affect soil vapor migration and intrusion For example soil vapor contaminant plumes may not mimic groundwater contaminant plumes since different factors affect the migration pattern of each medium [18]
Indoor air sampling provides the most direct estimate of potential inhalation exposures to residents [14] However indoor air sampling data are subject to vast variation due to seasonal variations changes in the HVAC contaminant biodegradation processes contaminant migration and the presence of VOCs in indoor air from home products Other types of sampling data that can be used to address VI issues include using sub- slab (ie soil vapor samples immediately beneath the foundation or slab of a building) soil vapor samples (ie soil vapor samples not beneath the foundation or slab of a building) or groundwater to indoor air attenuation modelsfactors These sampling data types provide an indirect measurement of potential indoor air level and can depend on building characteristics chemical type soil type depth of the source time of year and a host of other factors Potential vapors can be reduced or eliminated through engineered controls and containment systems (sub-slab deshypressurization soil vacuum extraction vapor barriers) ventilation systems (building pressurization indoor air purifiers) avoidance (temporary or permanent receptor relocation) removal actions to reduce the concentrations of subsurface chemicals sealing preferential pathways and installation of sub-slab vapor mitigation system similar to the type used for radon gas control [14]
In November 2002 the EPA Office of Solid Waste and Emergency Response (OSWER) issued a draft guidance for Evaluating the Vapor Intrusion to Indoor Air Pathway from Groundwater and Soils (Subsurface Vapor Intrusion Guidance) The draft provides technical and policy recommendations and guidance on conducting a screening evaluation to determine if the vapor intrusion pathway poses an unacceptable risk to human health at cleanup sites In the document EPA recommends a site-specific evaluation be performed simultaneously with the subsurface assessment such as the collection of sub-slab soil vapor if indoor air concentrations exceed target levels [14] To evaluate carcinogenic effects of TCE for site-specific assessments a TCE level in air of 12microgm3 would represent an upper bound life-time cancer risk to an individual of 10-6 (or no apparent increased risk) and a TCE level in air of 120 microgm3 would correspond to the lower bound life-time cancer risk to an individual of 10-4 (or low increased risk) The TCE air levels were derived based on residential scenario of exposure (24
21
hoursday 350 daysyear) for 30 years averaged over a 70 year lifetime In addition to the proposed EPA Rfc value of 40 microgm3 for TCE the OSWER also identified two values in evaluating systemic toxicity at a site from vapor intrusioninhalation exposure [14] The first developed by the New York State Department of Health (NYSDOH) of 10 microgm3 is based on laboratory data and reports in occupational exposures The second value is a chronic reference exposure level (REL) of 600 microgm3
developed by CalEPA based on self-reported neurological effects from occupational exposures [14] The limited site-specific indoor air sampling for TCE (maximum value of 7 microgm3) was below the above mentioned comparison values (ie EPA Rfc of 40 microgm3 NYSDOH value of 10 microgm3 and CalEPA REL of 600 microgm3)
Cancer Incidence Data Analysis
Due to community concerns about potential elevated disease rates in the community PADOH and ATSDR reviewed the available cancer incidence data for the community to determine if there are an excess number of cancer cases currently associated with exposure to TCE
Sources of Data
The Commonwealth of Pennsylvania maintains health outcome databases including vital statistics and cancer registries [19] For this HC The Pennsylvania Cancer Registry (PCR) provided PADOH Bureau of Epidemiology Division of Community Epidemiology with cancer incidence data for a twelve-year period (1996-2007) for all reportable cancer sites (Table 7) Multiple-year data are generally used in analyses because cases collected in a single year are subject to a large amount of chance variation from year-to-year The health outcome analysis centers the population data around the available US Census data which occurs every ten years with the most recent Census occurring in 2000
The PCR relies on coding sites and histology using International Classification of Disease (ICD) system specifically using the ICD Oncology Code 3rd edition (ICD0-3) This data is submitted to the PADOH Bureau of Health Statistics and Research [20] The Registry receives monthly reports from all acute care hospitals and pathology laboratory electronically and represents cancer incidence rates The PCR also incorporates cancer mortality using ICD 10th revision codes (ICD-10) when the underlying cause of death is determined to be cancer For this HC the number of cancers refers to the number of primary sites reported not the number of people Although some individuals may have more than one cancer during the period of interest in general the number of primary sites is expected to be relatively similar to the number of persons with cancer
To detect increases in cancer risk for a relatively rare cancer the population of a ZIP Code needs to be large enough to reliably calculate and compare the relevant cancer incidence rates and to rule out fluctuations in cancer rates due to chance variation The 18707 ZIP code has an approximate population of 16000 persons and geographically includes but is not limited to in whole or in part to the neighborhoods areas and communities of Albert Fairview Heights Glen Summit Lindbergh Mountain Top Nuangola Nuangola Station Penobscot Pine View Reilly Rippletown Rita Slocum Slocum Corners Welch Corners and Wright The ldquoobserved casesrdquo (or study area) for the entire ZIP code represents the number of cancers reported for Mountaintop The ldquoexpected casesrdquo (or comparison area) represent the number of expected cases if the study area had experienced rates of cancer similar to the rest of Commonwealth of Pennsylvania as a whole during the same timeframe
22
Methods
A statistical analysis was conducted for all cancers combined and for specific cancer sites for males females and total (males amp females combined) To determine whether there is an excess of cancer in the community the observed number of cancers in the Mountain Top ZIP code were compared to the ldquoexpectedrdquo number of cases based on the Commonwealth of Pennsylvania data during the same timeframe The cancer rate for the Commonwealth as a whole was used to calculate an expected number of cancer rates that would have hypothetically occurred in the study ZIP codes over the same period of time The observed cases theoretically should not vary significantly from the Commonwealth data as a whole The information was further standardized to eliminate possible effects due to differences in race gender and age between the study area and the rest of the Commonwealth Statewide sex gender and site-specific incidence rates were multiplied by age-groups (0-4 5-14 15- 24 hellip 85+ years) The statistical significance of the indirectly age-adjusted incidence rates was calculated in accordance with the methodology recommended by Selven et al [20]
The evaluation of cancer incidence was performed using the Standard Incidence Ratio (SIR) or the ratio of the observed number of cancer incidence divided by the expected number (OE) A SIR ratio of 10 indicates that the number of cases observed in the population is the same as the expected or Commonwealth rate A SIR ratio greater than 10 indicates that more cases occurred than expected and a ratio less than 10 indicates that fewer cases occurred than expected Accordingly a ratio of 15 is interpreted as 50 more cases than expected and a ratio of 09 indicates 10 fewer cases than would be expected [20]
The Z-score a tool used to determine statistical significance indicates how far and in what direction the observed rates deviate from the mean expressed in units of standard deviation Z-scores are utilized to help rule out the possibility that the results are due to chance variation A Z-score of 196 equates to a 95 level of statistical significance or a 1 in 20 chance that the results are due to random variation alone (plt005) The 95 CI is the range of estimated ratio values that has a 95 probability of including the true ratio for the population and is a statistical measure of precision Statistically significant means there is less than 5 chance that the observed difference is merely the result of random fluctuation If a confidence interval Z-score is above + 196 it implies there is a statistically significantly higher rate than would be expected Similarly if the confidence interval Z-score is below - 196 then the number of cases is statistically significantly lower than expected [20]
Results
PADOH and ATSDR reviewed the cancer incidence health outcome data analysis for the Mountaintop community for all reportable cancers from 1996-2007 (Tables 5) The cancers most likely based on current scientific knowledge related to or associated with exposure to TCE in drinking water are hepatic (liver) and renal (kidney) cancer However the toxicological profile for TCE carcinogenicity and specific target organs is still somewhat less well-developed than those for certain other compounds
Mountaintop had zero reported cases of liverintrahepatic bile duct cancer compared to 1122 expected cases based on Commonwealth as a whole data In other words the incidence rate of liver cancer in the Mountaintop community was less than expected and statistically significant less than expected with a Z-score of -338 A Z-score of 196 equates to a 95 level of statistical significance or a 1 in 20 chance that the results are due to random variation alone (plt005) A Z-score greater than 196 the
23
difference between the observed and expected values is probably due to some other set of factors and unlikely a result of chance variation For kidney and renal pelvis cancers there were 31 cases in Mountaintop compared to an expected 312 cases based on the Commonwealth population Therefore the number of kidney and renal pelvis cancers in the community is not elevated and is similar to rates observed in the Commonwealth as whole
Overall during the 1996-2007 reporting years the total number of cases for all reportable cancers in Mountaintop (952) was significantly less than the expected number of cases (107142) based on Commonwealth as a whole data In other words the number of cancer cases in the community was less than expected and statistically less than expected with a Z-score of -404 Thyroid cancer was the only cancer that was statistically elevated in the community with 25 observed cases compared to 2325 expected cases with a resulting Z-score of +316 (statistically elevated in females and total population but not in males) However based on the current scientific literature and data thyroid cancer is not believed to be associated with exposure to TCE Lastly several other cancers were statistically less than expected in the Mountaintop community including larynx bronchuslung breast cervix prostate non-Hodgkin lymphoma and multiple myeloma Therefore based on a review of the available cancer incidence data PADOH and ATSDR did not observe elevated levels of cancer in the Mountaintop ZIP code with the exception of the above-mentioned thyroid cancer data However cancer incidence data is not without limitations and a summary of such limitations is discussed in detail in the next section
Limitations of Cancer Incidence Data
Cancer is a common illness and its occurrence in a population increases with age Depending on the type of cancer a population with no known environmental exposure could be expected to have a substantial number of cancer cases Approximately 1 in 3 people living in the United States will develop cancer at some point in their lives [21]
Health outcome data evaluations are measures of disease occurrence in a defined population Such evaluations can help to provide an overall picture of community health and can potentially identify or confirm excess disease in a community However there are many limitations like any statistical analysis to using the existing data to examine the relationship between environmental exposures and chronic diseases such as cancer Most of these limitations would make it less likely (as opposed to more likely) that this health outcome data analysis would identify any potentially elevated rates due to TCE exposure Such limitations include
The cancer incidence analysis was based on an analysis of the entire Mountaintop ZIP code However in actuality only a small percentage of the community (in this case 32 homes) were potentially exposed to TCE It is difficult to perform cancer incidence analysis when the sample size is small (ie the population of given area is small) or when the cancer type is very rare Therefore a larger sample size is used and increases the overall confidence in the analysis This issue of adequate sample size is a common problem faced in epidemiology and statistical analysis also referred to as low statistical power
The quality of the information is directly related to the accuracy of the reporting system and under reporting of cases is very possible However in general Pennsylvania is considered to
24
have a highly reliable cancer registry A contaminant can contribute to illness or disease without being reflected in the available health outcome data
Cancer incidence data can only determine whether there is an increased rate of cancer in the ZIP code area Cause and effect relationships cannot be established because other factors that may contribute to the observation such as heredity lifestyle environmental exposures from other sources and occupational exposures are unable to be accounted for
The cancer registry uses only the residence of the individual at the time of diagnosis Information on previous residence and length of residency are not included in the cancer registry Population mobility and changes in population can greatly affect the results of this analysis
Cancer can have a long latency period (ie 30 years) Any elevated incidence rates detected by the analysis provide information on historical exposures potentially related to the site but do not reflect current site conditions or exposure levels and
The interpretation of the SIR has inherent limitations Any conclusions drawn from the ratios depend on both the ratio value and the total number of observed and expected cases Two ratios can have the same value but be interpreted differently For example a ratio of 15 based on 2 expected cases and 3 observed cases indicates a 50 excess in cancer but the excess is actually only a single case However a ratio of 15 based on 200 expected cases and 300 observed cases represents the same 50 excess in cancer but because it is based upon a greater number of cases the estimate is less likely to be attributable to chance
Child Health Considerations ATSDR and PADOH recognize that children are especially sensitive when exposed to many contaminants A childrsquos lower body weight and higher intake rate results in a greater dose of hazardous substance per unit of body weight If toxic exposure levels are high enough during critical growth stages the developing body systems of children can sustain permanent damage PADOH and ATSDR have taken into account the unique vulnerabilities of infants and children to environmental contaminants during the evaluation of this public health issue and the preparation of this health consultation specifically to through possible inhalation to children off-site
There is some data on potential health effects from ingestion of TCE but as discussed further above the levels of TCE are not at levels expected to cause adverse health effects PADOH and ATSDR would not expect health effects in children from the reported level of TCE However further research needs to be conducted to better define potential health effects from exposure to TCE in children [12]
Studies suggest that birth defects may occur when mothers drink water containing TCE People who used water for several years from two wells that had high levels of TCE may have had a higher incidence of childhood leukemia than other people but these findings are not conclusive In another study of TCE exposure from well water increased numbers of children were reported to be born with heart defects which are supported by data from some animal studies showing developmental effects of TCE on the heart However other chemicals were also in the water from this well and may have contributed to these effects One study reported a higher number of children with a rare defect in the
25
respiratory system and eye defects Children listed in the National Exposure Subregistry of persons exposed to TCE were reported to have higher rates of hearing and speech impairment There are many questions regarding these reports due to the small number of children in the study [12]
Developmental experimental animal studies have focused on TCE exposure during pregnancy Observed effects include increased fetal death altered glucose metabolism in brain or behavior in offspring delayed organ and bone development and altered cardiac development Changes in the immune system have been observed in rat offspring exposed to TCE during pregnancy and lactation changes included decreased B cell responses increased delayed-type hypersensitivity responses (involving T lymphocytes) and thymocyte changes in the thymus [12] PADOH and ATSDR evaluated potential childhood exposure to TCE as discussed in the Exposure Scenarios and Dose Calculations Section Based on the dose calculations and the available residential sampling data PADOH and ATSDR would not expect current exposures to harm childrenrsquos health
Conclusions
Based on a review of the sampling and cancer incidence data PADOH and ATSDR conclude the following
1 Exposure to TCE in residential well water is not expected to harm peoplersquos health Residential well water samples collected in 2004 showed levels of TCE above the current Environmental Protection Agencyrsquos (EPA) maximum contaminant level (MCL) for drinking water However since 2004 the residents have been supplied with alternative drinking water and subsequently hooked up to public water supply with the exception of one residential property and are not a current pathway of exposure Ingestion of residential well water represents a past pathway of exposure but long-term well sampling data are not available Guardian wells installed and monitored by EPA and FWEC are located outside the current area of TCE contamination and do not show that the plume has migrated to other residential areas
2 Exposure to TCE levels detected in surface water samples are not expected to harm peoplersquos health TCE was detected in surface water samples collected by EPA above the EPA MCL for drinking water but PADOH and ATSDR do not anticipate the public would be using the surface water for drinking purposes The public however could breathe TCE volatilizing from the surface water However given the measured TCE the processes of diffusion volatilization and the likely exposure durations by the public the resulting levels in the ambient air are not expected to be at levels that could harm peoplersquos health
3 Breathing the TCE levels detected in the residential indoor air samples (to date) is not expected to harm the publics health EPA and FWEC conducted indoor airvapor intrusion sampling at ten residences along Church Road The highest detected indoor air level of TCE was 7 microgm3 This TCE level is more than 70 times lower than MRLIntermediate EMEG CV for TCE of 500 microgm3 and more than 1400 times lower than the ATSDR acute MRL CV for TCE of 10000 microgm3 This residence had a plumbing leak which later repaired resulted in non-detect levels of TCE However since the residential vapor intrusion sampling data is very limited and can fluctuate over time due to various conditions Additional vapor intrusion sampling is recommended if multiple lines of evidence suggest a vapor intrusion potential be
26
performed at homes along Church Road to determine if VI is occurring and if exposure to any detected VOCs could harm peoplersquos health
4 Based on estimated exposure dose calculations for inhalation dermal and ingestion exposure to TCE at the site is not expected to cause an observable increase in cancers and non-cancer health effects PADOH and ATSDR calculated an estimated exposure dose based on the residential well sampling data for TCE collected along Church Road The exposure doses using EPArsquos cancer slope factor (CSF) for TCE were used to compute a theoretical excess cancer risk The highest theoretical excess cancer risk (calculated using the highest EPA cancer slope factor and assuming 30 years of exposure) of approximately 572Eshy04 (or 572 excess cancers in 10000 exposed) falls within the range of low increased cancer risk The estimated exposure dose for both adults and children were below levels documented in the scientific literature to show non-cancerous health effects in laboratory animals In addition the since the residents do not currently use the groundwater for drinking the theoretical cancer level is likely much lower
5 Based on a review of the cancer incidence data rates of cancers within the Mountaintop ZIP code were generally not statistically elevated compared to the Commonwealth population as a whole PADOH and ATSDR reviewed the Pennsylvania Cancer registry data for the Mountaintop community for the all reportable cancers for the years 1996 to 2007 The analysis indicated no statistically elevated rates for specific cancers that are thought based on current scientific literature and sources to be potentially associated with TCE exposure (eg hepatic - liver renal - kidney) Overall the rates of all reportable cancers for the community were less than and statistically significant the expected rates based on Commonwealth population as a whole The analysis did indicate that the rates for one specific cancer types (Thyroid cancer in females only) were statistically elevated for the Mountaintop ZIP code when compared to the Commonwealth population as a whole However this cancer is not thought or known based on current scientific literature and sources to be potentially associated with TCE exposure or toxicity
27
Recommendations
PADOH and ATSDR recommend that additional indoor air samples in both the basement and first floor of the homes along Church Road at varying seasons be collected to evaluate potential exposure via vapor intrusion
PADOH and ATSDR recommend continued groundwater monitoring to ensure the TCE plume has not migrated to other residential areas
PADOH and ATSDR recommend that EPA and PADEP continue to educate and reach out to the community and local officials on the TCE sampling in the community and residential homes
Public Health Action Plan The public health action plan for the proposed site contains a description of actions that have been or will be taken by PADOH ATSDR and other government agencies at the site The purpose of the public health action plan is to ensure that this health consultation both identifies public health hazards and provides a plan of action designed to mitigate and prevent harmful human health effects resulting from exposure to or breathing of hazardous substances Included is a commitment on the part of PADOH and ATSDR to follow up on this plan to ensure that it is implemented
Public health actions that have been taken include
PADOH conducted a site visit of the former facility and the surrounding community
PADOH met with the PADEP Northeast Regional staff to discuss site background information environmental sampling and community concerns
PADOH attended a meeting with the concerned community members
PADOH and ATSDR produced a fact sheet which was posted on the EPA Foster Wheeler website
PADOH and ATSDR updated the cancer incidence data analysis for Mountaintop PA with data from additional reporting years
PADOH and ATSDR completed this health consultation
Public health action that is currently being implemented or will be implemented
PADOH and ATSDR will provide and discuss this HC with the PADEP EPA and other community members as feasible and appropriate
PADOH and ATSDR will continue to be available to discuss concerns associated with the FWEC and Church Road TCE site with community members and local authorities as appropriate
28
PADOH and ATSDR will provide review and consultation to environmental sampling data if requested and deemed appropriate and issue an appropriate public health response
PADOH and ATSDR will provide education and outreach to the local community and physicians
29
References
1 EPA Region 3 Frequently Asked Questions for FWECChurch Road TCE Site November 2008 httpwwwepaoscorgsites4146filesfwecshychurch20road20fact20sheet20november202008pdf
2 EPA Foster Wheeler Energy CorporationChurch Road TCE NPL site April 2009 httpwwwepagovreg3hscdsupersitesPAD003031788indexhtm
3 EPA News release - Foster Wheeler proposed to the NPL April 2009 httpyosemiteepagovopaadmpressnsfd985312f6895893b852574ac005f1e4062d736ac7b1 a8b438525759200670dc4OpenDocument
4 PADOH Technical Assist Document ndash Foster Wheeler August 2008 httpwwwepaoscorgsites4146filesfoster20wheeler20tce_mountaintop_technical20as sistpdf
5 PADOH Community Factsheet for Foster Wheeler August 2008 httpwwwepaoscorgsites4146filesfoster20wheeler20health20fspdf
6 EPA Foster WheelerChurch Road TCE Site HRS Documentation April 2009 httpwwwepagovsuperfundsitesdocrecpdoc1794pdf
7 EPA Region 3 Newsletter on Emergency Response Action at Foster Wheeler Energy Corporation Church Road TCE site May 2005 httpwwwepaoscorgsites4146fileschurchroad05-01bpdf
8 EPA Region 3 Church Road TCE site Chronology of Work Completed September 2008 httpwwwepaoscorgsites4146filesupdated20cr20timeline20-20revisedpdf
9 EPA Sampling results for Guardian wells through November 2009 for Mountaintop PA shyhttpwwwepaoscorgsites4146filesMountain20Top20
20Guardian20Well20TCE20Laboratory20Results20Through20December2012 202009pdf
10 ATSDR Public Health Assessment Guidance Manual 2005 httpwwwatsdrcdcgovHACPHAmanualtochtml
11 ATSDR Case Studies in Environmental Medicine ndash TCE November 2007 httpwwwatsdrcdcgovcsemtcetcecontentshtml
12 ATSDR Toxicological Profile for TCE September 1997 httpwwwatsdrcdcgovtoxprofilestp19html
13 ATSDR Health Consultation ndash Econocare Cleaners Vapor Intrusion Investigation Green Bay Brown County Wisconsin September 2006 httpwwwatsdrcdcgovHACphaEconoCareCleanersEconocareCleanersHC093006pdf
14 EPA Office of Solid Waste and Emergency Response Interim Recommended TCE Toxicity Values to Assess Human Health Risk and Recommendation for the Vapor Intrusion Pathway Washington DC November 2002 httpwwwepagovwastehazardcorrectiveactioneisvaporhtm
30
15 EPA Teach Chemical Summary ndash TCE September 2007 httpwwwepagovteachchem_summTCE_summarypdf
16 Foster Wheeler Energy Corporation Draft Final Data Gap Analysis for FWEC Church Road TCE site September 2009 httpwwwfweccrcompdfDraftFinalDataGapAnalysisReportSeptember172009pdf
17 ATSDR Health Consultation ndash TMC Cleaner Evaluation follow-up Indoor Air Sampling City of Olympia Thruston County Washington March 2005 httpwwwatsdrcdcgovhacphaTMCcleaners031105-WATMCcleaners031105-WApdf
18 New York State Department of Health Guidance for Evaluating Soil Vapor Intrusion in the State of New York October 2006 httpwwwhealthstatenyusenvironmentalinvestigationssoil_gassvi_guidancedocssvi_mai npdf
19 PADOH Cancer Registry 2010 httpwwwportalstatepausportalserverptopen=514ampobjID=590073ampmode=2
20 ATSDR Health Consultation ndash Health Outcome Data Analysis 1996-2005 Borit Site Borough of Ambler Montgomery County Pennsylvania January 2009
21 ATSDR Cancer Factsheet August 2002 httpwwwatsdrcdcgovcomcancer-fshtml 22 ATSDR Health Consultation - Fort Detrick Area B Groundwater Public Health Assessment
Final Release Evaluation of Drinking Water Well Exposures via Confirmed Off-Site Contamination Fredrick Maryland December 2009
shyhttpwwwatsdrcdcgovHACphaFtDetrickAreaBGroundwaterFortDetrickPHAFinal12-092009pdf
31
Authors Technical Advisors Pennsylvania Department of Health Bureau of Epidemiology Division of Environmental Health Epidemiology Health Assessment Program
PADOH Authors
Christine Lloyd MS Epidemiology Program Specialist
Farhad Ahmed MPH MBBS Program DirectorEpidemiologist
Barbara Allerton MPH RN Epidemiology Research Associate
ATSDR Reviewers
Lora Siegmann-Werner MPH Senior Regional Representative ATSDR Region 3
Alan Parham MPH REHS Technical Project Officer Division of Health Assessment and Consultation ATSDR
33
Figures
Figure 1 ndash Arial view of the former FWEC facility and Church Road TCE Site
34
Figure 2- Sample location of residential private wells along Church Road and up-gradient background well sample location
35
Figure 3 - Location of guardian wells outside the Church Road TCE plume
36
Tables Table 1- Residential private well (Church Rd) and background sampling results for TCE
Sample ID Date Collected TCE ( microgL) Notes
14TD-KSK 1142004 10 Background sample
130_C 9142004 63 142_C 9142004 200 146_C 9142004 420 158_C 9142004 220 166_C 9142004 76 168_C 9142004 600 170_C 9142004 1300 171_C 9142004 1500 ML 172_C 9142004 1400 174_C 9142004 1000 175_C 9142004 1600 178_C 9142004 540 179_C 9142004 820 192_C 9142004 1100 201C-KSP 10162004 190 205C-OF 10182004 1100 ML 207C-KSK 10182004 610 212C-OS 10162004 1000 216C-BSK 10212004 770 218C-BSP 10212004 630 220C-B-OS 10162004 820 222C-B-BTS 10162004 520 224C-B-BTS 10182004 820 234C-OF 10222004 32 238C-BSP 10162004 140 242C-OF 1112004 37 23S-BSP 10182004 260 19E-BSP 10182004 270 25E-BSP 10182004 210 386SMOF 10252004 220 390SM-BSP 11172004 150 CS+G_UKF 10292004 65
Average (minus background) 584
ML= estimated value due to low recovery in matrix spike duplicated and reported concentration may be low
37
Table 2 - Residential well sampling results for VOCs SVOCs and metals
Contaminant
Detection Limit or Minimum (microgL)
Maximum (microgL) CV (microgL)
VOCs Bromodichloromethane lt02 48 EMEG=700 CREG=06 Bromoform lt02 21 EMEG=700 CREG=4 2-Butanone lt02 170 Carbon tetrachloride lt03 29 CREG = 03 Chloroform lt02 44 EMEG=400 Chloromethane lt03 3 Dibromochloromethane lt02 09 EMEG=3000 CREG=04 11-Dichloroethene lt03 08 12- Dichlorobenzene lt03 09 EMEG = 10000 14-Dichlorobenzene lt04 017 EMEG=2000 12-Dichloroethane lt03 38 CREG=04 Dichlorodifluoromethane lt03 47 RMEG= 7000 cis-12-Dichloroethene lt03 11 Intermediate EMEG= 10000 trans-12-Dichloroethene lt03 02 Intermediate EMEG= 7000 12-Dichloropropane lt03 59 EMEG=900 cis-13-Dichloropropene lt01 016 Ethylbenzene lt03 08 Intermediate EMEG=20000 2-Hexanone lt1 031 Methyl tert-butyl ether lt05 023 Intermediate EMEG= 10000 Methylene Chloride lt04 41 EMEG=2000 CREG=5 Tetrachlorethene lt04 18 RMEG=400 Toluene lt03 1 Intermediate EMEG=700 Trihalomethanes (total) lt02 49 MCL = 80 111-Trichloroethane lt03 2 Intermediate EMEG= 700000 Trichloroethylene lt04 270 MCL=5 Trichlorofluoromethane lt02 22 RMEG=10000 112- Trichloro-122-trifluoroethane lt05 11 RMEG=1000000 Xylene (total) lt02 19 EMEG=7000
SVOCs Bis (2-ethylhexyl)phthalate lt5 11 Caprolactam lt5 11 RMEG=20000
Metals Arsenic lt32 10 EMEG=10 CREG=002 Barium lt17 269 EMEG=7000 Cadmium lt04 1 EMEG=400 Calcium lt43 12900 Chromium (total) lt16 022 EMEG=40 (Chromium VI) Cobalt lt1 009 Intermediate EMEG=400 Copper 82 163 Intermediate EMEG=400 Iron lt392 414 Lead lt12 79 MCL=15 Magnesium lt416 2200 Manganese lt12 265 RMEG=2000 Nickel lt24 53 RMEG=700 Potassium lt315 672 Selenium lt22 044 EMEG=200 Silver lt1 15 RMEG=200 Sodium 2350 34800 Vanadium lt1 38 Intermediate EMEG=100 Zinc lt58 826 EMEG=10000
EMEG = Environmental Media Evaluation Guide RMEG= Reference Dose Media Evaluation Guide MCL = Maximum Contaminant Level (EPA)
38
Table 3 ndash Surface water sampling results
Contaminant Detection Limit or Minimum (microgL)
Maximum (microgL)
Acetone lt5 94
Bromodichloromethane lt02 073
Bromoform lt02 25
2-Butanone lt13 17
Carbon disulfide lt05 19
Carbon tetrachloride lt03 039
Chloroform lt02 29
Chloromethane lt03 041
Dibromochloromethane lt012 012
11-Dichlorethane lt03 044
11-Dichlorethene lt03 05 12-Dichloro-1122shytetrafluoroethane 13 12
cis-12-Dichloroethene lt03 89
Dichlorofluoromethane lt03 47
Methyl tert-butyl ether lt05 021
Methylene Chloride lt04 37
Tetrachlorethene lt04 022
Toluene lt03 12
111-Trichloroethane lt03 12
112- Trichloro-122-trifluoroethane lt05 15
Trichloroethylene lt04 160
Trichlorofluoromethane lt02 88
Vinyl chloride lt02 22
39
Table 4 ndash Residentail indoor air (vapor intrusion) sampling resutls
Contaminant Minimum (microgm3)
Maximum (microgm3) CV (microgm3)
Acetone 12 36 Chronic EMEGMRL=30000
Benzene 1 17 Chronic EMEGMRL=10 CREG=01
Carbon Disulfide 27 27 Chronic EMEGMRL= 900
Dichlorodifluoromethane 21 28
Ethylbenzene 069 09 Chronic EMEGMRL=1000
4-Ethyltoluene 1 11
2-Butanone 13 47 Rfc = 5000
Styrene 074 2 Chronic EMEGMRL = 900
Toluene 068 18 Chronic EMEGMRL = 300
Trichloroethylene 042
7 (18 next highest since pipe repaired) Rfc = 40
Trichlorofluoromethane 18 21 Intermediate EMEGMRL=500
124-Trimethylbenzene 099 23
Xylenes (Total) 15 45 Chronic EMEGMRL=200
40
Table 5 ndash Cancer incidence data analysis for Mountaintop 1996-2007
41
- Screened Lowerer Rate (Z-Score less than or equal to- 196)
Cases = Number of newly diagnosed cases during the reporting period Expected = Number of expected cases if study area had experienced average PA state rates during 1996-2007 SIR = Standard Incidence Ratio (observedexpected cases) ST Rate = Average annual state rate per 100000 population during reporting period CR Rate = Average annual crude rate per 100000 population for study area during reporting period ADJ Rate = Average annual age-adjusted per 100000 population for study area during reporting Z-score = Statistical significance of study area compared to state during reporting period (a Z-score of 196 equates to a 95 level of statistical significance or a 1 in 20 chance that the results are due to random variation)
+ Screened Higher Rate (Z-Score greater than or equal to 196)
42
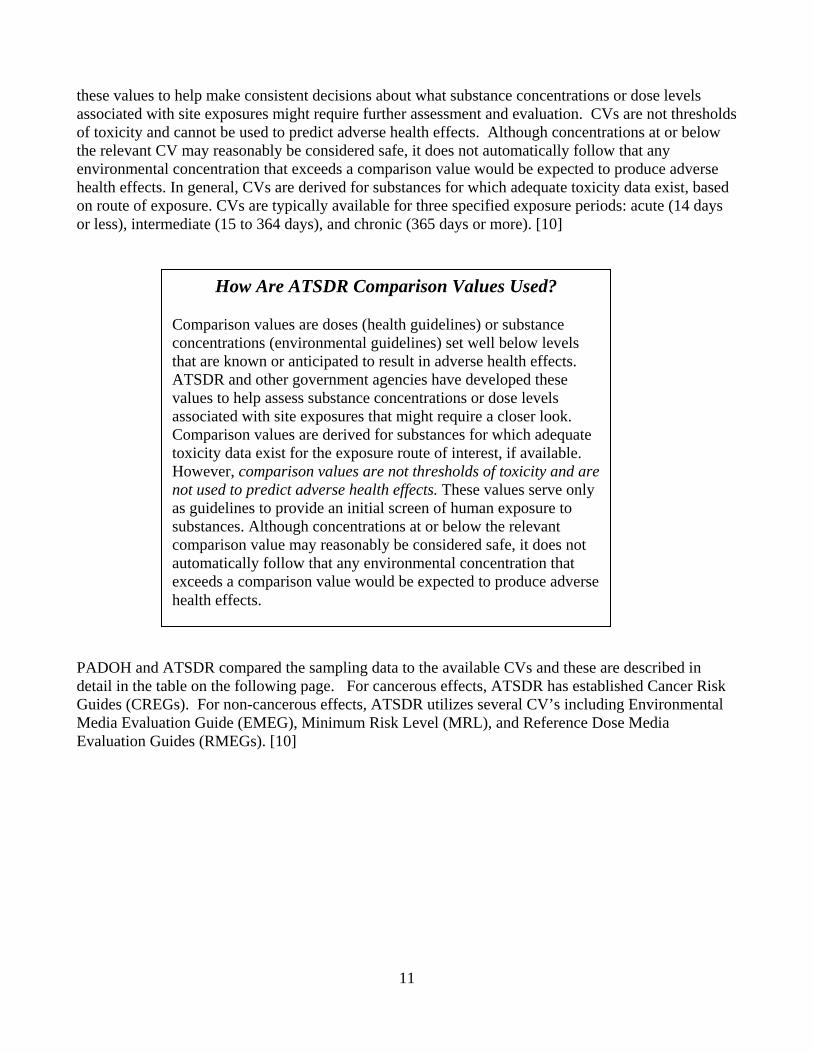
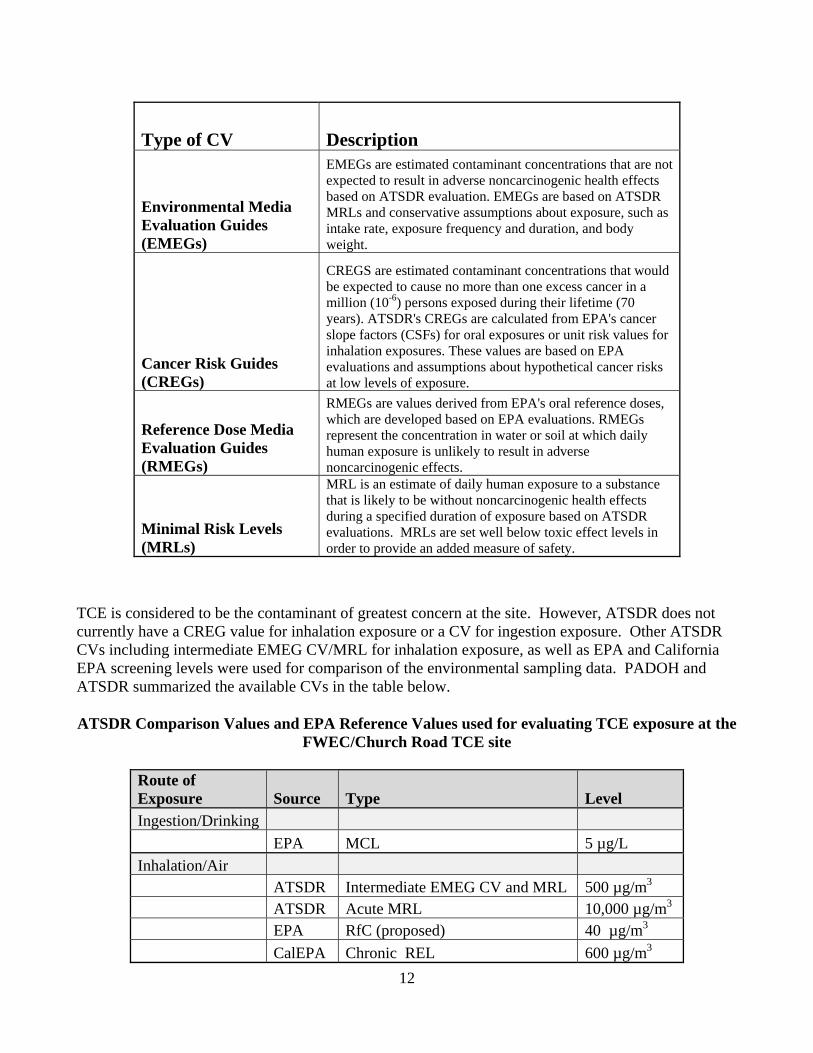
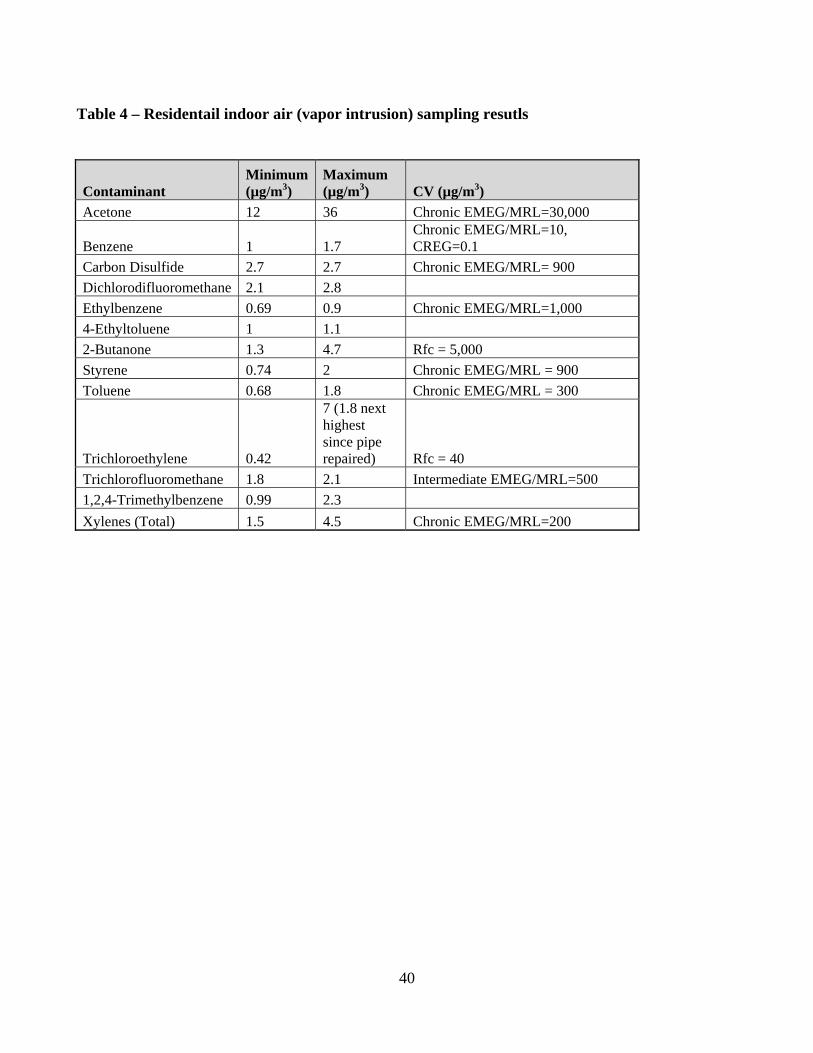