gardner denver q1 2018 earnings...
TRANSCRIPT

Gardner DenverQ1 2018 Earnings PresentationApril 27, 2018

Replay Information
▪ Dial toll-free: +1.877.344.7529
▪ International: +1.412.317.0088
▪ Conference ID: #10119481
▪ Log on to: http://investors.gardnerdenver.com
2

Disclaimer
Forward-Looking Statements
During the course of this presentation, we may make “forward-looking statements” within the meaning of the USfederal securities laws. In fact, all statements made during this presentation other than statements of historical factare forward-looking statements. Words such as “expects,” “anticipates,” “believes,” “estimates,” “plans,” “intends,”“projects” and “indicates” and variations of such words or similar expressions are intended to identify forward-looking statements. Although they reflect our current expectations, these statements are not guarantees of futureperformance, and actual results may differ materially from what is expressed in or indicated by these forward-looking statements. Forward-looking statements are subject to risks and uncertainties that could cause actualperformance or results to differ materially from those expressed in such forward-looking statements, including thoserisks and uncertainties described under the section titled “Risk Factors” in our most recent annual report on form 10-K filed with the Securities and Exchange Commission (“SEC”), which risks and uncertainties may be updated fromtime to time in our periodic filings with the SEC (accessible on the SEC’s website at www.sec.gov). Forward-lookingstatements speak only as of the date the statements are made. The Company does not undertake to update anyforward-looking statements as a result of future developments or new information, except as required by law.
Non-GAAP Financial Measures
Included in this presentation are certain non-GAAP financial measures designed to supplement, and not substitute,the financial information presented in accordance with generally accepted accounting principles in the United Statesof America because management believes such measures are useful to investors. The reconciliation of thosemeasures to the most comparable GAAP measures is detailed in the Appendix to this presentation.
3

Agenda
▪ Highlights
▪ Q1 2018 Financial Performance
▪ Segment Highlights
▪ Full Year 2018 Guidance & Summary
▪ Q&A
4
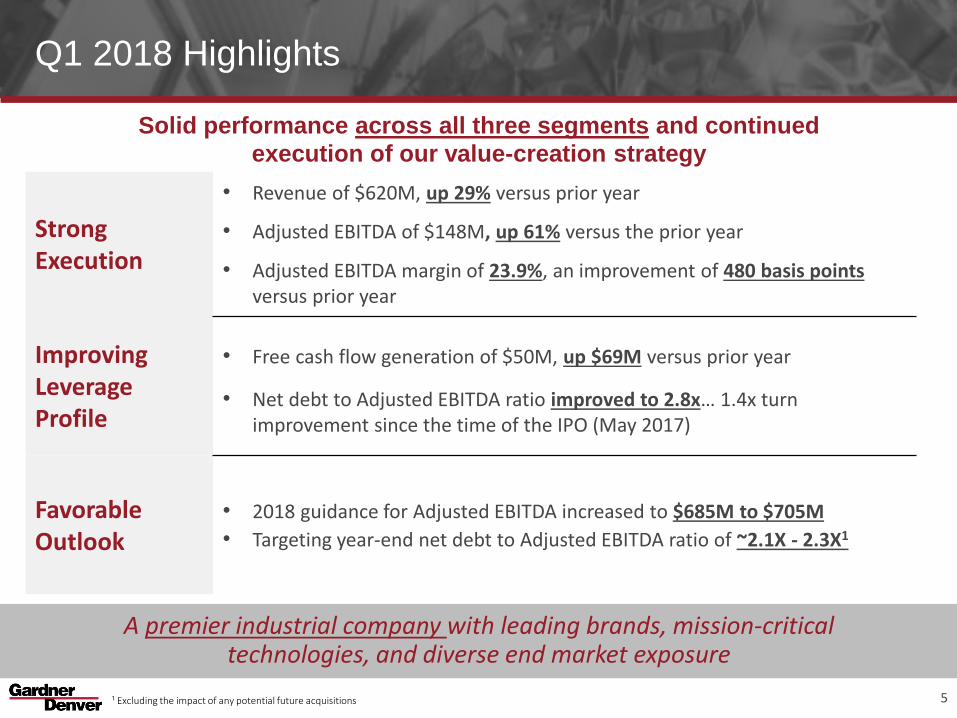
Q1 2018 Highlights
5¹ Excluding the impact of any potential future acquisitions
Strong Execution
• Revenue of $620M, up 29% versus prior year
• Adjusted EBITDA of $148M, up 61% versus the prior year
• Adjusted EBITDA margin of 23.9%, an improvement of 480 basis pointsversus prior year
Improving Leverage Profile
• Free cash flow generation of $50M, up $69M versus prior year
• Net debt to Adjusted EBITDA ratio improved to 2.8x… 1.4x turnimprovement since the time of the IPO (May 2017)
Favorable Outlook
• 2018 guidance for Adjusted EBITDA increased to $685M to $705M
• Targeting year-end net debt to Adjusted EBITDA ratio of ~2.1X - 2.3X1
Solid performance across all three segments and continued
execution of our value-creation strategy
A premier industrial company with leading brands, mission-critical technologies, and diverse end market exposure

Our Strategy
Deploy Talent
Creating a performance driven culture with highly engaged employees
– Creating a great place to work – engagement initiative driving improvement
– Acting like owners – At IPO, awarded 5.5M shares in equity (~$170M current value)1
Continue to enhance expertise and talent in critical functions
Accelerate Growth
Commercializing new products with new sophisticated Demand Generation process
Embedding smart technologies (e.g., iConn) into products
Leveraging investments in emerging markets – “innovation in the region for the region”
Expand Margins
Driving Lean Manufacturing across multiple sites… still in early stages with substantial runway of opportunity
Leveraging spend across organization (e.g., freight, sourcing) to generate further savings
Launched Innovate 2 Value (I2V) program in early 2018 to accelerate value engineering initiatives and drive further margin expansion
Allocate Capital Effectively
Invest in core: new products, new technologies and emerging markets
Reduce leverage: Net Debt-to-Adjusted EBITDA target
Execute disciplined M&A based on clear strategic and financial criteria
6
Strong Foundation, Clear Strategy, Committed Leadership
1 Based on stock price as of 3/31/2018

Q1 Financial Performance

Q1 2018 Financial Performance
82 Adjusted EPS is defined as adjusted net income divided by adjusted diluted average shares outstanding
($M, excl. EPS)
Revenue
$482
$620
Q1 2017 Q1 2018
Adjusted EBITDA1
$92
$148
Q1 2017 Q1 2018
Adjusted EPS1,2
$0.13
$0.38
Q1 2017 Q1 2018
Up 29% Up 61%Margin Up 480 bps
Up 192%
23.9%Margin
19.1%Margin
Q1 2018 Results Reinforce Investment Thesis1 Adjusted EBITDA and Adjusted EPS include $5.6 million insurance recovery benefit for previously expensed legal defense costs

Pro-formaIPO
4.2x
2.9x 2.8x
Q1'17 Q4'17 Q1'18
Q1 2018 Financial Performance
9
Leverage2Free Cash Flow1Working Capital(Op. Working Capital as % of LTM Sales) (Net Debt / LTM Adjusted EBITDA)
($19)
$50
Q1 2017 Q1 2018
Improved 150 bps Up $69M Improved 1.4xSince IPO
¹ Free Cash Flow is defined as cash flows from operations less capital expenditures
30.7%
29.2%
Q1 2017 Q1 2018
Strengthening Financial Position Through Increasing FCF and De-leveraging
($M)
2 Q1 2018 leverage includes the ~$95 million cash consideration paid for Runtech Systems in February 2018

Q1 2018 Segment Performance

Industrials Segment – Q1 Highlights
11
Highlights:
Orders up 18% as reported; up 10% ex-FX
Revenue up 19% ex-FX
Strong broad based orders growth across all three main
product technologies and end markets
Adjusted EBITDA margin up 210 bps benefiting from
continued progress on operational excellence initiativesCycloblower Variable Helix Series
World’s first variable helix screw profile for use in blower technology. Unique profile offers unmatched air efficiency versus comparable products, allowing improved performance in
applications such as waste water treatment and pneumatic conveying.
As Reported
PriorYear
YOYChange
Ex-FX YOY Change
Revenue $316.9 $248.0 27.8% 18.6%
Adjusted EBITDA $66.8 $47.2 41.5% 29.7%
Adjusted EBITDA Margin 21.1% 19.0% 210 bps
Innovation in Action
($M)

Energy Segment – Q1 Highlights
12
Highlights:
Orders up 19% as reported; up 16% ex-FX
Revenue up 33% ex-FX
Upstream revenue up > 50%; mid/downstream up mid-single digits
Upstream orders +21% with strongest growth in original equipment
frac pumps and continued penetration of aftermarket consumables
Adjusted EBITDA margin up 650 bps benefiting from strong
upstream volume growth as well as continued operational
efficiencies
As Reported
PriorYear
YOYChange
Ex-FX YOY Change
Revenue $242.2 $178.3 35.8% 32.6%
Adjusted EBITDA $68.0 $38.5 76.6% 74.6%
Adjusted EBITDA Margin 28.1% 21.6% 650 bps
Nash Dry-Pro Vacuum PumpsSeries of engineered dry screw vacuum pumps for use
in a variety of process industries; provides effluent-free operation, allowing customers to reduce
environmental impact and spending on energy and waste treatment.
Innovation in Action
($M)

Medical Segment – Q1 Highlights
13
Highlights:
Orders up 19% as reported; up 11% ex-FX
Revenue up 1% ex-FX as design wins and new product
penetration leading to positive organic growth
Adjusted EBITDA margin down 10 bps due primarily to
revenue mix between gas and liquid pumps
As Reported
PriorYear
YOYChange
Ex-FX YOY Change
Revenue $60.5 $55.4 9.2% 1.3%
Adjusted EBITDA $15.9 $14.6 8.9% (0.3%)
Adjusted EBITDA Margin 26.3% 26.4% (10 bps)
Gardner Denver Liquid Diaphragm PumpNew platform of liquid handling pumps for use
in in-vitro diagnostics, providing higher efficiency and continuous liquid flow even with
corrosive or abrasive media.
Innovation in Action
($M)

2018 Guidance & Summary

2018 Guidance
▪ Adjusted EBITDA $685M to $705M
▪ Capital Expenditures $65M to $75M
▪ Tax Rate 26% to 28%
▪ Year End Net Debt Leverage1 ~2.1-2.3x
▪ Average Shares Outstanding2 ~210M
152 Represents the full year computation of weighted average shares outstanding and share price as of 3/31/2018
¹ Excluding the impact of any potential future acquisitions

Summary
Strong broad-based start to 2018 with continued growth and margin expansion
29% revenue growth with strong double-digit growth in Industrials and Energy; organic
growth in Medical
Double-digit orders growth across all three segments
480 bps of Adjusted EBITDA margin expansion year-over-year to 23.9%
Leverage reduction to 2.8X
Expecting momentum to continue through balance of 2018
Raising full-year 2018 Adjusted EBITDA guidance
Expecting improved cash flow generation and further reduction to leverage position1
Continued execution of our value-creation strategy … Deploy Talent, Accelerate Growth,
Expand Margins and Allocate Capital Effectively
16¹ Excluding the impact of any potential future acquisitions

Q&A

Appendix

Reconciliation of Net Income/(Loss) and Earnings/(Loss) per Share to Adjusted Net Income and Adjusted Earnings per Share
19
2018 2017
Net Income (Loss) 42.4$ (7.0)$
Basic Earnings (Loss) Per Share (As Reported)1,20.21$ (0.05)$
Diluted Earnings (Loss) Per Share (As Reported)1,20.20$ (0.05)$
Plus:
Provision (benefit) for income taxes 23.4 (1.6)
Amortization of acquisition related intangible assets 28.0 25.8
Sponsor fees and expenses - 1.1
Restructuring and related business transformation costs 4.5 8.6
Acquisition related expenses and non-cash charges 4.6 0.7
Environmental remediation loss reserve - 1.0
Expenses related to public stock offerings 1.4 1.3
Establish public company financial reporting compliance 0.8 1.3
Stock-based compensation 2.7 -
Foreign currency transaction losses, net 2.6 0.6
Shareholder l itigation settlement recoveries (4.5) -
Other adjustments (0.7) 0.5
Minus:
Income tax provision, as adjusted 24.5 12.2
Adjusted Net Income 80.7$ 20.1$
Adjusted Basic Earnings Per Share20.40$ 0.14$
Adjusted Diluted Earnings Per Share2,40.38$ 0.13$
Average shares outstanding:
Basic, as reported 201.6 148.5
Diluted, as reported3209.9 148.5
Adjusted diluted4209.9 150.6
GARDNER DENVER HOLDINGS, INC. AND SUBSIDIARIES
RECONCILIATION OF NET INCOME (LOSS) AND EARNINGS (LOSS) PER SHARE
TO ADJUSTED NET INCOME AND ADJUSTED EARNINGS PER SHARE
(Dollars in millions, except per share amounts)
(Unaudited)
4 Adjusted diluted share count and adjusted diluted earnings per share include incremental
dilutive shares, using the treasury stock method, which are added to average shares outstanding.
1 Basic and diluted earnings per share (as reported) are calculated by dividing net income (loss)
attributable to Gardner Denver Holdings, Inc. by the basic and diluted average shares outstanding
for the respective periods.
2 Basic and diluted earnings per share (as reported) and adjusted basic and diluted earnings per
share for the three months ended March 31, 2018 and 2017 are not comparable due to the
significant change in capital structure as a result of the initial public offering in May of 2017.
For the Three Month period ended
3 Due to net losses in certain periods shown, basic and diluted average shares outstanding are the
same in those periods.
March 31,

Reconciliation of Net Income/(Loss) to Adjusted EBITDA and Adjusted Net Income and CFOA to Free Cash Flow
20
2018 2017
Net Income (Loss) 42.4$ (7.0)$
Plus:
Interest expense 26.0 45.9
Provision (benefit) for income taxes 23.4 (1.6)
Depreciation expense 14.1 12.1
Amortization expense 30.9 27.6
Sponsor fees and expenses - 1.1
Restructuring and related business transformation costs 4.5 8.6
Acquisition related expenses and non-cash charges 4.6 0.7
Environmental remediation loss reserve - 1.0
Expenses related to public stock offerings 1.4 1.3
Establish public company financial reporting compliance 0.8 1.3
Stock-based compensation 2.7 -
Foreign currency transaction losses, net 2.6 0.6
Shareholder l itigation settlement recoveries (4.5) -
Other adjustments (0.7) 0.5
Adjusted EBITDA 148.2$ 92.1$
Minus:
Interest expense 26.0$ 45.9$
Income tax provision, as adjusted 24.5 12.2
Depreciation and amortization expenseDepreciation expense 14.1 12.1
Amortization of non-acquisition related intangible assets 2.9 1.8
Adjusted Net Income 80.7$ 20.1$
Free Cash Flow
Cash flows - operating activities 60.2$ (2.6)$
Minus:
Free Cash FlowCapital expenditures 10.1 16.4
Free Cash Flow 50.1$ (19.0)$
For the Three Month period ended
March 31,
GARDNER DENVER HOLDINGS, INC. AND SUBSIDIARIES RECONCILIATION OF NET INCOME (LOSS) TO ADJUSTED EBITDA AND ADJUSTED NET
INCOME AND CASH FLOWS - OPERATING ACTIVITIES TO FREE CASH FLOW
(Dollars in millions)
(Unaudited)

Reconciliation of Segment Adjusted EBITDA to Income/(Loss) Before Income Taxes
21
2018 2017
Revenue
Industrials 316.9$ 248.0$
Energy 242.2 178.3
Medical 60.5 55.4
Total Revenue 619.6$ 481.7$
Segment Adjusted EBITDA
Industrials 66.8$ 47.2$
Energy 68.0 38.5
Medical 15.9 14.6
Total Segment Adjusted EBITDA 150.7$ 100.3$
Less items to reconcile Segment Adjusted EBITDA to
Income (Loss) Before Income Taxes:
Corporate expenses not allocated to segments 2.5$ 8.2$
Interest expense 26.0 45.9
Depreciation and amortization expense 45.0 39.7
Sponsor fees and expenses - 1.1
Restructuring and related business transformation costs 4.5 8.6
Acquisition related expenses and non-cash charges 4.6 0.7
Environmental remediation loss reserve - 1.0
Expenses related to public stock offerings 1.4 1.3
Establish public company financial reporting compliance 0.8 1.3
Stock-based compensation 2.7 -
Foreign currency transaction losses, net 2.6 0.6
Shareholder l itigation settlement recoveries (4.5) -
Other adjustments (0.7) 0.5
Income (Loss) Before Income Taxes 65.8$ (8.6)$
For the Three Month period ended
March 31,
GARDNER DENVER HOLDINGS, INC. AND SUBSIDIARIES
RECONCILIATION OF SEGMENT ADJUSTED EBITDA TO INCOME (LOSS) BEFORE INCOME TAXES
(Dollars in millions)
(Unaudited)