goal-directed vs “flow-guided- - critical care canada · goal-directed vs...
TRANSCRIPT

Goal-directed vs “Flow-guided-
responsive” therapy
S Magder
Department of Critical Care,
McGill University Health Centre
Flow-directed vs goal directed strategy for management of hemodynamics
S Magder Curr Opin Crit Care 2016; 22: 267-273

Fick Equation
VO2 = Q x (CaO2- CvO2). .
Hb
PO2
HR and SV Requires
mitochondrial
function= oxygen delivery
SHOCK: oxygen consumption is
inadequate flow for metabolic needs

What can increase O2 delivery?
DO2 = Q x Hb x k x Sata. .
Volume
(preload)
↑ Contractility↑ HR
↓Afterload
Blood ↑ PO2
Usually not much gain

1994
1995
1990’s targeted supra-normal values of DO2
Patients did worse1993
Patients did better

What was the difference between the
–ve and +ve trials?• Haye’s and Gattinoni (-ve trials) were in septic (inflamed)
patients
• Boyd’s study was on perioperative high risk surgical pts.
Need to treat septic and perioperative studies differently
• In sepsis therapy is directed at returning values towards
normal
• In perioperative management therapy is directed at avoiding
“downward” drift and loss of normal organ function from
volume loss and vascular depression from anesthesia

“Rivers trial”
ProCESS American 2014
ARISE ANZICS 2014
ProMISe British 2015
Goal-directed era

Mortality Percent Percent
Time(d) Control EGDT Year
Rivers 60 49.2 33.5 2001
ProCESS 60 18.5 21 2014
ARISE 90 18.8 18.6 2014
ProMISe 90 29.2 29.5 2015
EGDT• More fluids• More vasoactive drugs• More PRBC• More organ failure• Longer stay
Decrease in mortality of
control group
Message• We are doing better based on good clinical
judgement• Rather than being “Goal-directed”
monitoring protocols should be used to indicate whether the therapy corrected a problem that the clinician identified
• ie “responsive approach”

High risk surgical pt also improved dramatically(Control pt in GDT Sx studies)
0
5
10
15
20
25
1990 1995 2000 2005 2010 2015 2020
Mo
rtal
ity
(%)
Year
Boyd
Pearce ‘1’
Pearce ‘2’
-ve study

There is no evidence to defend these
“goals”
Goals in Rivers:
–CVP 8-12 mmHg
–Mean BP 65-90
–CvO2 sat ≥ 70%
–Hct ≥ 30
Goals in Surgical studies• Boyd
– mBP 80-110
– Ppao 12-14
– Hb >120
– DO2 – 600 (vol and dopexamine)
• Pearce
– Colloid for maximum SV (LiDCo) (Treated – 1500 ml vs Control 2600 ml)
– Dopexamine at a fixed dose
– Hb ≥ 80 g/L
– mBP 60-100 mmHg
– Sat ≥ 90%

Pra
Q “Plateau”
In the plateau range the normal “Starling”
mechanism is not operative and only HR,
contractility and afterload can change cardiac
output
Goal-directed protocols push patients to the plateau of
the cardiac function curve

We function normally with a
relatively constant volume(except for adjustments in stressed and
unstressed volume)
Flow involves redistributing the volume
and creating pressure differences
across vascular beds
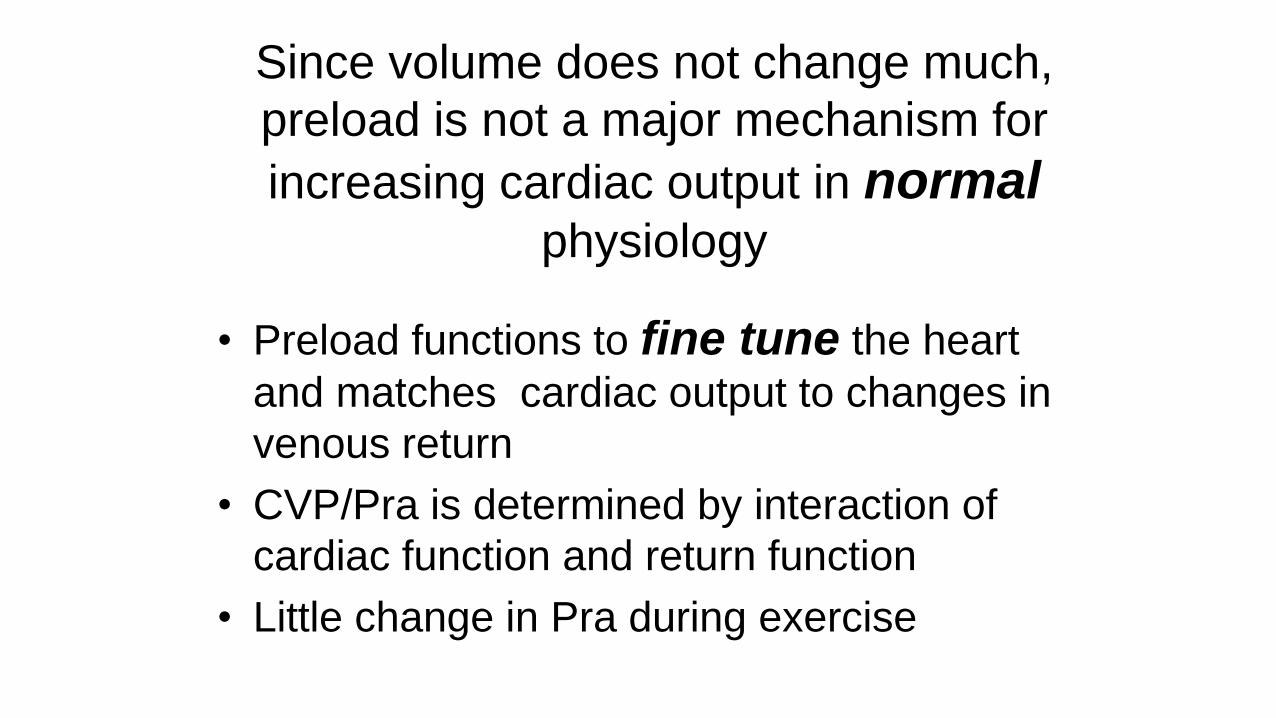
Since volume does not change much,
preload is not a major mechanism for
increasing cardiac output in normal physiology
• Preload functions to fine tune the heart
and matches cardiac output to changes in
venous return
• CVP/Pra is determined by interaction of
cardiac function and return function
• Little change in Pra during exercise

Pra vs
Cardiac
Output
during
incremental
exercise
Notarius et al Am Heart J 1998
35-
30-
25-
20-
15-
10-
5-
0-Ca
rdia
c o
utp
ut (l/m
in)
-5 0 5 10 15 20 25 30 35 40
Right Atrial Pressure (mmHg
No volume needs to
be added to reach
the high cardiac
output at peak
exercise!
Little change in CVP

CVP at “Plateau” (ie non-responsive) is variable
0
10
20
30
40
50
60
cvp 0-5 cvp 6-10 cvp 11-15 cvp 16-20
total
res
non res
Num
ber
of P
t
mmHg
25% 45% 82% 100%
Bafaqeeh & Magder JICM 2007
One size does not fit all!

ScvO2
• Volume could potentially decrease the value by lowering Hb
• Does it really need to by > 70% ?
– Can fall with increased wakefulness/agitation
– Restoration of O2 debt
– Only tells you upper body and not lower

Reactive Flow-Directed Approach

An abnormality (“trigger”) develops that you
believe indicates a decrease in O2 delivery• Change in sensorium
• Decrease in urine output
• Hypotension
• Increase in lactate
• Fall in central venous saturation
You hypothesize that volume may help.
A reactive approach tests the hypothesis.

Where did the volume go?
Septic patient1. Capillary leak
2. Increase in capacitance
3. Lack of regulation of
resistances re-distributes
flow to areas of low need
4. Lack of intake because of
altered sensorium
Surgical patient in OR1. Bleeding
2. Evaporative losses in long
open case
3. Excessive urinary loss
4. Increase in capacitance from
anesthetic

What does volume do for DO2?
• It increases cardiac output by increasing cardiac filling
• If the problem was not fixed you need to know if cardiac output increased
• If yes: give more volume
• If no: 1. Was enough volume given? OR
2. Is the patient not volume responsive and
something else must be done

Fluid Challenge and volume
responsiveness
1 Assess the value
of Pra ( NOT the
wedge).
2 Give sufficient
fluid to raise Pra
by ~2mmHg and
observe Q.
Type of fluid is not of importance if given fast enough
Pra
Q
+ve
-ve
Increase in CVP tells me that
I tested Starlings law

Change in CVP of even 1 mmHg should
be sufficient to test the Starling response
Pra (mmHg)
Q (l/min)
0 10
5
Slope = 500 ml/mmHg/min
plateau

Assessment of cardiac output is the key element in a responsive approach
• Indirect: improvement of: – BP, urine output, sensorium, skin perfusion, lactate, ScvO2 (ie the “trigger”)
• Direct measurement
– many non-invasive products available today but they vary in their accuracy of measurement
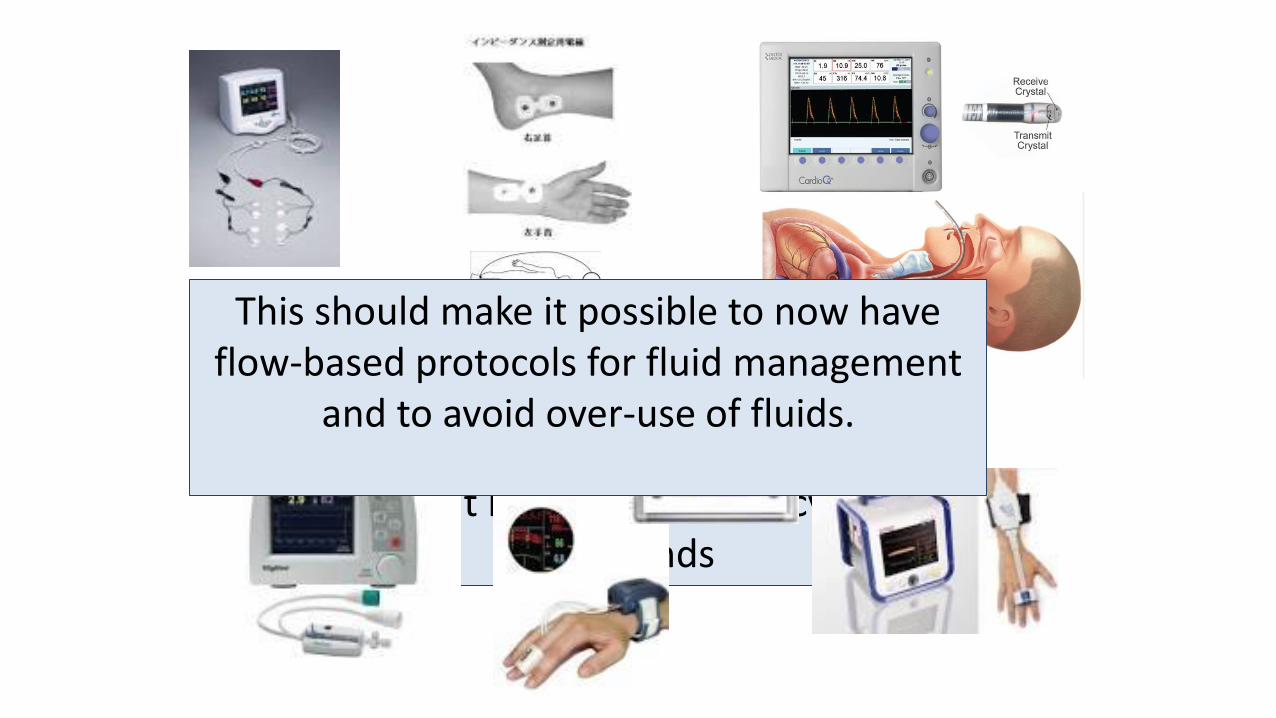
Huge expansion of non-invasive devices to measure cardiac output
They are less precise than the PA catheter but have good accuracy –ie can
track trends
This should make it possible to now have flow-based protocols for fluid management
and to avoid over-use of fluids.

Accuracy vs Precision

Precision vs Accuracy
• Accuracy indicates similarity of measured value to to gold-standard
–Important when value is used as a “trigger”
• Precision indicates that the value is reproducible
– important when value is used for trending
–Accuracy is then not as important

Potter et al J Crit Care 2012
729 Fluid Challenges
> 30 %

The less invasive the device the less the precision
• High precision and accuracy: Pulmonary artery catheter, PiCO (thermodilution), LidCo plus (calibrated with lithium)
• Medium to high: esophageal Dopper
– Velocity and not flow and affected by diameter and angles
– Only descending aorta
– Need to be intubated
• Medium to low: arterial waveform, plethysmographic
• Low finger pulsation devices
The less ill the patient the less need for accuracy-the trend is key
Non-cardiac Sx pt do not need high accuracy – flow is used to indicate the fluid response

Accuracy of 4 devices compared to PA catheter

Devices tested tracked changes very well(good precision)
• Pts post cardiac surgery
• PA catheter and low invasive devices
• 18 to 24 hr post surgery
• Received multiple interventions – fluid
boluses, NE, Epi, Dobutamine, Nitroprusside
Pulse pressure based Plethysmographic based
Zero slope indicates that the 2 devices tracked each other very well
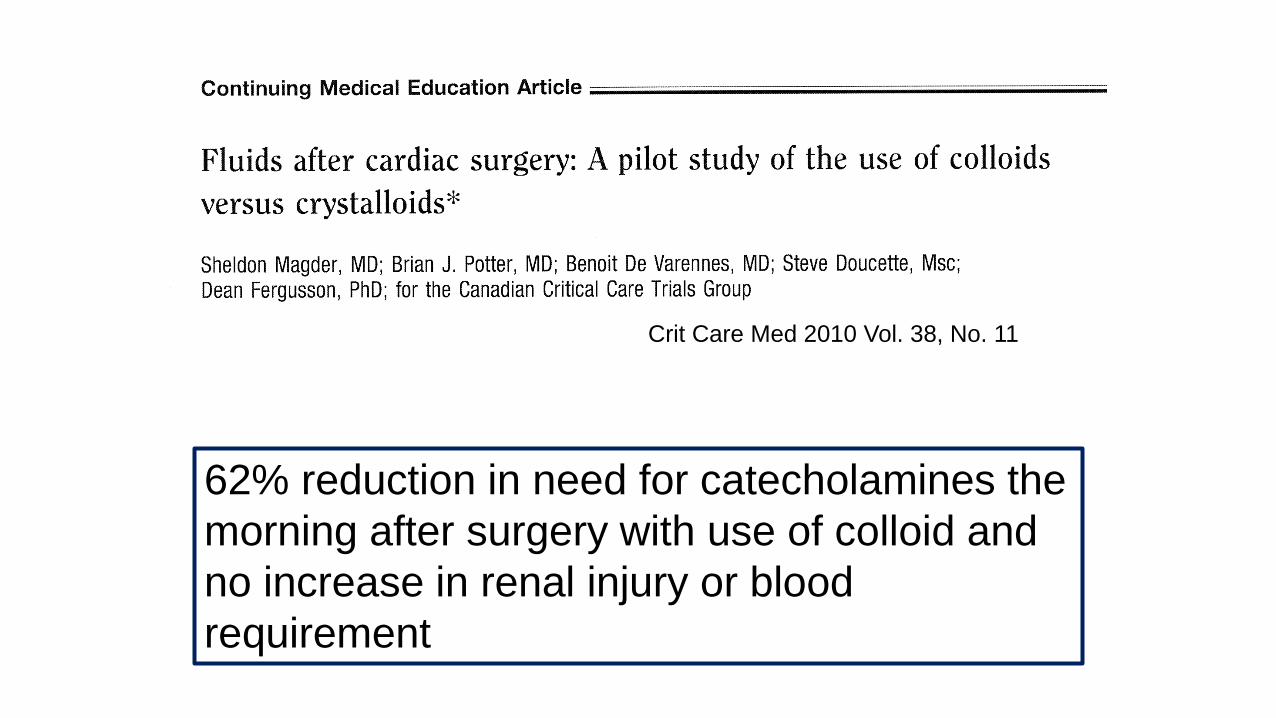
Crit Care Med 2010 Vol. 38, No. 11
62% reduction in need for catecholamines the
morning after surgery with use of colloid and
no increase in renal injury or blood
requirement

CI < 4 and
CVP < 12 ?
No
Yes
No
Patient on
Catecholamines? Observe
Yes
No
CI < 2.2or
MAP < Target
or
SBP < Target
or
CVP < 3
Catecholamine
Protocol
Weaning Protocol
Targets
Yes
Fluid ProtocolR/O Low SVR or
RV limitation

Fluid ProtocolCI < 4 and
CVP < 12 ?
Give Fluid Bolus
Check CI
and
CVP
CVP incr. > 2and
CI incr. < 0.3
CVP incr. < 2and
CI incr. > 0.3
CI < 2.2
or
MAP < 70
or
SBP < Target
or
CVP <3
or
UO < 20
Total
Protocol
Fluid
>1L/24hr?
Catecholamine
Protocol
Yes
Yes
NoCVP incr. < 2
and
CI incr. < 0.3
CVP incr. > 2and
CI incr. > 0.3
Inadequate
challenge
Cardiac
response ok
Pt not volume responsive
Review
fluid
criteria
No
Observe
or wean
Saline
YES
This meant that a pt who had an increase in CVP
from 2-4 mmHg and ∆CI < 0.3 L/min/m2 would not
get further volume boluses

Conclusion
• Goal-directed therapy uses targets which have not been
validated
– Can lead to excess treatment
– Currently no advantage over standard therapy
• A flow-directed responsive approach allows the clinician
to follow the response to his/her clinical hypothesis
• Since the major role of volume therapy is to increase
cardiac output it is important to know what happened to
CO with the therapy

BP = Cardiac Output x SVR
First Question to ask:
Is the cardiac output decreasedOr
Is the cardiac output normal or
increased
Measured variable
Cardiac output is the problem
SVR is the problem

Fluid Challenge
1 Assess the value
of Pra ( NOT the
wedge).
2 Give sufficient
fluid to raise Pra
by ~2mmHg and
observe Q.
Type of fluid is not of importance if given fast enough
Pra
Q
+ve
-ve