government intervention and strategic trading in...
TRANSCRIPT

Government Intervention and Strategic Trading in the
U.S. Treasury Market
Paolo Pasquariello, Jennifer Roush, and Clara Vega∗
July 30, 2018
∗Pasquariello ([email protected]) is at the Ross School of Business, University of Michigan;
Roush ([email protected]) and Vega ([email protected]) are at the Federal Reserve Board of
Governors. We thank Michael Gulick for outstanding research assistance, and an anonymous referee,
Gara Afonso, Hank Bessembinder (the editor), Sugato Bhattacharyya, Tarun Chordia, Robert Engle,
Andreas Fischer, Michael Fleming, Thierry Foucault, Larry Harris, Kentaro Iwatsubo, Andrew Karolyi,
Collin Jones, Marc Lipson, Anna Obizhaeva, Maureen O’Hara, Amiyatosh Purnanandam, Marti Sub-
rahmanyam, Rufei Zhu, and seminar participants at the Banque de France, University of Warwick,
Swiss National Bank, University College London, EFA meetings, NBER Market Microstructure meet-
ings, AFA meetings, Washington State University, and First International Conference on Sovereign
Bond Markets for comments. The views in this paper are solely the responsibility of the authors and
should not be interpreted as reflecting the views of the Board of Governors of the Federal Reserve
System or of any other person associated with the Federal Reserve System. All errors are ours.

Abstract
We study the impact of permanent open market operations (POMOs) by the Federal Reserve
on U.S. Treasury market liquidity. Using a parsimonious model of speculative trading, we
conjecture that i) this form of government intervention improves market liquidity, contrary to
existing literature; and ii) the extent of this improvement depends on the market’s information
environment. Evidence from a novel sample of Federal Reserve’s POMOs during the 2000s
indicates that bid-ask spreads of on-the-run Treasury securities decline when POMOs are
executed, by an amount increasing in proxies for information heterogeneity among speculators,
fundamental volatility, and POMO policy uncertainty, consistent with our model.
JEL classification: E44; G14
Keywords: Treasury Bond Markets; Open Market Operations; Central Bank;
Government Interventions; Strategic Trading; Market Microstructure; Liquidity

I Introduction
During the recent financial crisis several central banks (e.g., the Federal Reserve, the
Bank of England, and the European Central Bank) traded large amounts of securities. While
the motives and effectiveness of these trades continue to be intensely debated (e.g., see Acharya
and Richardson (2009)), their potential externalities on the “quality” of the process of price
formation have received much less attention.
In this paper we investigate, both theoretically and empirically, the effects of direct
government intervention in a financial market (like central bank trades of securities) on that
market’s liquidity. We do so by studying one market in which monetary authorities have long
been active, the secondary market for U.S. government bonds. U.S. Treasury securities are
widely held and traded by domestic and foreign investors. The secondary market for these
securities is among the largest, most liquid financial markets. There, the Federal Reserve
(through the “Desk” of the Federal Reserve Bank of New York (FRBNY)) routinely buys or
sells Treasury securities on an outright (i.e., definitive) basis – with trades known as
permanent open market operations (POMOs) – to permanently add or drain bank reserves
toward a non-public target level consistent with the monetary policy stance (and accompanying
federal funds target rate) previously set and publicly announced by the Federal Open Market
Committee (FOMC).
The frequency and magnitude of POMO trades are nontrivial: Even prior to the recent
crisis, between January 2001 and December 2007, the FRBNY executed POMOs nearly once
every eight working days, for an average daily principal amount of $111 billion. Importantly,
while the FOMC’s decisions are public and informative about its current and planned stance of
monetary policy, the Federal Reserve’s non-public targeted level of reserves has been
uninformative about that stance since the mid-1990s (see Akhtar (1997), Edwards (1997),
Harvey and Huang (2002), Sokolov (2009), and Cieslak, Morse, and Vissing-Jorgensen (2016),
1

among others).1 This constitutes a crucial difference between POMOs and government
interventions in currency markets, the latter being typically deemed informative about
economic policy or fundamentals (e.g., Sarno and Taylor (2001), Payne and Vitale (2003), and
Dominguez (2006)).
To guide our analysis of the impact of POMOs on the Treasury market, we develop a
parsimonious model of trading based on Kyle (1985). This model aims to capture an important
feature of that market – one highlighted by several empirical studies (e.g., Brandt and
Kavajecz (2004), Green (2004), and Pasquariello and Vega (2007), (2009)) – namely, the role
of informed trading in Treasury securities for their process of price formation. In the model’s
basic setting, strategic trading in a risky asset by heterogeneously informed speculators leads
uninformed market-makers (MMs) to worsen that asset’s equilibrium market liquidity. More
valuable or diverse information among speculators magnifies this effect by making their trading
activity more cautious and MMs more vulnerable to adverse selection.
The introduction of a stylized central bank consistent in spirit with the nature of the
Federal Reserve’s POMO policy in this setting significantly alters equilibrium market quality.
We model the central bank as an informed agent facing a trade-off between policy motives (a
non-public and uninformative price target for the risky asset) and the expected cost of its
intervention, in the spirit of Stein (1989), Bhattacharya and Weller (1997), Vitale (1999), and
Pasquariello (2010), (2017). In particular, the price target is a modelling device for the
FRBNY’s objective of targeting the supply of nonborrowed reserves by trading in Treasury
securities in a market where demand for these securities is downward sloping (Krishnamurthy
(2002), Vayanos and Vila (2009), Greenwood and Vayanos (2010), and Krishnamurthy and
Vissing-Jorgensen (2012)). We then show that allowing such a central bank to trade alongside
noise traders and speculators improves equilibrium market liquidity. Intuitively, the presence of
a central bank ameliorates adverse selection concerns for the MMs, not only because a portion
1See also the FRBNY’s website at https://www.newyorkfed.org/markets/pomo/display/index.cfm.
2

of its trading activity is uninformative about fundamentals but also because that activity
induces speculators to trade less cautiously on their private signals. This insight differs
markedly from those in the aforementioned literature on the microstructure of government
intervention in currency markets. In many of those studies (e.g., Bossaerts and Hillion (1991),
Vitale (1999), and Naranjo and Nimalendran (2000)), the central bank is typically assumed to
act as the only informed agent. Thus, its presence generally leads to deteriorating market
liquidity.2
A further, interesting (and novel) insight of our model is that the magnitude of the
improvement in market liquidity stemming from the central bank’s trading activity is sensitive
to the information environment of the market. Specifically, we show that this effect is greater
the more volatile are the economy’s fundamentals and the more heterogeneous are speculators’
private signals about them. As we discussed above, either circumstance worsens market
liquidity, but less so when the MMs perceive the threat of adverse selection as less serious
because the central bank is intervening. Accordingly, we also show that greater uncertainty
among market participants about the central bank’s policy target magnifies the improvement
in market liquidity accompanying its trades. Greater policy uncertainty both makes it more
difficult for the MMs to learn about the policy target from the order flow and alleviates their
perceived adverse selection from trading with informed speculators.3
We assess the empirical relevance of our model using a comprehensive, recently available
sample of intraday price data for the secondary U.S. Treasury bond market from BrokerTec –
the electronic platform where the majority of such trading migrated, since its inception, from
the voice-brokered GovPX network (Mizrach and Neely (2006), (2009), Fleming, Mizrach, and
2See also the surveys in Lyons (2001) and Neely (2005). Other studies (e.g., Evans and Lyons (2005), Chari
(2007), and Pasquariello (2010)) postulate that government intervention in currency markets may worsen their
liquidity because of inventory management considerations.3We overview model extensions and robustness in Section III.C below; further details and analysis are in
Section 1 of the Internet Appendix for economy of space.
3

Nguyen (2017)) – and a novel dataset of all POMOs conducted by the FRBNY during the
2000s. POMOs are typically aimed at all securities within specific maturity segments of the
yield curve, rather than at specific securities. However, most of these securities rarely trade
and assessing their liquidity is problematic (Fabozzi and Fleming (2004), Pasquariello and Vega
(2009)). Thus, we study the effects of POMOs on the most liquid Treasury securities in those
segments – on-the-run (i.e., most recently issued, or benchmark) two-year, three-year,
five-year, and ten-year Treasury notes, and thirty-year Treasury bonds.
Our empirical analysis provides support for our model’s main prediction. Over the
pre-crisis period 2001-2007, we find that bid-ask price spreads for notes and bonds nearly
uniformly decline from prior near-term levels, both on days when the FRBNY executed
POMOs in the corresponding maturity bracket and on days when POMOs of any maturity
occurred. The latter may be due to the relatively high degree of substitutability among
Treasury securities documented in prior studies (e.g., Cohen (1999), Greenwood and Vayanos
(2010), and D’Amico and King (2013)). The estimated improvement in liquidity is both
economically and statistically significant. For instance, on days when any POMO occurred,
quoted bid-ask spreads decline by an average of 7% (for three-year bonds) to 16% (for five-year
notes) of their sample means, and 25% (for thirty-year bonds) to 46% (for two-year notes) of
the sample standard deviation of their daily changes. Only a portion of these effects takes
place within the ninety-minute morning interval during which the FRBNY executes its trades,
suggesting that the impact of POMOs on MMs’ adverse selection risk may not be short-lived.
Importantly, bid-ask spreads in the Treasury market do not affect the FRBNY’s
explicitly stated reserve policy, as implemented by the Desk with its outright operations (see,
e.g., Akhtar (1997), Edwards (1997), and Federal Reserve Board of Governors (FRBG) (2005),
among others). Our basic evidence is also unlikely to stem from interactions between POMOs
and Treasury market conditions.4 First, it is robust to (and often stronger when) controlling
4For instance, over our pre-crisis sample period, the Desk minimized the risk that those trades may disrupt
4

for various calendar effects and bond-specific characteristics, as well as for changes in overnight
repo specialness, the latest Treasury auction results, the latest pre-POMO on-the-run
illiquidity, the Desk’s repo trading activity, the reserve maintenance periods, the latest FOMC
meetings, and the release of U.S. macroeconomic announcements. Second, it is obtained over a
sample period when the FRBNY neither sold Treasury securities nor traded in “scarce” ones.
Third, it is unaffected by extending our sample to the financial crisis of 2008 and 2009 and
holds during that sub-period as well, despite the special nature of both the crisis period and
the FRBNY’s intervention activity in the Treasury market. Lastly, it is reproduced over a
partly overlapping sample of quotes on the previously dominant GovPX platform.5
Further, more direct support for our model (hence further mitigating potential omitted
variable biases) comes from tests of its unique, additional predictions about the effects of
POMOs on Treasury market liquidity. In particular, our analysis also reveals that the
magnitude of POMOs’ positive liquidity externalities is related to the information environment
of the Treasury market, consistent with our model. We find that bid-ask spreads decline
significantly more i) the worse is Treasury market liquidity, i.e., especially in the earlier portion
of the sample (2001-2004); ii) the greater is marketwide dispersion of beliefs about U.S.
macroeconomic fundamentals (measured by the standard deviation of professional forecasts of
macroeconomic news releases); iii) the greater is marketwide uncertainty surrounding U.S.
macroeconomic fundamentals (measured by Eurodollar or Treasury bond option implied
Treasury market conditions by explicitly avoiding trading in such highly desirable and liquid securities as on-the-
run notes and bonds or on days when important events for Treasury yields are scheduled (e.g., see FRBNY (2005),
(2008)) but market liquidity tends to be high (Pasquariello and Vega (2007), (2009), except immediately around
the event time; e.g., Green (2004)). Treasury market conditions are also related to alternative interpretations
of our basic findings (based on inventory, search costs, reserves, or liquidity provision considerations) noted in
Section IV.B below and further discussed in Section 2.4 of the Internet Appendix.5We summarize this robustness analysis in Section IV.B below; its details and ensuing additional evidence are
in Section 2 of the Internet Appendix for economy of space.
5

volatility); and iv) the greater is marketwide uncertainty surrounding the Federal Reserve’s
POMO policy (measured by federal funds rate volatility).
Open market operations (OMOs) have received surprisingly little attention in the
literature.6 In the only published empirical study on the topic we are aware of, Harvey and
Huang (2002) find that the FRBNY’s OMOs between 1982 and 1988 – when those trades were
still deemed informative about the Federal Reserve’s monetary policy stance – are, on average,
accompanied by higher intraday T-Bill, Eurodollar, and T-Bond futures return volatility. Inoue
(1999) also finds that informative POMOs by the Bank of Japan are accompanied by higher
intraday trading volume and price volatility in the secondary market for ten-year on-the-run
Japanese government bonds. Harvey and Huang (2002) conjecture that such increase may be
attributed to the effect of OMOs on market participants’ expectations. This evidence is
consistent with that from several studies of the impact of potentially informative central bank
interventions on the microstructure of currency markets (e.g., Dominguez (2003), (2006),
Pasquariello (2007b)). As mentioned above, the focus of our study is on the impact of
uninformative central bank trades on the liquidity of government bond markets in the presence
6One exception is recent studies of the effectiveness of unconventional monetary policy (including the auction-
based purchase of extraordinarily large amounts of government bonds) at lowering long-term interest rates during
the recent financial crisis (e.g., Gagnon, Raskin, Remache, and Sack (2011), Hamilton and Wu (2011), Krishna-
murthy and Vissing-Jorgensen (2011), Christensen and Rudebusch (2012), D’Amico, English, Lopez-Salido, and
Nelson (2012), D’Amico and King (2013), Eser and Schwaab (2016), and Krishnamurthy, Nagel, and Vissing-
Jorgensen (2018)). Relatedly, Song and Zhu (2018) find that the Federal Reserve mitigated the execution costs
of these extraordinary purchases between November 2010 and September 2011 by concentrating on undervalued
Treasury securities (relative to an algorithm that includes, among others, pre-auction bid-ask spreads as a mea-
sure of bond illiquidity) even in the presence of strategic primary dealers partly predicting (and so profiting from)
its demand; see also Kitsul (2013). As noted earlier, we discuss the role of POMOs during the financial crisis
period 2008-2009 and ascertain the robustness of our inference to pre-auction Treasury market illiquidity over
the pre-crisis period 2001-2007 in Section IV.B below and Sections 2.2 and 2.4 of the Internet Appendix.
6

of strategic, informed speculation.7
We proceed as follows. In Section II, we construct a model of trading in the presence of
an active central bank to guide our empirical analysis. In Section III, we describe the data. In
Section IV, we present the empirical results. We conclude in Section V.
II A Model of POMOs
The objective of this study is to analyze the impact of permanent open market
operations (POMOs) by the Federal Reserve on the liquidity of the secondary U.S. Treasury
bond market. Trading in this market occurs in an interdealer over-the-counter setting in which
primary and non-primary dealers act as market-makers, trading with customers on their own
accounts and among themselves via interdealer brokers.8 In this section we develop a
parsimonious representation of the process of price formation in the Treasury bond market apt
for our objective. First, we describe a model of trading in Treasury securities based on Kyle
(1985) and derive closed-form solutions for the equilibrium depth as a function of the
information environment of the market. Then, we enrich the model by introducing a central
bank attempting to achieve a policy target while accounting for the cost of the intervention and
consider the properties of the ensuing equilibrium. We test for the statistical and economic
significance of our theoretical argument in the remainder of the paper. All proofs are in the
Appendix.
7In a companion study, Pasquariello (2017) investigates the effect of government intervention pursuing a
partially informative policy target in currency markets on violations of the law of one price (LOP) in the market
for American Depositary Receipts (ADRs). Further discussion is in Section III.C below and Section 1 of the
Internet Appendix.8For more details on the microstructure of the U.S. Treasury market, see Fabozzi and Fleming (2004) and
Mizrach and Neely (2009).
7

II.A The Basic Model
The basic model is a two-date ( = 0 1) economy in which a single risky asset is
exchanged. Trading occurs only at date = 1, after which the payoff of the risky asset – a
normally distributed random variable with mean 0 and variance 2 – is realized. The
economy is populated by three types of risk-neutral traders: A discrete number () of
informed, risk-neutral traders (henceforth speculators), liquidity traders, and perfectly
competitive market-makers (MMs) in the risky asset. All traders know the structure of the
economy and the decision process leading to order flow and prices.
At date = 0 there is neither information asymmetry about nor trading, and the price
of the risky asset is 0. Recent studies provide evidence of privately and diversely informed
trading in the secondary market for Treasury securities (e.g., see Brandt and Kavajecz (2004),
Green (2004), and Pasquariello and Vega (2007), (2009)). Accordingly, sometime between = 0
and = 1, we endow each speculator with a private and noisy signal of , (). We
assume that each signal () is drawn from a normal distribution with mean 0 and variance
2 and that, for any two speculators and , [ () ()] = [ ()] = 2. As in
Pasquariello and Vega (2009), we also parametrize the dispersion of speculators’ private
information by imposing that 2 =12 and ∈ (0 1), such that each speculator’s information
advantage (or endowment) about at = 1, before trading with the MMs, is given by
() ≡ [| ()]− 0 = [ ()− 0], and that [ () | ()] = (). Thus, the
parameter represents the correlation between any two information endowments () and
(): The lower (higher) is , the less (more) correlated – i.e., the more (less) heterogeneous
– is speculators’ private information.9
9Similar implications ensue from the (trivial) limiting case where speculators’ private information is homoge-
neous (i.e., = 1 such that () = () = ) as well as from more general information structures (albeit at
the cost of greater analytical complexity, e.g., as in Foster and Viswanathan (1996), Pasquariello (2007a), and
Pasquariello and Vega (2007)).
8
At date = 1, both liquidity traders and speculators submit their orders to the MMs
before the equilibrium price 1 has been set. We define the market order of each speculator
as (), such that her profit is given by () = ( − 1) (). Liquidity traders generate a
random, normally distributed demand , with mean zero and variance 2. For simplicity, we
assume that is independent of all other random variables. The uninformed MMs observe the
ensuing aggregate order flow 1 =P
=1 () + and then set the market-clearing price
1 = 1 (1). Consistently with Kyle (1985), we define a Bayesian Nash equilibrium of this
economy as a set of + 1 functions () (·) and 1 (·) such that the following two conditions
hold:
1. Utility maximization: () ( ()) = argmax [ () | ()];
2. Semi-strong market efficiency: 1 (1) = (|1).
The following proposition characterizes the unique linear, rational expectations
equilibrium for this economy satisfying Conditions 1 and 2.
Proposition 1 There exists a unique linear equilibrium given by the price function
1 = 0 + 1 (1)
and by each speculator ’s demand strategy
() =
√
() , (2)
where
=√
[2 + ( − 1) ] 0. (3)
In equilibrium, imperfectly competitive speculators are aware of the potential impact of
their trades on prices; thus, despite being risk-neutral, they trade on their private information
cautiously (| ()| ∞) to dissipate less of it. Accordingly, speculators’ optimal trading
9

strategies depend both on their information endowments about the traded asset’s payoff
( ()) and market liquidity (): () =1
[2+(−1)] () in equation (2). A positive
allows MMs to offset losses from trading with speculators with profits from noise trading ().
As such, liquidity deteriorates ( is greater) the more uncertain is the traded asset’s payoff
(higher 2), for the greater is speculators’ information advantage and the more vulnerable MMs
are to adverse selection.
Importantly, () and also depend on , the correlation among speculators’
information endowments. Intuitively, when speculators’ private information is more
heterogeneous ( closer to zero), each speculator perceives to have greater monopoly power on
her signal, because more of it is perceived to be known to her alone. Hence, each speculator
trades on her signal more cautiously – i.e., her market order is lower:
|()|
= 2
√| ()| 0 – to reveal less of it. Lower trading aggressiveness makes the
aggregate order flow less informative and the adverse selection of MMs more severe, worsening
equilibrium market liquidity (higher ) – except when accompanied by greater signal noise
(2= −2
2 0) in the presence of few or very heterogeneously informed (thus already very
cautious) speculators (low or ); see also Pasquariello and Vega (2015). The following
corollary summarizes these basic properties of of equation (3).
Corollary 1 Equilibrium market liquidity is decreasing in 2 and generally decreasing in .
Pasquariello and Vega (2007, 2009) find strong empirical support for the predictions of our
model in the U.S. Treasury market (see also Fleming (2003), Brandt and Kavajecz (2004),
Green (2004), and Li, Wang, Wu, and He (2009)).
10

II.B Central Bank Intervention
The Federal Reserve routinely intervenes in the secondary U.S. Treasury market via
open market operations (OMOs) to implement its monetary policy.10 OMOs are trades in
previously issued U.S. Treasury securities executed by the Open Market Desk (“the Desk”) at
the Federal Reserve Bank of New York (FRBNY) on behalf of the entire Federal Reserve
System, via an auction process with primary dealers (described in Section III.B), to ensure that
the supply of nonborrowed reserves in the banking system is consistent with the target for the
federal funds rate set by the Federal Open Market Committee (FOMC).
The federal funds rate is the rate clearing the federal funds market, the market where
financial institutions trade reserves – deposits held by those institutions at the Federal
Reserve – on a daily basis.11 Purchases (sales) of government bonds by the Desk expand
(contract) the aggregate supply of nonborrowed reserves – i.e., those not originating from the
Federal Reserve’s discount window (which is meant as a source of last resort) – in the
monetary system. Permanent OMOs (POMOs) are outright trades of government bonds
affecting the supply of nonborrowed reserves permanently. Temporary OMOs (TOMOs) are
repurchasing agreements by which the Desk either buys (repos) or sells (reverse repos or
10Akhtar (1997), Edwards (1997), Harvey and Huang (2002), FRBG (2005), and Afonso, Kovner, and Schoar
(2011) provide detailed discussions of U.S. monetary policy and its implementation. Further information is also
available on the FRBNY website at https://www.newyorkfed.org/markets/domestic-market-operations.11As noted in Section I above, the main focus of our investigation is on FRBNY interventions prior to the
2008 financial crisis. The implementation process of U.S. monetary policy has significantly changed since then.
For instance, the Federal Reserve has been paying interest on reserve balances since October 1, 2008; those
deposits were instead non-interest bearing over our sample period 2001-2007. Furfine (1999) provides a detailed
analysis of the microstructure of the federal funds market prior to the 2008 financial crisis. We consider the
implications of the financial crisis for our inference in Section 2.2 of the Internet Appendix; see also Section
IV.B below. For detailed information on the current U.S. monetary policy tools, see the FRBG’s website at
https://www.federalreserve.gov/monetarypolicy/policytools.htm, as well as D’Amico and King (2013), Song and
Zhu (2018), and references therein.
11

matched-sale purchases) government bonds with the agreement to an equivalent transaction of
the opposite sign at a specified price and on a specified later date (overnight or term basis)
affecting the supply of nonborrowed reserves only temporarily.
For many years, the FOMC did not publicly announce changes in its stance of monetary
policy, forcing market participants to infer them from the Desk’s OMOs and the observed level
of the federal funds rate. Media reports would then publicize the resulting market consensus.
As such, the Desk conducted outright operations (i.e., POMOs) only infrequently (e.g., a few
times a year) and only when pursuing sizable permanent changes in the supply for reserves.
According to Edwards (1997, p. 862), this “could, and on a few occasions did, lead to
misunderstandings about the stance of policy or to delays in recognizing changes.” However, on
February 4, 1994, after the FOMC voted to tighten monetary policy for the first time in five
years, Chairman Alan Greenspan decided to disclose that new stance immediately and
unequivocally to the public in a press release “to avoid any misunderstanding of the
Committee’s purposes.”12 Since then, the FOMC has made its monetary policy decisions
increasingly transparent – e.g., by pre-announcing its intentions and disclosing the federal
funds target rate to all market participants – therefore making the Desk’s OMOs virtually
uninformative about the Federal Reserve’s future monetary policy stance over our sample
period (Akhtar (1997), Edwards (1997), Harvey and Huang (2002), Sokolov (2009), and Cieslak
et al. (2016)).
Importantly, while uninformative about the FOMC’s monetary policy stance, the
actions by the Desk at the FRBNY are neither meaningless nor “mechanical” (Akhtar (1997, p.
34)). Given that stance, the timing, direction, and magnitude of FRBNY trades along the
Treasury maturity structure are driven by nonborrowed reserve paths (or targets) based on its
projections of current and future reserve excesses or shortages – as well as by its assessment of
current and future U.S. Treasury market conditions – in an environment in which those
12See https://www.federalreserve.gov/fomc/19940204default.htm.
12

reserve imbalances are subject to many factors outside of the central bank’s control (e.g.,
Edwards (1997), Harvey and Huang (2002), FRBG (2005), and FRBNY (2005), (2008)).13
Every day, the FRBNY sets a nonborrowed reserve target consistent with the FOMC’s
monetary policy stance and the federal funds target rate (see, e.g., Edwards (1997)). If the
FRBNY expects persistent imbalances between the demand and supply of nonborrowed
reserves (e.g., due to trends in the demand for U.S. currency in circulation) leading to a
persistent violation of its reserve target, it may affect the supply through POMOs.14 If those
imbalances are instead expected to be temporary, the FRBNY may enter TOMOs; accordingly,
TOMOs occur much more frequently (nearly every trading day) than POMOs. These
observations imply that at any point in time there may be considerable uncertainty among
market participants as to the nature of the trading activity by the FRBNY in the secondary
U.S. Treasury market, i.e., about its reserve targets.
In this study we intend to analyze the process of price formation in the secondary
Treasury market in the presence of outright trades (i.e., POMOs) by the FRBNY’s Desk in
that market. To that purpose, we amend the basic one-shot model of outright trading of
Section II.A to allow for the presence of a stylized central bank alongside speculators and
liquidity traders.
As noted earlier, the Desk also routinely executes short-lived round-trip trades (i.e.,
TOMOs) in the Treasury repo market. As such, our setting is inadequate at capturing
TOMOs’ transitory nature and heterogeneous holding-period intervals (i.e., overnight or term
basis). TOMOs’ significantly higher recurrence (e.g., virtually every day over 2001-2007) also
makes it difficult to identify their effect on Treasury market liquidity. In addition, as we discuss
13See https://www.newyorkfed.org/aboutthefed/fedpoint/fed32.html for a discussion of the FRBNY’s review
of financial conditions in advance of its OMOs.14For instance, according to Akhtar (1997, p. 18), “currency demand is the largest single factor requiring
[nonborrowed] reserve injections [i.e., POMO purchases], because it has a strong growth trend which reflects,
primarily, the growth trend of the economy.”
13

below, uncertainty about government intervention plays an important role in our model.
According to Edwards (1997), temporary reserve imbalances– i.e., those leading the federal
funds rate to temporarily move away from the FOMC’s target and the Desk to execute
TOMOs – are “more technical,” i.e., more mechanical in nature.15 Thus, there may be
considerably less uncertainty among market participants about the Desk’s short-term reserve
objectives behind its TOMOs. Nevertheless, in Section 2.4 of the Internet Appendix we
establish the robustness of our subsequent empirical analysis to explicitly controlling for any
spillover effect of TOMOs on Treasury market liquidity; see also Section IV.B below.
We model the main features of FRBNY’s POMO policy in a parsimonious fashion by
assuming that i) sometime between = 0 and = 1, the central bank is given a non-public
price target for the traded asset, drawn from a normal distribution with mean and
variance 2 ; and ii) at date = 1, before the equilibrium price 1 has been set, the central
bank submits to the MMs an outright market order minimizing the expected value of the
following separable loss function:
= (1 − )2+ (1− ) (1 − ), (4)
where ∈ (0 1) is known to all market participants.
The specification of equation (4) is similar in spirit to Stein (1989), Bhattacharya and
Weller (1997), Vitale (1999), and Pasquariello (2010), (2017). The first component, (1 − )2,
captures the FRBNY’s policy motives in its trading activity by the squared distance between
the traded asset’s equilibrium price 1 and the target . The price target captures the
Desk’s efforts to target the supply of nonborrowed reserves – via outright purchases or sales of
Treasury securities affecting dealers’ deposits at the Federal Reserve – while facing a
downward sloping demand for Treasury securities (e.g., Krishnamurthy (2002), Vayanos and
15Accordingly, Harvey and Huang (2002, p. 229) observe that “one might characterize [POMOs] as offensive
operations whereas [TOMOs] are more defensively oriented operations.”
14

Vila (2009), Greenwood and Vayanos (2010), and Krishnamurthy and Vissing-Jorgensen
(2012)). Intuitively, in the presence of downward sloping demand curves for Treasury securities,
changes in their supply induced by the Desk’s outright trades affect their prices. Hence, the
Desk’s reserve targets can be represented as either Treasury price targets or Treasury supply
targets. In our setting, we choose the former for analytical convenience.
The second component, (1 − ), captures the cost of the intervention as any
deviation from purely speculative trading motives (e.g., as in Bhattacharya and Weller (1997,
eq. (1))). Intuitively, if = 0 the central bank would trade as just another speculator (i.e.,
would maximize the expected profit from trading the risky asset at 1 before its payoff is
realized). Hence, deviating from optimal speculation to pursue policy is costly. Accordingly,
the Federal Reserve has often voiced concern about the effects of capital losses from its OMOs
on its balance sheet and remittances to the U.S. Treasury.16 The greater is the more
important is the first component relative to the second in the central bank’s loss function, i.e.,
the more important it deems the pursuit of relative to its cost. In other words, the
coefficient can be interpreted as the relative preference weight placed by the central bank on
its policy motives. The restriction that 0 1 in equation (4) then ensures that the central
bank does not trade unlimited amounts of the risky asset to achieve its policy target .
The FRBNY is likely to have first-hand knowledge of macroeconomic fundamentals.
Thus, we assume that the central bank is also given a private signal of the risky asset’s payoff
, – a normally distributed variable with mean 0 and variance 2 =
12, where the
precision parameter ∈ (0 1) and [ () ] = ( ) = 2 (as for () in
Section II.A). However, as noted earlier, since the mid-1990s the FOMC no longer employs
POMOs to communicate changes in its stance of monetary policy to market participants.
Hence, POMOs no longer convey payoff-relevant information about traded Treasury securities.
16E.g., see the published minutes of the FOMC meetings in December 2012, January 2013, and March 2013
(at https://www.federalreserve.gov/monetarypolicy/fomc.htm).
15

We make this observation operational in our model by further imposing that the central bank’s
policy target is uninformative about the traded asset’s liquidation value , i.e., that
( ) = [ () ] = ( ) = 0. Both uncertainty about and
uninformativeness of are meant to capture the unanticipated nature of FRBNY trades in
government bonds following public, informational FOMC decisions. In our setting, we can
think of these policy decisions as translating into the commonly known distribution of the risky
asset’s liquidation value given at date = 0. This distribution is independent of the
FRBNY’s subsequent trading activity in that asset. Thus, our assumptions about reflect the
uncertainty surrounding the FRBNY’s implementation of the announced informative FOMC
policy in the marketplace (e.g., about the Desk’s uninformative targets for nonborrowed
reserves). These assumptions also imply that the central bank’s information endowments about
and at = 1, before trading with the MMs, are given by
≡ (|)− 0 = ( − 0) and ≡ − , respectively.
As in Section II.A, the MMs set the equilibrium price 1 at date = 1 after observing
the aggregate order flow, composed of the market orders of liquidity traders, speculators, and
the central bank, 1 = +P
=1 () + . Importantly, these simplifying assumptions
about intervention activity and ensuing market clearing via 1 allow us to abstract from
explicitly modeling the separate auction process through which the Desk actually executes its
POMOs. As we further discuss in Section III.B, these auctions are attended exclusively by
primary dealers, who play a crucial role in liquidity provision in the tightly linked secondary
market for the auctioned Treasury securities and targeted maturities by intermediating their
affected outright supply and aforementioned downward sloping demand (see, e.g., Fabozzi and
Fleming (2004)). Accordingly, prior research finds that both U.S. Treasury and FRBNY
auction outcomes quickly and significantly affect price formation in the secondary Treasury
market (Pasquariello and Vega (2009), D’Amico and King (2013), and references therein).
Proposition 2 accomplishes the task of solving for the unique linear Bayesian Nash equilibrium
16

of this economy.
Proposition 2 There exists a unique linear equilibrium given by the price function
1 = [0 + 2 (0 − )] + 1, (5)
by each speculator ’s demand strategy
() =2 (1 + )−
{2 [2 + ( − 1) ] (1 + )− (1 + 2)} () , (6)
and by the central bank’s demand strategy
= 2 ( − 0) +
1 + (7)
+[2 + ( − 1) ]− (1 + 2)
{2 [2 + ( − 1) ] (1 + )− (1 + 2)},
where the ratio ≡
1− is the central bank’s relative degree of commitment to its policy target,
and is the unique positive real root of the sextic polynomial of equation (A-25) in the
Appendix.
In equilibrium, each speculator accounts not only for the potentially competing
trading activity of the other speculators (via [ () | ()], as in the equilibrium of
Proposition 1) but also for the trading activity of the central bank (via [| ()]) when
setting her cautious optimal demand strategy () to exploit her information advantage
(). As such, () of equation (6) also depends on the commonly known parameters
controlling the government’s intervention policy – the quality of its private information (),
the uncertainty surrounding its policy target (2 ), and its commitment to it ().
Similarly, the central bank uses its information advantage to account for
speculators’ trading activity (via [ () |]) when devising its optimal trading strategy
. As such, of equation (7) also depends on the number of speculators () and the
heterogeneity of their private information (). According to Proposition 2, is composed of
17

three terms. The first one depends on the expected deviation of the policy target from the
equilibrium price in absence of government intervention, ( − 0), and is fully anticipated by
the MMs when setting the market-clearing price 1 of equation (5). The second one depends on
the portion of that target that is known exclusively to the central bank, ; ceteris paribus, the
more liquid is the market (the lower is ), the more aggressively the central bank trades on
to achieve its policy objectives – the more so the more important is narrowing the gap
between 1 and in its loss function (the higher is ). The third one depends on the central
bank’s attempt at minimizing the expected cost of the intervention given its private
fundamental information, ; as such, it may either amplify or dampen its magnitude.
One cannot solve for the unique equilibrium price impact of Proposition 2 in closed
form. Therefore, we characterize its properties by means of numerical examples rather than
formal comparative statics. To that purpose, we select model parameters such that not only
the above equilibrium can be found (see the Appendix) but also the ensuing intervention
of equation (7) neither closely resembles otherwise already material informed speculation in the
secondary Treasury market (high ; e.g., Pasquariello and Vega (2007), (2009)) nor is nearly
unbounded (i.e., in Proposition 2 is nontrivially large; Pasquariello (2017)), consistent with
the FRBNY’s aforementioned policy motives and actions. In particular, we set
2 = 2 = 2 = 1, = 05, = 05, = 05, and = 500. Alternative such parameter
selection generally affects only the scale of the economy; we discuss nonrobust, extreme
exceptions and notable model extensions in Section 1 of the Internet Appendix; see also Section
II.C next. We then plot the ensuing difference between equilibrium price impact in the presence
and in the absence of the central bank of equation (4) – ∆ ≡ − = − √
[2+(−1)]
– as a function of either , 2 , , or 2, in Figures 1a to 1d, respectively (continuous lines).
[Insert Figure 1 here]
First, government intervention improves market liquidity: ∆ 0 in Figure 1.
18
Intuitively, the central bank’s optimal trading strategy stems from the resolution of a trade-off
between pursuing a non-public, uninformative target ( ) and the cost of deviating from
optimal informed speculation ( =2−
{2[2+(−1)]−} when = 0). The former leads
the central bank to trade more (or less) than it otherwise would given the latter to achieve its
policy target. Hence, a portion of its trading activity in equation (7) is uninformative about
fundamentals (). Further uninformative trading in the order flow also induces the speculators
to trade more aggressively on their private signals.17 Both in turn imply that the MMs perceive
the threat of adverse selection as less serious than in the absence of the central bank, thereby
making the market more liquid.18 Along those lines, equilibrium market liquidity is better (and
∆ is more negative) the greater is either the central bank’s policy commitment (i.e., for higher
in Figure 1a) or the uncertainty surrounding its policy (i.e., for higher 2 in Figure 1b), since
in both circumstances the greater is the perceived intensity of uninformative government
trading in the aggregate order flow.
Second, the extent of this improvement in market liquidity is sensitive to the
information environment of the market. In particular, |∆| is increasing in the heterogeneity of
speculators’ signals (i.e., for lower in Figure 1c) and in the economy’s fundamental
uncertainty (i.e., for higher 2 in Figure 1d). As discussed in Section II.A, less correlated (
closer to zero) or more valuable (higher 2) private information enhances speculators’
incentives to behave cautiously when trading.19 This worsens market liquidity regardless of
17I.e., Propositions 1 and 2 imply that () of equations (2) and (6) can be rewritten as () =
1 [ ()− 0] and () = 1 [ ()− 0], respectively; it can then be shown numerically that ∆1 ≡
1 −1 =
2(1+)−{2[2+(−1)](1+)−(1+2)} −
√
0. Accordingly, unreported numerical analysis
also shows that ∆ is more negative in the presence of fewer speculators (i.e., for smaller ), since their trading
activity is more cautious and the market in absence of government intervention less liquid.18Consistently, Kumar and Seppi (1992) argue that uninformed futures-cash price manipulation may transfer
liquidity from an infinitely deep futures market to a spot market plagued by adverse selection risk. See also the
discussion in Pasquariello (2017).19E.g., unreported numerical analysis shows that |∆1| is increasing in .
19

whether the central bank is intervening or not, yet less so when it is doing so, i.e., when
adverse selection is already less severe. Thus, the liquidity differential increases. The following
conclusion summarizes these implications of our model.
Conclusion 1 The presence of a central bank improves market liquidity (∆ 0) by an extent
(|∆|) increasing in , 2 , and 2, and decreasing in .
II.C Model Extensions and Robustness
In Section 1 of the Internet Appendix, we discuss in detail both noteworthy model
extensions and the robustness of its implications to parameter selection and key assumptions.
In particular, we show that government intervention would have no effect on market
liquidity if its policy target were public, would make the market infinitely deep for noise
trading ( = 0) if were fully informative about asset fundamentals (i.e., = ), and
would yield qualitatively similar implications for market liquidity if were at least partially
correlated with those fundamentals ( ( ) 0, like in Pasquariello (2017)). As noted
earlier, we also find those implications to be broadly robust to parameter selection (with a
noteworthy yet nonrobust and arguably implausible exception to Conclusion 1 arising from a
central bank de facto acting as an additional speculator, i.e., displaying low or zero ). Lastly,
we argue that those implications are likely to be robust to any alternative loss function yielding
nontrivial optimal intervention driven by at least partly uninformative policy goals, as for the
stylized government of equation (4).
III Data Description
We test the implications of the model of Section II in a comprehensive sample of
intraday price formation in the secondary U.S. Treasury bond market, and of open market
operations executed by the Federal Reserve Bank of New York during the 2000s.
20

III.A Bond Market Data
Our basic sample is made of intraday, interdealer U.S. Treasury bond price quotes from
BrokerTec for the most recently issued (i.e., benchmark, or on-the-run) two-year, three-year,
five-year, and ten-year Treasury notes, and thirty-year Treasury bonds between January 1,
2001 and December 31, 2007, i.e., immediately prior to the recent financial crisis. We analyze
the more turbulent crisis period 2008-2009 in Section 2.2 of the Internet Appendix; see also
Section IV.B below. We focus on on-the-run issues because those securities display the greatest
liquidity and informed trading (e.g., Fleming (1997), Brandt and Kavajecz (2004), Goldreich,
Hanke, and Nath (2005), and Pasquariello and Vega (2007)). Trading in more seasoned (i.e.,
off-the-run) Treasury securities is scarce, and their liquidity more difficult to assess (Fabozzi
and Fleming (2004), Pasquariello and Vega (2009)).
Since the early 2000s, interdealer trading in benchmark Treasury securities has migrated
from voice-assisted brokers (whose data are consolidated by GovPX) to either of two fully
electronic trading platforms, BrokerTec (our data source) and eSpeed. BrokerTec accounts for
nearly two-thirds of such trading activity (Mizrach and Neely (2006)). Fleming et al. (2017)
find that liquidity and trading volume in BrokerTec are significantly greater than what is
reported in earlier studies of the secondary Treasury bond market based on GovPX data. The
BrokerTec’s electronic interface displays, for each security (), the best five bid () and ask
() prices and accompanying quantities; traders either enter limit orders or hit these quotes
anonymously. Our sample includes every quote posted during “New York trading hours,” from
7:30 a.m. (“open”) to 5:00 p.m. (“close”) Eastern Time (ET).20 To eliminate interdealer
brokers’ posting errors, we filter all quotes within this interval following the procedure
described in Fleming (2003).21 Lastly, we augment the BrokerTec database with information on
20Although trading takes place nearly continuously during the week, 95% of trading volume occurs during those
hours (e.g., Fleming (1997)). Outside that interval, fluctuations in bond prices are likely due to illiquidity.21We also eliminate federal holidays, days in which BrokerTec recorded unusually low trading activity, and the
21

important fundamental characteristics (daily modified duration, , and convexity, ) of all
notes and bonds in our sample (from Morgan Markets, J.P. Morgan’s data portal).
III.A.1 Measuring Treasury Market Liquidity
The model of Section II yields implications of the occurrence of POMOs for the liquidity
of the secondary U.S. Treasury bond market. These implications stem from the role of informed
speculation for Treasury market liquidity. To better capture such a role, we focus our analysis
on daily measures of market liquidity for each security in our sample. The econometrician does
not observe the precise timing and extent of informed speculation throughout the day; hence,
narrowing the estimation window may lead to underestimate its full effects on market liquidity
around POMOs (e.g., since those effects may manifest nonuniformly over several hours after
POMOs occurred; Neely (2005) and Pasquariello (2007b) further discuss these issues when
surveying the vast empirical literature on central bank interventions in currency markets). In
addition, non-informational microstructure frictions (e.g., bid-ask bounce, quote clustering,
price staleness, inventory effects) affecting estimates of intraday market liquidity generally
become immaterial over longer horizons (Hasbrouck (2007)). We nonetheless analyze intraday
measures of liquidity in Section 2.3 of the Internet Appendix; see also Section IV.B below.
In the context of our model, market liquidity for a traded asset is defined as the
marginal impact of unexpected aggregate order flow on its equilibrium price, . When
transaction-level data is available, this variable is typically estimated as the slope of the
regression of intraday yield or price changes on the unexpected portion of intraday aggregate
net volume. While our BrokerTec sample does not include such data, direct estimation of
suffers from several shortcomings. First, the occasional scarcity of trades at certain maturities
may make the estimation of at the daily frequency problematic. Even when possible, this
days immediately following the terrorist attack to the World Trade Center (September 11 to September 21, 2001)
because of the accompanying significant illiquidity in the Treasury market (e.g., Hu, Pan, and Wang (2013)).
22

estimation requires the econometrician i) to model expected intraday aggregate order flow, as
well as ii) to explicitly control for the effect of the aforementioned non-informational
microstructure frictions on its dynamics (e.g., Brandt and Kavajecz (2004), Green (2004), and
Pasquariello and Vega (2007)). Thus, any ensuing inference may be subject to both
misspecification and biases from measurement error in the dependent variable (e.g., Greene
(1997)).
Accordingly, in this paper we measure the liquidity of each on-the-run Treasury security
with , the daily (i.e., from open to close) average of its quoted intraday price bid-ask
spreads = −. Treasury notes and bonds trade in units of par notional (i.e., of face
value), which is set at $1 000. Consistent with market conventions (e.g., Fleming (2003)),
Treasury notes and bond prices and in our sample are in points, i.e., are expressed as a
percentage of par (where one point is one percent of par) multiplied by 100. Thus, bid-ask
spreads are in basis points (bps, where one basis point is one percent of one point) further
multiplied by 100. Bid-ask spreads are virtually without measurement error. There is an
extensive literature relating their magnitude and dynamics to informed trading (see O’Hara
(1995) for a review). In addition, price spreads are comparable over time and across all
Treasury securities in our sample since each security’s spread is computed relative to the same
face value. Accordingly, we show in Section 2.3 of the Internet Appendix that percentage
spreads (e.g., Song and Zhu (2018)) yield nearly identical inference; see also Section IV.B
below. Lastly, when comparing several alternative measures of liquidity in the U.S. Treasury
market, Fleming (2003) finds that the quoted bid-ask spread is the most highly correlated with
both direct estimates of price impact and well-known episodes of poor liquidity in that
market.22 Panel A of Table 1 reports summary statistics over the basic sample 2001-2007 for
22See also Chordia, Sarkar, and Subrahmanyam (2005) and Goldreich et al. (2005). Data availability consid-
erations prevent us from estimating alternative measures of illiquidity or the portion of the bid-ask spread due
to adverse selection, i.e., net of order processing or inventory costs (see, e.g., Stoll (1989), George, Kaul, and
23

the following variables: Average daily quoted bid-ask spread () and daily trading volume
() for each of the benchmark Treasury securities in our sample. We also plot the
corresponding time series of in Figure 2.
[Insert Table 1 and Figure 2 here]
The secondary market for on-the-run Treasury notes and bonds is extremely liquid.
Average trading volumes are high and quoted bid-ask spreads are small; both are close to what
is reported in other studies (e.g., Fleming (2003), Fleming et al. (2017), among others). Not
surprisingly, bid-ask spreads display large positive first-order autocorrelation ( (1) 0).
Notably, Figure 2 suggests that bid-ask spreads are wider in the earlier portion of the sample
(2001-2004), before sharply declining afterwards (2005-2007). Corresponding summary
statistics (in Panels B and C of Table 1, respectively) confirm this pattern in Treasury bond
market liquidity. We further discuss this feature of the data and address its implications for
our analysis in Section 2.1 of the Internet Appendix; see also Section IV.B below. Since being
discontinued in 1998, three-year notes have been issued by the U.S. Treasury only between
February 2003 and May 2007, and from November 2008 onward.23 Data for three-year notes
also has significant gaps in BrokerTec market coverage, restricting our analysis of that maturity
segment to the sub-period 05/2003-03/2007. Figure 2 reveals occasional gaps in coverage for
ten-year notes and thirty-year bonds as well. Bid-ask spreads for Treasury securities are
increasing (and their liquidity is generally decreasing) with their maturity. Two-year Treasury
notes are characterized by the highest average daily trading volume ($209 billion) and the
smallest average spread, 1096 bps (i.e., 1096 percent of one point). The latter implies an
average roundtrip cost of about $22 000 for trading $200 million par notional of these notes
(i.e., $200 000 000× 109610 000 = $21 920), an amount routinely available on BrokerTec atNimalendran (1991)).23E.g., see https://www.treasurydirect.gov/indiv/research/history/histtime/histtime_notes.htm.
24

the best bid and ask prices (Fleming et al., 2017). BrokerTec bid-ask spreads for thirty-year
Treasury bonds are not only the highest among the securities in our sample (8322 bps, or
$166 440 per $200 million face value), but also higher than those typically observed on the
eSpeed platform (e.g., Mizrach and Neely (2006)). This may reflect the historical dominance of
Cantor Fitzgerald – eSpeed’s founder – in interdealer trading at the “long end” of the
Treasury yield curve.
III.B Permanent Open Market Operations
Our basic sample is a database of all permanent (outright) open market operations
(POMOs) executed by the Federal Reserve Bank of New York (FRBNY) between January 1,
2001 and December 31, 2007.24 As noted earlier, we consider POMO activity during the crisis
period 2008-2009 in Section 2.2 of the Internet Appendix; see also Section IV.B below. POMOs
are executed by the Desk through an auction with primary dealers usually taking place
between 10:00 a.m. and 11:30 a.m. ET (“Fed Time;” see Akhtar (1997), Harvey and Huang
(2002), and D’Amico and King (2013)), i.e., when intraday market liquidity is relatively high
(Fleming (1997), Fleming et al. (2017)). This process consists of multiple steps. Between 10:00
a.m. and 10:30 a.m. (“Release Time”), the Desk announces a list of eligible Treasury securities
(i.e., of CUSIPs) for the auction. This list typically includes all securities within a specific
maturity segment targeted by the Desk (in order to “achieve a liquid and diversified portfolio
structure;” FRBNY (2005, p. 20)), with the exception of the cheapest-to-deliver in the futures
market and any highly scarce (i.e., on special) security in the repo market. The auction closes
between 10:45 a.m. and 11:30 a.m. (“Close Time”). Within a few minutes afterwards, the Desk
selects among the submitted bids using a proprietary algorithm and publishes the auction
results. Following these trades, the reserve accounts of the Desk’s counterparties (the dealers’
banks) at the FRBNY are credited or debited accordingly, thus permanently altering the
24This database is available at https://www.newyorkfed.org/markets/OMO_transaction_data.html.
25

aggregate supply of nonborrowed reserves in the monetary system.
Our database contains salient information on the Desk’s POMOs: Their dates, release
and close times, actual securities traded (CUSIPs), descriptions (coupon rate and maturity),
and par amounts accepted at the auction. In order to capture the Desk’s stated focus on broad
maturity segments (rather than on specific securities), we group all auctioned securities based
on their remaining maturity into five brackets centered around the maturities of the on-the-run
securities available in the BrokerTec database: Two-year, three-year, five-year, ten-year, and
thirty-year POMOs. Characterizing these maturity brackets is unavoidably subjective. As in
D’Amico and King (2013), we label a FRBNY transaction as i) a two-year POMO if the
remaining maturity of the traded security is between zero and four years; ii) a three-year
POMO if the remaining maturity of the traded security is between one and five years; iii) a
five-year POMO if the remaining maturity of the traded security is between three and seven
years; iv) a ten-year POMO if the remaining maturity of the traded security is between eight
and twelve years; and v) a thirty-year POMO if the remaining maturity of the traded security
is greater than twelve years. The first three brackets are partially overlapping because of the
high substitutability of shorter-maturity Treasury securities (e.g., D’Amico and King (2013)).
As we discuss next, our inference is unaffected by this sorting procedure and robust to
alternative and/or non-overlapping bracket definitions. The extremely scarce liquidity of most
off-the-run issues precludes a security-level analysis of price formation in the presence of
POMOs. Our inference is likely only weakened by this aggregation.
Table 2 contains summary statistics of POMOs for each maturity bracket, as well as for
every intervention day (labeled Total), over three partitions of our basic sample: 2001-2007
(Panel A), 2001-2004 (Panel B), and 2005-2007 (Panel C). The FRBNY’s Desk executed
POMOs in 217 days between 2001 and 2007. When doing so, the Desk traded an average of
about 25 different securities on any single day in which it intervened. As mentioned above, this
suggests that POMOs do not target (nor appear to significantly affect the supply of) any
26
particular security within a maturity bracket. POMOs occur most frequently at the shortest,
most liquid segments of the yield curve, the two-year to five-year maturities. As Table 2 shows,
occasionally the Desk trades securities in more than one maturity bracket. Daily total par
amounts accepted () average between $343 million for ten-year bonds and $1152
billion for three-year notes. While sizeable, these amounts are significantly lower than sample
average daily trading volume not only in the on-the-run Treasury securities in our dataset
(between $19 billion and $209 billion; see in Table 1) but also in the whole secondary U.S.
Treasury market ($469 billion).25
[Insert Table 2 and Figure 3 here]
Figure 3 plots the daily total par amount of the FRBNY’s POMOs (, solid
column), the end-of-day federal funds rate (dotted line), and the corresponding target rate set
by the FOMC (solid line) over our sample period. POMOs appear to cluster in time –
especially during the earlier, less liquid, and more volatile interval 2001-2004 (see Panel B of
Tables 1 and 2) – yet still occur in every year of the sample. Importantly, the Desk executed
exclusively purchases (, 0) between 2001 and 2007, regardless of the
interest rate environment, both in aggregate (Figure 3) and in each of the maturity brackets
(Table 2). This behavior reflects the Desk’s efforts to accommodate the persistent growth in
the demand for U.S. money (mirroring the growth in the economy) by expanding the supply of
nonborrowed reserves (Akhtar (1997), Edwards (1997)) and is consistent with our prior
observation that POMOs are uninformative about the FOMC’s monetary policy stance over
our sample period.
25This average is computed from trading volume data reported by primary dealers to the FRBNY and available
at https://www.newyorkfed.org/markets/gsds/search.html. Government interventions in currency markets are
of similar relative magnitude (see, e.g., Neely (2005), Pasquariello (2007b)).
27

IV Empirical Analysis
In this section we test the implications of our model for the impact of POMOs on the
process of price formation in the secondary market for U.S. Treasury securities. We proceed in
two steps. First, we test whether POMOs improve Treasury market liquidity. Second, we assess
whether this effect depends on that market’s information environment, as postulated by our
model.
IV.A POMOs and Market Liquidity
The main prediction of our model is that outright trades by the FRBNY (POMOs)
lower the equilibrium price impact of order flow (∆ ≡ − 0, Conclusion 1). Intuitively,
this outcome stems from uninformative POMOs alleviating adverse selection risk for the MMs.
As discussed in Section III.A.1, in this paper we capture a Treasury security’s daily market
liquidity with that security’s average daily bid-ask price spread, . Accordingly, our model
predicts a tighter bid-ask spread (i.e., a lower ) for the targeted maturity bracket in days
when POMOs occur.
To test this prediction, we use an event study methodology based on a well-established
literature analyzing the impact of exogenous public announcements on asset prices (e.g., see
Andersen, Bollerslev, Diebold, and Vega (2003), (2007), and references therein). These studies
estimate that impact using only announcement days to mitigate omitted variable biases. We
begin by defining liquidity changes on any POMO day as ∆ ≡ −
, the difference
between the average bid-ask price spread on the day a POMO occurred, , and a benchmark
pre-intervention level, . Because POMOs often cluster in time (e.g., see Figure 3), we do not
compare to the average bid-ask price spread on the day before a POMO occurred (i.e.,
= −1). Instead, we compute
as the average bid-ask price spread over the most recent
previous 22 trading days when no POMO occurred (e.g., Pasquariello (2007b)). In Section 2.3
28

of the Internet Appendix we show that alternative pre-intervention intervals lead to similar
inference; see also Section IV.B. We then compute means of these differences for each
on-the-run Treasury note and bond in our BrokerTec sample i) over days when POMOs
occurred in the corresponding maturity bracket (i.e., when the event dummy = 1); as well
as ii) over days when any POMO occurred (i.e., when the event dummy = 1), because of
extant evidence of relatively high substitutability of on-the-run Treasury securities (e.g., Cohen
(1999), Greenwood and Vayanos (2010), and D’Amico and King (2013)).26 We report these
averages, labeled ∆, in Table 3.
27
[Insert Table 3 here]
Consistent with our model, these univariate tests show that mean daily bid-ask spreads
decline on both same-maturity and any-maturity POMO days. Estimates for ∆ in Table 3
are always negative, much larger than their sample means (in Table 1), and both statistically
and economically significant at most maturities. Same-maturity POMOs have a more
discernible impact on the liquidity of Treasury notes than on the liquidity of Treasury bonds
(for which the number of event days is much smaller). For instance, total roundtrip costs per
daily trading volume in benchmark five-year Treasury notes (, in Table 1) decline on average
by about $380 000 (∆ = (−021510 000)× $176 billion) – i.e., by 37% of the sample
standard deviation of ∆ (0580, in Table 1) – on days when the Desk is trading these
securities. Table 3 also provides evidence of liquidity spillovers in correspondence with any
26Spillover of the positive liquidity externalities of government intervention described in Conclusion 1 across
highly substitutable assets would likely occur in any model of multi-asset trading in which adverse selection
considerations affect equilibrium market liquidity (e.g., see Pasquariello (2007a) and references therein).27The occasional gaps in BrokerTec coverage and the quote filtering procedures described in Section III.A result
in a loss of some event days in the merged BrokerTec/POMO sample, especially for on-the-run three-year notes
(whose issuance only resumed in 2003 after a five-year hiatus; see Section III.A.1).
29

outright trade by the FRBNY: On any-maturity POMO days, ∆ 0, large (e.g., amounting
to 7% to 16% of their mean bid-ask spreads , in Table 1), and statistically significant at all
maturities (perhaps due to the greater number of any-maturity POMO days for both notes and
bonds), regardless of the segment of the yield curve targeted by the Desk.28 As discussed in
Section III.B, these estimates are obtained from on-the-run Treasury securities in the targeted
segments, rather than from the actual securities being traded by the Desk, because of the often
scarce liquidity of the latter. Thus, they are likely to underestimate the true extent of the
impact of POMOs on Treasury market liquidity.29
Improvements in Treasury market liquidity in proximity of POMOs may be due to
changes in bond characteristics and calendar effects unrelated to FRBNY interventions. For
instance, changes in Treasury securities’ sensitivity to yield dynamics (as proxied by modified
duration, , and convexity, ) may affect their perceived riskiness to dealers and investors
(e.g., Strebulaev (2002), Goldreich et al. (2005), and Pasquariello and Vega (2009)). Bid-ask
spreads and trading activity also display weekly seasonality and time trends (e.g., Fleming
(1997), (2003), Pasquariello and Vega (2007)). In particular, as noted earlier, bid-ask spreads
on the BrokerTec platform have considerably tightened – and trading volume has likewise
increased – over our sample period, especially from 2005 onward. These effects may either
28Of course, the any-maturity POMO evidence in Table 3 is unaffected by the POMO classification into
maturity brackets described in Section III.B (based on D’Amico and King (2013)). Untabulated analysis shows
that alternative (including non-overlapping) maturity brackets yield similar or stronger same-maturity POMO
evidence.29As noted earlier, during our sample period, the Desk generally refrained from executing POMOs with “on-
the-run Treasury securities, which have larger liquidity premia and are typically most susceptible to liquidity
squeezes, so as to avoid adverse market impact” (FRBNY (2005, p. 20)). Specifically, the Desk never executed
POMOs with on-the-run securities over the pre-crisis period 2001-2007, and purchased only six of them (one per
separate POMO day) during the financial crisis period 2008-2009 (versus an average of 73 Treasury securities
per POMO day over 75 POMO days; Panel D of Table 2); see also the discussion in Sections 2.2 and 2.4 of the
Internet Appendix.
30

enhance or distort the impact of POMOs on the process of price formation in the Treasury
bond market.
We assess the robustness of our univariate inference to these considerations by
specifying a multiple regression event-study model of bid-ask price spread changes, i.e., for only
same-maturity ( = 1) or any-maturity POMO days ( = 1), as follows:
∆ = + + ∆∆
+ ∆∆ + , (8)
where is a time-trend variable, ∆ ≡ −
, ∆ ≡ −
, and and
are average modified duration and convexity over the most recent previous 22 trading days
when no POMO occurred, respectively. We consider additional explicit controls in Section 2.4
of the Internet Appendix; see also Section IV.B below. Estimates of the intercept in
equation (8) measure average changes in Treasury bid-ask spreads on POMO days (i.e., relative
to the prior 22 non-POMO days) net of calendar effects and contemporaneous changes in bond
characteristics. We also specify a similar model using all trading days:
∆ = 0 + + ∆∆
+ ∆∆ + + , (9)
where either = or = , and is a vector of day-of-the-week, month,
and year dummies.30 Estimates of the event dummy coefficient in equation (9) capture
any additional effect of POMOs on ∆ relative to its average over all other trading days in
the sample period (i.e., the constant 0).
We estimate equations (8) and (9) for each on-the-run maturity in our database
separately by ordinary least squares (OLS). We evaluate the statistical significance of the
coefficients’ estimates, reported in Table 3, with Newey-West standard errors to correct for
heteroskedasticity and serial correlation. The results in Table 3 provide further support for our
30The time series are made of several different on-the-run securities stacked on each other over the sample
period (as in Brandt and Kavajecz (2004), Green (2004), and Pasquariello and Vega (2007), (2009)). Unreported
analysis shows our inference to be insensitive to the inclusion of security fixed effects in equations. (8) and (9).
31
model’s main prediction. Consistent with the prior univariate evidence, bid-ask spreads tend to
decline (i.e., 0 and 0) both when same-maturity and any-maturity POMOs
occur – and this decline is especially significant for the latter, i.e., in correspondence with
liquidity spillovers and a greater number of any-maturity POMO days. Controlling for calendar
effects and bond characteristics strengthens our inference: For instance, all estimated intercepts
in equation (8) are larger (in absolute magnitude) than the corresponding means ∆.
As in prior event-study research, POMOs’ liquidity externalities are instead smaller when
estimated over all trading days (i.e., || ¯̄
¯̄). Regardless of the methodology used,
the estimated decline in bid-ask spread accompanying POMO days remains both statistically
and economically significant – e.g., amounting on average to 53% (14%) of the corresponding
sample mean (in Table 1), and to more than 50% (25%) of the standard deviation of the
corresponding spread change (also in Table 1), when measured by ().
Lastly, we note that our empirical strategy follows Harvey and Huang (2002) in that we
use an indicator variable for POMO days rather than estimate the effect of the magnitude of
POMOs on Treasury market liquidity. As Harvey and Huang (2002) emphasize, such an
estimation is problematic since the econometrician does not know how much of each POMO
trade is unexpected by market participants.31 In addition, our model predicts that the mere
presence of government intervention improves market liquidity (Conclusion 1). However, both
the actual central bank trade () and market depth (1
) are endogenously determined in
31For instance, the FRBNY has only recently begun to preannounce monthly and daily expected POMO
amounts, while executing extraordinary monetary policy measures in the aftermath of the 2008-2009 financial
crisis (i.e., since August 2010, at https://www.newyorkfed.org/markets/tot_operation_schedule.html; see also
Section 2.2 of the Internet Appendix and Section IV.B below). Estimating those amounts would introduce
generated-regressor biased standard errors in our empirical analysis. We nonetheless develop a proxy for uncer-
tainty surrounding POMO policy in Section IV.C.3. The ensuing evidence suggests that our baseline empirical
results in Table 3 are only weakened by assuming uniform POMO policy uncertainty on every POMO day in our
sample.
32

equilibrium, as for any strategic order flow in Kyle (1985). Accordingly, most empirical
literature advocates the use of order imbalance (number of transactions per period, in the spirit
of equations (8) and (9)), instead of trading volume, when assessing the impact of order flow on
price formation in financial markets (see, e.g., Hasbrouck (1991), (2007), Jones, Kaul, and
Lipson (1994), Evans and Lyons (2002), Chordia and Subrahmanyam (2004), Green (2004),
Pasquariello and Vega (2007), Chordia, Hu, Subrahmanyam, and Tong (2017), Pasquariello
(2017)).32
IV.B POMOs and Market Liquidity: Robustness
The evidence in Table 3 suggests that Treasury market liquidity improves on POMO
days, consistent with the main prediction of our model. In Section 2 of the Internet Appendix,
we assess the robustness of this evidence and its conformity to alternative interpretations.
In particular, we find our inference to be qualitatively similar yet stronger within the
earlier portion of our sample (2001-2004) – when bid-ask spreads are much wider and more
volatile – than in the calmer latter period (2005-2007), as well as robust to extending our
analysis to all available GovPX data within our sample period (i.e., over 2001-2004) to account
for the aforementioned gradual migration of most trading in on-the-run Treasury securities
from voice-brokered (GovPX) to electronic intermediation (BrokerTec and eSpeed); see Section
2.1 and Table IA-1 of the Internet Appendix. We also find that the estimated liquidity
externalities of the more numerous and larger POMOs executed during the recent financial
crisis (2008-2009; Panel D of Table 2 and Figure 3) are consistent with our model’s main
32For example, when studying the microstructure of the U.S. stock market, Jones et al. (1994, p. 631) find
that “it is the occurrence of transactions per se, and not their size, that generates [price] volatility; trade size has
no information beyond that contained in the frequency [i.e., number] of transactions.” Hasbrouck (2007, p. 90)
attributes such findings to the fact that, as in our model of Section 2, “agents trade large amounts when price
impact is low, and small amounts when price impact is high.” See also the discussion in Pasquariello (2017).
33
prediction in Conclusion 1, despite the ensuing economic and financial turmoil (see, e.g., Figure
4 below) and likely effects on both liquidity provision (otherwise worsening; Panel D of Table 1
and Figure 2) and the Federal Reserve’s policy goals in the Treasury market; see Section 2.2
and Table IA-2 of the Internet Appendix.
We then ascertain that our inference is robust to such alternative specifications as the
estimation of ∆, , and over different pre-intervention periods, during the intraday
ninety-minute Fed Time interval when the FRBNY typically announces and executes its
POMOs (10:00 a.m. to 11:30 a.m.; see Section III.B), as well as for percentage bid-ask spreads
≡ ( −) £12( +)
¤; see Section 2.3 and Table IA-3 of the Internet Appendix. Lastly,
we consider several alternative interpretations of the evidence in Table 3 related to Treasury
market conditions during POMO activity (like dealers’ inventory levels, pre-auction illiquidity,
bank reserves, or relative security supply), and show that our inference is robust to explicitly
controlling for such additional factors related to those conditions as repo specialness, Treasury
auction outcomes, pre-Fed Time and end-of-year on-the-run illiquidity, the Desk’s repo trading
activity, reserve maintenance periods, dates of and distance from FOMC meetings, and the
release of important U.S. macroeconomic announcements (listed in Section IV.C.1 below) –
hence mitigating potential omitted variable biases in that inference (notwithstanding the
discussion in Section 1 above); see Section 2.4 and Table IA-4 of the Internet Appendix.
IV.C POMOs and the Information Environment of the Market
The evidence in Table 3 provides support for our model’s main prediction (in
Conclusion 1): POMOs executed by the FRBNY’s Desk in the secondary market for Treasury
securities meaningfully improve Treasury market liquidity. Our model attributes this effect to
the impact of government intervention on the Treasury market’s information environment. In
this section, we assess more directly this basic, novel premise of our theory by testing its
34

unique, additional predictions for Treasury market liquidity (also in Conclusion 1).
IV.C.1 Information Heterogeneity
The first prediction from Conclusion 1 states that, ceteris paribus, greater information
heterogeneity among speculators (i.e., lower ) magnifies the positive liquidity externalities of
government intervention (i.e., a more negative ∆, as in Figure 1c). Intuitively, more
heterogeneously informed speculators trade more cautiously to protect their perceived private
information monopoly. The ensuing greater adverse selection risk for the MMs worsens market
liquidity, i.e., increases the equilibrium price impact of aggregate order flow. In those
circumstances, central bank trades attempting to achieve a non-public, uninformative policy
target more significantly mitigate the more severe threat of adverse selection in market-making.
Testing for this prediction requires measurement of the heterogeneity of private
information about fundamentals among sophisticated Treasury market participants.
Marketwide information heterogeneity is commonly proxied by the standard deviation across
professional forecasts of economic and financial variables (e.g., Diether, Malloy, and Scherbina
(2002), Green (2004), and Yu (2011)). In this paper we consider two proxies for based on the
notion that U.S. macroeconomic variables may contain payoff-relevant information for U.S.
Treasury securities; accordingly, numerous studies find that government bond returns and
market quality are sensitive to the release of these variables to the public (e.g., see Pasquariello
and Vega (2007), Brenner, Pasquariello, and Subrahmanyam (2009), and references therein).
These proxies employ the only continuously available surveys of U.S. macroeconomic forecasts
over our sample period, namely those collected by the Federal Reserve Bank of Philadelphia
(the Survey of Professional Forecasters (SFS)) and by Bloomberg.
The SPF, initiated in 1968 by the American Statistical Association and the National
Bureau of Economic Research, is commonly used in empirical research on the formation of
macroeconomic expectations. Croushore (1993) provides a detailed description of the SPF
35

database. SPF data is available exclusively at the quarterly frequency. For each quarter , the
SPF database contains tens of individual forecasts by private sector economists (working at
financial firms, banks, economic consulting firms, university research centers, and Fortune 500
companies) for various macroeconomic variables and at various future horizons. We focus on
next-quarter forecasts for the most important of them: Nonfarm Payroll, Unemployment,
Nominal Gross Domestic Product (GDP), Consumer Price Index (CPI), Industrial Production,
and Housing Starts (e.g., Andersen and Bollerslev (1998), Andersen et al. (2003), (2007),
Pasquariello and Vega (2007), Brenner et al. (2009), and Gilbert, Scotti, Strasser, and Vega
(2017); see also Section 2.4 of the Internet Appendix and Section IV.B above). Bloomberg
surveys professional forecasts of U.S. macroeconomic announcements at the frequency of their
release to the public. This data is available to us only for Nonfarm Payroll, which is released on
a monthly basis and is labeled by Andersen and Bollerslev (1998, p. 240) as the “king” of
macroeconomic announcements because of its significant impact on financial markets.
We define the dispersion of beliefs among speculators for each macroeconomic variable
in the SPF dataset in quarter as the standard deviation of all of that variable’s next-quarter
forecasts available in that quarter, . We similarly compute the monthly standard
deviation of all of the Nonfarm Payroll forecasts available in Bloomberg in month , .
Since units of measurement differ across macroeconomic variables, we then divide the difference
between each (or ) and its sample mean by its sample standard deviation (e.g.,
Pasquariello and Vega (2007)) and then add five (to ensure that each information variable is
always positive). This yields time series of scaled, standardized dispersion of analyst forecasts,
and . Lastly, we compute our proxies for the aggregate degree of
information heterogeneity about U.S. macroeconomic fundamentals as either (the
simple average of all available ; see Figure 4a) or (see Figure 4b), such that
the greater is either proxy the lower may be in the U.S. Treasury market.
36

[Insert Figure 4 here]
As in Section 4.1, we assess the impact of marketwide information heterogeneity on
POMOs’ positive liquidity externalities in several ways. We estimate univariate regressions of
average bid-ask spread changes ∆ over (same-maturity or any-maturity) POMO days alone
( = 1 or = 1) on the contemporaneous realizations of either = or
= :
∆ = + + . (10)
We also amend the multiple regression models of equations (8) and (9) to include either the
information variable ( or ) using only POMO days:
∆ = + + ∆∆
+ ∆∆ + + , (11)
or both and its cross-products with same-maturity and any-maturity POMO dummies
( = and = ) using all trading days:
∆ = 0 + + ∆∆
+ ∆∆ + (12)
+ + + .
Estimates of the slope coefficient in equation (10) capture any state dependency (from
) in bid-ask spread changes on POMO days alone. Estimates of the interaction coefficient
in equation (11) capture that state dependency while controlling for calendar effects and
changes in bond characteristics. Estimates of the interaction coefficient in equation (12)
capture that state-dependency with respect to changes over the whole sample period.33
33According to our basic model (see Proposition 1, in Section II.A) and extant empirical evidence (e.g., Pasquar-
iello and Vega (2007)), the Treasury market’s information environment may affect its equilibrium liquidity (
of equation (3)) even in absence of central bank interventions (i.e., even in non-POMO days). Thus, our low-
frequency information measures are likely to impact both and such that these effects may cancel out
in ∆ ≡ − . Consistently, untabulated estimates of in equation (12) reveal ∆ to be largely
insensitive to on non-POMO days.
37

The linear specifications of equations (10) to (12) are standard in the literature (e.g., see
Pasquariello and Vega (2015), Pasquariello (2017)) and allow us to estimate the statistical
significance of the continuous effect of any state variable on POMOs’ liquidity externalities.
However, the scale of affects the scale of the resulting OLS estimates for ,
, and
. Thus, exclusively to ease their interpretation and assess their economic significance, we
multiply each of those coefficients by a hypothetical discrete increase in the information
variable from the bottom (i.e., “low”) 30 percentile (30
) to the top (i.e., “high”) 70
percentile (70
) of its empirical distribution. We report these scaled estimates
∆∆ ≡
³70
−30
´, ∆ ≡
³70
−30
´, and
∆ ≡
³70
−30
´for either = or = in Panels A and
B of Table 4, respectively. By construction, ∆∆ , ∆, and ∆
are in the same unit
as the dependent variable ∆ (i.e., bps); their sign and statistical significance are unaffected
by alternative scaling factors (e.g., different high-low ranges for or the sample standard
deviation of ).
[Insert Table 4 here]
Consistent with Conclusion 1, POMOs’ positive liquidity externalities are increasing in
our proxies for marketwide information heterogeneity (i.e., decreasing in ) – ∆∆ ,
∆, and ∆ are negative and statistically significant – in correspondence with both
same-maturity ( = 1) and any-maturity POMOs ( = 1), for both on-the-run Treasury
notes and bonds. For instance, Panel A of Table 4 shows that on average, bid-ask spreads for
two-year, five-year, and ten-year Treasury notes on any-maturity POMO days when our
broad-based proxy for marketwide dispersion of beliefs = is high decline by roughly
110% (of the baseline effect in Table 3) more – or about 0185 bps more – than when
is low (i.e., mean significant ∆ = 110). Panel A of Table 4 further indicates that,
38

in correspondence with government intervention at the long-end of the yield curve, bid-ask
spreads for thirty-year Treasury bonds when is high are nearly 2 bps lower than when
is low (i.e., ∆∆ = −1537, ∆ = −1897, and ∆
= −1664). Those
estimates are qualitatively similar, albeit smaller and less often statistically significant, when
obtained from the (noisier) monthly series of dispersion of Nonfarm Payroll forecasts alone (i.e.,
when = ; see Figure 4b) in Panel B of Table 4. This evidence suggests that
government interventions have a greater impact on the process of price formation in the
secondary market for Treasury securities when information heterogeneity among speculators is
high, as postulated by our model.
IV.C.2 Fundamental Uncertainty
The second prediction from Conclusion 1 states that, ceteris paribus, greater
uncertainty about the traded asset’s payoff (i.e., higher 2) amplifies the impact of government
intervention on market liquidity – i.e., leads to higher |∆| (Figure 1d). Greater fundamental
uncertainty worsens equilibrium market liquidity, for it makes speculators’ private information
more valuable and the accompanying adverse selection risk for the MMs more severe. As
discussed above, this enhances the positive liquidity externalities of central bank trades.
To evaluate this implication of our model, we use two proxies for 2. The first one is
(plotted in Figure 4c), the monthly average (to smooth daily variability) of daily
Eurodollar implied volatility from Bloomberg. The second one is (in Figure 4d), the
monthly average of daily realizations of the yield curve-weighted MOVE index of the
normalized implied volatility on one-month Treasury options from Merrill Lynch. Both
and are commonly used as measures of market participants’ perceived
uncertainty surrounding U.S. macroeconomic fundamentals (e.g., Bernanke and Kuttner
(2005), Pasquariello and Vega (2009)). We then run the same univariate and multiple
regressions for spread change differentials described in Section IV.C.1 – which yield scaled
39

estimates ∆∆ for the former, ∆ and ∆
for the latter – after imposing that
either = or = . We report these estimates in Panels A and B of
Table 5, respectively.
[Insert Table 5 here]
Consistent with Conclusion 1, ∆∆ , ∆, and ∆
are always negative in
Table 5, and nearly always statistically significant when proxying for fundamental uncertainty
with = . For example, Panel B of Table 5 shows that during any-maturity POMO
days when is historically high, the bid-ask spreads for ten-year Treasury notes
decline by roughly 03 bps more than when is low (i.e., a statistically significant
∆∆ = −0309, ∆ = −0271, and ∆
= −0295). This effect is economically
significant as well, for it amounts to roughly 32% of the sample standard deviation of ∆ in
Table 1. Those estimates are rarely statistically significant for = , in Panel A of
Table 5. Yet, in those circumstances bid-ask spreads tighten much more pronouncedly on
POMO days characterized by higher Eurodollar volatility – e.g., by no less than 100% of the
baseline decline in spread reported in Table 3. This evidence suggests that government
interventions are accompanied by a greater improvement in Treasury market liquidity when
fundamental uncertainty is greater, as implied by our model.
IV.C.3 POMO Policy Uncertainty
The last prediction from Conclusion 1 states that, ceteris paribus, greater uncertainty
about the central bank’s uninformative policy target among market participants (i.e., higher
2 ) enhances the improvement in equilibrium market liquidity accompanying its trades (∆, as
in Figure 1b). Greater policy uncertainty complicates the MMs’ attempt at accounting for the
extent of uninformative government intervention in the aggregate order flow before setting the
40

equilibrium price 1. Yet, it also lowers their perceived adverse selection risk from trading with
informed speculators.
As discussed in Sections 2.2 and 3.2, the FRBNY’s Desk targets the aggregate level of
nonborrowed reserves available in the banking system via uninformative POMOs to ensure that
conditions in the federal funds rate market are “consistent” with the publicly known target rate
set by the FOMC.34 Thus, uncertainty among market participants about the FRBNY’s
non-public and uninformative reserve target for POMOs may manifest itself in the federal
funds market. Accordingly, we measure marketwide policy uncertainty surrounding the Desk’s
POMOs with (plotted in Figure 4e), the monthly average (to smooth daily
variability) of daily standard deviation of the federal funds rate, from the FRBNY.35
Importantly, in unreported analysis we find to be virtually unrelated to our
proxies for marketwide dispersion of beliefs () and uncertainty (2) about U.S. macroeconomic
fundamentals described in Sections IV.C.1 and IV.C.2. We then assess the sensitivity of spread
changes in correspondence with POMOs to = by means of the same univariate
and multiple regressions of Section IV.C.1.
Both sets of tests, in Table 6, provide further support for our model. As postulated by
Conclusion 1, once again the resulting scaled estimates ∆∆ , ∆, and ∆
are
negative for most maturities and in correspondence with both same-maturity ( = 1) and
any-maturity POMOs ( = 1). Hence, these estimates suggest that liquidity improves more
pronouncedly on POMO days when uncertainty about the Desk’s policy (proxied by
) is greater. This effect is especially strong for thirty-year Treasury bonds.
According to Table 6, those bonds’ bid-ask price spreads on same-maturity POMO days when
34For example, the website of the FRBNY (https://www.newyorkfed.org/markets/pomo_landing.html) states
that “[p]urchases or sales of Treasury securities on an outright basis have been used historically to manage the
supply of reserves in the banking system [...] to maintain conditions in the market for bank reserves consistent
with the federal funds target rate set by the [FOMC].”35This data is available at https://apps.newyorkfed.org/markets/autorates/fed%20funds.
41

is historically high are about 17 bps (∆∆ = −1657 and ∆
= −1740, or
about 20% of its sample mean in Table 1) lower than when is low. Table 6 also
shows that, when negative and statistically significant, the estimated slope and cross-product
coefficients ∆ and ∆ for Treasury securities of shorter maturity are also large – e.g.,
ranging between 14% and 63% of the baseline estimated decline of their bid-ask spreads on
any-maturity POMO days in Table 3 (i.e., of and of equations (8) and (9),
respectively).
[Insert Table 6 here]
In short, the evidence in Tables 4 to 6 indicates that the Treasury market’s information
environment importantly affects the impact of government interventions on its process of price
formation, as uniquely predicated by our model – thus also further alleviating the
aforementioned concerns about alternative interpretations and potential omitted variable biases
plaguing our inference from Table 3.
V Conclusions
The many severe episodes of financial turmoil affecting the global economy in the past
decade have led to increasing calls for greater, more direct involvement of governments and
monetary authorities in the process of price formation in financial markets. The objective of
this study is to shed light on the implications of this involvement for financial market quality.
To that purpose, we investigate the impact of permanent open market operations
(POMOs) by the Federal Reserve Bank of New York (FRBNY) – on behalf of the Federal
Reserve System – on the liquidity of the secondary U.S. Treasury bond market. POMOs are
outright (i.e., definitive) trades in previously issued U.S. Treasury securities (i.e., permanently
42

affecting the supply of nonborrowed reserves in the banking system) to accomplish a
non-public, uninformative reserve target consistent with the monetary policy stance set and
publicly announced by the Federal Open Market Committee (FOMC). To guide our analysis,
we construct a parsimonious model of trading in the Treasury market in which – consistent
with much recent empirical evidence – the presence of strategic, heterogeneously informed
speculators enhances adverse selection risk for uninformed market-makers (MMs). In this basic
setting, we introduce a stylized central bank facing a trade-off between a non-public,
uninformative policy goal and its expected cost. The main novel insight of our model is
twofold. First, contrary to existing literature, the central bank’s trading activity improves
equilibrium market liquidity because it alleviates MMs’ adverse selection concerns when facing
the aggregate order flow – thanks to the uninformativeness of its non-public target. Second,
the extent of this improvement is sensitive to the market’s information environment.
Our subsequent empirical analysis of a comprehensive sample of price formation and
FRBNY trades in the secondary U.S. Treasury market during the 2000s provides support for
these predictions. Our evidence shows that i) bid-ask spreads for on-the-run Treasury notes
and bonds decline on days when the FRBNY executes POMOs; and ii) the estimated
magnitude of this decline on POMO days is greater when Treasury market liquidity is lower, as
well as increasing in measures of volatility of U.S. economic fundamentals, marketwide
dispersion of beliefs about them, and uncertainty about the FRBNY’s POMO policy, as
implied by our model.
Overall, these findings indicate that the externalities of government intervention in
financial markets for their process of price formation may be economically and statistically
significant, as well as crucially related to the information environment of the targeted markets.
We believe these are important contributions to current and future research on official trading
activity and market manipulation.
43

VI Appendix
Proof of Proposition 1. The proof is by construction: We first conjecture general
linear functions for the pricing rule and speculators’ demands; we then solve for their
parameters satisfying Conditions 1 and 2; finally, we show that these parameters and functions
represent a rational expectations equilibrium. We start by guessing that equilibrium 1 and
() are given by 1 = 0 +11 and () = 0 +1 (), respectively, where 1 0.
Those expressions and the definition of 1 imply that, for each speculator ,
[1| ()] = 0 +1 () +10 ( − 1) +11 ( − 1) () . (A-1)
Using equation (A-1), the first order condition of the maximization of each speculator ’s
expected profit [ () | ()] with respect to () is given by
0 + ()−0 − ( + 1)10 − 211 ()− ( − 1)11 () = 0. (A-2)
The second order condition is satisfied, since 21 0. For equation (A-2) to be true, it must
be that
0 −0 = ( + 1)10 (A-3)
211 = 1− ( − 1)11. (A-4)
The distributional assumptions of Section II.A imply that the order flow 1 is normally
distributed with mean (1) =0 and variance (1) =21
2 [1 + ( − 1) ] + 2.
Since ( 1) =12, it ensues that
(|1) = 0 +1
2
21
2 [1 + ( − 1) ] + 2
(1 −0) . (A-5)
According to the definition of a Bayesian-Nash equilibrium in this economy (Section II.A),
1 = (|1). Therefore, our conjecture for 1 yields
0 = 0 −10 (A-6)
1 =1
2
21
2 [1 + ( − 1) ] + 2
. (A-7)
44

The expressions for 0, 1, 0, and 1 in Proposition 1 must solve the system made of
equations (A-3), (A-4), (A-6), and (A-7) to represent a linear equilibrium. Defining 10 from
equation (A-3) and plugging it into equation (A-6) leads us to 0 = 0. Thus, it must be that
0 = 0 to satisfy equation (A-3). We are left with the task of finding 1 and 1. Solving
equation (A-4) for 1, we get
1 =1
1 [2 + ( − 1) ] . (A-8)
It then follows from equating equation (A-8) to equation (A-7) that 21 =
22
, i.e. that
1 =
√. Substituting this expression back into equation (A-8) implies that
1 =√
[2+(−1)] . Finally, we observe that Proposition 1 is equivalent to a symmetric Cournot
equilibrium with speculators. Therefore, the “backward reaction mapping” introduced by
Novshek (1984) to find n-firm Cournot equilibriums can be used to prove that, given any linear
pricing rule, the symmetric linear strategies () of equation (2) indeed represent the unique
Bayesian Nash equilibrium of the Bayesian game among speculators (Caballé and Krishnan
(1994)).
Proof of Corollary 1. The first part of the statement stems from the fact that
=√
[2+(−1)] 0. Furthermore,= −
√ [(−1)−2]
2√[2+(−1)]2 0 except in the small region of
{} where ≤ 2−1 .
Proof of Proposition 2. The outline of the proof is similar to the one of the proof of
Proposition 1; see also the proof of Proposition 2 in Pasquariello (2017). We begin by
conjecturing the following functional forms for the equilibrium price and trading activity of
speculators and the central bank: 1 = 0 +11, () = 0 +1 (), and
= 0 + 1 + 2 , respectively, where 1 0. Since [| ()] = () and
[ () |] = , the above expressions and the definition of 1 imply that, for each
45
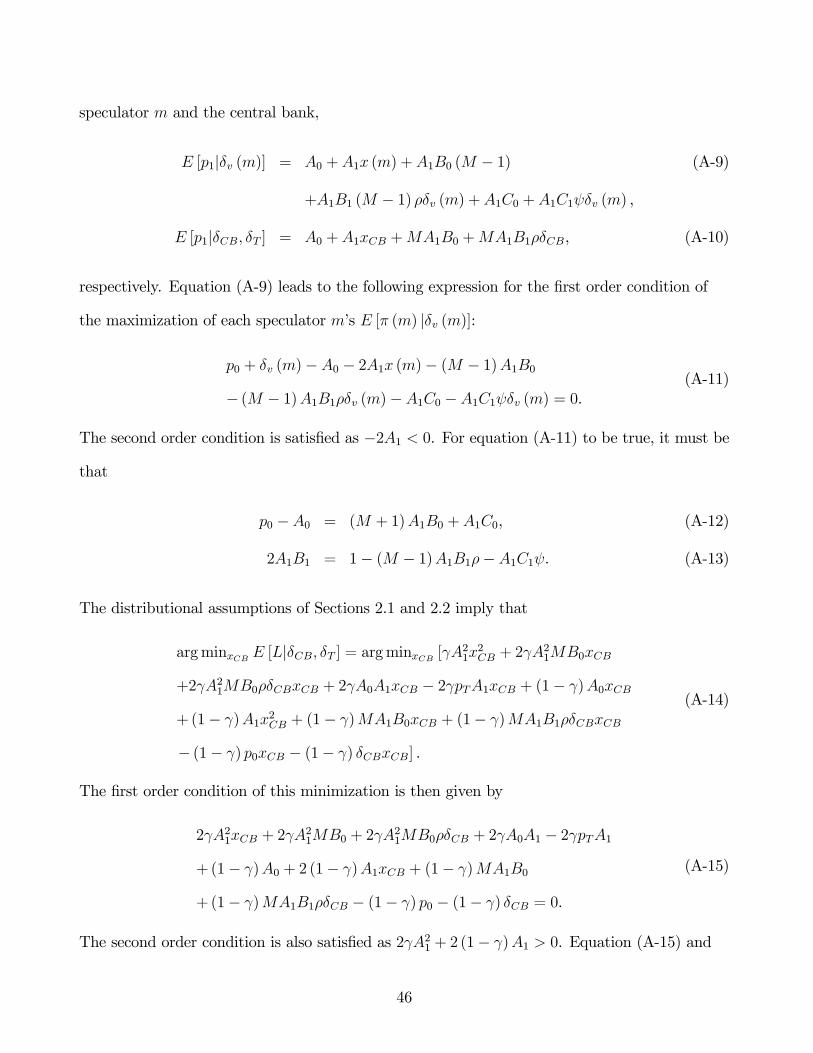
speculator and the central bank,
[1| ()] = 0 +1 () +10 ( − 1) (A-9)
+11 ( − 1) () +10 +11 () ,
[1| ] = 0 +1 +10 +11, (A-10)
respectively. Equation (A-9) leads to the following expression for the first order condition of
the maximization of each speculator ’s [ () | ()]:
0 + ()−0 − 21 ()− ( − 1)10− ( − 1)11 ()−10 −11 () = 0.
(A-11)
The second order condition is satisfied as −21 0. For equation (A-11) to be true, it must be
that
0 −0 = ( + 1)10 +10, (A-12)
211 = 1− ( − 1)11−11. (A-13)
The distributional assumptions of Sections 2.1 and 2.2 imply that
argmin [| ] = argmin [212 + 2210
+2210 + 201 − 21 + (1− )0
+(1− )12 + (1− )10 + (1− )11
− (1− ) 0 − (1− ) ] .
(A-14)
The first order condition of this minimization is then given by
221 + 2210 + 2
210 + 201 − 21
+(1− )0 + 2 (1− )1 + (1− )10
+(1− )11 − (1− ) 0 − (1− ) = 0.
(A-15)
The second order condition is also satisfied as 221 + 2 (1− )1 0. Equation (A-15) and
46

≡
1− imply that
0 −0 = 210 +10 + 2210 + 2
210 + 201 − 21, (A-16)
211 = 1−11− 2211 − 2211, (A-17)
12 = 1 − 212, (A-18)
for our conjectures to be true. It ensues from equation (A-18) that 2 =
1+1. We further
observe that those conjectures also imply that the order flow 1 must be normally distributed
with mean (1) =0 + 0 and variance
(1) =21
2 [1 + ( − 1) ] + 2
12 + 211
2 + 2 + 2
22 . (A-19)
Since ( 1) =12 + 1
2 and 1 = (|1) in equilibrium (Condition 2), it follows
that
1 = 0 +(1
2 + 1
2) (1 −0 − 0)
21
2 [1 + ( − 1) ] + 2
12 + 2112 + 2 + 2
22
. (A-20)
Thus, our conjecture for 1 yields
0 = 0 −10 −10, (A-21)
1 =1
2 + 1
2
21
2 [1 + ( − 1) ] + 2
12 + 2112 + 2 + 2
22
. (A-22)
The expressions for 0, 1, 0, 1, 0, and 1 in Proposition 2 must solve the system made of
equations (A-12), (A-13), (A-16), (A-17), (A-21), and (A-22) to represent a linear equilibrium.
For both equations (A-12) and (A-21) to be true, it must be that 0 = 0. Defining
10 = 0 −0 from equation (A-12) and plugging it into equation (A-16) leads us to
0 = 0 + 21 (0 − ) and 0 = 2 ( − 0). We are left with the task of finding 1, 1,
and 1. Solving equation (A-13) for 1 and equation (A-17) for 1 we get
1 =1−11
1 [2 + ( − 1) ] , (A-23)
1 =1−11 (1 + 21)
21 (1 + 1), (A-24)
47

respectively. The system made of equations (A-23) and (A-24) implies that 1 =2(1+1)−1(1)
and 1 =[2+(−1)]−(1+21)
1(1), where (1) = 2 [2 + ( − 1) ] (1 + 1)− (1 + 21).
Next, we replace the above expressions for 1 and 1 in equation (A-22) to get the following
sextic polynomial in 1,
661 + 5
51 + 4
41 + 3
31 + 2
21 + 11 + 0 = 0, (A-25)
where it is a straightforward but tedious exercise to show that, for the parameter restrictions in
Sections 2.1 and 2.2,
0 = −2£ (2− )
2+ (2− )
2¤ 0, (A-26)
1 = −22©
£8− 6 − 2 (1− )
¤+ 2 (2− )
2ª 0, (A-27)
2 = 2£ (2− )
2+ 4 (2− ) (2− )
¤+ 2
2 [ (2− ) + 2 (2− )]2
+22©
£4 (1− ) + 2 (7− 4) + 5 (4− )− 24¤+ 5 (4− )− 20ª , (A-28)
3 = 22 { [8− (10− 3)] + 2 [16− 5 (2− ) + 8]}
+223©422 (1− ) + 2
£2 (1− ) + (5− 2)− 4¤− (2− )
2ª
+423©22 [2− (3− )] + [8− 3 (2− )− 4] + 2 (2− )
2ª,
(A-29)
4 = 42
4 [ (1− ) + (2− )]2+ 42
4 [ (1− ) + (2− )− 1]
+22©22 [24 + (13 − 36)] + 12 [8− 3 (2− )− 4] + 24 (2− )
2ª,
(A-30)
5 = 423©22 [4− (7− 3)] + [16− 7 (2− )− 8] + 4 (2− )
2ª 0, (A-31)
6 = 424 [ (1− ) + (2− )]
2 0, (A-32)
as well as (by numerical inspection) that (3) = (2) = (1) and
(4) = (5), (4) = (3) = (2), or (3) = (4) = (5) and
(2) = (1), i.e., that only one change of sign is possible while proceeding from the
lowest to the highest power. Descartes’ Rule then implies that the polynomial of equation
(A-25) has only one positive real root satisfying the second order conditions for both the
speculators’ and the central bank’s optimization problems. This root, , is therefore the
48
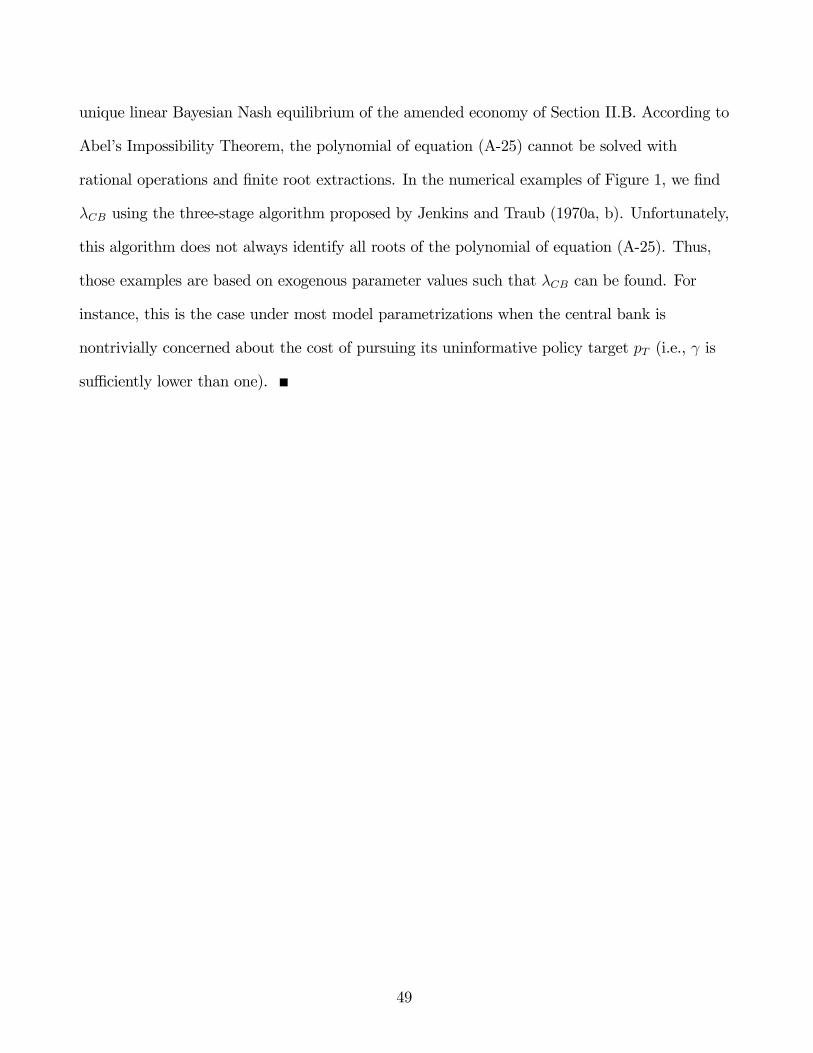
unique linear Bayesian Nash equilibrium of the amended economy of Section II.B. According to
Abel’s Impossibility Theorem, the polynomial of equation (A-25) cannot be solved with
rational operations and finite root extractions. In the numerical examples of Figure 1, we find
using the three-stage algorithm proposed by Jenkins and Traub (1970a, b). Unfortunately,
this algorithm does not always identify all roots of the polynomial of equation (A-25). Thus,
those examples are based on exogenous parameter values such that can be found. For
instance, this is the case under most model parametrizations when the central bank is
nontrivially concerned about the cost of pursuing its uninformative policy target (i.e., is
sufficiently lower than one).
49

Table1.BrokerTec:Descriptivestatistics
Thistablereportsthemean(),standarddeviation(),andfirst-orderautocorrelationcoefficient((1))forvariablesofinterestintheBrokerTec
databaseofquotesforon-the-runtwo-year,three-year,five-year,andten-yearU.S.Treasurynotes,andthirty-yearU.S.Treasurybonds().
Summarystatisticsarecomputedoveri)thebasicsampleperiod(January1,2001toDecember31,2007,inPanelA);ii)theearliersubsample
(January1,2001toDecember31,2004,inPanelB);iii)thelatersubsample(January1,2005toDecember31,2007,inPanelC);andiv)thecrisis
sample(January1,2008toDecember31,2009,inPanelD).Dataforthree-yearnotesisavailableonlybetweenMay7,2003andMarch30,2007.
isthenumberofobservations.Treasurynoteandbondpricesarequotedinpoints,i.e.,arereportedasfractionofparmultipliedby100.is
theaveragedailyquotedbid-askpricespreadinbasispoints(bps),i.e.,furthermultipliedby100.∆ ≡− ,where istheaverage
bid-askpricespreadoverthemostrecentprevious22tradingdayswhennopermanentopenmarketoperation(POMO)occurred.isthedaily
tradingvolume,inbillionsofU.S.dollars.A“∗”,“∗∗”,or“∗∗∗”indicatesstatisticalsignificanceatthe10%,5%,or1%level,respectively.
50

Table1.(Continued)
∆
Segment
(1)
(1)
(1)
PanelA:BrokerTec,01/2001-12/2007
Two-year
1,680
1.096
0.46
0.97∗∗∗
-0.030∗∗∗
0.28
0.43∗∗∗
$20.890
$15.21
0.93∗∗∗
Three-year
964
1.334
0.77
0.97∗∗∗
-0.028∗∗∗
0.30
0.33∗∗∗
$7.829
$4.95
0.95∗∗∗
Five-year
1,684
1.535
0.97
0.95∗∗∗
-0.064∗∗∗
0.58
0.48∗∗∗
$17.595
$12.99
0.95∗∗∗
Ten-year
1,561
2.975
1.70
0.96∗∗∗
-0.083∗∗∗
0.91
0.39∗∗∗
$15.243
$12.44
0.94∗∗∗
Thirty-year
1,514
8.322
6.97
0.96∗∗∗
-0.237∗∗∗
3.06
0.46∗∗∗
$1.878
$1.82
0.93∗∗∗
PanelB:BrokerTec,01/2001-12/2004
Two-year
972
1.299
0.52
0.96∗∗∗
-0.052∗∗∗
0.37
0.43∗∗∗
$11.790
$5.80
0.94∗∗∗
Three-year
407
1.947
0.88
0.97∗∗∗
-0.058∗∗
0.47
0.33∗∗∗
$3.960
$1.97
0.94∗∗∗
Five-year
976
2.009
1.04
0.94∗∗∗
-0.112∗∗∗
0.76
0.48∗∗∗
$9.025
$5.36
0.95∗∗∗
Ten-year
854
4.036
1.67
0.95∗∗∗
-0.153∗∗∗
1.22
0.39∗∗∗
$5.951
$4.47
0.94∗∗∗
Thirty-year
803
13.086
6.56
0.96∗∗∗
-0.442∗∗∗
4.18
0.46∗∗∗
$0.525
$0.47
0.92∗∗∗
51

Table1.(Continued)
∆
Segment
(1)
(1)
(1)
PanelC:BrokerTec,01/2005-12/2007
Two-year
708
0.816
0.03
0.99∗∗∗
0.001∗∗
0.01
0.35∗∗∗
$33.383
$15.27
0.92∗∗∗
Three-year
557
0.886
0.04
0.99∗∗∗
-0.006∗∗∗
0.04
0.46∗∗∗
$10.656
$4.55
0.95∗∗∗
Five-year
708
0.881
0.05
0.99∗∗∗
0.001
0.03
0.58∗∗∗
$29.409
$10.99
0.94∗∗∗
Ten-year
707
1.693
0.07
0.99∗∗∗
0.002
0.05
0.53∗∗∗
$26.466
$9.34
0.94∗∗∗
Thirty-year
711
2.942
0.41
0.99∗∗∗
-0.005
0.30
0.54∗∗∗
$3.405
$1.55
0.93∗∗∗
PanelD:BrokerTec,01/2008-12/2009
Two-year
469
0.848
0.09
0.99∗∗∗
-0.003
0.09
0.32∗∗∗
$31.350
$16.47
0.93∗∗∗
Three-year
n.a.
n.a.
n.a.
n.a.
n.a.
n.a.
n.a.
n.a.
n.a.
n.a.
Five-year
469
1.019
0.21
0.98∗∗∗
-0.006
0.19
0.51∗∗∗
$27.596
$12.61
0.95∗∗∗
Ten-year
469
1.959
0.46
0.98∗∗∗
-0.005
0.42
0.50∗∗∗
$22.980
$9.03
0.95∗∗∗
Thirty-year
463
6.137
3.92
0.98∗∗∗
-0.026∗∗∗
2.44
0.79∗∗∗
$3.531
$1.53
0.92∗∗∗
52

Table2.POMOs:Descriptivestatistics
Thistablereportssummarystatisticsforallpermanentopenmarketoperations(POMOs)conductedbytheFederalReserveBankofNewYork
(FRBNY)inthesecondaryU.S.Treasurymarketoveri)thebasicsampleperiod(January1,2001toDecember31,2007,inPanelA);ii)theearlier
subsample(January1,2001toDecember31,2004,inPanelB);iii)thelatersubsample(January1,2005toDecember31,2007,inPanelC);and
iv)thecrisissample(January1,2008toDecember31,2009,inPanelD).AllPOMOsexecutedoverthissampleperiodwerepurchasesofTreasury
securities(
0).POMOsaresortedbythesegment()oftheyieldcurvetargetedbytheFRBNY,eachcenteredaroundthematurities
ofthefollowingon-the-runsecuritiesavailableintheBrokerTecdatabase:Two-year,three-year,five-year,andten-yearU.S.Treasurynotes,and
thirty-yearU.S.Treasurybonds.Specifically,welabelaFRBNYtransactionasi)atwo-yearPOMOiftheremainingmaturityofthetraded
securityisbetweenzeroandfouryears;ii)athree-yearPOMOiftheremainingmaturityofthetradedsecurityisbetweenoneandfiveyears;iii)a
five-yearPOMOiftheremainingmaturityofthetradedsecurityisbetweenthreeandsevenyears;iv)aten-yearPOMOiftheremainingmaturity
ofthetradedsecurityisbetweeneightandtwelveyears;andv)athirty-yearPOMOiftheremainingmaturityofthetradedsecurityisgreaterthan
twelveyears.isthenumberofdayswhenPOMOsoccurredoverthesampleperiod.
istheaveragenumberofintradayPOMOsexecuted(i.e.,
ofsecuritiestradedonPOMOdays)bytheFRBNY.isthemeantotaldailyprincipaltraded,inbillionsofU.S.dollars;isthecorresponding
standarddeviation.
53

Table2.(Continued)
PanelA:01/2001-12/2007
PanelB:01/2001-12/2004
PanelC:01/2005-12/2007
PanelD:01/2008-12/2009
Segment
Total217
25
$1.108
$0.44
153
26
$1.073
$0.48
64
23
$1.194
$0.29
75
73
$2.020
$6.52
Two-year
162
23
$1.152
$0.51
117
24
$1.136
$0.55
45
21
$1.194
$0.40
35
69
-$0.981
$7.98
Three-year
120
20
$0.852
$0.39
80
19
$0.734
$0.34
40
22
$1.088
$0.38
40
63
$2.687
$4.86
Five-year
78
16
$0.565
$0.40
50
15
$0.430
$0.30
28
19
$0.805
$0.45
39
53
$3.071
$4.04
Ten-year
36
10
$0.343
$0.25
24
10
$0.306
$0.21
12
11
$0.416
$0.32
21
32
$1.086
$1.33
Thirty-year
32
15
$0.390
$0.24
23
16
$0.375
$0.17
913
$0.428
$0.38
16
49
$1.856
$1.03
54

Table3.POMOsandMarketLiquidity
Thistablereportsmeansofdailybid-askpricespreadchanges∆ ≡− (labeled
∆ ,inbps)foron-the-runTreasurynotesandbonds
()overdayswhenpermanentopenmarketoperations(POMOs)occurredinthesamematuritybracket(
=1),andoverdayswhenany
POMOoccurred(
=1).istheaveragebid-askpricespreadonday; istheaveragebid-askpricespreadoverthemostrecentprevious
22tradingdayswhennoPOMOoccurred.Wealsoreportordinaryleastsquares(OLS)estimatesofthefollowingregressionmodels:
∆ =+
+∆∆
+∆∆ + ,
(8)
where∆ iscomputedoverPOMOdays,
isatime-trendvariable,∆
≡
−
,∆ ≡− ,
andarethe
dailymodifieddurationandconvexity,and
and aretheiraveragesoverthemostrecentprevious22tradingdayswhennoPOMOoccurred,
respectively;and
∆ =0++∆∆
+∆∆ + + ,
(9)
where∆ iscomputedoveralldaysandisavectorofday-of-the-week,monthly,andyeardummies,forbothsame-maturity
(=
)andany-maturityPOMOs(=
).MeansandregressioncoefficientsareestimatedoverthebasicBrokerTecsampleperiod
(January1,2001toDecember31,2007).Dataforthree-yearnotesisavailableonlybetweenMay7,2003andMarch30,2007.isthenumberof
observations.2 istheadjusted
2.A∗ ,∗∗,or∗∗∗indicatesstatisticalsignificanceatthe10%,5%,or1%levels,respectively,usingNewey-West
standarderrorsfor.
55

Table3.(Continued)
Same-maturityPOMOs
Any-maturityPOMOs
Segment
∆
2
∆
2
Two-year
-0.125∗∗∗
-0.306∗∗∗
157
-0.085∗∗∗
8%
1,682
-0.130∗∗∗
-0.314∗∗∗
211
-0.089∗∗∗
9%
1,682
Three-year
-0.046∗
-0.115∗∗
58
0.013
11%
964
-0.087∗∗∗
-0.257∗∗∗
102
-0.023
11%
964
Five-year
-0.215∗∗
-0.594∗∗∗
75
-0.141∗
8%
1,686
-0.248∗∗∗
-0.579∗∗∗
210
-0.149∗∗∗
12%
1,686
Ten-year
-0.074
-0.002
33
0.028
9%
1,563
-0.366∗∗∗
-0.776∗∗∗
196
-0.257∗∗∗
10%
1,563
Thirty-year
-0.591
-1.316
28
-0.294
6%
1,516
-0.778∗∗∗
-1.337∗∗∗
200
-0.539∗∗
7%
1,516
56

Table4.POMOsandInformationHeterogeneity
Thistablereportsordinaryleastsquares(OLS)slopecoefficients ofthefollowingregressionofaveragedailybid-askspreadandpricechanges
∆ (inbps,definedinSection4.1)foron-the-runTreasurynotesandbonds()oversame-maturityorany-maturitypermanentopenmarket
operation(POMO)days(
=1or
=1)onthecontemporaneousrealizationsofeither
=(thesimplescaledaverageofthe
standardizeddispersionofanalystforecastsofsixmacroeconomicvariablesfromtheSurveyofProfessionalForecasters(SPF),seeSectionIV.C.1;in
PanelA)or
=(thescaledstandardizeddispersionofanalystforecastsofNonfarm
PayrollfromBloomberg,seeSectionIV.C.1;in
PanelB)multipliedbythedifferencebetween70
(thetop70thpercentileofitsempiricaldistribution)and30
(thebottom30thpercentileof
itsempiricaldistribution):
∆ =+
+ .
(10)
Welabelthesedifferencesas∆∆
≡
³ 70
−30
´ .Wealsoestimate,againbyOLS,boththeeffectofeither
=or
=on∆ ineventtime(slope ):
∆ =+
+∆∆
+∆∆ +
+ ,
(11)
aswellastheinteractionofeither =
or =
witheither
=or
=overthefullsample(interaction ):
∆ =0++∆∆
+∆∆ +
+ +
+ .
(12)
Wereporttheseslopeandinteractioncoefficientsas∆ ≡
³ 70
−30
´ and∆ ≡
³ 70
−30
´ ,againinbps.
MeansandregressioncoefficientsareestimatedoverthebasicBrokerTecsampleperiod(January1,2001toDecember31,2007).Dataforthree-year
notesisavailableonlybetweenMay7,2003andMarch30,2007.isthenumberofobservations.2 istheadjusted
2.A∗ ,∗∗,or∗∗∗indicates
statisticalsignificanceatthe10%,5%,or1%levels,respectively,usingNewey-Weststandarderrorsfor .
57
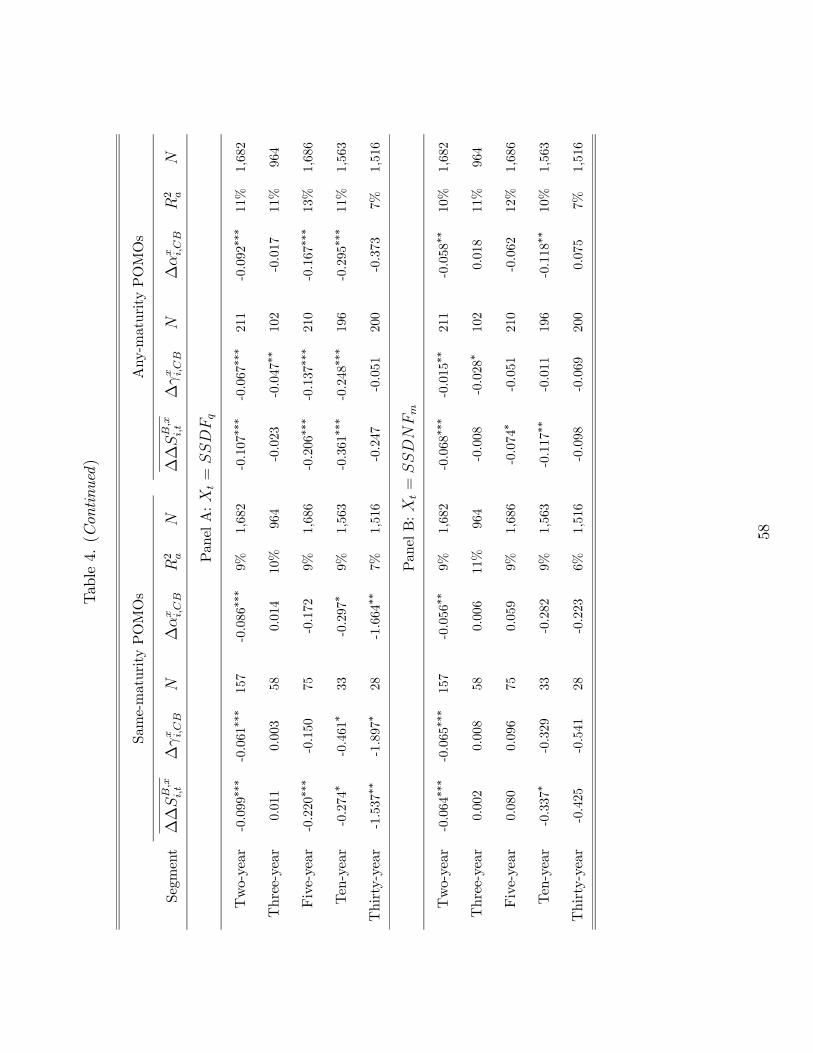
Table4.(Continued)
Same-maturityPOMOs
Any-maturityPOMOs
Segment
∆∆
∆
∆
2
∆∆
∆
∆
2
PanelA:
=
Two-year
-0.099∗∗∗
-0.061∗∗∗
157
-0.086∗∗∗
9%
1,682
-0.107∗∗∗
-0.067∗∗∗
211
-0.092∗∗∗
11%
1,682
Three-year
0.011
0.003
58
0.014
10%
964
-0.023
-0.047∗∗
102
-0.017
11%
964
Five-year
-0.220∗∗∗
-0.150
75
-0.172
9%
1,686
-0.206∗∗∗
-0.137∗∗∗
210
-0.167∗∗∗
13%
1,686
Ten-year
-0.274∗
-0.461∗
33
-0.297∗
9%
1,563
-0.361∗∗∗
-0.248∗∗∗
196
-0.295∗∗∗
11%
1,563
Thirty-year
-1.537∗∗
-1.897∗
28
-1.664∗∗
7%
1,516
-0.247
-0.051
200
-0.373
7%
1,516
PanelB:
=
Two-year
-0.064∗∗∗
-0.065∗∗∗
157
-0.056∗∗
9%
1,682
-0.068∗∗∗
-0.015∗∗
211
-0.058∗∗
10%
1,682
Three-year
0.002
0.008
58
0.006
11%
964
-0.008
-0.028∗
102
0.018
11%
964
Five-year
0.080
0.096
75
0.059
9%
1,686
-0.074∗
-0.051
210
-0.062
12%
1,686
Ten-year
-0.337∗
-0.329
33
-0.282
9%
1,563
-0.117∗∗
-0.011
196
-0.118∗∗
10%
1,563
Thirty-year
-0.425
-0.541
28
-0.223
6%
1,516
-0.098
-0.069
200
0.075
7%
1,516
58

Table5.POMOsandFundamentalUncertainty
Thistablereportsordinaryleastsquares(OLS)estimatesoftheslopecoefficient fromequation(10)andtheinteractioncoefficients
and fromequations(11)and(12),foron-the-runTreasurynotesandbondsandsame-maturityorany-maturitypermanentopenmarket
operations(POMOs,asinTable4)overthebasicBrokerTecsampleperiod(January1,2001toDecember31,2007)wheneither
=(themonthlyaverageofdailyEurodollarimpliedvolatilityfromBloomberg,seeSectionIV.C.2;inPanelA)or
=(themonthlyaverageofdailyimpliedvolatilityonTreasuryoptionsfromMerrillLynch,seeSectionIV.C.2;inPanelB),
multipliedbythedifferencebetween70
(thetop70thpercentileofitsempiricaldistribution)and30
(thebottom30thpercentileofits
empiricaldistribution).Welabelthesedifferences(inbps)as∆∆
≡
³ 70
−30
´ ,∆ ≡
³ 70
−30
´ and
∆ ≡
³ 70
−30
´ .isthenumberofobservations.2 istheadjusted
2.A∗ ,∗∗,or∗∗∗indicatesstatisticalsignificanceat
the10%,5%,or1%levels,respectively,usingNewey-Weststandarderrorsfor .
59

Table5.(Continued)
Same-maturityPOMOs
Any-maturityPOMOs
Segment
∆∆
∆
∆
2
∆∆
∆
∆
2
PanelA:
=
Two-year
-0.015
-0.091∗∗∗
157
-0.027
9%
1,682
-0.026
-0.076∗∗∗
211
-0.034
10%
1,682
Three-year
-0.051∗
-0.008
58
-0.025
10%
964
-0.130∗∗∗
0.024
102
-0.086∗∗
11%
964
Five-year
-0.039
-0.154
75
-0.060
9%
1,686
-0.023
-0.182∗∗∗
210
-0.049
13%
1,686
Ten-year
-0.398
-0.513
33
-0.323∗∗∗
9%
1,563
-0.123
0.192
196
-0.154∗∗
11%
1,563
Thirty-year
-0.898
-1.171
28
-0.479
7%
1,516
-0.452
-0.246
200
-0.340
8%
1,516
PanelB:
=
Two-year
-0.102∗∗∗
-0.107∗∗∗
157
-0.093∗∗∗
9%
1,682
-0.117∗∗∗
-0.123∗∗∗
211
-0.102∗∗∗
10%
1,682
Three-year
-0.076∗∗
-0.069∗
58
-0.049
11%
964
-0.159∗∗∗
-0.150∗∗∗
102
-0.126∗∗∗
12%
964
Five-year
-0.198∗
-0.206∗
75
-0.176∗∗
9%
1,686
-0.185∗∗∗
-0.176∗∗
210
-0.147∗∗∗
12%
1,686
Ten-year
-0.355
-0.301
33
-0.372∗∗∗
9%
1,563
-0.309∗∗∗
-0.271∗∗∗
196
-0.295∗∗∗
11%
1,563
Thirty-year
-1.500
-1.959
28
-1.407∗∗
6%
1,516
-0.584
-0.652∗
200
-0.578∗∗
7%
1,516
60

Table6.POMOsandPOMOPolicyUncertainty
Thistablereportsordinaryleastsquares(OLS)estimatesoftheslopecoefficient fromequation(10)andtheinteractioncoefficients
and fromequations(11)and(12),foron-the-runTreasurynotesandbondsandsame-maturityorany-maturitypermanentopenmarket
operations(POMOs,asinTable4)overthebasicBrokerTecsampleperiod(January1,2001toDecember31,2007)when
=(the
monthlyaverageofdailyvolatilityofthefederalfundsrate,fromtheFederalReserveBankofNewYork(FRBNY),seeSectionIV.C.3),multiplied
bythedifferencebetween70
(thetop70thpercentileofitsempiricaldistribution)and30
(thebottom30thpercentileofitsempirical
distribution).Welabelthesedifferences(inbps)as∆∆
≡
³ 70
−30
´ ,∆ ≡
³ 70
−30
´ and
∆ ≡
³ 70
−30
´ .isthenumberofobservations.2 istheadjusted
2.A∗ ,∗∗,or∗∗∗indicatesstatisticalsignificanceat
the10%,5%,or1%levels,respectively,usingNewey-Weststandarderrorsfor .
61

Table6.(Continued)
Same-maturityPOMOs
Any-maturityPOMOs
Segment
∆∆
∆
∆
2
∆∆
∆
∆
2
=
Two-year
-0.061∗∗∗
-0.062∗∗∗
157
-0.046∗
9%
1,682
-0.076∗∗∗
-0.076∗∗∗
211
-0.056∗∗
10%
1,682
Three-year
0.048∗∗
0.041
58
0.012
11%
964
0.082∗∗∗
0.073∗∗∗
102
0.044∗∗∗
12%
964
Five-year
-0.183∗
-0.174∗
75
-0.157
9%
1,686
-0.094∗∗
-0.083∗∗∗
210
-0.055
12%
1,686
Ten-year
0.157
0.071
33
0.039
9%
1,563
-0.105∗∗
-0.106∗∗∗
196
-0.111∗∗∗
10%
1,563
Thirty-year
-1.657∗
-1.627
28
-1.740∗∗∗
7%
1,516
0.012
0.004
200
-0.124
7%
1,516
62

Figure 1. Market Liquidity and Central Bank Intervention
This figure plots the difference between equilibrium price impact in the presence and in the absence of the
central bank of equation (4), ∆ ≡ − = − √
[2+(−1)] , as a function of either (the central
bank’s commitment to achieve its policy, in Figure 1a), 2 (the uncertainty surrounding that policy, in Figure
1b), (the degree of correlation of the speculators’ private signals, in Figure 1c), or 2 (the fundamental
uncertainty, in Figure 1d), when 2 = 2 = 2 = 1, = 05, = 05, = 05, and = 500.
63

Figure 1. (Continued)
a) ∆ versus b) ∆ versus 2
-0.05
-0.04
-0.03
-0.02
-0.01
0
0.2 0.25 0.3 0.35 0.4 0.45 0.5 0.55 0.6
Gamma
Delta_Lam
bda
-0.05
-0.04
-0.03
-0.02
-0.01
0
1 1.25 1.5 1.75 2 2.25 2.5 2.75 3
Sigma2_T
Delta_Lam
bda
c) ∆ versus d) ∆ versus 2
-0.05
-0.04
-0.03
-0.02
-0.01
0
0 0.1 0.2 0.3 0.4 0.5 0.6 0.7 0.8 0.9 1
Rho
Delta_Lam
bda
-0.05
-0.04
-0.03
-0.02
-0.01
0
1 1.25 1.5 1.75 2 2.25 2.5 2.75 3
Sigma2_v
Delta_Lam
bda
64

Figure2.U.S.TreasuryNotesandBonds:Bid-AskSpreads
Thisfigureplotsdailybid-askpricespreadsforon-the-runtwo-year,three-year,five-year,andten-yearU.S.Treasurynotes,andthirty-year
U.S.Treasurybonds()ontheBrokerTecplatform
betweenJanuary1,2001andDecember31,2009.Dataforthree-yearnotesisavailableonly
betweenMay7,2003andMarch30,2007.Treasurynoteandbondpricesarequotedinpoints,i.e.,arereportedasfractionofparmultipliedby100.
istheaveragedailyquotedbid-askpricespreadinbasispoints(bps),i.e.,furthermultipliedby100.
65

Figure2.(Continued)
a)Two-yearU.S.Treasurynotes
b)Three-yearU.S.Treasurynotes
c)Five-yearU.S.Treasurynotes
012345 Jan-
01S
ep-0
1M
ay-0
2Ja
n-0
3O
ct-0
3Ju
n-04
Feb
-05
Oct
-05
Jul-0
6M
ar-0
7N
ov-0
7Ju
l-08
Apr
-09
Dec
-09
Dat
e
S(t) (in bps)
01234567 Jan-
01S
ep-0
1M
ay-0
2Ja
n-0
3O
ct-0
3Ju
n-04
Feb
-05
Oct
-05
Jul-0
6M
ar-0
7N
ov-0
7Ju
l-08
Apr
-09
Dec
-09
Dat
e
S(t) (in bps)
024681012 Jan
-01
Se
p-01
May
-02
Jan-
03O
ct-0
3Ju
n-0
4F
eb-0
5O
ct-0
5Ju
l-06
Mar
-07
Nov
-07
Jul-0
8A
pr-0
9D
ec-0
9
Dat
e
S(t) (in bps)
d)Ten-yearU.S.Treasurynotes
e)Thirty-yearU.S.Treasurybonds
0246810121416 Jan
-01
Se
p-01
May
-02
Jan-
03O
ct-0
3Ju
n-0
4F
eb-0
5O
ct-0
5Ju
l-06
Mar
-07
Nov
-07
Jul-0
8A
pr-0
9D
ec-0
9
Dat
e
S(t) (in bps)
01020304050 Jan
-01
Se
p-01
May
-02
Jan-
03O
ct-0
3Ju
n-0
4F
eb-0
5O
ct-0
5Ju
l-06
Mar
-07
Nov
-07
Jul-0
8A
pr-0
9D
ec-0
9
Dat
e
S(t) (in bps)
66

Figure 3. POMOs and Federal Funds Rates
This figure plots the daily total principal amounts of U.S. Treasury securities purchased ( 0) or
sold ( 0) by the Federal Reserve Bank of New York (FRBNY) as permanent open market
operations (POMOs, left axis, in billions of dollars), as well as both the federal funds effective daily rate from
overnight trading in the federal funds market (dotted line, right axis, in percentage terms, i.e., multiplied by
100) and its corresponding target set by the Federal Open Market Committee (FOMC, solid line, right axis),
between January 1, 2001 and December 31, 2009.
67

Figure 3. (Continued)
-10
-8
-6
-4
-2
0
2
4
6
8
10
Jan-01 Sep-01 Jun-02 Mar-03 Dec-03 Sep-04 Jun-05 Mar-06 Dec-06 Sep-07 Jun-08 Mar-09 Dec-09
Date
$ bi
llio
n
0
1
2
3
4
5
6
7
%
POMOs
Fed Funds target
Fed Funds rate
68

Figure4.MarketwideInformationVariables
Thisfigureplots(Figure4a),thescaledsimpleaverageofstandardizedstandarddeviationofprofessionalforecastsofsixU.S.
macroeconomicvariables(Unemployment,Nonfarm
Payroll,NominalGDP,CPI,IndustrialProduction,HousingStarts)fromSPF(SectionIV.C.1);
(Figure4b),thescaledstandardizedstandarddeviationofprofessionalforecastsofNonfarm
PayrollfromBloomberg(SectionIV.C.1);
(Figure4c),themonthlyaverageofdailyEurodollarimpliedvolatility(inpercentage)fromBloomberg(SectionIV.C.2);
(Figure4d),themonthlyaverageofdailyimpliedvolatilityonone-monthTreasuryoptionsfromMerrillLynch(SectionIV.C.2);
(Figure4e),themonthlyaverageofdailyvolatilityofthefederalfundsrate(inpercentage)fromFRBNY(SectionIV.C.3),betweenJanuary2001
andDecember2009.
69

Figure4.(Continued)
a)
b)
c)
4
4.55
5.56
6.57 Ja
n-01
Sep
-01
May
-02
Feb
-03
Oct
-03
Jun
-04
Feb
-05
Oct
-05
Jul-0
6M
ar-0
7N
ov-0
7Ju
l-08
Apr
-09
De
c-09
Dat
e
SSDF
345678 Jan-
01S
ep-0
1M
ay-
02F
eb-
03O
ct-0
3Ju
n-0
4F
eb-0
5O
ct-0
5Ju
l-06
Mar
-07
Nov
-07
Jul-0
8A
pr-
09D
ec-
09
Dat
e
SSDNF
0
0.1
0.2
0.3
0.4
0.5
0.6
0.7 Ja
n-01
Sep
-01
May
-02
Feb
-03
Oct
-03
Jun
-04
Feb
-05
Oct
-05
Jul-0
6M
ar-0
7N
ov-0
7Ju
l-08
Apr
-09
De
c-09
Dat
e
FEDVOL
d)
e)
507090110
130
150
170
190
210
230 Ja
n-01
Se
p-01
May
-02
Feb
-03
Oct
-03
Jun-
04F
eb-0
5O
ct-0
5Ju
l-06
Mar
-07
Nov
-07
Jul-0
8A
pr-0
9D
ec-
09
Dat
e
TOVOL
0
0.1
0.2
0.3
0.4
0.5
0.6
0.7 Ja
n-01
Sep
-01
May
-02
Feb
-03
Oct
-03
Jun
-04
Feb
-05
Oct
-05
Jul-0
6M
ar-0
7N
ov-0
7Ju
l-08
Apr
-09
De
c-09
Dat
e
FEDVOL
70
References
Acharya, V., and M. Richardson, eds. “Restoring Financial Stability: How to Repair a Failed
System – An Independent View from New York University Stern School of Business.” John
Wiley & Sons (2009).
Afonso, G.; A. Kovner; and A. Schoar. “Stressed, not Frozen: The Federal Funds Market in the
Financial Crisis.” Journal of Finance, 66 (2011), 1109—1139.
Akhtar, M. “Understanding Open Market Operations.” Federal Reserve Bank of New York,
Public Information Department (1997).
Andersen, T., and T. Bollerslev. “Deutsche Mark-Dollar Volatility: Intraday Activity Patterns,
Macroeconomic Announcements, and Longer Run Dependencies.” Journal of Finance, 53
(1998), 219—265.
Andersen, T.; T. Bollerslev; F. Diebold; and C. Vega. “Micro Effects of Macro Announcements:
Real-Time Price Discovery in Foreign Exchange.” American Economic Review, 93 (2003),
38—62.
Andersen, T.; T. Bollerslev; F. Diebold; and C. Vega. “Real-Time Price Discovery in Stock,
Bond, and Foreign Exchange Markets.” Journal of International Economics, 73 (2007),
251—277.
Bernanke, B., and K. Kuttner. “What Explains the Stock Market’s Reaction to Federal
Reserve Policy?” Journal of Finance, 60 (2005), 1221—1257.
Bhattacharya, U., and P. Weller. “The Advantage of Hiding One’s Hand: Speculation and
Central Bank Intervention in the Foreign Exchange Market.” Journal of Monetary Economics,
39 (1997), 251—277.
71
Bossaerts, P.,and P. Hillion. “Market Microstructure Effects of Government Intervention in the
Foreign Exchange Market.” Review of Financial Studies, 4 (1991), 513—541.
Brandt, M., and K. Kavajecz. “Price Discovery in the U.S. Treasury Market: The Impact of
Order Flow and Liquidity on the Yield Curve.” Journal of Finance, 59 (2004), 2623—2654.
Brenner, M.; P. Pasquariello; and M. Subrahmanyam. “On the Volatility and Comovement of
U.S. Financial Markets Around Macroeconomic News Announcements.” Journal of Financial
and Quantitative Analysis, 44 (2009), 1265—1289.
Caballé, J., and M. Krishnan. “Imperfect Competition in a Multi-Security Market with Risk
Neutrality.” Econometrica, 62 (1994), 695—704.
Chari, A. “Heterogeneous Market-Making in Foreign Exchange Markets: Evidence from
Individual Bank Responses to Central Bank Interventions.” Journal of Money, Credit, and
Banking, 39 (2007), 1131—1161.
Chordia, T.; J. Hu; A. Subrahmanyam; and Q. Tong. “Order Flow Volatility and Equity Costs
of Capital.” Management Science, forthcoming (2017).
Chordia, T., and A. Subrahmanyam. “Order Imbalance and Individual Stock Returns: Theory
and Evidence, Journal of Financial Economics.” 72 (2004), 485—518.
Chordia, T.; A. Sarkar; and A. Subrahmanyam. “An Empirical Analysis of Stock and Bond
Market Liquidity.” Review of Financial Studies, 18 (2005), 85—129.
Christensen, J. , and G. Rudebusch. “The Response of Interest Rates to U.S. and U.K.
Quantitative Easing.” Economic Journal, 122 (2012), 385—414.
Cieslak, A.; A. Morse; and A. Vissing-Jorgensen. “Stock Returns over the FOMC Cycle.”
Working Paper, UC Berkeley (2016).
72

Cohen, B. “Monetary Policy Procedures and Volatility Transmission along the Yield Curve.”
Working Paper, Bank for International Settlements (1999).
Croushore, D. “Introducing: The Survey of Professional Forecasters.” Business Review, Federal
Reserve Bank of Philadelphia (1993), 3—15.
D’Amico, S.; W. English; D. Lopez-Salido; and E. Nelson. “The Federal Reserve’s Large-Scale
Asset Purchase Programs: Rationale and Effects.” Economic Journal, 122 (2012), 415—446.
D’Amico, S., and T. King. “Flow and Stock Effects of Large-Scale Treasury Purchases:
Evidence on the Importance of Local Supply.” Journal of Financial Economics, 108 (2013),
425—448.
Diether, K.; C. Malloy; and A. Scherbina. “Differences of Opinion and the Cross Section of
Stock Returns.” Journal of Finance, 57 (2002), 2113—2141.
Dominguez, K. “The Market Microstructure of Central Bank Intervention.” Journal of
International Economics, 59 (2003), 25—45.
Dominguez, K. “When Do Central Bank Interventions Influence Intra-Daily and Longer-Term
Exchange Rate Movements?” Journal of International Money and Finance, 25 (2006),
1051—1071.
Edwards, C. “Open Market Operations in the 1990s.” Federal Reserve Bulletin, 83 (1997),
859—874.
Eser, F., and B. Schwaab. “Evaluating the Impact of Unconventional Monetary Policy
Measures: Empirical Evidence from the ECB’s Securities Markets Programme.” Journal of
Financial Economics, 119 (2016), 147—167.
Evans, M., and R. Lyons. “Order Flow and Exchange Rate Dynamics.” Journal of Political
Economy, 110 (2002), 170—180.
73

Evans, M., and R. Lyons. “Are Different-Currency Assets Imperfect Substitutes?” In Exchange
Rate Economics: Where Do We Stand?, P. De Grauwe, ed. MIT Press (2005), 1—34.
Fabozzi, F., and M. Fleming. “U.S. Treasury and Agency Securities.” In The Handbook of
Fixed Income Securities, F. Fabozzi, ed. McGraw Hill (2004), 229—250.
Federal Reserve Bank of New York (FRBNY). Domestic Open Market Operations During 2004.
Federal Reserve System Publication (2005).
Federal Reserve Bank of New York (FRBNY). Domestic Open Market Operations During 2007.
Federal Reserve System Publication (2008).
Federal Reserve Board of Governors (FRBG). The Federal Reserve System: Purposes and
Functions. Federal Reserve System Publication (2005).
Fleming, M. “The Round-the-Clock Market of U.S. Treasury Securities.” Economic Policy
Review, Federal Reserve Bank of New York, 3 (1997), 9—32.
Fleming, M. “Measuring Treasury Market Liquidity.” Economic Policy Review, Federal Reserve
Bank of New York, 9 (2003), 83—108.
Fleming, M.; B. Mizrach; and G. Nguyen. “The Microstructure of a U.S. Treasury ECN: The
BrokerTec Platform.” Journal of Financial Markets, forthcoming (2017).
Foster, F., and S. Viswanathan. “Strategic Trading When Agents Forecast the Forecasts of
Others.” Journal of Finance, 51 (1996), 1437—1478.
Furfine, C. “The Microstructure of the Federal Funds Market.” Financial Markets, Institutions
& Instruments, 8 (1999), 24—44.
74

Gagnon, J.; M. Raskin; J. Remache; and B. Sack. “The Financial Market Effects of the Federal
Reserve’s Large-Scale Asset Purchases.” International Journal of Central Banking, 7 (2011),
3—43.
George, T.; G. Kaul; and M. Nimalendran. “Estimation of the Bid-Ask Spread and Its
Components: A New Approach.” Review of Financial Studies, 4 (1991), 623—656.
Gilbert, T.; C. Scotti; G. Strasser; and C. Vega. “Is the Intrinsic Value of a Macroeconomic
News Announcement Related to its Asset Price Impact?” Journal of Monetary Economics, 92
(2017), 78—95.
Goldreich, D.; B. Hanke; and P. Nath. “The Price of Future Liquidity: Time-Varying Liquidity
in the U.S. Treasury Market.” Review of Finance, 9 (2005), 1—32.
Green, C. “Economic News and the Impact of Trading on Bond Prices.” Journal of Finance, 59
(2004), 1201—1233.
Greene, W. Econometric Analysis. Prentice Hall (1997).
Greenwood, R., and D. Vayanos. “Price Pressure in the Government Bond Market.” American
Economic Review: Papers and Proceedings, 100 (2010), 585—590.
Hamilton, J., and C. Wu. “The Effectiveness of Alternative Monetary Policy Tools in a Zero
Lower Bound Environment.” Journal of Money, Credit, and Banking, 44 (2011), 3—46.
Harvey, C., and R. Huang. “The Impact of the Federal Reserve Bank’s Open Market
Operations.” Journal of Financial Markets, 5 (2002), 223—257.
Hasbrouck, J. “Measuring the Information Content of Stock Trades.” Journal of Finance, 46
(1991), 179—207.
Hasbrouck, J. Empirical Market Microstructure. Oxford University Press (2007).
75

Hu, X.; J. Pan; and J. Wang. “Noise as Information for Illiquidity.” Journal of Finance, 68
(2013), 2223—2772.
Inoue, H. “The Effects of Open Market Operations on the Price Discovery Process in the
Japanese Government Securities Market: An Empirical Study.” Working Paper, Bank of Japan
(1999).
Jenkins, M., and J. Traub. “A Three-Stage Variables-Shift Iteration for Polynomial Zeros and
Its Relation to Generalized Rayleigh Iteration.” Numerishe Mathematik, 14 (1970a), 252—263.
Jenkins, M., and J. Traub. “A Three-Stage Algorithm for Real Polynomials Using Quadratic
Iteration.” SIAM Journal of Numerical Analysis, 7 (1970b), 545—566.
Jones, C.; G. Kaul; and M. Lipson. “Transactions, Volume, and Volatility.” Review of
Financial Studies, 7 (1994), 631—651.
Kitsul, Y. “Large-Scale Asset Purchases and Liquidity of Treasury Securities.” Working Paper,
Federal Reserve Board of Governors (2013).
Krishnamurthy, A. “The Bond/Old-Bond Spread.” Journal of Financial Economics, 66 (2002),
463—506.
Krishnamurthy, A.; S. Nagel; and A. Vissing-Jorgensen. “ECB Policies Involving Government
Bond Purchases: Impact and Channel.” Review of Finance, 22 (2018), 1—44.
Krishnamurthy, A., and A. Vissing-Jorgensen. “The Effects of Quantitative Easing on Interest
rates.” Brookings Papers on Economic Activity (2011), 215—287.
Krishnamurthy, A., and A. Vissing-Jorgensen. “The Aggregate Demand for Treasury Debt.”
Journal of Political Economy, 120 (2012), 233—267.
Kyle, A. “Continuous Auctions and Insider Trading.” Econometrica, 53 (1985), 1315—1335.
76

Kumar, P., and D. Seppi. “Futures Manipulation with “Cash Settlement”.” Journal of Finance,
47 (1992), 1485—1502.
Li, H.; J. Wang; C. Wu; and Y. He. “Are Liquidity and Information Risks Priced in the
Treasury Bond Market?” Journal of Finance, 64 (2009), 467—503.
Lyons, R. The Microstructure Approach to Exchange Rates. MIT Press (2001).
Mizrach, B., and C. Neely. “The Transition to Electronic Communications Networks in the
Secondary Treasury Market.” Federal Reserve Bank of St. Louis Review, 88 (2006), 527—541.
Mizrach, B., and C. Neely. “The Microstructure of the U.S. Treasury Market.” In Encyclopedia
of Complexity and Systems Science, R. Meyers, ed. Springer-Verlag (2009), 9565—9577.
Naranjo, A., and M. Nimalendran. “Government Intervention and Adverse Selection Costs in
Foreign Exchange Markets.” Review of Financial Studies, 13 (2000), 453—477.
Neely, C. “Identifying the Effects of U.S. Intervention on the Levels of Exchange Rates.”
Reserve Bank of St. Louis Working Paper No. 2005-031C (2005).
Novshek, W. “Finding All n-Firm Cournot Equilibria.” International Economic Review, 25
(1984), 61—70.
O’Hara, M. Market Microstructure Theory. Blackwell Publishers (1995).
Pasquariello, P. “Imperfect Competition, Information Heterogeneity, and Financial Contagion.”
Review of Financial Studies, 20 (2007a), 391—426.
Pasquariello, P. “Informative Trading or Just Costly Noise? An Analysis of Central Bank
Interventions.” Journal of Financial Markets, 10 (2007b), 107—143.
Pasquariello, P. “Central Bank Intervention and the Intraday Process of Price Formation in the
Currency Markets.” Journal of International Money and Finance, 29 (2010), 1045—1061.
77

Pasquariello, P. “Government Intervention and Arbitrage.” Review of Financial Studies,
forthcoming (2017).
Pasquariello, P., and C. Vega. “Informed and Strategic Order Flow in the Bond Markets.”
Review of Financial Studies, 20 (2007), 1975—2019.
Pasquariello, P., and C. Vega. “The On-The-Run Liquidity Phenomenon.” Journal of Financial
Economics, 92 (2009), 1—24.
Pasquariello, P., and C. Vega. “Strategic Cross-Trading in the U.S. Stock Market.” Review of
Finance, 9 (2015), 229—282.
Payne, R., and P. Vitale. “A Transaction Level Study of the Effects of Central Bank
Intervention on Exchange Rates.” Journal of International Economics, 61 (2003), 331—352.
Sarno, L., and M. Taylor. “Official Intervention in the Foreign Exchange Market: Is it
Effective, and if So, How Does it Work?” Journal of Economic Literature, 39 (2001), 839—868.
Sokolov, V. “The Impact of Open Market Operations on the Government Bond Market:
Microstructure Evidence.” Working Paper, Higher School of Economics (2009).
Song, Z., and H. Zhu. “Quantitative Easing Auctions of Treasury Bonds.” Journal of Financial
Economics, 128 (2018), 103—124.
Stoll, H. “Inferring the Components of the Bid-Ask Spread: Theory and Empirical Tests.”
Journal of Finance, 44 (1989), 115—134.
Subrahmanyam, A. “Risk Aversion, Market Liquidity, and Price Efficiency.” Review of
Financial Studies, 4 (1991), 417—441.
Stein, J. “Cheap Talk and the Fed: A Theory of Imprecise Policy Announcements.” American
Economic Review, 79 (1989), 32—42.
78

Vayanos, D., and J. Vila. “A Preferred-Habitat Model of the Term Structure of Interest
Rates.” NBER Working Paper No. 15487 (2009).
Vitale, P. “Sterilised Foreign Exchange Intervention in the Foreign Exchange Market.” Journal
of International Economics, 49 (1999), 245—267.
Yu, J. “Disagreement and Return Predictability of Stock Portfolios.” Journal of Financial
Economics, 99 (2011), 162—183.
79