how local are it services markets: proximity and it outsourcing
TRANSCRIPT

How local are IT services markets: Proximity and IT outsourcing
Ashish Arora, Chris Forman1 Carnegie Mellon University
[email protected], [email protected]
March 2007
Abstract
We examine the question of which services are tradable within a concrete setting: the outsourcing of IT services across a broad cross-section of establishments in the US. If markets for IT services are local, then we should expect increases in local supply should increase the likelihood of outsourcing by lowering the cost of outsourcing. If markets are not local then local supply will not affect outsourcing demand. We analyze the outsourcing decisions of a large sample of 99,775 establishments in 2002 and 2004, for two types of IT services: programming and design and hosting. Programming and design projects require communication of detailed user requirements whereas hosting requires less coordination between client and service provider than programming and design. Our empirical results bear out this intuition: The probability of outsourcing programming and design is increasing in the local supply of outsourcing, and this sensitivity to local supply conditions has been increasing over time. This suggests there is some non-tradable or “local” component to programming and design services that cannot be easily removed. In contrast, the decision to outsource hosting is sensitive to local supply only for firms for which network uptime and security concerns are particularly acute.
1 Corresponding author. Authors are listed in alphabetical order. We thank the associate editor and two anonymous referees for very helpful comments. We also thank the track co-chairs (Eric Clemons, Rajiv Dewan, and Robert Kauffman) and three anonymous reviewers for the minitrack on Competitive Strategy, Economics, and IS for the 40th Annual Hawaii International Conference on System Sciences. We thank the Alfred P. Sloan Foundation for financial support, and Harte Hanks Market Intelligence for providing essential data. All errors are our own.
1
1. Introduction The outsourcing and offshoring of services in the US is an important and growing phenomenon
that has recently attracted widespread attention. At present, widely varying projections of the number of
jobs “at risk” have been presented, mostly by consulting firms [31]. Ultimately, these estimates turn on
the extent to which IT services are tradable.2
There have been two prevailing views on the tradability of IT services. One view emphasizes the
role of information technology in reducing the costs of performing services at a distance. Under this view,
IT reduces the costs of coordinating economic activity over long distances. Proponents of this view argue
that all services are potentially tradable. A second view argues that humans work best in physical
proximity to one another, and that some face-to-face interaction is required for the execution of many
types of services. Proponents of this view argue that offshoring is fraught with hidden costs arising from
inexperienced services personnel, differences in language and culture, and time differences between
vendor and client site [29]. Though a great deal of case study work has examined offshore project
decisions and governance in a variety of situations (e.g., [10]), this is ultimately a question not of what is
possible but rather what is predominant.
In this paper, we examine the extent to which markets for purchased IT services are local. If some
elements of IT services delivery must be supplied locally, then suppliers must be located near customers,
and so are not tradable. By contrast, if the markets for IT services are not local, then suppliers need not be
collocated, and so IT services are tradable. Our focus is on the tradability of purchased IT services: we do
not consider the tradability of services that are performed within the boundaries of the firm. That is, our
results do not inform which services can be offshored within a firm. However, at present the vast majority
of offshored services are also outsourced, and captive offshoring is usually restricted to large firms that
have IT as a central part of their value creation strategy [34].
We examine the IT outsourcing decisions of a large cross-section of establishments in the US
2 In this paper we follow the international trade literature and in particular Jensen and Kletzer (2005) in using the label ‘tradable services’ to refer to those that can be conducted at a distance.

2
during two years: 2002 and 2004. We investigate the extent to which the outsourcing decision depends
upon the local supply of outsourcing firms. Our major hypothesis is that if some components of IT
services need to be delivered locally, then increases in local supply should increase the likelihood of
outsourcing by lowering the cost of outsourcing. We extend this analysis by examining how this
relationship has changed over time, how it differs across IT tasks, and how it is moderated by the
characteristics of the establishment.
We examine the decisions of firms to outsource two types of IT services: programming and
design and hosting. Programming and design refers to the decision to outsource programming tasks or the
planning and designing of information systems. To be successful, these outsourcing projects typically
require communication of detailed user requirements. Hosting involves management and operation of
computer and data processing services for the client, as well as hosting of Internet services and web
servers. After an initial set-up period, the requirements of such hosting services will be relatively static
and will require less coordination between client and service provider than programming and design.
As a preview to our results, we show that:
1. The probability of outsourcing programming and design is increasing the local supply of
outsourcing.
2. The sensitivity to local supply conditions appears to have increased over time. This suggests
that there is some irreducible non-tradable or “local” component to programming and design
services that cannot easily be removed through advancement in software development
practices or through improvements in communications capabilities engendered by
advancements in IT.
3. Outsourcing of hosting services is less sensitive to variance in local supply than is the
decision to outsource programming and design, though the sensitivity of the hosting decision
has also increased over time. This increase in sensitivity appears to be concentrated among
those firms for which network uptime and security concerns are particularly acute.
2. Related Literature

3
This paper is related to three areas of prior research. First, we contribute to recent work that has
examined which types of service work are most effectively conducted offshore. Second, we advance work
in the IT outsourcing and nascent IT offshoring literatures. Third, we contribute to recent work that seeks
to understand the geographic dispersion in the location of high technology industries.
We view our research as building upon recent attempts to understand which services are tradable
across a broad cross-section of the economy. Jensen and Kletzer [22] examine which services are tradable
by examining geographic concentration in economic activity. Tradable industries will be geographically
concentrated to take advantage of economies of scale and favorable location factors. By contrast, non-
tradable industries must locate where demand is and thus must have a geographic distribution that is
similar to that of overall economic activity. Our approach is complementary: If a service is easily
tradable, demand decisions will not be sensitive to whether the service is locally available (or the extent
of its availability).
Ono [33] examines manufacturing firm decisions to outsource white-collar services. She
examines how the outsourcing decision varies with potential demand as proxied by total population and a
demand shifter. Like Ono [33], we examine how the decision to outsource services depends upon local
market conditions, however our analysis focuses on identifying which IT services are tradable and we
focus on a broader cross-section of industries. We also explicitly model local supply, and treat it as
endogenous in the sense of potentially depending upon aggregate local demand.
We also contribute to recent field research conducted in other industries that has examined the
operational risks of outsourcing services that require intensive coordination or transfer of tacit knowledge
between buyer and supplier (e.g., [3], [12], [19]). In contrast to this research that relies on small samples
or case studies, we provide systematic evidence on which IT services can most easily be offshored using a
broad cross-section of industries in the U.S. economy.
Prior research on the IS outsourcing decision has often focused on variation in establishment- or
firm-level factors. These could be economic explanations such as the desire of firms to obtain cost
advantages through economies of scale or scope (e.g., [2], [25]) or the role of transaction costs on the

4
sourcing decision [2]. Other work has focused on political factors [24] or on strategic responses to
institutional influences [1]. To our knowledge, no prior work has addressed our primary question: the
conditions under which purchased IT services need to be conducted locally. 3
We also contribute to recent research that has examined the spatial distribution of economic
activity in high-technology industries ([7], [23]). Much of this prior literature demonstrates that
technology-intensive industries concentrate for one of three reasons: thicker labor markets, the
availability of complementary resources, or knowledge spillovers [28]. In our research we provide one
explanation for the geographic dispersion in software production in the U.S.
3. Framework and Hypotheses for the Decision to Outsource
We examine whether the decision to outsource is increasing in the local supply of outsourcing
firms. Prior work in media richness theory (e.g., [15], [16]) suggests that transmission of information that
is equivocal, uncertain, or complex is better accomplished through the use of richer media such as face-to-
face communications. Software development tasks typically require frequent small adjustments among
co-workers, particularly in early stages of software development [32]. In other words, insofar as IT
outsourcing tasks require transmission of information that is complex or equivocal, or require frequent
adjustments among developers, the theory suggests that the costs of outsourcing will be lower when
providers of outsourcing services are nearby. It is well established in other nontradable services markets
that prices are declining in the number of entrants, so long as labor supply is sufficiently elastic [9]. Thus,
since the price of local IT services is decreasing in the number of local suppliers, we expect the likelihood
of outsourcing to be increasing in the supply of local IT services firms.
Hypothesis 1: Outsourcing is increasing in the supply of local firms, other things equal.
We also examine how the sensitivity to local supply depends upon the outsourcing task. Case
study research on globally distributed software research suggests that activities that are difficult to 3 We also advance recent work that has investigated the factors influencing the performance of IT outsourcing engagements (e.g., Gopal et al 2003; Gopal and Sivaramakrishnan 2006). In contrast to prior work which has focused on characteristics of the contract or the engagement, we examine how proximity to outsourcing firms influences the perceived value of outsourcing.

5
conduct at a distance include those that require customer interaction, customer proximity, and deep
domain knowledge, while those that are easier to conduct at a distance include activities like coding and
maintenance, or infrastructure maintenance [11].
In our study we examine the outsourcing of two sets of activities: programming and design and
hosting. The decision to outsource programming and design tasks, due to the requirement of transmitting
equivocal information (particularly at early stages of the software development lifecycle) and to the need
for frequent coordination between supplier and customer, will be more sensitive to changes in local
supply than will the decision to outsource hosting services.
Hypothesis 2: The decision to outsource programming and design will be more sensitive to variations in
local supply than will the decision to outsource hosting.
A long line of information systems research has suggested that IT reduces communication and
coordination costs within and between firms (e.g., [26], [13], [17], [18]). To examine how IT influences
the importance of proximity to suppliers, we examine how the relationship between the decision to
outsource and local supply changes over time. If technological improvements in IT are decreasing the
coordination costs of sourcing at a distance, then the sensitivity of the outsourcing decision to changes in
local supply will decline over time. However, it is also possible that sensitivity to local supply will
increase over time. For example, increases in concerns over information security may require increasing
proximity for hosting providers if security incidents require immediacy in communications between
clients and service providers. Though we state our hypothesis in terms of the sensitivity of local supply
increasing over time, we treat it as an empirical question as to which hypothesis is supported by the data.
Hypothesis 3: The sensitivity of outsourcing to local supply is increasing over time.
In our last set of hypotheses, we examine how the sensitivity to local supply varies based upon
the characteristics of the firm. In particular, we examine the effects of variation in firms’ IT infrastructure
environment on the relationship between local supply and the decision to outsource hosting. We have

6
conducted a similar set of analyses for programming and design, but we focus on the results for hosting
services for the sake of brevity. We examine five classes of application infrastructure within a firm:
enterprise applications, functional applications, network applications, security applications, and other
applications.
For hosting services, one major benefit of proximity is the immediacy of replies in face-to-face
communications. This will be particularly valuable for firms with heavy investments in network and
security applications. For firms with large investments in network infrastructure, reliability of the network
is particularly important and network downtime must be minimized. Network problems, when they occur,
must be handled quickly. Firms with large investments in security applications will be particularly
concerned with information security issues. When security issues arise, they must be handled quickly, and
web servers and firewalls may need to be accessed physically.4 That is, in both cases, immediacy of
communication between service provider and client is particularly important. This suggests that proximity
to suppliers will be relatively more important for firms with greater investments in security and network
infrastructure software.
Hypothesis 4a: The relationship between outsourcing hosting and local supply is stronger for firms with
greater investments in security software.
Hypothesis 4b: The relationship between outsourcing hosting and local supply is stronger for firms with
greater investments in network infrastructure software.
4. Framework and Econometric Model
We motivate our econometric model with a simple theoretical framework that examines an
establishment’s decision to staff IT projects with internal or external IT staff. Establishments face the
following maximization problem:
4 This is vividly illustrated in the HBS case study, The iPremier Company: Denial of Service Attack, HBS 9-601-114 [6], in which an online retailer under denial of service attack was unable to access the hosting facility remotely and an IT staffer had to physically visit the hosting site to address the issue.

7
1 2
1 2 1 1 2 2,max ( , , )π − −x x
x x z w x w x
where x1 and x2 represent the number of external or internal IT employees hired (respectively), w1 and w2
represent the wage or cost of hiring an additional external or internal worker, and z represents other
characteristics that condition profits (and hence, demand for outsourcing). The function ( )π ⋅ represents
the value of IT projects. To decide upon the optimal level of outsourcing and IT employment, we take
first order conditions:
1 21
1
1 22
2
( , , ) 0
( , , ) 0
d x x z wdx
d x x z wdx
π
π
− =
− =
leading to the following optimal levels of outsourcing and internal IT employment:
1 1 2
2 2 1
( , , ) (1a)( , , ) (1b)
==
x f w x zx f w x z
The focus of our analysis will be on the optimal level of outsourcing x1.
To econometrically estimate the outsourcing decision embedded in these first order conditions in
(1a), we must make a number of additional assumptions. First, we assume that the cost of hiring external
workers is a linear function of local supply, 1 ( )w g os η= + , where os represents local supply and η is the
error term. This assumption is motivated by the arguments presented prior to hypothesis 1: (1) The
provision of some IT services is most effective and less costly when it is performed in close proximity to
clients and (2) If markets for goods and services are local, then their price is declining in local supply [9].
While we recognize that wages may depend on factors other than local supply, these other factors will be
included in the error term η . Indeed, to the degree that markets are not local, local supply will not matter
for the outsourcing decision. Thus, this specification merely makes concrete our hypotheses.
We do not observe the true quantity of employees outsourced, but only a binary variable
indicating whether outsourcing had been used. Thus, the number of outsourcing employees hired will be a
latent variable *1x . Thus, the decision we observe for establishment i will be

8
*1 2( , , , )i i i i i ix f os x zη ν= + .
Assuming that *1ix is linear in parameters gives us
*1 2i i i i i ix os x zα β γ η ν= + + + + (2)
We assume that iη and iν are distributed normally and we estimate a linear probability model of the
decision to outsource. Our major interest is in testing whether 0α > , that is, whether the decision to
outsource is increasing in local supply.
Of course, as (2) is a cross-sectional regression, one may be concerned that ios may be correlated
with unobserved location-specific factors iη that increase the likelihood of outsourcing. For example,
outsourcing firms may prefer to locate in places with a more highly skilled workforce, which may also
lower the costs of outsourcing. In this case, estimates of α will be inconsistent. Further, 2x may be
correlated with unobservables that increase the value of outsourcing at an establishment. To address these
issues, we use instrumental variable (IV) techniques, as described later.
5. Data
The data we use come from the Harte Hanks Market Intelligence CI Technology database
(hereafter CI database). The CI database contains establishment-level data on (1) establishment
characteristics, such as number of employees, industry and location; (2) use of technology hardware and
software, such as computers, networking equipment, printers and other office equipment; and (3) use of
outsourcing. Harte Hanks collects this information to resell as a tool for the marketing divisions at
technology companies. We obtained data from the CI database for two years: 2002 and 2004. Interview
teams survey establishments throughout the calendar year; our sample contains the most current
information as of December 2002 and 2004 respectively.
We focus on the establishment rather than the firm as the unit of analysis because establishment-
level data will enable us to more precisely measure the impact of changes in local supply on the costs of
outsourcing. Most software investment decisions in our data are made at the establishment level. For

9
instance, 80% of the establishments in our sample that responded to the question stated that IT investment
decisions were made at the establishment rather than the firm level. Moreover, we control for multi-
establishment firms in our estimation. Our sample from the CI database contains all commercial
establishments with over 100 employees: there were 91,129 such establishments in 2002 and 89,776 in
2004. We dropped establishments which did not answer questions on outsourcing or had other crucial
data missing, which resulted in samples of 52,191 establishments in 2002 and 47,584 in 2004. In general,
excluded establishments were smaller and had fewer investments in IT. Thus, establishments with
relatively heavy investments in IT are over-represented in our sample. However, since these are more
likely to be able to reach out beyond local suppliers, our estimates are likely lower bounds on the true
effects.
5.1 Identifying Decisions to Outsource
Our dependent variable is x1i, the extent of outsourcing by establishment i. This variable x1i is
latent. We observe only discrete choices: whether or not the establishment chooses to outsource a
particular service or not, with the observed decision assuming a value of either one or zero, respectively.
Harte Hanks tracks 20 separate binary measures of outsourcing services that an establishment
may use. We aggregate these 20 different outsourcing services into two categories that have similar
production technologies. These two categories will comprise the dependent variables for our baseline
model. Later we report on robustness checks in which we explore alternative classifications.
The first variable measures an establishment’s decision to outsource programming or design
services. An establishment is considered to have outsourced programming and design if it answers yes to
outsourcing any of the following services: application design; contract programming; application
development; package software implementation; or Internet/web application development.
The second variable measures an establishment’s decision to outsource hosting services. An
establishment is considered to have outsourced hosting services if it answers yes to outsourcing any of the
following services: Internet/web server hosting; Internet routers; web site management; Internet firewalls;
LAN client/server; LAN network management; or LAN maintenance.
10
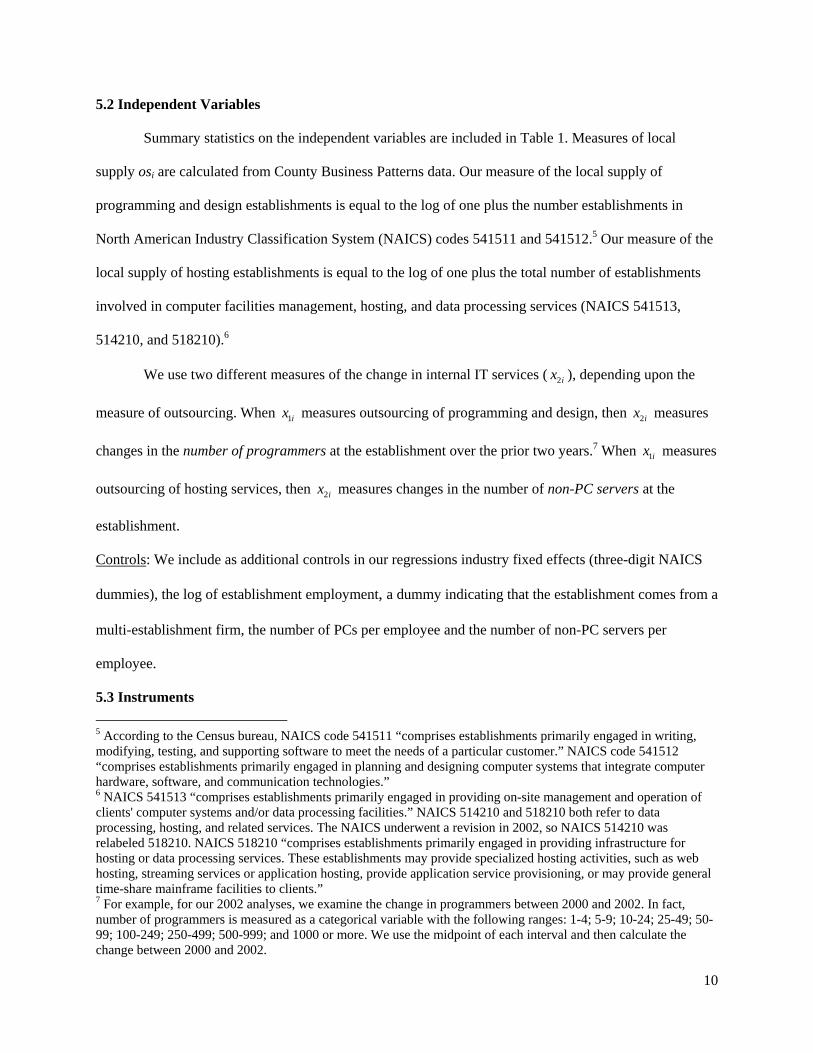
5.2 Independent Variables
Summary statistics on the independent variables are included in Table 1. Measures of local
supply osi are calculated from County Business Patterns data. Our measure of the local supply of
programming and design establishments is equal to the log of one plus the number establishments in
North American Industry Classification System (NAICS) codes 541511 and 541512.5 Our measure of the
local supply of hosting establishments is equal to the log of one plus the total number of establishments
involved in computer facilities management, hosting, and data processing services (NAICS 541513,
514210, and 518210).6
We use two different measures of the change in internal IT services ( 2ix ), depending upon the
measure of outsourcing. When 1ix measures outsourcing of programming and design, then 2ix measures
changes in the number of programmers at the establishment over the prior two years.7 When 1ix measures
outsourcing of hosting services, then 2ix measures changes in the number of non-PC servers at the
establishment.
Controls: We include as additional controls in our regressions industry fixed effects (three-digit NAICS
dummies), the log of establishment employment, a dummy indicating that the establishment comes from a
multi-establishment firm, the number of PCs per employee and the number of non-PC servers per
employee.
5.3 Instruments 5 According to the Census bureau, NAICS code 541511 “comprises establishments primarily engaged in writing, modifying, testing, and supporting software to meet the needs of a particular customer.” NAICS code 541512 “comprises establishments primarily engaged in planning and designing computer systems that integrate computer hardware, software, and communication technologies.” 6 NAICS 541513 “comprises establishments primarily engaged in providing on-site management and operation of clients' computer systems and/or data processing facilities.” NAICS 514210 and 518210 both refer to data processing, hosting, and related services. The NAICS underwent a revision in 2002, so NAICS 514210 was relabeled 518210. NAICS 518210 “comprises establishments primarily engaged in providing infrastructure for hosting or data processing services. These establishments may provide specialized hosting activities, such as web hosting, streaming services or application hosting, provide application service provisioning, or may provide general time-share mainframe facilities to clients.” 7 For example, for our 2002 analyses, we examine the change in programmers between 2000 and 2002. In fact, number of programmers is measured as a categorical variable with the following ranges: 1-4; 5-9; 10-24; 25-49; 50-99; 100-249; 250-499; 500-999; and 1000 or more. We use the midpoint of each interval and then calculate the change between 2000 and 2002.

11
We use six sets of instruments for ios . Changes in each of these variables will proxy for
geographic variation in the local demand for IT services. By capturing the determinants of local IT
services demand, they will influence entry of IT services providers and be correlated with the local supply
of programming and design, and hosting services. However, these variables capture characteristics of the
establishments in a geographic location that will influence the demand for outsourcing; since we control
for similar characteristics at the establishment level, it is unlikely that these variables will be correlated
with unobservables influencing establishment outsourcing demand.
We use the log of county employment from CBP to measure the aggregate potential market size in
the county. When calculating county employment—as in all of the independent variables in this section—
we exclude establishments in the three-digit NAICS industry 541 (Professional, Scientific, and Technical
Services).8
As is well known, industries differ substantially both in the extent of their IT use and in their
geographic distribution [18]. Locations with a higher percentage of IT-intensive firms may have greater
average demand for IT outsourcing services. We use three sets of measures to capture differences in the
IT intensity of firms across counties in our sample.
The IT-intensity index captures how differences in industry mix will affect the demand for
outsourcing. It is calculated by first identifying each industry’s use of IT services as a fraction of total
inputs using BEA Input-Output Benchmark Tables for 1997. To calculate IT intensity for county l, these
fractions are weighted by industry employment. Thus, for each county l and industry m,
(industry spending on IT services) (total county employment in industry )(industry total spending on inputs) (total county employment)l
m
m l mIT INTENSITYm l
− =∑
Next we control for the percentage of IT establishments – establishment in the county that are in
industries that are involved in the production of IT. We follow the classification developed by the
Department of Commerce as described by Cooke [14].
8 NAICS 541 includes 541511-541513 plus the “other category” 541519. We exclude the entire three-digit category because in our calculation of IT-intensity it was impossible for us to identify the relevant six-digit industry in the BEA input-output tables.

12
Last, we control for the percentage of establishments in different industry groupings:
Manufacturing (NAICS 321-339); Wholesale and Retail Trade (NAICS 421-454); Finance, Insurance,
and Real Estate (NAICS 521-525); Information Processing (NAICS 511-514 and 551); and Other
Services (NAICS 561-814).9
We next examine how the size of establishments in a location affects the entry of suppliers. As
noted by earlier studies [2], large firms may achieve economies of scale without the use of IT services
firms. Thus, controlling for market size, the supply of IT services firms will decrease as the size of
establishments increase relative to the industry average. To measure how variation in the establishment
size distribution affects industry employment, we construct the following index of establishment size:
(total employment in county and industry m)(total county (total establishments in county and industry m)
(total employment in industry in US)(total establishments in industry in US)
lm
lllESTSIZE m
m
=∑ employment in industry )(total county employment)
ml
.
Entry of outsourcing firms may also be influenced by cost differences across locations. One thing
that may influence the costs of outsourcing firms may be the availability of highly skilled workers. To
proxy for this, we also include the log of total enrollment from post-secondary colleges and universities in
the county, obtain from Barron’s Educational Series.
We also instrument for 2ix since it may be correlated with establishment-specific unobservables
that influence the likelihood of outsourcing. As an instrument for changes in the number of programmers,
we calculate the change in programmers in other firms in the same 2-digit NAICS industry in other
locations that the firm has an establishment. The instruments pick up factor changes in industry specific
demand (but not location specific demand) and should be correlated with an establishment’s change in
programmers but not with the propensity of the establishment to outsource, conditional on its industry.
We instrument for changes in the number of servers using this variable plus changes in the number of
9 The excluded category includes Mining (211-213), Utilities (221), and Construction (233-235, and Transportation and Warehousing (481-493).

13
servers in other firms in the same 2-digit NAICS industry in other locations that the firm has an
establishment. We include both variables as instruments.
6. Results
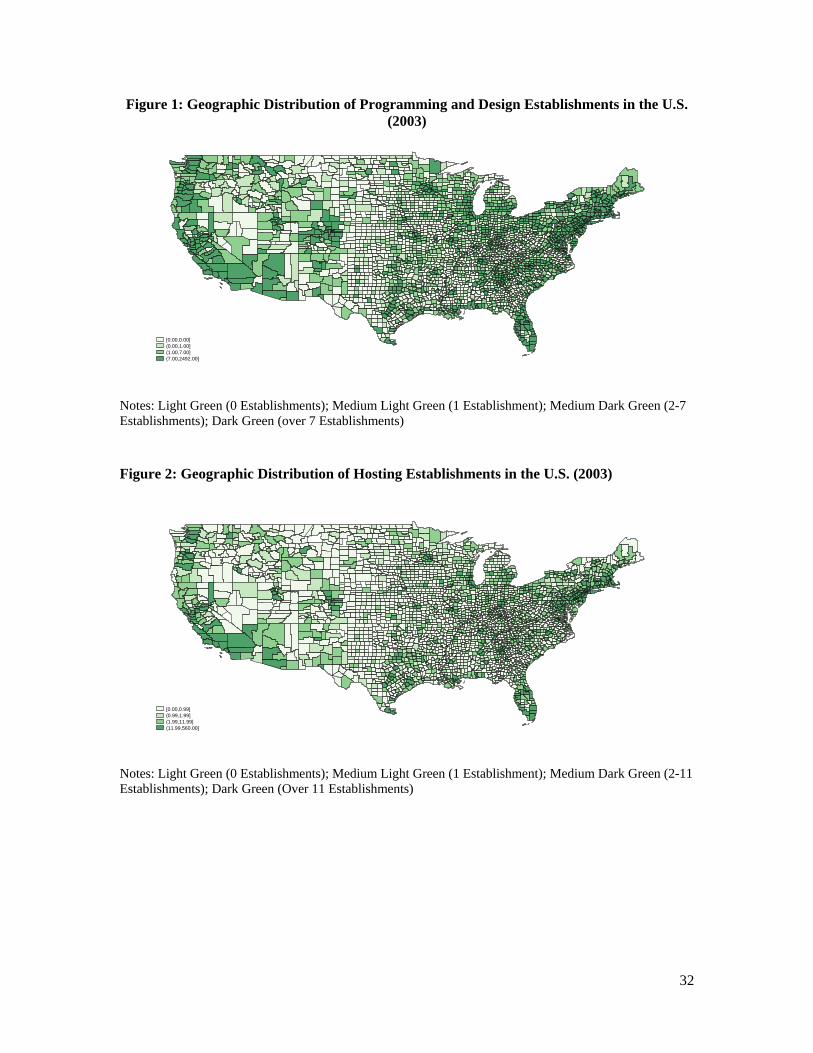
We begin by examining the geographic variation in the supply of IT services firms. Figures 1 and
2 show the number of programming and design and hosting establishments across the counties of the
contiguous 48 states. Figure 1 shows that programming and design establishments are widely dispersed
across the U.S. 62.4% of counties have at least one programming and design establishment in them, and
the distribution of establishments broadly follows the density of economic activity in the U.S. Large cities
and their surrounding communities have a large supply of such establishments, while isolated counties in
the Midwest and West usually do not. The (Pearson) correlation coefficient between county employment
and number of programming and design establishments is 0.8930, while the Spearman rank correlation is
0.8302.
Figure 2 shows that while the supply of hosting establishments is also greater in locations with
more IT outsourcing demand, the number of hosting establishments appears to be more concentrated in a
relatively small number of counties. Only 46.7% of counties have at least one hosting and management
establishment in them. The Pearson correlation coefficient between number of hosting and management
establishments and total county employment is 0.9462; however the Spearman rank coefficient is 0.7635.
The high Pearson correlation is high partly because of the large number of hosting establishments in large
cities. Moreover, the map shows that although hosting establishments are generally located in the largest
cities, many counties in the surrounding metropolitan areas have few or no hosting establishments.
6.1 Baseline Results
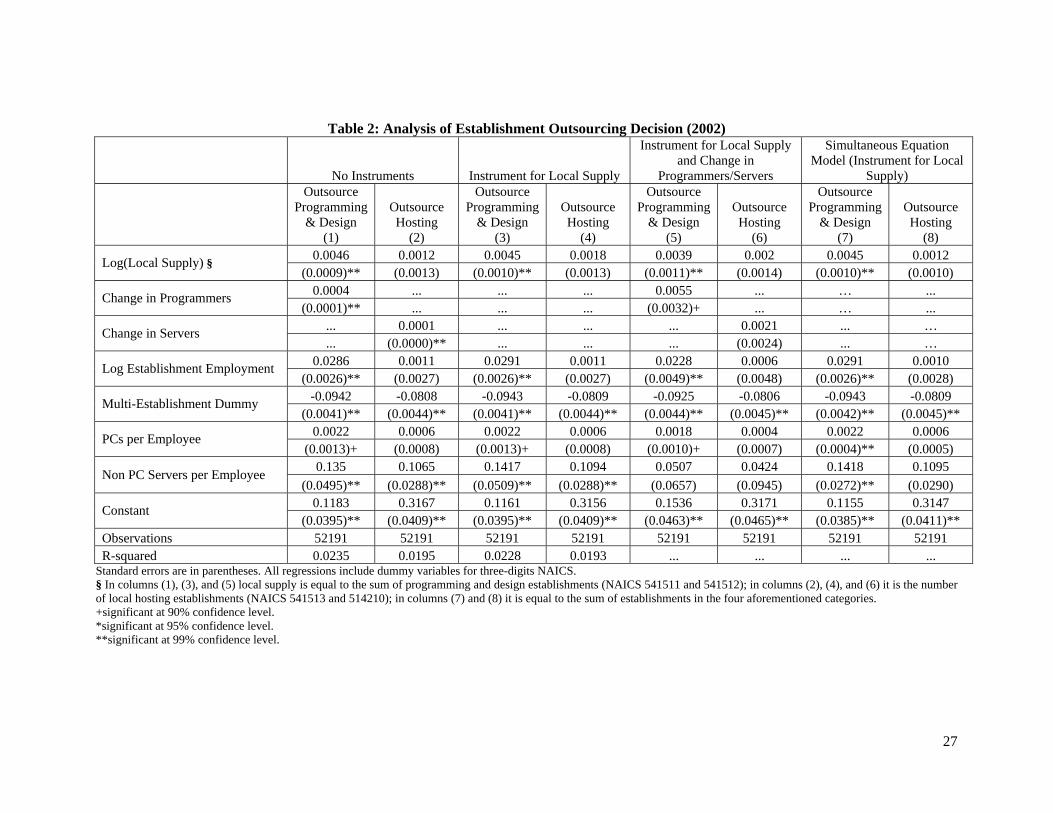
We first examine the relationship between local supply and the likelihood of outsourcing in 2002.
Table 2 displays our 2002 baseline results for the association between local supply and the outsourcing of
programming, design, and hosting services. Columns (1) and (2) show results without instrumental
variables; columns (3) and (4) show the results of instrumenting for local supply but not for changes in
14
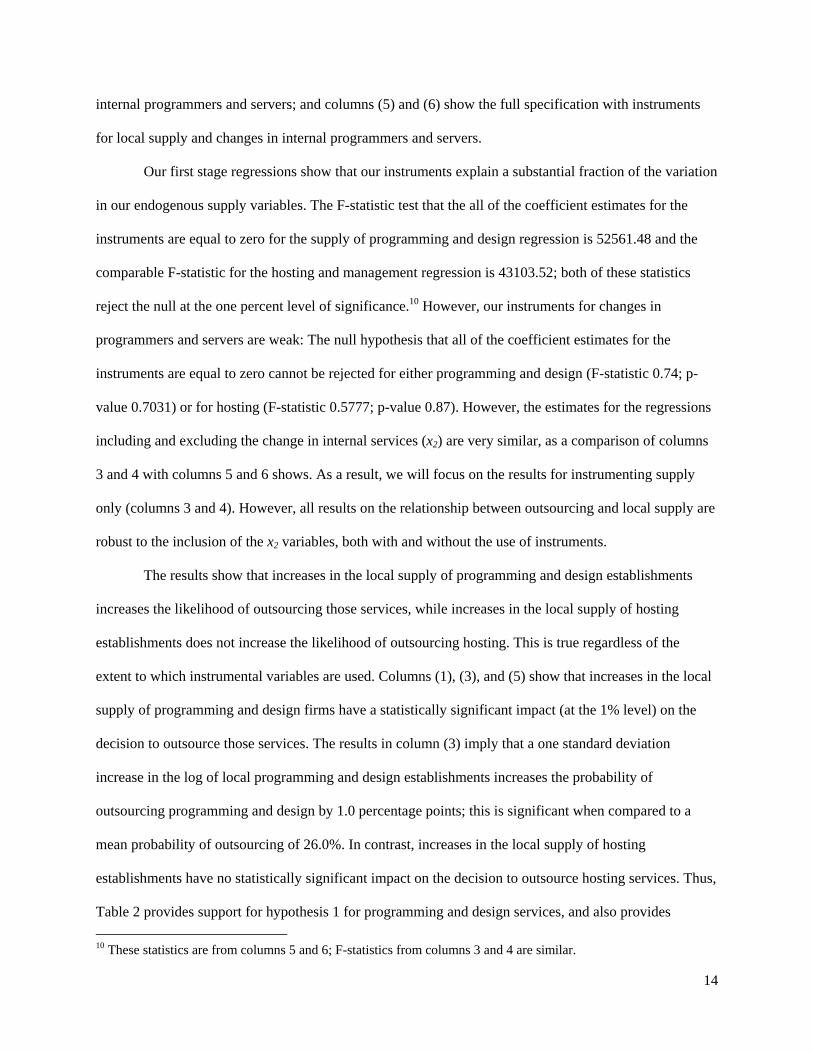
internal programmers and servers; and columns (5) and (6) show the full specification with instruments
for local supply and changes in internal programmers and servers.
Our first stage regressions show that our instruments explain a substantial fraction of the variation
in our endogenous supply variables. The F-statistic test that the all of the coefficient estimates for the
instruments are equal to zero for the supply of programming and design regression is 52561.48 and the
comparable F-statistic for the hosting and management regression is 43103.52; both of these statistics
reject the null at the one percent level of significance.10 However, our instruments for changes in
programmers and servers are weak: The null hypothesis that all of the coefficient estimates for the
instruments are equal to zero cannot be rejected for either programming and design (F-statistic 0.74; p-
value 0.7031) or for hosting (F-statistic 0.5777; p-value 0.87). However, the estimates for the regressions
including and excluding the change in internal services (x2) are very similar, as a comparison of columns
3 and 4 with columns 5 and 6 shows. As a result, we will focus on the results for instrumenting supply
only (columns 3 and 4). However, all results on the relationship between outsourcing and local supply are
robust to the inclusion of the x2 variables, both with and without the use of instruments.
The results show that increases in the local supply of programming and design establishments
increases the likelihood of outsourcing those services, while increases in the local supply of hosting
establishments does not increase the likelihood of outsourcing hosting. This is true regardless of the
extent to which instrumental variables are used. Columns (1), (3), and (5) show that increases in the local
supply of programming and design firms have a statistically significant impact (at the 1% level) on the
decision to outsource those services. The results in column (3) imply that a one standard deviation
increase in the log of local programming and design establishments increases the probability of
outsourcing programming and design by 1.0 percentage points; this is significant when compared to a
mean probability of outsourcing of 26.0%. In contrast, increases in the local supply of hosting
establishments have no statistically significant impact on the decision to outsource hosting services. Thus,
Table 2 provides support for hypothesis 1 for programming and design services, and also provides 10 These statistics are from columns 5 and 6; F-statistics from columns 3 and 4 are similar.

15
support for hypothesis 2 (programming and design outsourcing is more sensitive to variations in local
supply than is hosting outsourcing).
The R-squared values are small in all of these models, ranging from 0.0193 to 0.0228. The reason
is that our dependent variable is a binary rather than a continuous measure of the extent of outsourcing.
As has been shown by previous authors, it is not uncommon to have R-squared values as low as these in
limited dependent variable models [5].
Columns (7) and (8) estimate a simultaneous equations model of the decision to outsource
programming and design and hosting services. In this model, we use an aggregate measure of local supply
that combines programming, design, and hosting establishments, and then instrument for this using the
same set of variables as those in columns (3) and (4). This model allows us to statistically test for a
difference in the coefficient estimates across the two models. The results are qualitatively similar to those
in columns (3) and (4); in particular, they show that the coefficient estimate for the supply of
programming and design is greater than that for hosting at the 5% significance level.
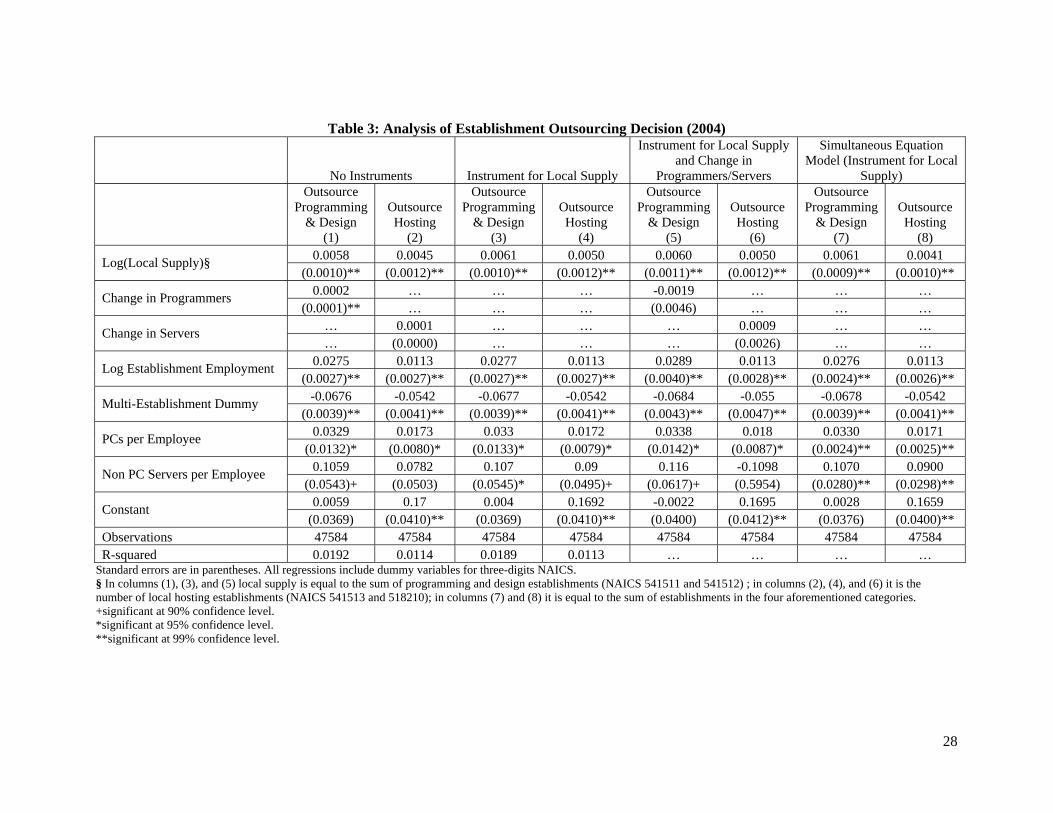
In Table 3 we estimate the same set of models using 2004 data to examine how the importance of
proximity to local supply has been changing over time. There is no evidence in our data that the
importance of proximity is declining over time, at least over this short time period. If anything, proximity
to local suppliers has become more important to the decision to source externally. In other words, our
results support hypothesis 3. All of the coefficients for local supply variables are larger in Table 3 than
the comparable estimates in Table 2. The results in column (3) suggest local programming and design
supply has a statistically significant impact on the decision to outsource programming and design (at the
1% level) and that a one standard deviation increase in the log of local programming and design
establishments increases the likelihood of outsourcing those services by 1.3 percentage points or by 6.3%:
this compares to a 1.0 percentage point increase for an identical increase in supply in 2002.
Column (4) also shows that in 2004 the decision to outsource hosting services was sensitive to
variations in local supply; this is in contrast to our 2002 results which showed that local supply played
little role on the decision to outsource hosting. Increases in local hosting establishments has a statistically
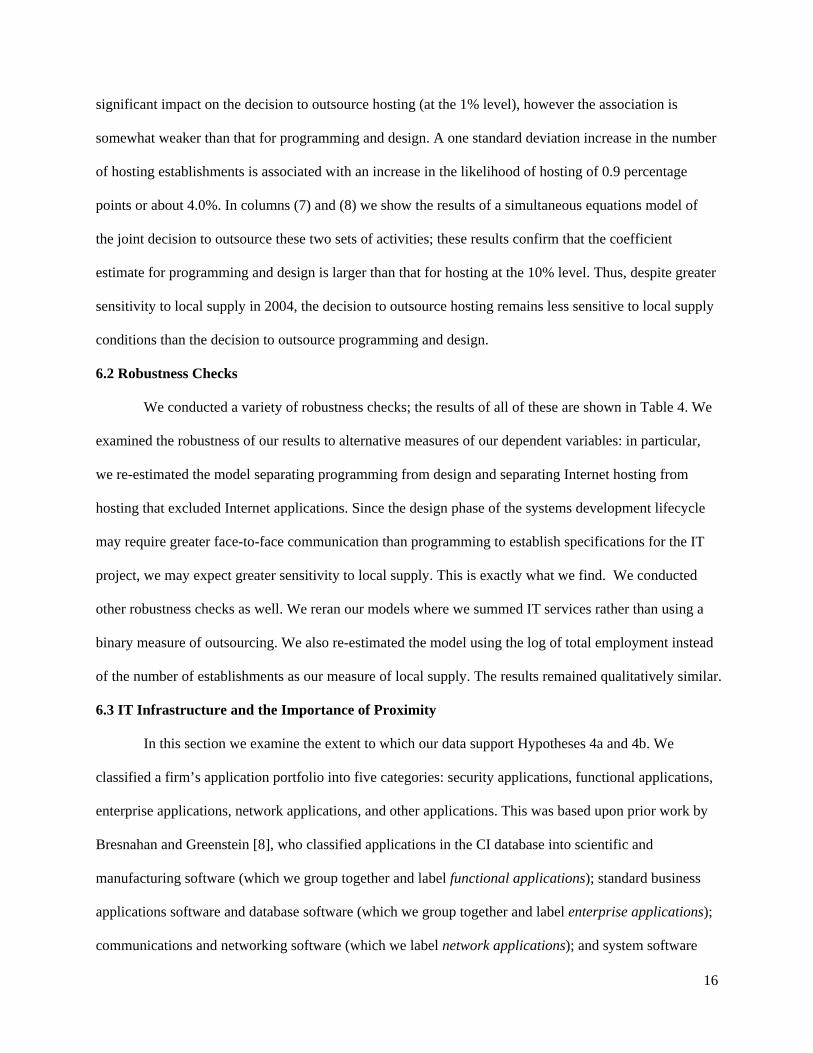
16
significant impact on the decision to outsource hosting (at the 1% level), however the association is
somewhat weaker than that for programming and design. A one standard deviation increase in the number
of hosting establishments is associated with an increase in the likelihood of hosting of 0.9 percentage
points or about 4.0%. In columns (7) and (8) we show the results of a simultaneous equations model of
the joint decision to outsource these two sets of activities; these results confirm that the coefficient
estimate for programming and design is larger than that for hosting at the 10% level. Thus, despite greater
sensitivity to local supply in 2004, the decision to outsource hosting remains less sensitive to local supply
conditions than the decision to outsource programming and design.
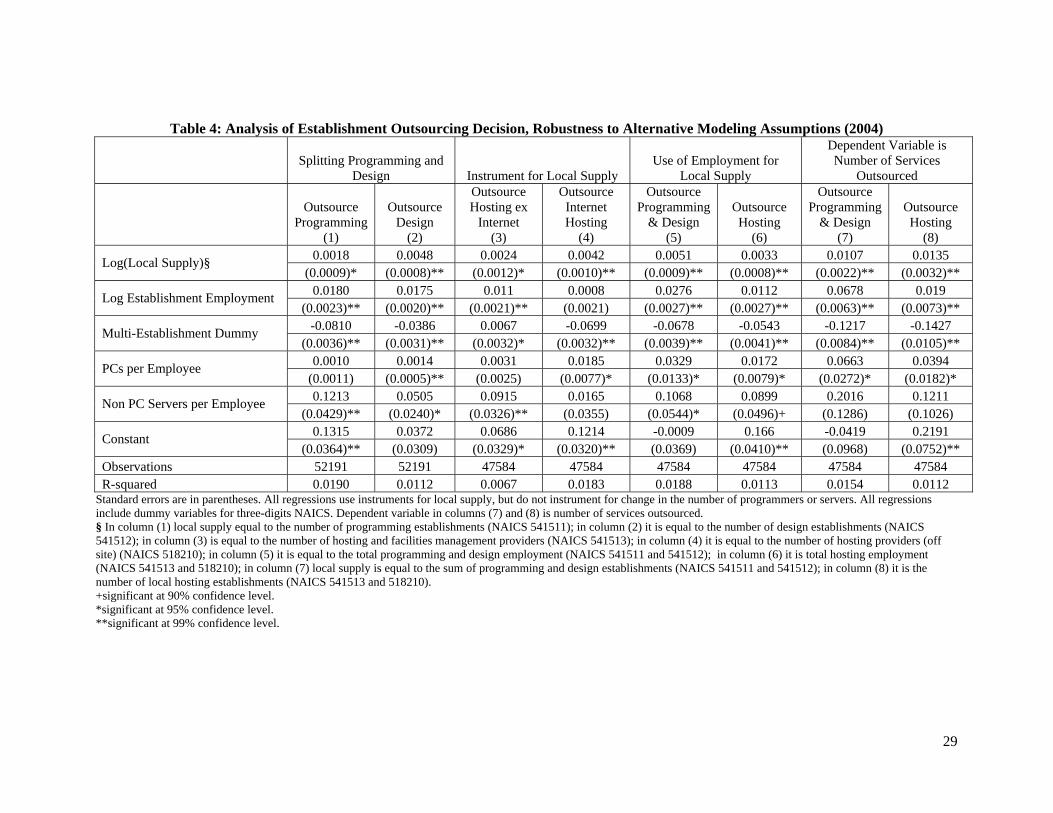
6.2 Robustness Checks
We conducted a variety of robustness checks; the results of all of these are shown in Table 4. We
examined the robustness of our results to alternative measures of our dependent variables: in particular,
we re-estimated the model separating programming from design and separating Internet hosting from
hosting that excluded Internet applications. Since the design phase of the systems development lifecycle
may require greater face-to-face communication than programming to establish specifications for the IT
project, we may expect greater sensitivity to local supply. This is exactly what we find. We conducted
other robustness checks as well. We reran our models where we summed IT services rather than using a
binary measure of outsourcing. We also re-estimated the model using the log of total employment instead
of the number of establishments as our measure of local supply. The results remained qualitatively similar.
6.3 IT Infrastructure and the Importance of Proximity
In this section we examine the extent to which our data support Hypotheses 4a and 4b. We
classified a firm’s application portfolio into five categories: security applications, functional applications,
enterprise applications, network applications, and other applications. This was based upon prior work by
Bresnahan and Greenstein [8], who classified applications in the CI database into scientific and
manufacturing software (which we group together and label functional applications); standard business
applications software and database software (which we group together and label enterprise applications);
communications and networking software (which we label network applications); and system software

17
and utilities (which we include in our other category). It is also related to recent work by McAfee [30],
who groups IT into enterprise IT, network IT, and function IT. We add security applications as a separate
category because of the potential importance of vendor proximity for clients for whom security is a major
concern. We generate a dummy variable for each of these five categories.11
Using these variables, we estimate the following model:
*1 2α β δ γ η ν
∈
= + + × + + +∑i i i j i j i i ij C
x os x os app z
where appj indicates a dummy variable for the jth application, where
{Security, Enterprise, Network, Functional}∈ ≡j C .
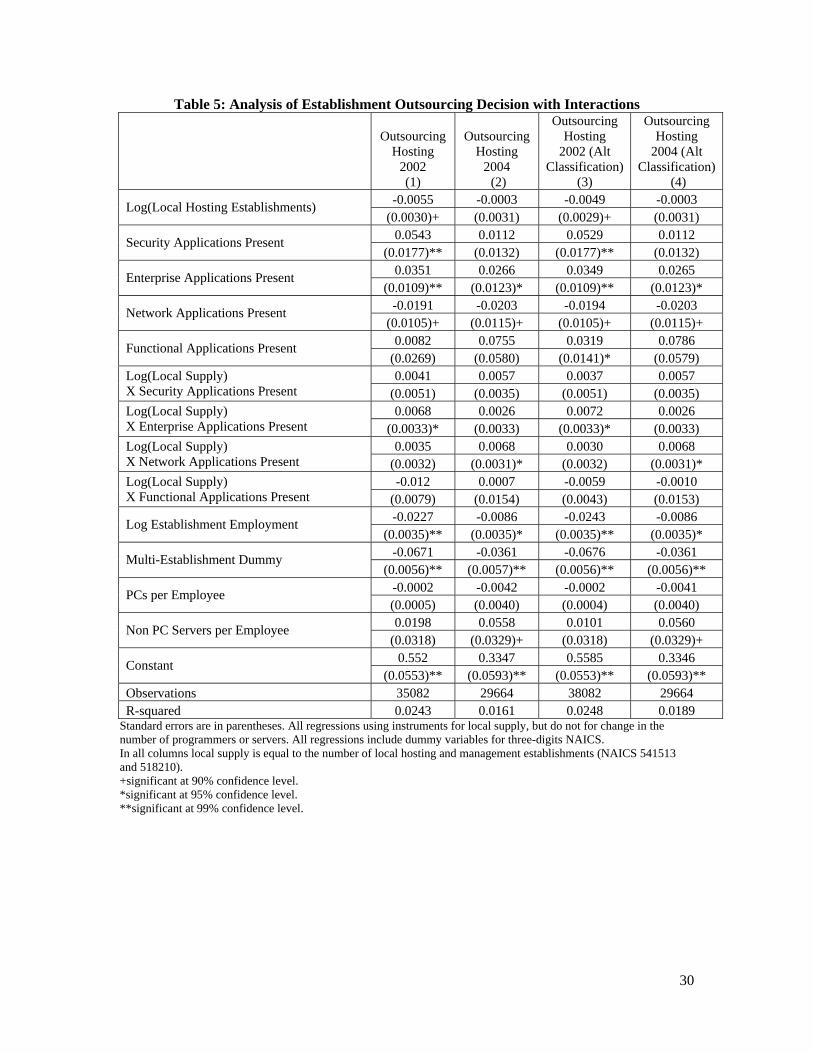
Table 7 shows the results of including these variables in our outsourcing regression and
interacting them with our measures of local supply. To eliminate potential biases engendered by
unobserved differences across establishments that do and do not report their use of software applications,
this sample includes only establishments that have reported software applications and as a result the
sample size is lower than that in earlier tables (to 35,082 and 29,664 in 2002 and 2004, respectively).
Columns (1) and (2) show the baseline results for hosting in 2002 and 2004.
The results in column (1) show that for hosting outsourcing, the interaction between local supply
and enterprise applications is positive and significant at the one percent level in 2002. However, the direct 11 In brief, our dummy variable for security applications was equal to one if and only if the establishment reported the use of security/encryption software. Our dummy variable for functional applications was one when the establishment reported one of the following applications: CAD/CAM/CAE; customer/salesforce management; data analysis & simulation; office automation; spreadsheet; suites; engineering; imaging; project management; and science/research. Our dummy variable for enterprise applications was equal to one when the establishment reported use of one of the following applications: accounting; business intelligence; database management; e-commerce software; ERP; general business software; MRP; payroll; personnel management; TP monitors; customer service; decision support; financial management; inventory; marketing; order administration; personnel; sales/marketing; web site database; data warehouse; and knowledge management. Our dummy variable for network applications was equal to one when the establishment reported one of the following: application server software; electronic mail; groupware software; web browser; web design tools; web development tools; homepage; intranet; communication control; network control; terminal emulation; and web server software. Our dummy variable for other application was equal to one when the establishment reported one of the following: application development; interactive programming; program testing/debugging; programming utilities; backup & recovery; file management; industry specific software; job scheduling; messaging middleware; micro link; performance measurement; report generation/management; store management; system utilities; system/software management; education; government; help desk; resource management. We also experimented with using the percentage of applications in each of these five categories, however the mass of the distribution is concentrated at zero and one for each of these applications. These results are qualitatively similar to the ones presented in the paper.

18
effect of local supply is negative and significant, so that the combined direct effect and interaction term is
never significantly positively associated with an increase in the outsourcing probability. Because of the
weak relationship between outsourcing supply and demand for hosting in 2002, we interpret these results
as our inability to measure jointly the effects of variance in the direct effect and interaction term. In 2004,
the direct effect of local supply on hosting is approximately zero and statistically insignificant, but the
coefficient estimate of the interaction term with of network applications is positive (0.0068) and
statistically significant at the 5% level, while that with security applications (0.0057) is marginally
significant with a p-value of 10.2%. The sum of the parameter estimates for the direct effect of local
supply with the interaction term for network applications is significant at the 5% level, though the sum of
the parameter estimate for local supply and the interaction term for security applications is not significant
at conventional levels. We interpret these results as supportive for Hypothesis 4a and weakly supportive
for hypothesis 4b. More broadly, these analyses suggest that hosting’s increase in sensitivity to local
supply is driven primarily by establishments for whom network uptime and security is a priority.
Columns 3 and 4 show the results of a robustness check that uses an alternative classification of
applications.12 The results remain qualitatively the same.
7. Discussion and Conclusions
7.1 Findings
In this paper we have examined the geographic variation in supply and the decision to outsource
two types of outsourcing services: programming and design and hosting. Differences in the characteristics
of these services and the manner in which they are supplied has led to substantial differences in their
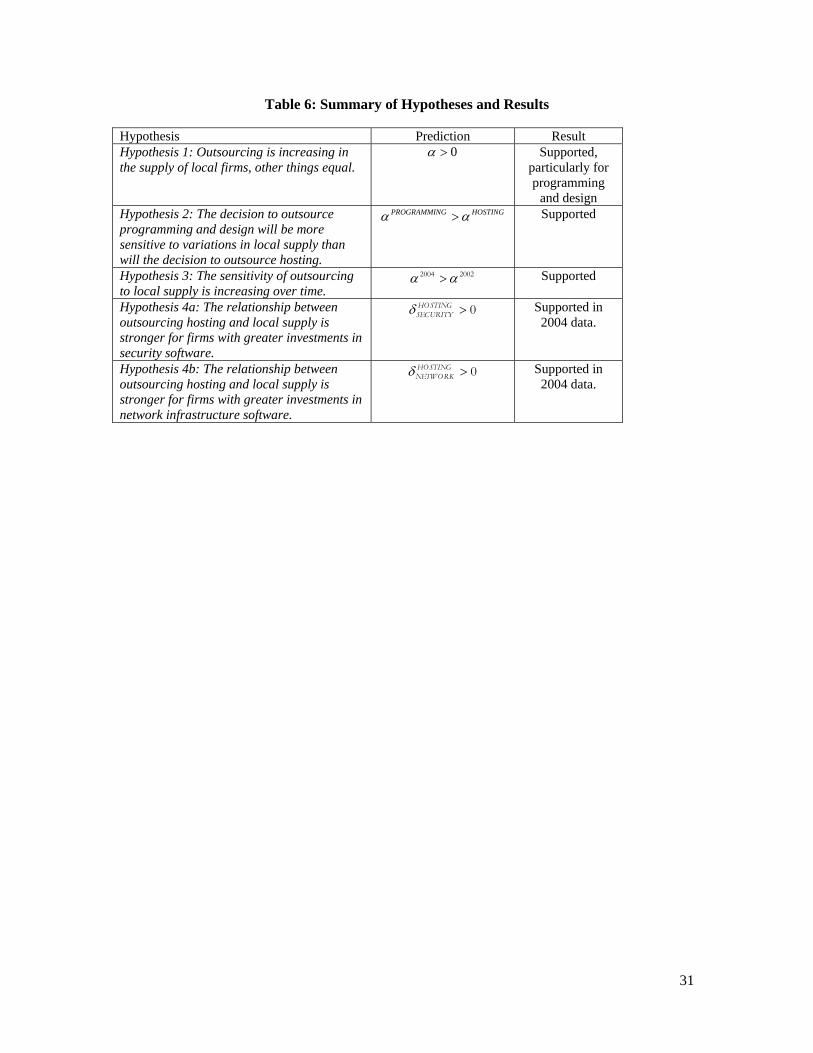
geographic dispersion and, in turn, their tradability. Table 6 lists our primary findings. We find some
support for all of our major hypotheses.
For one class of services, programming and design, establishment decisions to outsource are
significantly influenced by the magnitude of local supply. These results suggest that markets for
12 In particular, the following enterprise applications are reclassified as functional applications: accounting, payroll, personnel management, marketing, and inventory.

19
programming and design services are at least partly local. In contrast, micro-level outsourcing decisions
for hosting services are less sensitive to the characteristics of the local market. Our results showed that the
decision to outsource hosting services was not sensitive at all to changes in local supply in 2002. We did
find evidence on the effects of local supply in 2004; however this appeared to be most important for firms
for which network uptime and information security were particular concerns.
A long line of information systems research has suggested that IT reduces communication and
coordination costs ([26], [13]). Some authors have argued that the coordination benefits of IT will lead to
increases in offshoring [35]. We find no evidence that IT has significantly eroded the importance of
proximity. Despite substantial progress in information technology, the importance of proximity has not
decreased between 2004 and 2002, and remains substantial. Moreover, those establishments that had the
deepest investments in networking technologies that would reduce communication costs were also the
ones for which proximity was most important.
7.2 Implications
Going back to March and Simon [27], scholars have understood the challenges of software
development in a distributed environment. These challenges have led to the emergence of a literature on
globally distributed software development. However, heretofore there has been relatively little systematic
empirical evidence on the conditions under which IT services are tradable. Our research contributes to the
existing literature by demonstrating how proximity to users is also an important determinant of the costs
of outsourcing. Moreover, in contrast to prior work which has focused on case studies, we demonstrate
this in a broader environment than has previously been possible.
Our work also contributes to the outsourcing literature. In contrast to much of the literature on the
decision to outsource, which focuses on firm characteristics that lead to variance in the costs or benefits to
outsourcing [25], or the influence of political or institutional factors within the firm or between
contracting parties ([24], [1]), we focus on the role of proximity to suppliers.
Our research also contributes to understanding the economic geography of the software industry
in the US. Prior work has demonstrated that the US software industry is less concentrated that other

20
technology industries such as computing hardware [23]. Our research shows that this pattern may be
explained in part by the need for proximity to users.
In short, this work shows that there may be some irreducible component to software development
and system design that cannot take place at a distance from users. This suggests that it may be some time
before certain types of IT activities can be economically offshored; at the very least, it is consistent with
the finding that offshore outsourcing firms tend also to have a substantial domestic presence in the United
States. More speculatively, it suggests that some complex programming and design tasks are not easily
partitioned. This has implications for the location of inventive activity in software development,
potentially implying that some difficult design and development tasks cannot be produced away from the
United States, where software development activity is centered. Arora, Forman, and Yoon [4] provide
further evidence on this latter conjecture in their recent study on the globalization of software R&D
activity.
These results have implications for understanding how trends in outsourcing and offshoring will
influence US employment growth. However, in contrast to prior work which has answered this question
by examining the concentration of broad three-digit industries [22], we examine the tradability of
narrower industry activities based upon the nature of the activity and systematic evidence on demand.
While some tasks in programming and design can undoubtedly be conducted at a distance, these results
suggest that providers of such services must maintain some local presence.
Our research also provides guidance to managers on which IT services tasks can be most easily
conducted at a distance, and suggests environments in which offshoring may be particularly problematic.
In particular, our results suggest that hosting offshoring is particularly problematic in environments with
complex network infrastructure, and when security concerns are an issue.
7.3 Limitations and Future Research
Our focus is on outsourcing rather than offshoring. The two are related but distinct. Offshoring
implies that the activity takes place offshore, but may be carried out by the firm itself or its foreign
subsidiaries. Outsourcing implies that the activity is carried out by another firm, be it nearby or offshore.

21
It is possible that there are subtle interactions between need for proximity and contracting across firm
boundaries so that the potential for offshoring may be greater than that implied by our results for
programming and design services. However, the large number of programmers stationed by such vendors
near their customers (witness the ongoing uproar about the use of H1-B visas by IT firms) supports our
findings that there is a significant need for proximity in some (though not all) aspects of software design
and development. It is possible that this need may be satisfied by foreign programmers being moved to
be close to the clients; the fact remains that the activity takes place locally. Nonetheless, further work is
needed to understand whether the need for proximity in internal offshoring transactions is the same as that
for outsourced offshoring.
Another limitation to our study is that in our baseline analysis the dependent variable is binary:
we observe only the extensive margin of whether firms choose to outsource. Moreover, by necessity we
aggregate different classes of outsourcing services into two broad categories. If firms have a distribution
of IT projects that vary in the extent to which they can be conducted at a distance, our method will
systematically undervalue the importance of proximity to the outsourcing decision. Though we conducted
a robustness check that showed the impact of proximity on number of service types outsourced, we are
unable to measure variations in the intensive margin of outsourcing within a service category that are due
to differences in proximity. Further work that uses the dollar value of IT outsourcing would be better able
to quantify the value of proximity.
Current work in offshoring [10] has suggested that some firms are systematically more capable in
offshoring than others. Are these less capable firms systematically more reliant on proximity to suppliers?
What makes a firm more or less capable? Further work is also needed to understand which firms and
outsourcing tasks most require proximity.
Our paper presents a methodology for identifying tradable and non-tradable services that can be
useful outside of an IT setting. Use of this method could be useful in identifying which positions are most
at risk for being moved to alternate locations. Moreover, this method could also be useful for identifying
whether the set of positions at risk is changing over time, due to improvements in outsourcing practices,

22
technological change in IT that may reduce the coordination costs associated with distance [18], or some
other reason.

23
References
1. Ang, S., and Cummings, L.L. Strategic Response to Institutional Influences on Information Systems Outsourcing. Organization Science, 8, 3 (May-June 1997), 235-256.
2. Ang, S., and Straub, D. Production and Transaction Economies and IS Outsourcing: A Study of the
U.S. Banking Industry. MIS Quarterly, 22, 4 (December 1998), 535-552. 3. Aron, R., and Liu, Y. Determinants of Operational Risk in Global Sourcing of Financial Services:
Evidence from Field Research. In S.M. Collins and L. Brainard (eds.), Brookings Trade Forum 2005: Offshoring White-Collar Work. Washington, DC: Brookings Institution Press, 2005, pp. 373-398.
4. Arora, A.; Forman, C.; and Yoon, J. Software. In J. Macher and D. C. Mowery (eds.) Globalization
of Research. Washington, DC: National Academy of Sciences Press (tentative title), 2007. 5. Athey, S. and Stern, S. The impact of information technology on emergency health care outcomes.
RAND Journal of Economics, 33, 3 (Autumn 2002), 399-432. 6. Austin, R. D. The iPremier Company (A): Denial of Service Attack. Harvard Business School
Case 9-601-114. 7. Beardsell, M., and Henderson, V. Spatial evolution of the computer industry in the USA. European
Economic Review, 43, 2 (February 1999), 431-456. 8. Bresnahan, T., and Greenstein, S. Technical Progress in Computing and in the Uses of Computers.
Brookings Papers on Economic Activity, Microeconomics (1996), 1-78. 9. Bresnahan, T. and Reiss, P. Entry and Competition in Concentrated Markets. Journal of Political
Economy, 99, 5 (October 1991), 977-1009. 10. Carmel, E., and Agarwal, R. The maturation of offshore sourcing of information technology work.
MIS Quarterly Executive 1, 2 (June 2002), 65-76. 11. Carmel, E., and Tija, P. Offshoring Information Technology: Sourcing and Outsourcing to a
Global Workforce. Cambridge: Cambridge University Press, 2005. 12. Clemons, E. and Aron, R. Maximize Your Outsourcing Benefits Through Competitive Arbitrage.
Working Paper, Wharton School of Business, University of Pennsylvania, 2004. 13. Clemons, E.; Reddi, S. P.; and Row, M. The impact of information technology on the
organization of production: The “move to the middle” hypothesis. Journal of Management Information Systems 10, 2 (Fall 1993), 9-35.
14. Cooke, S. Information technology workers in the digital economy. In Digital Economy 2003,
Chapter II. Washington, DC: Department of Commerce. www.esa.doc.gov/DigitalEconomy2003.cfm. 15. Daft, R.L., and Lengel, R.H. Information richness: A new approach to managerial behavior and
organization design. In B. Staw and L. Cummings (eds.) Research in Organizational Behavior Greenwich, CT: JAI Press, 1986, pp. 191-233.
16. Daft, R.L.; Lengel, R.H. ; and Trevino, L. Message Equivocality, Media Selection, and Manager

24
Performance. MIS Quarterly 11, 3 (September 1987), 355-366. 17. Forman, C. The Corporate Digital Divide: Determinants of Internet Adoption. Management
Science 51, 4 (April 2005), 641-654. 18. Forman, C.; Goldfarb, A.; and Greenstein, S. How Did Location Affect Adoption of the
Commercial Internet? Global Village v. Urban Leadership. Journal of Urban Economics 58 (November 2005), 389-420.
19. Gopal, A.; Mukhopadhyay, T.; and Krishnan, M.S. The Role of Software Processes and
Communication in Offshore Software Development. Communications of the ACM 45, 4 (April 2002), 193-200.
20. Gopal, A.; Sivaramakrishnan, K.; Krishnan, M.S.; and Mukhopadhyay, T. Contracts in Offshore
Software Development: An Empirical Analysis. Management Science 49, 12 (December 2003), 1671-1683.
21. Gopal, A., and Sivaramakrishnan, K. On Vendor Preferences for Contract Types in Offshore
Projects: The Case of Fixed Price versus Time and Materials Contracts. Working Paper, Smith School of Business, University of Maryland, 2006.
22. Jensen, J. B., and Kletzer, L. G. Tradable Services: Understanding the Scope and Impact of
Services Offshoring. In S.M. Collins and L. Brainard (eds.), Brookings Trade Forum 2005: Offshoring White-Collar Work. Washington, DC: Brookings Institution Press, 2005, pp. 75-116.
23. Kauffman, R. and Kumar, A. A Combined Scale-and-Scope Theory of IT Industry Cluster
Growth. Working Paper, Carlson School of Management, University of Minnesota, 2006. 24. Lacity, M. C., and Hirschheim, R. Information Systems Outsourcing: Myths, Metaphors, and
Realities. New York: John Wiley & Sons, 1993. 25. Loh, L., and Venkatraman, N. Determinants of Information Technology Outsourcing: A Cross-
Sectional Analysis. Journal of Management Information Systems 9,1 (Summer 1992), 7-24. 26. Malone, T.; Yates, J.; and Benjamin, R. Electronic Markets and Electronic Hierarchies.
Communications of the ACM. 30, 6 (June 1987), 484-497. 27. March, J. G., and Simon, H.A. Organizations. New York: Wiley, 1958. 28. Marshall, A. Principles of Economics. London: Macmillan, 1920. 29. Matloff, N. Offshoring: What Can Go Wrong? IT Professional 7, 4 (July | August 2005), 39-45. 30. McAfee, A. Mastering the Three Worlds of Information Technology. Harvard Business Review
Reprint R0611J (2006), 1-9. 31. McCarthy, J. C. 3.3 Million US Services Jobs To Go Offshore. TechStrategyTM Research,
Forrester Research (November), 2002. 32. Mintzberg, H. Structure in Fives: Designing Effective Organizations. Englewood Cliffs, NJ:
Prentice Hall, 1993.

25
33. Ono, Y. Outsourcing Business Service and the Scope of Local Markets. Working Paper WP 2001-
09, Federal Reserve Bank of Chicago, 2001. 34. Sood, R. IT, Software, and Services: Outsourcing & Offshoring. Austin: AiAiYo Books, 2005. 35. Whitaker, J.; Mithas, S.; Kumar, S.; and Krishnan, M.S. Antecedents and Performance Outcomes
of Onshore and Offshore Business Process Outsourcing. Working Paper, Ross School of Business, University of Michigan, 2006.

26
Table 1: Descriptive Statistics for Establishment Outsourcing Analysis Mean Std. Dev. Minimum Maximum Number Obs 2002 Data Outsource Programming & Design 0.260409 0.438862 0 1 52191 Outsourcing Hosting Ex Internet 0.3224502 0.4674187 0 1 52191 Log(Local Programming & Design Establishments) 4.5142 2.19376 0 7.765145 52191 Log(Local Hosting Establishments) 2.863149 1.751509 0 5.774552 52191 Change in Programmers 0.837357 28.81435 -500 500 52191 Change in Servers 1.088138 70.45643 -10000 6000 52191 Change in Programmers Instrument 0.314018 5.764956 -346.655 250 52191 Change in Servers Instrument 0.242966 9.864905 -883.463 410.5 52191 Log of County Employment 12.03868 1.729237 3.496508 15.16671 52191 IT Intensity Index 0.007193 0.003516 0 0.086475 52191 Establishment Size Index 1.520034 1.246224 0.479992 36.02635 52191 Log University Enrollment 8.953789 3.53963 0 13.1765 52191 Percent of Establishments in Manufacturing 0.157896 0.107231 0 0.956435 52191 Percent of Establishments in Whlse/Retail Trade 0.183636 0.035955 0.016416 1 52191 Percent of Establishments in FIRE 0.071733 0.034512 0 0.319149 52191 Percent of Establishments in Info Processing 0.057296 0.030596 0 0.347092 52191 Percent of Establishments in Other Services 0.373022 0.067172 0.092736 1 52191 Percent of Establishments in IT-Producing 0.047099 0.033799 0 0.470837 52191 Log Establishment Employment 5.567426 0.808246 4.60517 12.76769 52191 Multi-Establishment Dummy 0.428963 0.494933 0 1 52191 PCs per Employee 0.529886 4.510383 0 1001.05 52191 Non PCS per Employee 0.009858 0.07051 0 8.033334 52191 2004 Data Outsource Programming & Design .1969359 .3976877 0 1 47584 Outsourcing Hosting .2303295 .4210482 0 1 47584 Log(Local Programming & Design Establishments) 4.554013 2.182343 0 7.821242 47584 Log(Local Hosting Establishments) 3.298404 1.849864 0 6.329721 47584 Change in Programmers .0804052 27.32528 -500 500 47584 Change in Servers .2619368 63.2404 -6000 5996 47584 Change in Programmers Instrument .056879 5.361489 -250 372 47584 Change in Servers Instrument .2000097 6.758896 -633.8888 270 47584 Log of County Employment 11.99981 1.724756 3.970292 15.14559 47584 IT Intensity Index .0135147 .1106074 0 1.917011 47584 Establishment Size Index 1.524583 1.170749 .2685202 40.29307 47584 Log University Enrollment 8.984475 3.506497 0 13.1765 47584 Percent of Establishments in Manufacturing .1438124 .1016654 0 1 47584 Percent of Establishments in Whlse/Retail Trade .1833131 .0365394 .0123518 1 47584 Percent of Establishments in FIRE .0757714 .0356119 .0049407 .3773585 47584 Percent of Establishments in Info Processing .0581592 .0333942 0 .370019 47584 Percent of Establishments in Other Services .3866645 .0672548 .0677201 1 47584 Percent of Establishments in IT-Producing .0216583 .0216625 0 .460733 47584 Log Establishment Employment 5.562991 .8210779 4.60517 10.91509 47584 Multi-Establishment Dummy .486466 .4998221 0 1 47584 PCs per Employee .5534679 .8117137 0 100 47584 Non PCS per Employee .0068324 .0657178 0 6.08 47584
27
Table 2: Analysis of Establishment Outsourcing Decision (2002)
No Instruments Instrument for Local Supply
Instrument for Local Supply and Change in
Programmers/Servers
Simultaneous Equation Model (Instrument for Local
Supply)
Outsource Programming
& Design (1)
Outsource Hosting
(2)
Outsource Programming
& Design (3)
Outsource Hosting
(4)
Outsource Programming
& Design (5)
Outsource Hosting
(6)
Outsource Programming
& Design (7)
Outsource Hosting
(8) 0.0046 0.0012 0.0045 0.0018 0.0039 0.002 0.0045 0.0012 Log(Local Supply) §
(0.0009)** (0.0013) (0.0010)** (0.0013) (0.0011)** (0.0014) (0.0010)** (0.0010) 0.0004 ... ... ... 0.0055 ... … ... Change in Programmers
(0.0001)** ... ... ... (0.0032)+ ... … ... ... 0.0001 ... ... ... 0.0021 ... … Change in Servers ... (0.0000)** ... ... ... (0.0024) ... …
0.0286 0.0011 0.0291 0.0011 0.0228 0.0006 0.0291 0.0010 Log Establishment Employment (0.0026)** (0.0027) (0.0026)** (0.0027) (0.0049)** (0.0048) (0.0026)** (0.0028)
-0.0942 -0.0808 -0.0943 -0.0809 -0.0925 -0.0806 -0.0943 -0.0809 Multi-Establishment Dummy (0.0041)** (0.0044)** (0.0041)** (0.0044)** (0.0044)** (0.0045)** (0.0042)** (0.0045)**
0.0022 0.0006 0.0022 0.0006 0.0018 0.0004 0.0022 0.0006 PCs per Employee (0.0013)+ (0.0008) (0.0013)+ (0.0008) (0.0010)+ (0.0007) (0.0004)** (0.0005)
0.135 0.1065 0.1417 0.1094 0.0507 0.0424 0.1418 0.1095 Non PC Servers per Employee (0.0495)** (0.0288)** (0.0509)** (0.0288)** (0.0657) (0.0945) (0.0272)** (0.0290)
0.1183 0.3167 0.1161 0.3156 0.1536 0.3171 0.1155 0.3147 Constant (0.0395)** (0.0409)** (0.0395)** (0.0409)** (0.0463)** (0.0465)** (0.0385)** (0.0411)**
Observations 52191 52191 52191 52191 52191 52191 52191 52191 R-squared 0.0235 0.0195 0.0228 0.0193 ... ... ... ...
Standard errors are in parentheses. All regressions include dummy variables for three-digits NAICS. § In columns (1), (3), and (5) local supply is equal to the sum of programming and design establishments (NAICS 541511 and 541512); in columns (2), (4), and (6) it is the number of local hosting establishments (NAICS 541513 and 514210); in columns (7) and (8) it is equal to the sum of establishments in the four aforementioned categories. +significant at 90% confidence level. *significant at 95% confidence level. **significant at 99% confidence level.
28
Table 3: Analysis of Establishment Outsourcing Decision (2004)
No Instruments Instrument for Local Supply
Instrument for Local Supply and Change in
Programmers/Servers
Simultaneous Equation Model (Instrument for Local
Supply)
Outsource Programming
& Design (1)
Outsource Hosting
(2)
Outsource Programming
& Design (3)
Outsource Hosting
(4)
Outsource Programming
& Design (5)
Outsource Hosting
(6)
Outsource Programming
& Design (7)
Outsource Hosting
(8) 0.0058 0.0045 0.0061 0.0050 0.0060 0.0050 0.0061 0.0041 Log(Local Supply)§
(0.0010)** (0.0012)** (0.0010)** (0.0012)** (0.0011)** (0.0012)** (0.0009)** (0.0010)** 0.0002 … … … -0.0019 … … … Change in Programmers
(0.0001)** … … … (0.0046) … … … … 0.0001 … … … 0.0009 … … Change in Servers … (0.0000) … … … (0.0026) … …
0.0275 0.0113 0.0277 0.0113 0.0289 0.0113 0.0276 0.0113 Log Establishment Employment (0.0027)** (0.0027)** (0.0027)** (0.0027)** (0.0040)** (0.0028)** (0.0024)** (0.0026)**
-0.0676 -0.0542 -0.0677 -0.0542 -0.0684 -0.055 -0.0678 -0.0542 Multi-Establishment Dummy (0.0039)** (0.0041)** (0.0039)** (0.0041)** (0.0043)** (0.0047)** (0.0039)** (0.0041)**
0.0329 0.0173 0.033 0.0172 0.0338 0.018 0.0330 0.0171 PCs per Employee (0.0132)* (0.0080)* (0.0133)* (0.0079)* (0.0142)* (0.0087)* (0.0024)** (0.0025)**
0.1059 0.0782 0.107 0.09 0.116 -0.1098 0.1070 0.0900 Non PC Servers per Employee (0.0543)+ (0.0503) (0.0545)* (0.0495)+ (0.0617)+ (0.5954) (0.0280)** (0.0298)**
0.0059 0.17 0.004 0.1692 -0.0022 0.1695 0.0028 0.1659 Constant (0.0369) (0.0410)** (0.0369) (0.0410)** (0.0400) (0.0412)** (0.0376) (0.0400)**
Observations 47584 47584 47584 47584 47584 47584 47584 47584 R-squared 0.0192 0.0114 0.0189 0.0113 … … … …
Standard errors are in parentheses. All regressions include dummy variables for three-digits NAICS. § In columns (1), (3), and (5) local supply is equal to the sum of programming and design establishments (NAICS 541511 and 541512) ; in columns (2), (4), and (6) it is the number of local hosting establishments (NAICS 541513 and 518210); in columns (7) and (8) it is equal to the sum of establishments in the four aforementioned categories. +significant at 90% confidence level. *significant at 95% confidence level. **significant at 99% confidence level.
29
Table 4: Analysis of Establishment Outsourcing Decision, Robustness to Alternative Modeling Assumptions (2004)
Splitting Programming and
Design Instrument for Local Supply Use of Employment for
Local Supply
Dependent Variable is Number of Services
Outsourced
Outsource Programming
(1)
Outsource Design
(2)
Outsource Hosting ex
Internet (3)
Outsource Internet Hosting
(4)
Outsource Programming
& Design (5)
Outsource Hosting
(6)
Outsource Programming
& Design (7)
Outsource Hosting
(8) 0.0018 0.0048 0.0024 0.0042 0.0051 0.0033 0.0107 0.0135 Log(Local Supply)§
(0.0009)* (0.0008)** (0.0012)* (0.0010)** (0.0009)** (0.0008)** (0.0022)** (0.0032)** 0.0180 0.0175 0.011 0.0008 0.0276 0.0112 0.0678 0.019 Log Establishment Employment
(0.0023)** (0.0020)** (0.0021)** (0.0021) (0.0027)** (0.0027)** (0.0063)** (0.0073)** -0.0810 -0.0386 0.0067 -0.0699 -0.0678 -0.0543 -0.1217 -0.1427 Multi-Establishment Dummy
(0.0036)** (0.0031)** (0.0032)* (0.0032)** (0.0039)** (0.0041)** (0.0084)** (0.0105)** 0.0010 0.0014 0.0031 0.0185 0.0329 0.0172 0.0663 0.0394 PCs per Employee
(0.0011) (0.0005)** (0.0025) (0.0077)* (0.0133)* (0.0079)* (0.0272)* (0.0182)* 0.1213 0.0505 0.0915 0.0165 0.1068 0.0899 0.2016 0.1211 Non PC Servers per Employee
(0.0429)** (0.0240)* (0.0326)** (0.0355) (0.0544)* (0.0496)+ (0.1286) (0.1026) 0.1315 0.0372 0.0686 0.1214 -0.0009 0.166 -0.0419 0.2191 Constant
(0.0364)** (0.0309) (0.0329)* (0.0320)** (0.0369) (0.0410)** (0.0968) (0.0752)** Observations 52191 52191 47584 47584 47584 47584 47584 47584 R-squared 0.0190 0.0112 0.0067 0.0183 0.0188 0.0113 0.0154 0.0112
Standard errors are in parentheses. All regressions use instruments for local supply, but do not instrument for change in the number of programmers or servers. All regressions include dummy variables for three-digits NAICS. Dependent variable in columns (7) and (8) is number of services outsourced. § In column (1) local supply equal to the number of programming establishments (NAICS 541511); in column (2) it is equal to the number of design establishments (NAICS 541512); in column (3) is equal to the number of hosting and facilities management providers (NAICS 541513); in column (4) it is equal to the number of hosting providers (off site) (NAICS 518210); in column (5) it is equal to the total programming and design employment (NAICS 541511 and 541512); in column (6) it is total hosting employment (NAICS 541513 and 518210); in column (7) local supply is equal to the sum of programming and design establishments (NAICS 541511 and 541512); in column (8) it is the number of local hosting establishments (NAICS 541513 and 518210). +significant at 90% confidence level. *significant at 95% confidence level. **significant at 99% confidence level.
30
Table 5: Analysis of Establishment Outsourcing Decision with Interactions
Outsourcing Hosting
2002 (1)
Outsourcing Hosting
2004 (2)
Outsourcing Hosting
2002 (Alt Classification)
(3)
Outsourcing Hosting
2004 (Alt Classification)
(4) -0.0055 -0.0003 -0.0049 -0.0003 Log(Local Hosting Establishments)
(0.0030)+ (0.0031) (0.0029)+ (0.0031) 0.0543 0.0112 0.0529 0.0112 Security Applications Present
(0.0177)** (0.0132) (0.0177)** (0.0132) 0.0351 0.0266 0.0349 0.0265 Enterprise Applications Present
(0.0109)** (0.0123)* (0.0109)** (0.0123)* -0.0191 -0.0203 -0.0194 -0.0203 Network Applications Present
(0.0105)+ (0.0115)+ (0.0105)+ (0.0115)+ 0.0082 0.0755 0.0319 0.0786 Functional Applications Present
(0.0269) (0.0580) (0.0141)* (0.0579) 0.0041 0.0057 0.0037 0.0057 Log(Local Supply)
X Security Applications Present (0.0051) (0.0035) (0.0051) (0.0035) 0.0068 0.0026 0.0072 0.0026 Log(Local Supply)
X Enterprise Applications Present (0.0033)* (0.0033) (0.0033)* (0.0033) 0.0035 0.0068 0.0030 0.0068 Log(Local Supply)
X Network Applications Present (0.0032) (0.0031)* (0.0032) (0.0031)* -0.012 0.0007 -0.0059 -0.0010 Log(Local Supply)
X Functional Applications Present (0.0079) (0.0154) (0.0043) (0.0153) -0.0227 -0.0086 -0.0243 -0.0086 Log Establishment Employment
(0.0035)** (0.0035)* (0.0035)** (0.0035)* -0.0671 -0.0361 -0.0676 -0.0361 Multi-Establishment Dummy
(0.0056)** (0.0057)** (0.0056)** (0.0056)** -0.0002 -0.0042 -0.0002 -0.0041 PCs per Employee (0.0005) (0.0040) (0.0004) (0.0040) 0.0198 0.0558 0.0101 0.0560 Non PC Servers per Employee
(0.0318) (0.0329)+ (0.0318) (0.0329)+ 0.552 0.3347 0.5585 0.3346 Constant
(0.0553)** (0.0593)** (0.0553)** (0.0593)** Observations 35082 29664 38082 29664 R-squared 0.0243 0.0161 0.0248 0.0189
Standard errors are in parentheses. All regressions using instruments for local supply, but do not for change in the number of programmers or servers. All regressions include dummy variables for three-digits NAICS. In all columns local supply is equal to the number of local hosting and management establishments (NAICS 541513 and 518210). +significant at 90% confidence level. *significant at 95% confidence level. **significant at 99% confidence level.
31
Table 6: Summary of Hypotheses and Results Hypothesis Prediction Result Hypothesis 1: Outsourcing is increasing in the supply of local firms, other things equal.
0α > Supported, particularly for programming
and design Hypothesis 2: The decision to outsource programming and design will be more sensitive to variations in local supply than will the decision to outsource hosting.
α α>PROGRAMMING HOSTING Supported
Hypothesis 3: The sensitivity of outsourcing to local supply is increasing over time.
α α>2004 2002 Supported
Hypothesis 4a: The relationship between outsourcing hosting and local supply is stronger for firms with greater investments in security software.
0HOSTINGSECURITYδ > Supported in
2004 data.
Hypothesis 4b: The relationship between outsourcing hosting and local supply is stronger for firms with greater investments in network infrastructure software.
0HOSTINGNETWORKδ > Supported in
2004 data.
32
Figure 1: Geographic Distribution of Programming and Design Establishments in the U.S. (2003)
[0.00,0.00](0.00,1.00](1.00,7.00](7.00,2492.00]
Notes: Light Green (0 Establishments); Medium Light Green (1 Establishment); Medium Dark Green (2-7 Establishments); Dark Green (over 7 Establishments)
Figure 2: Geographic Distribution of Hosting Establishments in the U.S. (2003)
[0.00,0.99](0.99,1.99](1.99,11.99](11.99,560.00]
Notes: Light Green (0 Establishments); Medium Light Green (1 Establishment); Medium Dark Green (2-11 Establishments); Dark Green (Over 11 Establishments)