human use and ecological evaluation of the recommended
TRANSCRIPT

F i n a l R e p o r t
Human Use and Ecological Evaluation of the Recommended Minimum Flow
Regime for Blue Spring and Blue Spring Run, Volusia County
Prepared for
St. Johns River Water Management District
August 2004


WETLAND SOLUTIONS, INC.
ES-1
Executive Summary The St Johns River Water Management District (District) Minimum Flows and Levels (MFLs) Program establishes MFLs for surface water and ground water systems. MFLs typically define the frequency and duration of high, average, and low water events necessary to prevent significant ecological harm to aquatic and wetland habitats.
The District is in the process of establishing MFLs for Blue Spring located in Volusia County, Florida, adjacent to the St. Johns River. Blue Spring and Blue Spring Run are located in Blue Spring State Park which encompasses 2,483 acres (1,002 hectares) of land with a variety of habitats. The estimated existing annual average discharge of Blue Spring is 156 cubic feet per second (cfs) or 101 million gallons per day (mgd) (Rouhani et al., 2004). Since water levels in Blue Spring Run are controlled by levels in the adjacent St. Johns River, only minimum flows (MFs) are being recommended by the District.
Blue Spring and Blue Spring Run are internationally famous as a winter refuge for the endangered West Indian manatee (Trichechus manatus latirostris), a large aquatic mammal that requires winter warm water refuges to survive near the northern extreme of its range. Blue Spring is the only naturally occurring large winter refuge for manatees on the eastern coast of Florida and specifically for the St. Johns River population. Manatee use of Blue Spring and Blue Spring Run as a warm-water refuge has increased since 1972 when a manatee refuge area was established in the spring run (Rouhani, et al., 2004). Blue Spring Run also provides the only known habitat for two endemic snail species (FDEP, 1999).
Due to the unique relationship between Blue Spring and Blue Spring Run and the survival and expansion of the manatee population in Florida, minimum flows (MFs) for this aquatic resource will be determined to protect this species. However, in addition to considering the potential for harm to the manatee in establishing a MF, Section 62-40.473, Florida Administrative Code (FAC), requires the consideration of 10 human use and ecological Water Resource Values (WRVs) including:
a. Recreation in and on the water (62.40.473 (1) (a), FAC)
b. Fish and wildlife habitats and the passage of fish (62.40.473 (1) (b), FAC)
c. Estuarine resources (62.40.473 (1) (c), FAC)
d. Transfer of detrital material (62.40.473 (1) (d), FAC)
e. Maintenance of freshwater storage and supply (62.40.473 (1) (e), FAC)
f. Aesthetic and scenic attributes (62.40.473 (1) (f), FAC)
g. Filtration and absorption of nutrients and other pollutants (62.40.473 (1) (g), FAC)
h. Sediment loads (62.40.473 (1) (h), FAC)
i. Water quality (62.40.473 (1) (i), FAC)
j. Navigation (62.40.473 (1) (j), FAC)

WETLAND SOLUTIONS, INC.
ES-2
Several of the WRVs listed in Rule 62-40.473, FAC, are not relevant to the evaluation of MFs in Blue Spring and Blue Spring Run or were not considered in detail in this report for other reasons. For example, water flows in this system are expected to have negligible effects on downstream estuarine resources near the northern end of the St. Johns River (ECT, 2002) and navigation is not allowed in Blue Spring Run. For the purposes of this report, it was also assumed that proposed alternative water supply development (St. Johns River) will partially offset (reduce) direct aquifer withdrawals that might otherwise affect flows in Blue Spring. Therefore, the WRV requiring maintenance of freshwater storage and supply was not evaluated in this report. The 7 remaining WRVs were evaluated in this report.
The purpose of this report is to present an evaluation, within the constraints of existing data, concerning whether any of these WRVs will require MFs more stringent than those developed for protection of the Blue Spring manatee population. In some cases existing data are inadequate or of the wrong type to be used for full quantitative evaluation of the effects of MFs on these WRVs. In those cases, this report provides suggestions for additional data collection to more fully evaluate the most appropriate MFs necessary to protect each WRV identified by rule. A total of 46 individual, quantitative metrics are proposed for the evaluation of these 7 WRVs. This report also provides example methodologies for data analysis to allow detection of ecological changes compared to baseline conditions.
Rouhani et al. (2004) have recommended MFs for Blue Spring based on the criterion of providing winter manatee habitat during critical cold-weather periods and an expanding population of manatees utilizing Blue Spring. Their evaluation has determined the minimum useable warm-water habitat needed under a variety of combinations of extreme weather conditions and manatee population densities. A proposed flow regime was recommended that defines the minimum mean flow for five-year increments in a phased program of increasing minimum mean flows. The first increment calls for an allowable minimum mean flow reduction from 157 cfs to 130 cfs for the period from rule adoption to March 31, 2009. This allowable reduction represents a 17% decrease in the Blue Spring mean flow for a period of up to five years and should be the maximum level of change permitted in the rule. This permitted minimum mean flow would be raised during each of five subsequent five-year intervals to 133, 136, 140, 150, and finally 157 cfs (no allowable flow reduction). The authors suggest that the computational process used to define these allowable flow limits should be reassessed at least once every five years asthe manatee population continues to expand in the future.
Based on this review of existing and new information, all of the 7 WRV categories listed above are being realized at Blue Spring and Blue Spring Run. It was concluded that all of these ecological and human use WRVs have the potential to be affected by changes in spring flow. Some metrics are likely to decrease, others to increase, and some to remain unchanged in response to flows less than current levels. Metrics are also expected to have a wide range of sensitivities to the magnitude of flow changes.
However, it was also concluded that based on limited existing data and best professional judgment that all of these WRV metrics would likely be protected by the District’s proposed MFs for manatee protection. This conclusion is based on the observed range of

WETLAND SOLUTIONS, INC.
ES-3
variability of much of the existing environmental data collected from Blue Spring Run (coefficient of variation for water quality parameters from <1 to >200%) compared to the relatively smaller change in the proposed MF for the system (maximum permitted 17% average reduction).
This report recommends that a database of WRV metrics be assembled through continuing and expanded monitoring at Blue Spring and Blue Spring Run for the purpose of future re-evaluation of minimum flows. New monitoring efforts are recommended only for the purpose of defining existing data ranges. New long-term monitoring programs may be recommended after preliminary data are evaluated and the relevance of particular parameters to the protection of existing WRVs is verified.


WETLAND SOLUTIONS, INC.
i
Table of Contents Section Page
Executive Summary ....................................................................................................ES-1 Table of Contents.............................................................................................................. i List of Figures ................................................................................................................. iii List of Tables .................................................................................................................. iv List of Appendices .......................................................................................................... iv 1.0 Introduction....................................................................................................... 1-1
1.1 Background.................................................................................................... 1-1 1.2 District’s Recommended Minimum Flows for Blue Spring .......................... 1-2 1.3 Relevant Water Resource Values Considered and Metrics ........................... 1-2
2.0 Description of the Study Area, Existing Flows and Levels, and Conceptual Ecosystem Model........................................................................... 2-1
2.1 Site Location .................................................................................................. 2-1 2.2 Flow and Level Data...................................................................................... 2-1 2.3 Flow and Level under the District’s Recommended MF Regime ................. 2-8 2.4 Blue Spring/Blue Spring Run Conceptual Ecosystem Model ....................... 2-8
3.0 Environmental and Resource Evaluation.......................................................... 3-1 3.1 Introduction.................................................................................................... 3-1 3.2 Confirmation of Existing WRVs and Quantitative Metrics........................... 3-1
3.2.1 Inventory of Existing WRVs ................................................................ 3-1 3.2.2 Identify Appropriate Quantitative Metrics for Each WRV................... 3-2 3.2.3 Correlation Analysis of Effects of MFs on WRV Metrics ................... 3-2
3.3 Recreation In and On the Water..................................................................... 3-6 3.3.1 Introduction........................................................................................... 3-6 3.3.2 Recreational Human Use Metrics ......................................................... 3-6 3.3.3 Human Use at Blue Spring State Park .................................................. 3-7 3.3.4 Relationship between Recreational Human Uses and Spring
Flows..................................................................................................... 3-7 3.3.5 Summary ............................................................................................. 3-14
3.4 Fish and Wildlife Habitats and the Passage of Fish..................................... 3-14 3.4.1 Introduction......................................................................................... 3-14 3.4.2 Fish and Wildlife Habitats and Fish Passage Metrics......................... 3-15 3.4.3 Existing Blue Spring and Blue Spring Run Biological Data .............. 3-17 3.4.4 Fish Populations.................................................................................. 3-19 3.4.5 Manatees ............................................................................................. 3-23 3.4.6 Summary ............................................................................................. 3-30
3.5 Estuarine Resources ..................................................................................... 3-30 3.6 Transfer of Detrital Material........................................................................ 3-31 3.7 Maintenance of Freshwater Storage and Supply ......................................... 3-32 3.8 Aesthetic and Scenic Attributes ................................................................... 3-32 3.9 Filtration and Absorption of Nutrients and other Pollutants........................ 3-33
3.9.1 Introduction......................................................................................... 3-33 3.9.2 Filtration and Absorption of Nutrients and Other Pollutants
Metrics ................................................................................................ 3-34

WETLAND SOLUTIONS, INC.
ii
3.9.3 Estimated Existing Pollutant Assimilation Rates ............................... 3-34 3.9.4 Summary ............................................................................................. 3-35
3.10 Sediment Loads............................................................................................ 3-39 3.10.1 Introduction......................................................................................... 3-39 3.10.2 Sediment Load Metric......................................................................... 3-39 3.10.3 Estimated Existing Sediment Load Assimilation Rate ....................... 3-39 3.10.4 Summary ............................................................................................. 3-40
3.11 Water Quality............................................................................................... 3-40 3.11.1 Introduction......................................................................................... 3-40 3.11.2 Water Quality Metrics......................................................................... 3-41 3.11.3 Existing Water Quality Data............................................................... 3-42 3.11.4 Analysis of Possible Water Quality Changes as a Function of
Spring Flow and Stage ........................................................................ 3-46 3.11.5 Summary ............................................................................................. 3-49
3.12 Navigation.................................................................................................... 3-50 4.0 Summary, Conclusions, and Recommendations............................................... 4-1
4.1 Inventory of Existing Uses............................................................................. 4-1 4.2 Summary of Estimated Changes to Ecological and Human Use
Resource Values for Blue Spring and Blue Spring Run ................................ 4-1 4.3 Data Collection and Analysis Needs.............................................................. 4-4
5.0 References Cited ............................................................................................... 5-1

WETLAND SOLUTIONS, INC.
iii
List of Figures 2-1 Location Map of Blue Spring Run and Blue Spring State Park, Volusia County
2-2 Map of Blue Spring Run, Located in Blue Spring State Park, Volusia County
2-3a Blue Spring Stage / Discharge Time Series Plots
2-3b Blue Spring Estimated Nominal Hydraulic Residence Time (nHRT) and Velocity Time Series Plots
2-4 Blue Spring Discharge vs. Stage Relationship
2-5 Cumulative frequency curves for flow and stage in Blue Spring and Blue Spring Run based on the District’s recommended minimum flows and levels
2-6 Energy Symbols in the “Energese” Model Language
2-7 Conceptual Ecological Model for Blue Spring Run Illustrating All of the Ecological and Human Use Water Resource Values Described in the Report
3-1 Average Number of Overnight and Daily Visitors to Blue Spring Park, Volusia County
3-2 Blue Spring Monthly Number of Visitors vs. Average Monthly Flow
3-3 Blue Spring Monthly Number of Visitors vs. Average Monthly Air Temperature
3-4 Blue Spring Monthly Number of Visitors vs. Average Monthly Manatee Count
3-5 Blue Spring Average Fish Density Time Series Plots
3-6 Blue Spring Discharge and Average Fish Density Relationship (12/2000 - 3/2002)
3-7 Monthly Average Daily Total Number of Manatees Surveyed in Blue Spring, Volusia County, Florida
3-8 Blue Spring State Park Average Monthly Air Temperature vs. Average Monthly Manatee Count
3-9 Daily Average Number of Manatees Surveyed in Blue Spring, Volusia County, Florida
3-10 Blue Spring Average Monthly Discharge vs. Average Manatee Count
3-11 Land Use for the Blue Spring Watershed – 1995
3-12 Relationship between Blue Spring Discharge and Downstream Conductivity

WETLAND SOLUTIONS, INC.
iv
List of Tables 3-1 Existing Aquatic Uses Confirmed for Blue Spring and Blue Spring Run,
Volusia County, Florida
3-2 Recommended Blue Spring and Blue Spring Run Water Resource Value (WRV) Metrics and Methods of Quantification
3-3 Summary of Overnight and Daily Visitors to Blue Spring Park, Volusia County
3-4 Blue Spring Florida Department of Environmental Protection 'EcoSummary'
3-5 Blue Spring Average Fish Densities (#/m2) - Snorkel Count Method
3-6 Blue Spring Average Fish Densities (# m2) - Seine Method
3-7 Blue Spring Run, Volusia County - 1995 Watershed Land Use and Estimated Mass Loadings
3-8 Preliminary Estimates of Representative Pollutant Mass Assimilation Rates in Blue Spring
3-9 Historic Summary of Water Quality in Blue Spring and Blue Spring Run, Volusia County, Florida and Applicable Florida Class III Criteria
3-10 Blue Spring Dissolved Oxygen Statistics Collected During Stetson University Fish Survey
3-11 Blue Spring Run Water Quality Metrics and Correlation with Discharge
4-1 Estimated Effects of Reduced Flows on Blue Spring and Blue Spring Run Water Resource Value Metrics
List of Appendices Appendix A – Plant and Animal List for Blue Spring State Park
Appendix B – Scatter-Plots for Blue Spring Water Quality and Flows

WETLAND SOLUTIONS, INC.
1-1
1.0 Introduction
1.1 Background Blue Spring and Blue Spring Run in Volusia County, Florida are internationally famous as a winter refuge for the endangered West Indian manatee (Trichechus manatus latirostris), a large aquatic mammal that requires warmer water winter refuges to survive near the northern extreme of its range. Blue Spring is the only naturally occurring large manatee winter refuge on Florida’s east coast and specifically for the St. Johns River manatee population. Manatee use of Blue Spring Run as a warm-water refuge has increased since 1978, when routine manatee counts were begun in the spring run (Rouhani, et al., 2004). In addition to their importance to manatee populations, Blue Spring and Blue Spring Run provide numerous other environmental and societal functions including habitat for numerous other plant and animal species, water quality maintenance, and human recreation and nature study in Blue Spring State Park. Protection of these Water Resource Values (WRVs) from excessive reductions in water flows and levels is an important goal for the St. Johns River Water Management District (District).
To achieve this goal, the District is currently implementing the Minimum Flows and Levels (MFLs) program mandated by Florida law (Section 373.042, Florida Statutes [FS]). This statute requires that MFLs be established to prevent significant harm to water resources or ecology as a result of human consumptive uses. The MFLs Program establishes MFLs for surface water and ground water systems. The District’s typical approach to MFLs is to define the frequency and duration of high, average, and low water events necessary to prevent significant ecological harm to aquatic and wetland habitats. Once an MFL is established, the District may not issue a Consumptive Use Permitting (CUP) permit that would adversely impact the maintenance of surface or ground water levels or flows provided in such MFL. Accordingly, MFLs provide a basis for imposing limitations on withdrawals of groundwater and surface water and for imposing water shortage restrictions. The details of the MFLs Program are defined in Chapter 62-40.473 Florida Administrative Code (FAC) and Section 40C-8, FAC, and include potential WRVs, which must be considered in establishment of MFLs.
Due to the unique relationship between Blue Spring and Blue Spring Run, and the survival and expansion of the manatee population in Florida, proposed MFLs for this aquatic resource were determined to protect this one species (Rouhani, et al., 2004). Additionally, in accordance with Section 62-40.473, FAC, the following 10 WRVs must also be considered and protected when establishing MFLs:
a. Recreation in and on the water (62.40.473 (1) (a), FAC)
b. Fish and wildlife habitats and the passage of fish (62.40.473 (1) (b), FAC)
c. Estuarine resources (62.40.473 (1) (c), FAC)
d. Transfer of detrital material (62.40.473 (1) (d), FAC)
e. Maintenance of freshwater storage and supply (62.40.473 (1) (e), FAC)
f. Aesthetic and scenic attributes (62.40.473 (1) (f), FAC)

WETLAND SOLUTIONS, INC.
1-2
g. Filtration and absorption of nutrients and other pollutants (62.40.473 (1) (g), FAC)
h. Sediment loads (62.40.473 (1) (h), FAC)
i. Water quality (62.40.473 (1) (i), FAC)
j. Navigation (62.40.473 (1) (j), FAC)
Wetland Solutions, Inc. was contracted by the District to assess whether the District’s recommended minimum flow regime, based upon manatee habitat protection, will protect these WRVs.
1.2 District’s Recommended Minimum Flows for Blue Spring Rouhani et al. (2004) recommended minimum mean flows for Blue Spring based on the criterion of providing sufficient winter warm-water manatee habitat and to allow the continuing rate of expansion of the manatee population. This evaluation determined that under the current (linear) rate of expansion of manatee use, the minimum mean flow for Blue Spring could be reduced to 130 cfs for at least five years without creating harm to the existing manatee populations. This represents approximately a 17 % reduction in the existing mean annual spring flow. This permitted minimum mean flow would be raised during each of five subsequent five-year intervals to 133, 136, 140, 150, and finally 157 cfs (no allowable flow reduction). Rouhani et al. 2004 recommended that data collection and analysis continue, and that these recommended MFs be reassessed at least once every five years. The District has made no recommendations concerning minimum water levels required for Blue Spring Run because the St. Johns River largely controls these water levels. Thus the focus of this evaluation is the effect of the District’s proposed minimum flows (MFs) for Blue Spring on the other WRVs listed above.
1.3 Relevant Water Resource Values Considered and Metrics Several of the WRVs listed in Rule 62-40.473, FAC, were not considered relevant to the evaluation of MFLs in Blue Spring and Blue Spring Run or were not considered in detail in this report for other reasons. For example, water flows in this system are expected to have negligible effects on downstream estuarine resources near the northern end of the St. Johns River (ECT, 2002) and navigation is not allowed in Blue Spring Run. For the purposes of this report, it was also assumed that proposed alternative water supply development (St. Johns River) will partially offset (reduce) direct aquifer withdrawals that might otherwise affect flows in Blue Spring. Therefore, the WRV requiring maintenance of freshwater storage and supply was not evaluated in this report.
Metrics for quantification of each of the 7 remaining WRVs are proposed and methods are described for their evaluation. These quantitative metrics are based, where possible, on widely used standard methods. Only existing data collected for other purposes were available for this evaluation. Therefore, in some cases data from Blue Spring and Blue Spring Run are inadequate or of the wrong type to be used for full quantitative evaluation of the effects of MFs on WRVs. In those cases, this report provides preliminary conclusions concerning the effects of the District’s recommended MFs on the 7 WRVs and also recommends additional data collection necessary to allow a more complete evaluation in the future.

WETLAND SOLUTIONS, INC.
2-1
2.0 Description of the Study Area, Existing Flows and Levels, and Conceptual Ecosystem Model
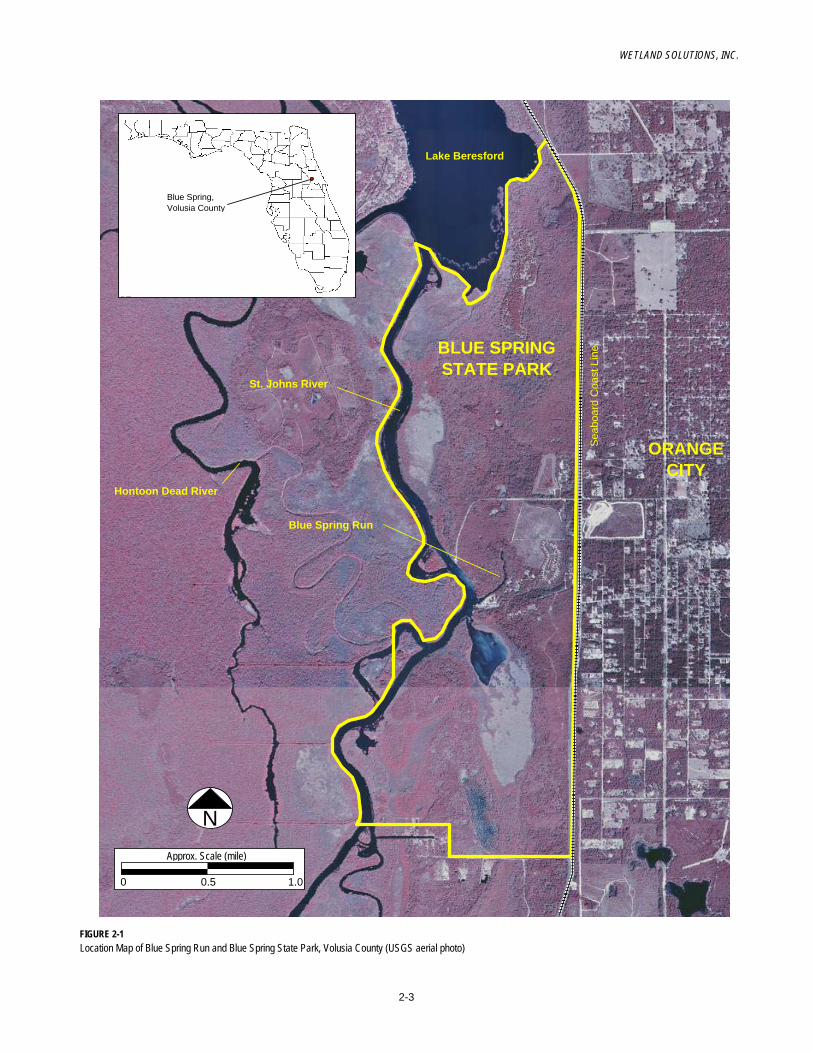
2.1 Site Location Blue Spring State Park is located in Volusia County, Florida, 2 miles west of Orange City and adjacent to the St. Johns River (Figure 2-1). Blue Spring State Park encompasses 2,483 acres (1,002 hectares) of land with a variety of habitats (FDEP, 1999), including Blue Spring and Blue Spring Run (Figure 2-2). The spring and run have an estimated area of 4.1 acres (1.7 hectares) and a length from the upper edge of the spring basin to the point of confluence with the St. Johns River of about 2,336 feet (712 m). Blue Spring and Blue Spring Run are classified as Class III waters by the State of Florida, indicating the following designated uses: “recreation, propagation and maintenance of a healthy, well-balanced population of fish and wildlife”. Blue Spring and Blue Spring Run also have special protection as “Outstanding Florida Waters” since they are located within a state park.
Water quality in Blue Spring and Blue Spring Run is characteristic of the Florida Aquifer, with high clarity, high dissolved solids, and low pollutant concentrations. Mean temperature in this spring flow is 23.2 oC and the temperature range is only from 21.5 to 24.5 oC at the downstream water quality station (Station 4 in Figure 2-2). Dissolved oxygen is typically quite low in Blue Spring (average 0.4 mg/L) and increases downstream in the run to an average of 1.4 mg/L. Specific conductance averages 1,685 µmhos/cm at the downstream station in the spring run. Color in the spring run is very low and averages 2.9 platinum cobalt units (PCU).
Where Blue Spring Run mixes with the St. Johns River, water clarity drops due to relatively high dissolved color in the river. Temperature and salinity gradients are likely to occur at the confluence of the spring run and the river. Mean temperature in the St. Johns River near Deland is more variable than in the spring run, with an average of 23.8 oC and a recorded range from 11.6 to 31.2 oC. Average dissolved oxygen levels are higher in the St. Johns River (5.7 mg/L) than in the spring run. Specific conductance is typically lower, with an average of 950 µmhos/cm at this station. Average color in the St. Johns River at Deland is 133 PCU with a range from 95 to 500 PCU.
Detailed water quality conditions in Blue Spring and Blue Spring Run are described below in Section 3.11.3 while water quality conditions in the adjacent St. Johns River are described in detail by ECT (2002).
2.2 Flow and Level Data Flow in Blue Spring and Blue Spring Run is largely controlled by the difference in stage between the Floridan aquifer and the level of water in the St. Johns River (Rouhani et al., 2004). Water levels in Blue Spring Run are primarily controlled by the level of water in the St. Johns River. For these reasons, only MFs are proposed for Blue Spring. Rouhani, et al. (2004), as well as previous efforts to define protective MFs for this aquatic resource, focused on the effects of decreased flows on winter manatee habitat protection.

WETLAND SOLUTIONS, INC.
2-2
Flow and level data for Blue Spring Run are summarized in Figure 2-3a for the period 1932 to 2000. These data are based on discreet water level records and a stage/discharge relationship for the spring run. Average flow over the period-of-record evaluated for this report was 381,666 m3/d (156 cfs). Minimum and maximum recorded flows were 154,134 and 533,354 m3/d (63 and 218 cfs), respectively. Average stage was 0.50 m above National Geodetic Vertical Datum 1929 (1.63 ft NGVD29). Minimum and maximum recorded stages were -0.12 and 1.99 m (-0.41 and 6.54 ft NGVD29), respectively.
Additional discharge data are available for the period from December 1998 to September 2000 (Dickerson, 2002). These continuous data are based on in-stream sensors that calculate flow based on current velocity. Based on this more limited dataset, the average flow over this shorter period-of-record was 325,394 m3/d (133 cfs), and minimum and maximum recorded flows were 181,047 and 491,762 m3/d (74 and 201 cfs), respectively.
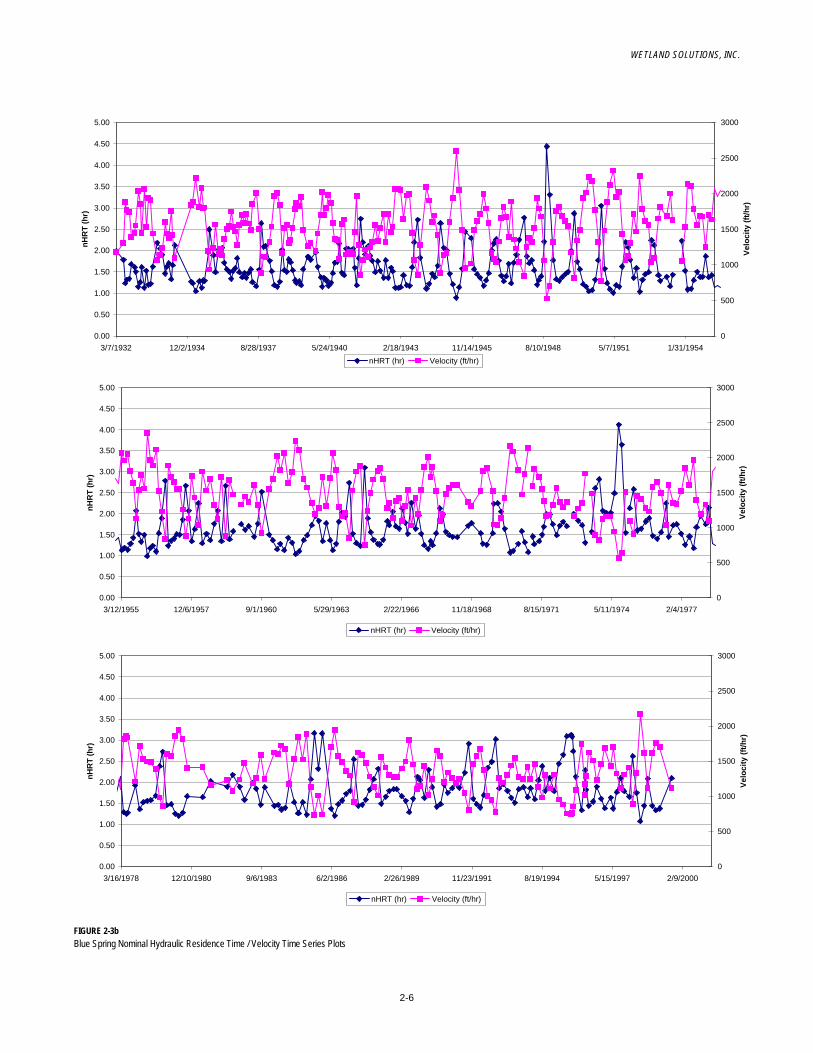
Hydraulic residence time (HRT) and mean flow velocity for Blue Spring Run were estimated based on limited bathymetric data (PBS&J, 1995) and a stage/volume relationship developed by the District (Sucsy et al.,1998). Bottom elevations measured along the centerline of the spring run ranged from -0.49 to -3.44 m (-1.6 to -11.3 ft NGVD29). Channel widths at the water surface ranged from about 18.3 to 38.1 m (60 to 125 ft). The estimated water volume in Blue Spring Run at average water stage was 27,000 m3 (952,000 cubic feet [cf]).
Figure 2-3b illustrates the time series estimates for HRT and velocity for Blue Spring Run. The estimated average HRT was 1.7 hrs with a range of 0.9 to 4.4 hrs. Estimated average velocity in the spring run was 0.12 m/s (0.41 ft/s) with a range from 0.045 to 0.22 m/s (0.15 to 0.72 ft/s).
Linear regression analysis showed no apparent relationship between water stage and spring discharge during this period (R2 = 0.005 in Figure 2-4). This analysis reconfirms the conclusion by Rouhani et al. (2004) that water stage in Blue Spring Run is not controlled by Blue Spring flow but rather by water levels in the contiguous reach of the St. Johns River.
WETLAND SOLUTIONS, INC.
FIGURE 2-1Location Map of Blue Spring Run and Blue Spring State Park, Volusia County (USGS aerial photo)
BLUE SPRINGSTATE PARK
Blue Spring,Volusia County
Blue Spring Run
N
0 0.5 1.0
Approx. Scale (mile)
Sea
boar
d C
oast
Lin
e
ORANGECITY
St. Johns River
Hontoon Dead River
Lake Beresford
2-3

WETLAND SOLUTIONS, INC.
FIGURE 2-2Map of Blue Spring Run, Located in Blue Spring State Park, Volusia County (base map from Sucsy, 2002)
1
2
3
4
5
1 - Spring Boil2 - Diver Entry3 - Stream4 - Swimming Area5 - Observation Platform
Water Quality Stations
2-4

WETLAND SOLUTIONS, INC.
FIGURE 2-3aBlue Spring Stage / Discharge Time Series Plots
-1
0
1
2
3
4
5
6
7
3/7/1932 12/2/1934 8/28/1937 5/24/1940 2/18/1943 11/14/1945 8/10/1948 5/7/1951 1/31/1954
Stag
e (ft
NG
VD29
)
50
70
90
110
130
150
170
190
210
230
Dis
char
ge (c
fs)
Stage (ft NGVD29) Discharge (cfs)
-1
0
1
2
3
4
5
6
7
3/12/1955 12/6/1957 9/1/1960 5/29/1963 2/22/1966 11/18/1968 8/15/1971 5/11/1974 2/4/1977
Stag
e (ft
NG
VD29
)
50
70
90
110
130
150
170
190
210
230
Dis
char
ge (c
fs)
Stage (ft NGVD29) Discharge (cfs)
-1
0
1
2
3
4
5
6
7
3/16/1978 12/10/1980 9/6/1983 6/2/1986 2/26/1989 11/23/1991 8/19/1994 5/15/1997 2/9/2000
Stag
e (ft
NG
VD29
)
50
70
90
110
130
150
170
190
210
230
Dis
char
ge (c
fs)
Stage (ft NGVD29) Discharge (cfs)
2-5
WETLAND SOLUTIONS, INC.
FIGURE 2-3bBlue Spring Nominal Hydraulic Residence Time / Velocity Time Series Plots
0.00
0.50
1.00
1.50
2.00
2.50
3.00
3.50
4.00
4.50
5.00
3/7/1932 12/2/1934 8/28/1937 5/24/1940 2/18/1943 11/14/1945 8/10/1948 5/7/1951 1/31/1954
nHR
T (h
r)
0
500
1000
1500
2000
2500
3000
Velo
city
(ft/h
r)
nHRT (hr) Velocity (ft/hr)
0.00
0.50
1.00
1.50
2.00
2.50
3.00
3.50
4.00
4.50
5.00
3/12/1955 12/6/1957 9/1/1960 5/29/1963 2/22/1966 11/18/1968 8/15/1971 5/11/1974 2/4/1977
nHR
T (h
r)
0
500
1000
1500
2000
2500
3000
Velo
city
(ft/h
r)
nHRT (hr) Velocity (ft/hr)
0.00
0.50
1.00
1.50
2.00
2.50
3.00
3.50
4.00
4.50
5.00
3/16/1978 12/10/1980 9/6/1983 6/2/1986 2/26/1989 11/23/1991 8/19/1994 5/15/1997 2/9/2000
nHR
T (h
r)
0
500
1000
1500
2000
2500
3000
Velo
city
(ft/h
r)
nHRT (hr) Velocity (ft/hr)
2-6

WETLAND SOLUTIONS, INC.
FIGURE 2-4Blue Spring Discharge vs. Stage Relationship
y = -1.0456x + 159.74R2 = 0.0048
0
50
100
150
200
250
-1 0 1 2 3 4 5 6 7
Stage (ft NGVD29)
Dis
char
ge (c
fs)
Source: USGS (1932-2000)
2-7
WETLAND SOLUTIONS, INC.
2-8
2.3 Flow and Level under the District’s Recommended MF Regime Figure 2-5 presents the existing flow and stage data for Blue Spring and Blue Spring Run in the form of probability distributions. Use of this figure allows estimation of flow and stage at any probability based on the existing period-of-record (about 70 years). The District’s recommended MF for Blue Spring and Blue Spring Run is 27 cfs less than the existing flow and is also illustrated in Figure 2-5. This is an assumed probability distribution of flows under the recommended MF regime allowed through 2009 and illustrates one possible distribution of future flows during the first phase of the proposed rule. This assumed distribution not only lowers the average flow by 27 cfs but also the minimum and maximum flows by the same amount.
The probability distribution of stages in Blue Spring and Blue Spring Run was not expected to measurably change under the District’s recommended MF. As noted earlier, there is no significant correlation between existing flow and stage data for Blue Spring and Blue Spring Run. A more complex model that relates spring stage and flow to the difference in elevation between the pieziometric aquifer level at Blue Spring and the level of water in the St. Johns River has not been prepared or calibrated. For the purposes of the current study, we have adopted the District’s assumption of no significant net change in stages in Blue Spring and Blue Spring Run as a result of the recommended MF.
2.4 Blue Spring/Blue Spring Run Conceptual Ecosystem Model An ecosystem model provides a tool for summarizing the most important components of the Blue Spring ecosystem (energy and matter storages) and their inter-relationships. Preparation of an ecosystem model allows definition of boundaries with external influences clearly identified as well as quantification of the internal energy and matter flows and their hypothesized interactions. A model can also be used to aggregate or expand the view of the system to help focus attention on an optimal level of detail to best answer a given question.
The Blue Spring Run Conceptual Ecosystem Model was prepared as a method for illustrating the most important interactions between the WRVs identified for this aquatic resource. The model presented in the “Energese” model language of Odum (see Figure 2-6 and Odum, 1983 for a description of symbols used in these models) does not need to be so complex that it becomes unwieldy for illustration purposes but must be complex enough to avoid omission of important ecosystem components.

WETLAND SOLUTIONS, INC.
FIGURE 2-5Cumulative frequency curves for stage and flow in Blue Spring and Blue Spring Run based on the District's recommended minimum flow and levels.
-1
0
1
2
3
4
5
6
7
8
9
0 0.1 0.2 0.3 0.4 0.5 0.6 0.7 0.8 0.9 1Fraction Less Than
Stag
e (ft
NG
VD29
)
0
50
100
150
200
250
Dis
char
ge (c
fs)
Stage (ft NGVD29)Discharge (cfs)Est. Discharge for Recommended MF
PORStage: 1932 - 2000Discharge: 1932 - 2001
Existing Discharge
Est. Discharge forRecommended MF through 2009
27 cfs
Existing Stage -No Change Anticipated
Minimum Mean Flow Regime to Increase to Existing Flow Regime by 2029
2-9

WETLAND SOLUTIONS, INC.
FIGURE 2-6Energy Symbols in the “Energese” Model Language
Source: Odum (1998)
2-10

WETLAND SOLUTIONS, INC.
2-11
With this balance between simplicity and complexity in mind, the following state variables and energy fluxes are illustrated in the Blue Spring Run Conceptual Ecosystem Model:
• External Forcing Functions
o Sunlight
o Rainfall with dissolved and particulate nutrients
o Groundwater inputs of water and dissolved nutrients
o Atmospheric gas connections
o Temperature
o Watershed interactions
o St. Johns River
o Human goods and services
• Downstream Exchanges
o Manatees moving in and out from the St. Johns River
o Fish, amphibians, reptiles, birds moving in and out from the St. Johns River and surrounding uplands
o Aesthetic benefits to humans both within and outside the aquatic environment
• Internal Storages
o Water
o Nutrients and suspended solids
o Detritus/microbes
o Periphyton/aquatic macrophytes
o Aquatic herbivores (other than manatees, such as mullet, tilapia, turtles, aquatic insects, etc.)
o Manatees
o Aquatic carnivores (catfish, bream, bass, aquatic insects, etc.)
o Aquatic top carnivores (e.g., alligators and otters)
o Humans and aesthetics

WETLAND SOLUTIONS, INC.
2-12
Figure 2-7 illustrates the conceptual ecological model for Blue Spring Run. Groups of state variables and energy flows representing each of the WRVs discussed in this report are circled with dashed lines. Temperature is shown as an important influence on manatee movements between the run and the St. Johns River, and has been described in detail by others (Rouhani et al., 2004). The model also shows the importance of the interaction between humans and the manatees and other wildlife in the spring run. The presence of the wildlife and the beauty of the spring and spring run (aesthetics) attract people to the park. These people spend money at the park that is used for a variety of activities that influence the ecology of the spring run (e.g., trails, boardwalks, picnic areas, parking lots, cabins, office staff, water and sewer systems, etc.).
Though the model is conceptual in nature, the magnitude of the state variables and most of the energy flows could be estimated if adequate quantitative data were available. This quantification would provide an additional basis for assessing the actual importance of the District’s recommended MFs on each of the WRVs that must be protected under Florida law. Preliminary monitoring needs to calibrate such a model for Blue Spring and Blue Spring Run are discussed in more detail below.

WETLAND SOLUTIONS, INC.
FIGURE 2-7Conceptual Ecological Model for Blue Spring Run Illustrating All of the Ecological and Human Use Water Resource Values Described in the Report
SUN
RAINN, P
AQUIFERN, P
AIRCO2, DO TEMP
WATER-SHED
TSS, N, P
GOODS & SERVICES
$
CO2, N, PDO
Fish, Turtles, Birds
Manatees
Human & Aesthetic Benefits
WaterNutrients
TSS
Periphyton/ Macrophytes
Detritus/Microbes
Carnivores
TopCarnivores
Manatees
Herbivores
Water QualityFiltration and Absorption of Nutrients and Other Pollutants Sediment Loads and Detrital Transport
Aesthetic and Recreational Human Uses
Fish and Wildlife Habitat and Fish Passage
Humans & Aesthetics
St. JohnsRiver
2-13

WETLAND SOLUTIONS, INC.
3-1
3.0 Environmental and Resource Evaluation
3.1 Introduction Not all aquatic habitats provide all possible environmental functions or WRVs. For example, many aquatic areas do not provide useable habitat for manatees, some are not used by humans for recreation, etc. An important step in the process of evaluating whether the MFs established for manatee habitat protection will protect the WRVs of Blue Spring and Blue Spring Run was to confirm what values should be evaluated.
Following confirmation of existing uses, a list of possible metrics was prepared for each of the identified WRVs. Metrics were selected based on their relevance for estimating impacts due to flow reductions and their ease of measurement.
The third step in this analysis consisted of a search of existing information relevant to the confirmed WRVs and the selected metrics for Blue Spring and Blue Spring Run. For those metrics with available data, preliminary analyses were conducted to determine if there might be measurable effects of spring flows on the particular WRV. These preliminary analyses consisted of quantification of the metric and correlation analysis with spring flows. The conceptual spring model described above was used to illustrate the most likely linkages between each WRV and spring flows as a method for suggesting additional analyses, assuming more complete data become available.
This report section provides estimates of the possible effects of the District’s recommended MFs for Blue Spring on each of the relevant WRVs . These estimates are made on the basis of the identified metrics and quantifiable data, when available. In those cases where data are insufficient to provide a quantitative assessment, professional judgment is the basis of the estimate and additional data needs are identified.
3.2 Confirmation of Existing WRVs and Quantitative Metrics
3.2.1 Inventory of Existing WRVs Existing WRVs were inventoried for Blue Spring and Blue Spring Run using the following methods:
• Field trip to project site (February 26, 2002)
o Visit and interview site managers
o View public use areas
o Reconnaissance of project area (canoeing and snorkeling)
o Field water quality measurements (representative vertical and upstream/downstream profiles of temperature, dissolved oxygen, conductivity, pH, and depth)
• Interview off-site resource managers
o SJRWMD
o Florida Fish and Wildlife Conservation Commission

WETLAND SOLUTIONS, INC.
3-2
o FDEP
o Local governments (Volusia County Environmental Health Department)
• Collect and review existing information on Blue Spring and Blue Spring Run WRVs
o Published and unpublished reports/articles/maps
o Water resource data
o Water quality data
o Aerial photographs
Seven of the 10 WRVs described in Section 62-40.473, FAC were found relevant for Blue Spring and Blue Spring Run as listed in Table 3-1 and described below.
3.2.2 Identify Appropriate Quantitative Metrics for Each WRV Whenever possible, standardized, reproducible methods should be used to quantify existing WRVs. The first step in the quantification process is to identify appropriate sampling methods for each metric. The next step is to ascertain if data have previously been collected for each metric. In many cases, these specific data are not available. In those instances, it is sometimes possible to look at other related data sets to infer or estimate what the quantitative WRVs may be. In all cases where the necessary data are not available, specific recommendations are made for additional data gathering activities. While there are many possible parameters that could be measured, a focused suite of metrics is recommended that may best define the effects of MFs on each WRV (Table 3-2). This section identifies and describes the proposed representative ecological and human use WRV metrics and summarizes current knowledge about their magnitudes.
3.2.3 Correlation Analysis of Effects of MFs on WRV Metrics The Blue Spring/Blue Spring Run ecosystem is so complex that it cannot be easily visualized. Relationships between specific WRV metrics and the flow rate of Blue Spring may be direct and indirect at the same time, and both positive and negative effects of flow on a single metric are possible. Correlation analysis provides a starting point to look for positive and negative interactions between WRV metrics and spring flows. However, correlation analysis alone typically does not confirm a cause-and-effect relationship (McBride et al., 1993). Therefore, a more detailed flow chart of possible cause and effect relationships must be developed to go beyond the preliminary examination of effects of MFs on the WRV metrics described in this report. A useful method for organizing information related to the processes affecting each metric is the development of a conceptual ecosystem model described above.

WETLAND SOLUTIONS, INC.
TABLE 3-1Existing Aquatic Uses Confirmed for Blue Spring and Blue Spring Run, Volusia County, Florida
Water Resource Value Subcategory Basis for Confirmation of UseRecreation in and On the Water Swimming Swimming and scuba diving are established uses at Blue Spring Run and
were observed during the field visit.Boating No public boating is allowed in the spring run. Canoes are used in the spring
run for manatee counts.Education Public schools bring a large number of students to Blue Spring State Park
for educational activities. Activities observed during the site visit included environmental studies about the formation and ecology of the spring boil and spring run.
Fishing Fishing is an allowed use at the fishing pier located near the mouth of the spring run.
WildlifeObservation
Wildlife observation (manatees, birds, fish, etc.) is a primary human use at Blue Spring State Park.
Fish and Wildlife Habitat and Fish Passage
Fish During the site visit and in published reports, it was observed that fish only utilize the lower reach of Blue Spring Run and have very limited populations in the area of the head spring. This usage pattern is related to low dissolved oxygen concentrations in the ground water as it emerges in the spring boil, and increasing levels with distance downstream.
Reptiles Turtles were observed during the site visit and are commonly reported in wildlife inventories of the spring and spring run. Alligators have also been reported from the spring and spring run.
Amphibians Frogs were observed during the site visit and are commonly reported in wildlife inventories of the spring and spring run.
Birds Piscivorous birds (anhinga, cormorant, egrets, etc.) were observed during the site visit. Many other wetland-dependent birds have been reported.
Mammals Manatees were observed during the site visit. Otters have been reported for the spring and spring run and other wetland-dependent mammals have also been reported.
Transfer of Detrital Material Organic solids It was observed during the field visit that the spring and spring run are almost entirely covered by forest canopy. This canopy as well as runoff from the upland areas adjacent to the spring and spring run deposit organic solids into the aquatic ecosystem.
Aesthetics and Scenic Attributes Aesthetics Aesthetics are the principal goal of most of the wildlife and nature-viewing activities.
Filtration and Absorption of Nutrients BOD and Other Pollutants TSS
NitrogenPhosphorusTrace metalsTrace organics
Sediment Loads Mineral solids Bank erosion around the head spring was observed during the site visit. This material was likely deposited within the spring run.
Water Quality All parameters Water quality maintenance is an integral function of all aquatic ecosystems.
Assimilation of these constituents, when present above ambient levels, is an intrinsic property of all aquatic ecosystems.
3-3

WETLAND SOLUTIONS, INC.
TABLE 3-2Recommended Blue Spring and Blue Spring Run Water Resource Value (WRV) Metrics and Methods of Quantification
Water Resource Value
Water Resource Value Metric
Code Metric Units1 Description1.1 total human use HUD gate records1.2 manatee watching HUD monthly direct counts and exit survey1.3 fishing HUD monthly direct counts and exit survey1.4 snorkeling/scuba diving HUD monthly direct counts and exit survey1.5 park fees $ daily record2.1 periphyton biomass and productivity g/m2 and g/m2/yr seasonal biomass sampling2.2 aquatic macrophyte biomass and productivity g/m2 and g/m2/yr seasonal biomass sampling2.3 snail biomass and productivity g/m2 and g/m2/yr seasonal counts2.4 benthic insect biomass and productivity g/m2 and g/m2/yr seasonal counts2.5 striped mullet biomass and productivity g/m2 and g/m2/yr seasonal counts2.6 turtle biomass and productivity g/m2 and g/m2/yr seasonal counts2.7 mosquitofish biomass and productivity g/m2 and g/m2/yr seasonal counts2.8 sunfish biomass and productivity g/m2 and g/m2/yr seasonal counts2.9 river otter biomass and productivity g/m2 and g/m2/yr seasonal counts
2.10 double-crested cormorant biomass and productivity g/m2 and g/m2/yr seasonal counts2.11 gross primary productivity g/m2/yr hourly upstream/downstream dissolved oxygen sampling2.12 net primary productivity g/m2/yr hourly upstream/downstream dissolved oxygen sampling2.13 community respiration g/m2/yr hourly upstream/downstream dissolved oxygen sampling2.14 P/R ratio unitless hourly upstream/downstream dissolved oxygen sampling
Transfer of Detrital Material 3.1 volatile suspended solids load reduction g/m2/yr upstream/downstream change in mass
Aesthetic and Scenic Attributes 4.1 aesthetic and scenic survey unitless monthly exit survey
5.1 total ammonia N load reduction g/m2/yr upstream/downstream change in mass5.2 nitrate + nitrite N load reduction g/m2/yr upstream/downstream change in mass5.3 organic N load reduction g/m2/yr upstream/downstream change in mass5.4 total N load reduction g/m2/yr upstream/downstream change in mass5.5 ortho P load reduction g/m2/yr upstream/downstream change in mass5.6 total P load reduction g/m2/yr upstream/downstream change in mass5.7 total copper load reduction g/m2/yr upstream/downstream change in mass5.8 total iron load reduction g/m2/yr upstream/downstream change in mass5.9 total zinc load reduction g/m2/yr upstream/downstream change in mass
Sediment Loads 6.1 non-volatile suspended solids load reduction g/m2/yr upstream/downstream change in mass
Recreation In and On the Water
Fish and Wildlife Habitats and the Passage of Fish
Filtration and Absorption of
Nutrients and Other Pollutants
3-4

WETLAND SOLUTIONS, INC.
TABLE 3-2Recommended Blue Spring and Blue Spring Run Water Resource Value (WRV) Metrics and Methods of Quantification
Water Resource Value
Water Resource Value Metric
Code Metric Units1 DescriptionWater Quality 7.1 water temperature oC measured at downstream station
7.2 dissolved oxygen mg/L measured at downstream station7.3 conductivity umhos/cm measured at downstream station7.4 pH s.u. measured at downstream station7.5 hardness mg/L as CaCO3 measured at downstream station7.6 turbidity NTU measured at downstream station7.7 total ammonia N mg/L measured at downstream station7.8 nitrate + nitritie N mg/L measured at downstream station7.9 organic N mg/L measured at downstream station
7.10 total N mg/L measured at downstream station7.11 ortho P mg/L measured at downstream station7.12 total P mg/L measured at downstream station7.13 total copper mg/L measured at downstream station7.14 total iron mg/L measured at downstream station7.15 total zinc mg/L measured at downstream station
1s.u - standard units, PCU - platinum cobalt units, NTU - nephelometer turbidity units, HUD - human use days
3-5
WETLAND SOLUTIONS, INC.
3-6
3.3 Recreation In and On the Water
3.3.1 Introduction State parks are a focal point for recreation. Parks with aquatic features such as spring boils, clear spring runs, mixed deciduous forest, and access to large rivers such as the St. Johns, are very attractive to humans for a variety of recreational activities and for their aesthetic attributes. Addition of the opportunity to watch West Indian manatees to this mix of natural features makes Blue Spring State Park especially attractive for scenic and active recreational uses.
Typical recreational uses focused on aquatic resources (other than aesthetic attributes described below in Section 3.8) include: swimming, fishing, education, canoeing, kayaking, bird watching, manatee watching, snorkeling, scuba diving, boating, water skiing, use of personal water craft, etc. These activities can be directly quantified through activity counts and through measurement of associated economic expenditures.
Due to widespread trends of increasing human populations in Florida, recreational use of Blue Spring State Park can be expected to increase with time. Temporal changes in recreational uses should be viewed within the perspective of this underlying population increase, and human use data can be normalized by dividing by the total human population to help correct for this possible bias.
Changes in flows and levels in an aquatic system can result in changes in recreational uses. For example, spring flows have declined in some areas due to natural and anthropogenic changes in aquifer levels (Florida Springs Task Force, 2000), resulting in degraded water clarity and higher water temperatures, and declines in human uses. Consequently, it is assumed that quantification of the human recreational use WRV requires an historic perspective, as well as an understanding of the baseline human population.
The Blue Spring conceptual ecosystem model (Figure 2-7) simplifies the human interactions with Blue Spring Run as additional pollutant loads entering the water column from the import of Goods and Services. This lumped category of external inputs includes building and landscaping materials (including fill, gravel, limerock, fertilizers, lumber, concrete, etc.), people and their accoutrements (sunscreen, bandaids, hair, candy wrappers, etc.), and vehicles and their discharges of oil and exhaust. The system exports aesthetic benefits (no measurable energy content) in the form of memories and word-of-mouth advice to friends to visit the park. Money is shown running counter-current to the import of Goods and Services and the export of Aesthetic Benefits.
3.3.2 Recreational Human Use Metrics Human recreational uses are some of the easiest functions to quantify. Aesthetic values are more difficult to measure accurately. Possible units for quantifying human uses are the Human Use Day (HUD), which refers to any daily use of a resource by a human regardless of how much time is spent during the day, and dollars ($) spent on or for the activity.
WETLAND SOLUTIONS, INC.
3-7
Five recommended human use metrics are listed in Table 3-2. These include the following metrics:
• Human-use days (HUDs) by category:
o Total human use
o Manatee watching
o Swimming/Snorkeling/Scuba diving
o Fishing
• Economic benefits ($/day)
o Park fees
Measurement of these metrics can be made through direct observation, interviews with users, or by counts and exit surveys.
3.3.3 Human Use at Blue Spring State Park The only human use data obtained for Blue Spring State Park was the total number of visitors per day and the number of overnight visitors (Table 3-3). The number of people visiting the park averaged 879 per day (802 day visitors and 77 overnight visitors) and has ranged from 0 to 5,563 per day over the 12-year period of data collection (1990 to 2002) (Webb, 2002). Human use is seasonal with two apparent peaks of activity (Figure 3-1): the colder winter months during high periods of manatee use of the spring run (especially over Thanksgiving and Christmas holidays) and the early summer period when the spring and adjacent river are most popular for swimming and boating activities.
Bonn and Bell (2003) prepared a detailed economic assessment of four Florida state parks with major artesian springs. Volusia Blue Spring was one of the systems evaluated by user surveys in late 2002. In fiscal year 2002 there were 337,356 visitors to the park. About 65% of these individuals were estimated to be from outside of Volusia County. These tourists injected money into the local economy as a result of day use fees and food costs as well as in money spent for over-night accommodations. Average daily spending at Blue Spring State Park was $19/person for a total estimated annual spending rate of about $10 million. This level of spending generated an estimated $2.4 million in wages and 174 local jobs. The authors made no quantitative estimates of the relationship between economic impact and spring flows. However, they did note that flows have been declining in Blue Spring since the mid-1980’s and that this flow reduction “threatens the future of Blue Spring as a manatee refuge and recreation area” (Bonn and Bell 2003, p. 70). The authors also note that increased nitrates in the spring discharge “… increase the growth of algae and lead to ecological decline” and state that recreational visitors to Blue Spring will be deterred due to diminished water quality and appearance of the ecosystem.
3.3.4 Relationship between Recreational Human Uses and Spring Flows
Average monthly human use at Blue Spring State park is not significantly correlated with spring discharge within the range of existing data (Figure 3-2). Human use is correlated with average air temperature (Figure 3-3), with greatest park use at the lowest

WETLAND SOLUTIONS, INC.
3-8
temperatures. This is likely a response to the main attraction of the park – namely manatee watching during the winter months. There is a positive correlation between average manatee use and average human use of the park (Figure 3-4). Since overall human use of the park is tied to manatee use and manatee use is dependent upon spring flows (Rouhani et al., 2004), then human use is indirectly tied to spring flow. Based on the District’s recommended MF that will protect continuing expansion of the park’s manatee population, it can be deduced that overall human use of the park will also be protected.

WETLAND SOLUTIONS, INC.
TABLE 3-3
Statistics
OvernightVisitors
(#)
DayVisitors
(#)Total(#)
Average 77 802 879Median 59 636 721Maximum 332 5,497 5,563Minimum 0 0 0Std Dev 59 618 639Count 4,501 4,501 4,501Std Err 0.88 9.21 9.52Period of Record: 1/1/90 - 4/28/02Source: Webb 2002
Summary of Overnight and Daily Visitors to Blue Spring Park, Volusia County
3-9

WETLAND SOLUTIONS, INC.
FIGURE 3-1Average Number of Overnight and Daily Visitors to Blue Spring Park, Volusia County (January 1, 1990 - April 28, 2002)
0
500
1000
1500
2000
2500
3000
Jan-1 Feb-20 Apr-11 May-31 Jul-20 Sep-8 Oct-28 Dec-17
Julian Day
Ave
rage
Num
ber o
f Vis
itors
(#/d
ay)
Overnight VisitorsDaily Visitors
3-10

WETLAND SOLUTIONS, INC.
FIGURE 3-2Blue Spring Monthly Number of Visitors vs. Average Monthly Flow
y = 41.617x + 21246R2 = 0.0039
0
10000
20000
30000
40000
50000
60000
70000
80000
90 110 130 150 170 190 210 230
Average Monthly Flow (cfs)
Mon
thly
Num
ber o
f Vis
itors
(#/m
onth
)
Period of Record: 1990 - 2001
3-11

WETLAND SOLUTIONS, INC.
FIGURE 3-3Blue Spring Monthly Number of Visitors vs. Average Monthly Air Temperature
y = -1018.1x + 97955R2 = 0.4186
0
10000
20000
30000
40000
50000
60000
70000
80000
50 55 60 65 70 75 80 85 90
Average Monthly Air Temperature (F)
Mon
thly
Num
ber o
f Vis
itors
(#/m
onth
)
Period of Record: 1994 - 2002
3-12

WETLAND SOLUTIONS, INC.
FIGURE 3-4Blue Spring Monthly Number of Visitors vs. Average Monthly Manatee Count
y = 435.44x + 22463R2 = 0.2742
0
10000
20000
30000
40000
50000
60000
70000
80000
0 10 20 30 40 50 60 70
Average Monthly Manatees (#/d)
Mon
thly
Num
ber o
f Vis
itors
(#/m
onth
)
Period of Record: 1990 - 2002
3-13

WETLAND SOLUTIONS, INC.
3-14
Other human uses are also likely to be correlated with flows but there are no quantitative data available to define this relationship. For example, it is intuitive that scuba diving, snorkeling, and swimming are tied to the clarity and temperature of the water, which may be affected by reduced spring flow. However, within the range of the proposed maximum average flow reduction of 17 percent, it is considered to be unlikely that water clarity or temperature will vary enough to result in a reduced use of the spring and spring run for these water-dependent recreational uses. This conclusion is based on the observation that swimming and scuba diving are limited to the middle and upper reaches of the spring and spring run, above the area possibly affected by intrusions of colored or colder waters from the St. Johns River.
Since no change in the stage of Blue Spring or Blue Spring Run is anticipated based on the District’s recommended MF regime, there is no anticipated effect of stage on any human uses at Blue Spring State Park.
3.3.5 Summary Based on the available information, it is concluded that the District’s recommended minimum flow that will protect manatee use at Blue Spring and Blue Spring Run will also protect recreation in and on the water. This conclusion is based on the observed indirect relationship between manatee and human use at Blue Spring State Park. Actual quantitative data to assess the effects of MFs on other human uses such as swimming and scuba diving are not available. Monitoring of these human uses is recommended to better assess the effects of spring flows on these water contact recreational uses. However, based on the magnitude of the recommended flow reduction, and the dominant effect of river stage on water levels and depth in Blue Spring Run (Sucsy et al., 1998), it is considered unlikely that the extent of these water-contact activities will be measurably affected.
3.4 Fish and Wildlife Habitats and the Passage of Fish
3.4.1 Introduction Aquatic ecosystems provide critical habitat for a variety of animals, including larger organisms such as fish and other wildlife species. Major faunal groups of interest in the category of fish and wildlife include: fish, reptiles, amphibians, birds, and mammals. Aquatic ecosystems such as Blue Spring and Blue Spring Run provide habitat for many aquatic and terrestrial animal species. Some of the animals are obligate aquatic species (e.g., fish, turtles, and manatees) while others only use the aquatic system as one component of an upland-aquatic habitat continuum. For example, fish-eating birds are absolutely dependent upon the production of fish, while many passerine birds, such as cardinals and warblers, are indirectly dependent upon the aquatic resource for certain food and prey organisms and for drinking and bathing.
The Blue Spring conceptual ecosystem model (Figure 2-7) lumps this WRV into a number of trophic levels including Periphyton/Macrophytes, Detritus/Microbes, Herbivores, Carnivores, Manatees, and Top Carnivores. These living components of Blue Spring and Blue Spring Run form a food web of linkages of energy and matter flows. Many of these organisms interact with adjacent ecosystems, including the uplands in

WETLAND SOLUTIONS, INC.
3-15
Blue Spring State park and the adjacent St. Johns River and associated floodplain. Every one of the many thousands of species combined in these few model symbols has life history requirements of similar complexity to the manatee. All of them are to some extent dependent upon flows and water levels in Blue Spring.
Aquatic wildlife habitat is a function of the volume and areal extent of the aquatic resource. Decreased flows may result in a reduction in the amount or a change in the value of wildlife habitat. Effects of flow reductions on wildlife may be direct and/or indirect.
Fish and wildlife habitat must also be estimated within an “historic” context. Habitat functions vary from year to year due to natural conditions. They may also be expanded or contracted due to human activities. A loss of habitat resources for one species is generally an increase in habitat for some other species. Changes in habitat resources should generally be evaluated within the context of historical variations and should include quantification of both beneficial and detrimental effects for the whole ecosystem. However, where habitat for an endangered or threatened species is concerned, a more narrow perspective may be appropriate.
Limited historical data exists on fish and wildlife populations in Blue Spring and Blue Spring Run. The Florida Department of Environmental Protection (FDEP) has initiated more extensive monitoring of some animal populations (snails) in Blue Spring Run. It is recommended that preliminary monitoring be conducted for the metrics listed in Table 3-2 to quantitatively assess fish and wildlife populations at Blue Spring and to serve as a baseline for comparison of future conditions.
3.4.2 Fish and Wildlife Habitats and Fish Passage Metrics Fish and wildlife habitat resources can be assessed at the species population level or at the ecosystem level. Population metrics include total population density and living biomass by species and the rate of change of these individual populations (secondary productivity). However, there are too many species to effectively track them all. The single most important species, in terms of public recognition, is the manatee, which is being assessed in a related effort (Rouhani, et al., 2004). Additional focused interest is centered on two species of endemic operculate snails that inhabit Blue Spring Run, the Blue Spring hydrobe (Aphaostracon asthenes) and the Blue Spring siltsnail (Cincinnatia parva) (FDEP, 1999). A parallel work effort is determining whether the District’s recommended MFs for manatees will be protective of the populations of these endemic snails.
A total of 14 possible metrics are recommended for this WRV (Table 3-2). Of the many possible plant and animal species other than manatees, the following species are considered representative of the spring’s major trophic levels and are recommended for preliminary assessments:
• Primary Producers
o Periphyton
o Aquatic macrophytes

WETLAND SOLUTIONS, INC.
3-16
• Herbivores
o Snails
o Benthic insects
o Mullet
o Turtles
• Primary Consumers
o Mosquitofish
o Sunfish
• Secondary Consumers
o River otter
o Double-crested cormorant
Qualitative evaluation of the continuing presence or absence for these species can provide a preliminary indication of major ecosystem changes. However, quantitative metrics are essential to detect trends and to react in time to avert species extirpation. Possible quantitative measures for each of these metrics are: the average annual population density expressed as areal biomass (grams dry weight per square meter – g dw/m2) and the net secondary productivity (g dw/m2/yr). Biomass estimates for periphyton, plants, and macroinvertebrates would be based on field sampling using cores or grid devices. Biomass estimates for the larger faunal species (fish, reptiles, amphibians, birds, and mammals) would be based on counted numbers of individuals in the whole spring run and published live body weights. Length:weight relationships can be used where available from the literature to improve biomass estimates. Net secondary productivity can be estimated as the change in biomass for each species from season to season or from year to year. If available, these biomass and secondary productivity measures can be evaluated to determine if they are correlated to spring flows. Limited resources for monitoring dictate that following preliminary, range-finding monitoring efforts, a few key species can be used for continuing assessments.
There are fewer ecosystem-level measurements and, therefore, data collection may be more affordable. On the other hand, interpretation of ecosystem data is more difficult because the resource manager does not always know what portion of the observed ecological function should be assigned to which part of the ecosystem. Representative ecosystem measurements that could be applicable to Blue Spring include:
• Ecosystem Metabolism
o Gross primary productivity
o Net primary productivity
o Community respiration
o Primary productivity to respiration ratio (P/R ratio)

WETLAND SOLUTIONS, INC.
3-17
All of these possible metrics can be measured within Blue Spring Run. For example, ecosystem metabolism can be measured using upstream/downstream dissolved oxygen and percent saturation data collected hourly over a 24-hour period (Odum, 1957; Knight, 1980). Upstream water quality would be measured in the spring boil and downstream water quality would be measured above any influence of the St. Johns River incursions. Previous work has shown that assumptions concerning near steady-state conditions at the spring boil inflow are met in large springs and that upstream-downstream water quality changes reflect the net effect of all of the production and removal processes occurring in the aquatic ecosystem. This metabolism can be fractionated into gross primary productivity and community respiration by analyzing daylight and nighttime data patterns. The P/R ratio provides a convenient index of the autotrophic/heterotrophic nature of the spring run.
3.4.3 Existing Blue Spring and Blue Spring Run Biological Data Quantitative biological data are summarized for benthic macroinvertebrates, fish, and manatee populations at Blue Spring Run. Qualitative data are available for snails, turtles, and birds.
Table 3-4 summarizes results from an “EcoSummary” for Blue Spring prepared by FDEP (Bennett, 2002; http://www.floridadep.org/labs/reports/spring.htm). FDEP conducted field sampling on four dates in 2000 and 2001. Slightly different measurements were made on each sampling trip. The Stream Condition Index (SCI) ranged from 15 to 17. The SCI is a composite macroinverterbrate metric for use in Florida flowing streams (see Barbour et al. 1996 for a description of the components and development of the SCI). SCI values in this range are considered “Poor.” Low values of the SCI are typically found in aquatic systems with low dissolved oxygen concentrations. Therefore, since dissolved oxygen is low in Blue Spring due to natural conditions, the low SCI for this site is probably a natural condition and not related to human influences. Eighteen (18) macroinvertebrate taxa were recorded during each of the three events when measurements were made. A large portion of this macroinvertebrate population was comprised of organisms tolerant of low-dissolved oxygen concentrations (e.g., chironomids).
From 28 to 29 algal taxa were recorded in the FDEP sampling and most of these species were diatoms (Table 3-4).
As shown in the water quality section below (Section 3.11), bacteriological sampling in Blue Spring Run has indicated the periodic presence of fecal coliforms at the swim area (average fecal coliforms were 13.4 and total coliforms were 47 col/100 ml). Bacteria populations recorded by FDEP (Table 3-4) were similar. These coliform populations are relatively low compared to most natural waters (FDEP, 1989) and may be derived from either natural or human sources, or both.

WETLAND SOLUTIONS, INC.
TABLE 3-4Blue Spring Florida Department of Environmental Protection 'EcoSummary'
Oct-00 Mar-01 Oct-01 Nov-01
Stream Condition Index (SCI) 15 17 15 ---SCI Evaluation poor poor poor ---SCI Region peninsula peninsula peninsula ---Number of Individuals --- --- 104 ---Number of Taxa 18 18 18 ---Number of Ephemeroptera 0 0 1 ---Number of Plecoptera 0 0 0 ---Number of Trichoptera 0 0 0 ---EPT Index 0 0 1 ---
Dominant Taxon --- --- Pyrgophorusplatyrachis ---
% Dominant Taxon 27.01 27.11 26.92 ---Florida Index 1 4 0 --- % Diptera 15.33 31.93 25.96 ---Number of Chironomidae 1 1 3 ---Number of Orthocladiinae 3 4 --- ---Total Number of Chironomidae 4 5 --- ---% Filter-Feeders 2.92 1.81 0 ---
Number of Individuals --- --- 411 689Number of Taxa 28 29 --- ---Dominant Taxon --- ---% Bacillariophyceae 94.16 93.38 63.5 74.17% Chlorophyceae 0.94 0.92 34.31 25.25% Cyanophyceae 4.9 5.7 2.19 0.58% Dinophyceae 0 --- --- ---% Dominant Taxon 38.23 17.65 22.38 28.16
Enterococci (col/100 mL) 26 20 --- 40Escherichia coli (col/100 mL) 2 4 --- 8Fecal Coliforms (col/100 mL) 10 1 --- 2Total Coliforms (col/100 mL) 40 10 --- 2
Habitat Assessment 111 89 --- ---Sample Depth (m) 0.8 0.4 --- ---Specific Conductivity (umho/cm) 198 2019 --- 1365Dissolved Oxygen (mg/L) 2.3 2.2 --- 1.5pH (SU) 7.6 7.5 --- 6.4Temperature (deg. C) 22.8 23 --- 22.9
Ammonia (mg/L) 0.093 --- --- 0.01Nitrate-Nitrite (mg/L) 0.11 --- --- 0.64TKN (mg/L) 0.3 --- --- 0.14Total Phosphorus (mg/L) 0.093 --- --- 0.069Color (PCU) 5 --- --- ---Turbidity (NTU) 0.15 --- --- 0.1*Bacteria samples were all outside of holding time (October, March 2001)Source: (Bennett 2002)
Physical-Chemical Data
Chemistry Data
Fragilariaceae
Macroinvertebrate Parameters
Periphyton Parameters
Bacteria Parameters*
3-18

WETLAND SOLUTIONS, INC.
3-19
No quantitative data were located for populations of amphibians, reptiles, or birds in and around Blue Spring Run. However, FDEP has prepared a qualitative list of species observed in the spring (see Appendix A from FDEP, 1999). This list includes the following species totals:
• Mollusks 2
• Fish 34
• Amphibians 8
• Turtles 12
• Snakes 6
• Birds 56
• Mammals 2
Population levels for most of these faunal groups are expected to vary over a fairly wide range due to seasonal and annual climatic events. Thus the average flow reduction recommended by the District is not expected to be great enough to result in a measurable (statistically detectable) change in the population of any of these organisms. This tentative conclusion must be supported by additional data collection and analysis of key taxonomic groups. Since no stage change is anticipated, there is not expected to be any affect of water depth on any of these populations as a result of the District’s recommended MF regime.
3.4.4 Fish Populations Fish populations in Blue Spring Run have been surveyed on 26 occasions by researchers from Stetson University (Work, 2002). Quantitative fish data from Blue Spring are provided in Tables 3-5 and 3-6 and Figure 3-5 (Work, 2002; http://www.stetson.edu/ department/biology/amb/florida). A total of 29 fish species were observed in the spring run during a 17 month period. Snorkel counts observed 26 species and seine hauls captured 22 species. Fish counts were generally somewhat higher in the winter months than in the summer. Highest fish counts in the spring boil and in the upper portion of the spring run occurred in February.
Dominant fish species in terms of numbers were: mosquitofish (Gambusia holbrooki), rainwater killifish (Lucania parva), sailfin molly (Poecillia latipinna), least killifish (Heterandria formosa), and bluefin killifish (Lucania goodei). These are all small fish and their total biomass may be relatively low; however, due to their relatively short life histories and high turnover rates, they may contribute significantly to secondary productivity in the spring run. Larger fish that were present at significant densities were bluegill (Lepomis macrochirus), striped mullet (Mugil cephalus), longnose gar (Lepistosteus osseus), spotted sunfish (Lepomis punctatus), suckermouth catfish (Pterygoplichthys disjunctivus), warmouth (Lepomis gulosis), tarpon (Megalops atlanticus), and largemouth bass (Micropterus salmoides). Some of these fish are very large (tarpon over 40 inches in length were observed during the February 26 field trip) and their biomass, if quantified, might be much larger than the smaller fish species.

WETLAND SOLUTIONS, INC.
TABLE 3-5Blue Spring Average Fish Densities (#/m2) - Snorkel Count Method
Common Name Genus Species 1 2 3 4 5 MeanBluegill Lepomis macrochirus 0.0616 0.4638 0.3197 0.2375 0.2414 0.2648Seminole killifish Fundulus seminolis 0.0118 0.0457 0.0608 0.0224 0.0066 0.0295Golden shiner Notemigonis crysoleucas 0.0001 0.0426 0.0534 0.0134 0.0047 0.0228Striped mullet Mugil cephalus 0.0000 0.0063 0.0623 0.0219 0.0137 0.0208Coastal/Ironcolor Notropis petersoni/chalybaeus 0.0000 0.0410 0.0510 0.0013 0.0006 0.0188Longnose gar Lepistosteus osseus 0.0001 0.0000 0.0007 0.0055 0.0675 0.0148Mosquitofish Gambusia holbrooki 0.0000 0.0391 0.0132 0.0097 0.0109 0.0146Spotted sunfish Lepomis punctatus 0.0002 0.0215 0.0108 0.0021 0.0062 0.0082Suckermouth catfish Pterygoplichthys disjunctivus 0.0001 0.0000 0.0000 0.0187 0.0186 0.0075Warmouth Lepomis gulosis 0.0000 0.0000 0.0064 0.0043 0.0077 0.0037Tarpon Megalops atlanticus 0.0000 0.0000 0.0000 0.0053 0.0064 0.0023Largemouth Micropterus salmoides 0.0000 0.0038 0.0009 0.0030 0.0031 0.0021Bluefin killifish Lucania goodei 0.0000 0.0048 0.0008 0.0007 0.0030 0.0019Rainwater killifish Lucania parva 0.0000 0.0022 0.0025 0.0015 0.0018 0.0016Sailfin molly Poecilia latipinna 0.0000 0.0066 0.0007 0.0002 0.0001 0.0015White mullet Mugil curema 0.0000 0.0000 0.0010 0.0003 0.0049 0.0012Blue tilapia Oreochromis aureus 0.0000 0.0000 0.0000 0.0000 0.0054 0.0011Redear sunfish Lepomis microlophis 0.0000 0.0009 0.0000 0.0024 0.0009 0.0008Least killifish Heterandria formosa 0.0000 0.0018 0.0018 0.0002 0.0001 0.0008Pacu Collosoma sp. 0.0000 0.0000 0.0003 0.0000 0.0032 0.0007Channel catfish Ictalurus punctatus 0.0000 0.0000 0.0000 0.0000 0.0030 0.0006Longear Lepomis megalotis 0.0000 0.0000 0.0000 0.0005 0.0024 0.0006Florida gar Lepistosteus platyrhincus 0.0000 0.0000 0.0003 0.0002 0.0003 0.0002Redbreast sunfish Lepomis auritus 0.0000 0.0000 0.0000 0.0000 0.0005 0.0001Brown hoplo Hoplosternum littorale 0.0000 0.0000 0.0000 0.0000 0.0005 0.0001TOTAL 0.074 0.680 0.587 0.351 0.413 0.421
Source: Stetson University Department of BiologyAverage from 26 sample events (10/20/00 - 3/29/02)Location: 1 - boil, 2 - diver entry, 3 - stream, 4 - swimming area, 5 - observation platform (upstream)
Location
3-20

WETLAND SOLUTIONS, INC.
TABLE 3-6Blue Spring Average Fish Densities (# /m2) - Seine Method
Common Name Genus Species 1 2 3 4 5 MeanMosquitofish Gambusia holbrooki 53.9 14.8 16.5 9.4 8.4 20.6Rainwater killifish Lucania parva 0.013 0.723 2.814 1.795 2.345 1.538Sailfin molly Poecilia latipinna 2.455 1.460 2.648 0.593 0.353 1.502Least killifish Heterandria formosa 0.368 0.910 2.198 0.702 0.551 0.946Bluefin killifish Lucania goodei 0.143 1.019 1.040 0.402 0.232 0.567Bluegill Lepomis macrochirus 0.009 0.259 0.850 0.518 0.458 0.418Inland silverside Menidia beryllina 0.000 0.000 0.162 0.715 0.000 0.175Seminole killifish Fundulus seminolis 0.002 0.056 0.352 0.321 0.059 0.158Golden shiner Notemigonis crysoleucas 0.000 0.224 0.288 0.106 0.017 0.127Golden topminnow Fundulus chrysotus 0.077 0.062 0.190 0.043 0.006 0.076Redear sunfish Lepomis microlophis 0.000 0.000 0.012 0.240 0.000 0.050Redbreast sunfish Lepomis auritus 0.000 0.000 0.062 0.076 0.003 0.028Spotted sunfish Lepomis punctatus 0.000 0.004 0.021 0.066 0.003 0.019Coastal/Ironcolor Notropis petersoni/chalybaeus 0.000 0.006 0.057 0.010 0.011 0.017Warmouth Lepomis gulosis 0.002 0.004 0.000 0.033 0.034 0.015Striped mullet Mugil cephalus 0.000 0.000 0.071 0.000 0.000 0.014Longnose gar Lepistosteus osseus 0.002 0.002 0.000 0.033 0.003 0.008Coastal shiner Notropis petersoni 0.000 0.024 0.002 0.000 0.000 0.005Suckermouth catfish Pterygoplichthys disjunctivus 0.000 0.004 0.000 0.003 0.006 0.002Largemouth Micropterus salmoides 0.000 0.000 0.005 0.003 0.003 0.002Tarpon Megalops atlanticus 0.000 0.000 0.000 0.000 0.006 0.001TOTAL 56.9 19.6 27.3 15.1 12.5 26.3
Source: Stetson University Department of BiologyAverage from 26 sample events (10/20/00 - 3/29/02)Location: 1 - boil, 2 - diver entry, 3 - stream, 4 - swimming area, 5 - observation platform (upstream)
Location
3-21

WETLAND SOLUTIONS, INC.
FIGURE 3-5Blue Spring Average Fish Density Time Series Plots
0
50
100
150
200
250
300
6/23/00 10/1/00 1/9/01 4/19/01 7/28/01 11/5/01 2/13/02 5/24/02
Sample Date
Ave
rage
Den
sity
(#/m
2 )
1 - boil2 - diver entry3 - stream4 - swimming area5 - obs. platform
Seine Sampling
0
1
2
3
4
5
6
6/23/00 10/1/00 1/9/01 4/19/01 7/28/01 11/5/01 2/13/02 5/24/02
Sample Date
Ave
rage
Den
sity
(#/m
2 )
1 - boil2 - diver entry3 - stream4 - swimming area5 - obs. platform
Snorkel Sampling
Source: Stetson University Department of Biology
3-22
WETLAND SOLUTIONS, INC.
3-23
While these larger fish are generally not feeding in the spring run, their presence may be important as prey species for other carnivores (e.g., otters and piscivorous birds) or may be indicative of other life history needs (e.g., osmotic regulation in the relatively salty spring water).
All of the fish species listed for Blue Spring and Blue Spring Run are also known to occur in the St. Johns River. Thus, they are all expected to be able to live in the spring run even without the spring flow. However, it can also be surmised that due to the combination of water quality, clarity, relatively constant temperature and higher salt content, the spring run habitat provides a different combination of life support functions for these fish species than the St. Johns River. Detailed life history studies for each fish species would probably be needed to fully understand the subtle dependence or independence of these fish species on spring flows.
The existing fish population data are fairly detailed and can be used to provide a preliminary assessment of the effects, if any, of MFs on fish habitat. Limited flow data were available for the period of the fish sampling. Figure 3-6 illustrates the observed relationship between measured spring discharge rates and fish density estimates using the available data. A positive correlation between flow and fish density was observed at all stations; however, correlation coefficients were low indicating that factors other than flow are possibly more important in determining fish density in Blue Spring and Blue Spring Run.
Based on the observed variability of fish population numbers observed in Blue Spring Run, and the anticipated change in flows under the District’s recommended MF regime, no measurable (statistically detectable) changes to fish populations are anticipated. Since stage is not expected to change as a result of the recommended MF, there is no anticipated effect of the recommended MF on fish passage.
3.4.5 Manatees Manatee use has been documented at Blue Spring State Park and constitutes one of the only fairly complete wildlife datasets that can be applied to the analysis at hand. Although these manatee data are reviewed and analyzed elsewhere (Rouhani et al., 2004), the following recap illustrates an analysis method that could be applied to other key wildlife species (such as fish, reptiles, amphibians, mammals, and birds) if adequate data were available.
Figure 3-7 summarizes monthly average manatee counts in Blue Spring Run for the period from 1979 through 2000. Average annual manatee counts have increased throughout this period of record. As illustrated in Figure 3-8, average monthly manatee numbers in Blue Spring Run are correlated with air temperature (R2 = 0.56) and can be predicted quite well based on Julian day (Figure 3-9). Average monthly manatee numbers are poorly correlated with spring discharge (Figure 3-10). This correlation indicates that under current conditions, other factors (such as temperature and cold water intrusion length) are controlling manatee use of Blue Spring Run.
It is intuitively clear that winter manatee use would decline precipitously if spring discharge were decreased dramatically below existing ranges. Decreased discharge will result in greater cold water intrusions in the downstream portion of the Blue Spring Run,

WETLAND SOLUTIONS, INC.
3-24
potentially reducing warm-water habitat (Rouhani et al., 2004). The warm-water length in the spring run in turn controls the availability of useful winter manatee habitat. However, the ability of manatees to pack more closely in the spring run during critical conditions further complicates the determination of MFs.
Rouhani et al. (2004) determined that: “Existing spring flow conditions provide adequate winter manatee refuge, even during extreme catastrophic events”. A minimum annual average flow of 130 cfs was predicted to accommodate the current manatee population. However, if the manatee population continues to increase, then the spring’s manatee carrying capacity will ultimately be exceeded. For this reason they concluded that the MFs need to be increased over time.
Based on the District’s analysis, the recommended average flow reduction is not expected to be great enough to result in a detrimental change in the recovery of manatee populations in Blue Spring Run. Since no stage change is anticipated, there is not expected to be any affect of water depth on manatee populations as a result of the District’s recommended MF regime.
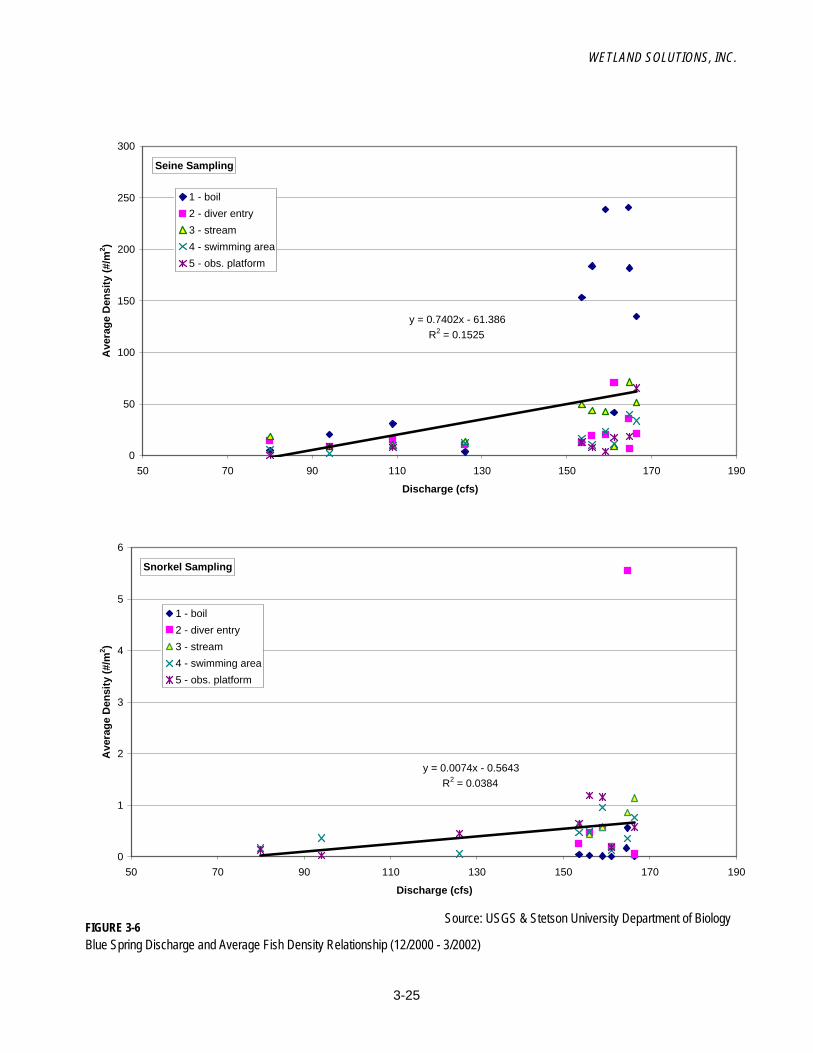
WETLAND SOLUTIONS, INC.
FIGURE 3-6Blue Spring Discharge and Average Fish Density Relationship (12/2000 - 3/2002)
y = 0.7402x - 61.386R2 = 0.1525
0
50
100
150
200
250
300
50 70 90 110 130 150 170 190
Discharge (cfs)
Ave
rage
Den
sity
(#/m
2 )
1 - boil2 - diver entry3 - stream4 - swimming area5 - obs. platform
Seine Sampling
y = 0.0074x - 0.5643R2 = 0.0384
0
1
2
3
4
5
6
50 70 90 110 130 150 170 190
Discharge (cfs)
Ave
rage
Den
sity
(#/m
2 )
1 - boil2 - diver entry3 - stream4 - swimming area5 - obs. platform
Snorkel Sampling
Source: USGS & Stetson University Department of Biology
3-25

WETLAND SOLUTIONS, INC.
FIGURE 3-7Monthly Average Daily Total Number of Manatees Surveyed in Blue Spring, Volusia County, Florida
0
10
20
30
40
50
60
70
Jan-79 Sep-81 Jun-84 Mar-87 Dec-89 Sep-92 Jun-95 Mar-98 Nov-00
Month
Ave
rage
Dai
ly T
otal
Num
ber o
f Man
atee
s
3-26

WETLAND SOLUTIONS, INC.
FIGURE 3-8Blue Spring State Park Average Monthly Air Temperature vs. Average Monthly Manatee Count
y = -3.0131x + 220.75R2 = 0.5565
0
10
20
30
40
50
60
70
50.0 55.0 60.0 65.0 70.0 75.0
Average Monthly Air Temperature (F)
Ave
rage
Mon
thly
Man
atee
s (#
/d)
Period of Record: Jan 94 - Mar 02
3-27

WETLAND SOLUTIONS, INC.
FIGURE 3-9Daily Average Number of Manatees Surveyed in Blue Spring, Volusia County, Florida
0
10
20
30
40
50
60
Oct-15 Nov-4 Nov-24 Dec-14 Jan-3 Jan-23 Feb-12 Mar-4 Mar-24 Apr-13
Calendar Day
Ave
rage
Dai
ly T
otal
Num
ber o
f Man
atee
s
Period of Record: Jan 79 - Mar 02
Y = 0.299 (1-105.7 * cos [(2 pi() / 365)(t-191.7)])R2=0.70
3-28
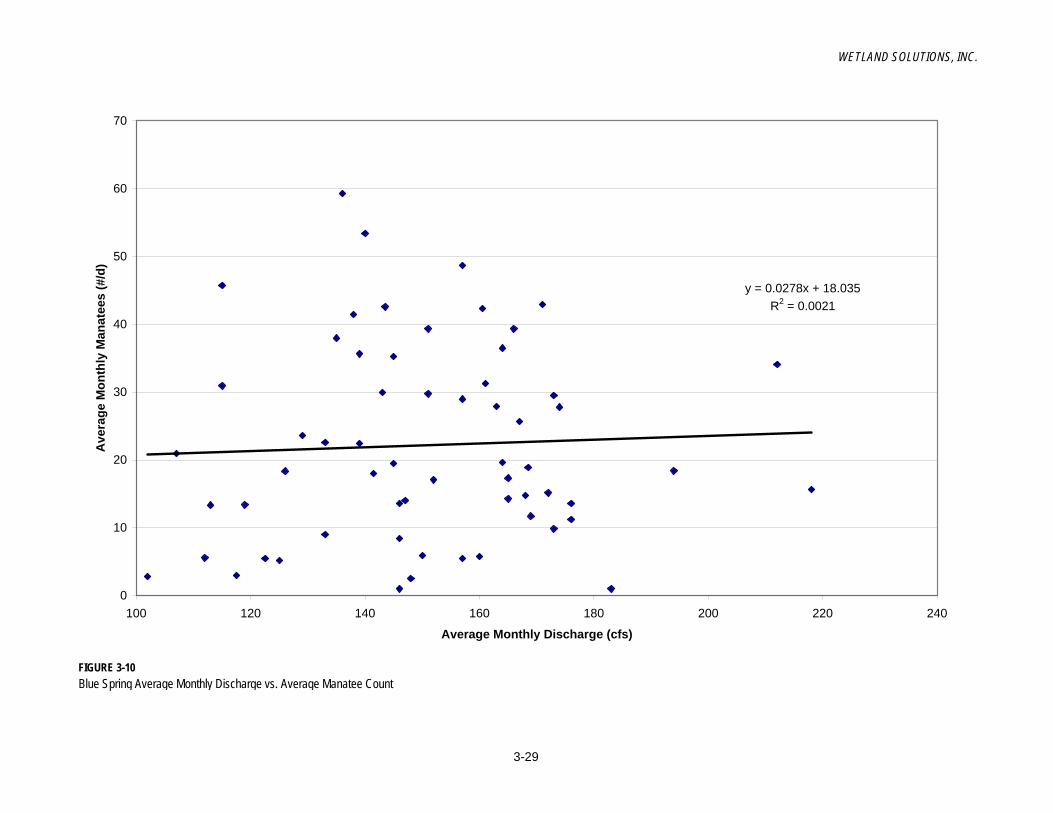
WETLAND SOLUTIONS, INC.
FIGURE 3-10Blue Spring Average Monthly Discharge vs. Average Manatee Count
y = 0.0278x + 18.035R2 = 0.0021
0
10
20
30
40
50
60
70
100 120 140 160 180 200 220 240
Average Monthly Discharge (cfs)
Ave
rage
Mon
thly
Man
atee
s (#
/d)
3-29

WETLAND SOLUTIONS, INC.
3-30
3.4.6 Summary These analyses illustrate how simple correlations can be used as a first step in searching for a relationship between wildlife populations and spring discharge. However, due to the complexity of wildlife environmental requirements, more complex models would likely be needed if the possible effects of MFs on additional wildlife species are fully evaluated. The relatively narrow range of existing flow data and wildlife population numbers limits the ability to make conclusions concerning the effects of very low flows on most wildlife species. Nothing reviewed indicated that the proposed manatee MF regime would be unacceptable for other wildlife species. However, more detailed information may result in a need to adjust the MF regime in the future.
Within the range of existing data, no correlation between stream discharge and manatee numbers was shown in spite of the other evidence that winter manatee habitat could be impaired at lower flows. The best analytical approach to avoid this potential problem is to devise the most likely cause-and-effect model based on an understanding of each species’ life history and to collect population data over a broad range of the environmental variables affecting that species. If wildlife population and life history data sets are highly detailed, it should be possible to set fairly accurate MFLs. If less complete data sets must be used for analysis of MFLs, then it is possible that the recommended MFLs will be less accurate and more likely to allow unanticipated harm to WRVs such as fish and wildlife populations.
Based on existing limited information it is tentatively concluded that existing populations of fish and wildlife using Blue Spring and Blue Spring Run will be protected by the District’s recommended MFs for manatees. This conclusion is made in light of the limited dependence of most of the wildlife species on the spring and spring run, their assumed ability to recolonize the run from the adjacent St. Johns River and surrounding wetlands and uplands if their populations were depleted for any reason, and the normal amount of actual variability expected in wildlife population numbers and occurrence. Within the range of a 17% change in average annual flows it is considered unlikely that a detectable change in wildlife numbers and biomass could be documented. However, greater reductions in average spring flows than those proposed could result in measurable changes in populations of dependent wildlife species in addition to manatees, and result in significant harm to this WRV. Since there is no change in stage anticipated as a result of the District’s recommended MF regime, there is no foreseeable impact of levels on the populations of any of the fish and wildlife species using Blue Spring and Blue Spring Run.
3.5 Estuarine Resources The reduction in Blue Spring discharge resulting from the recommended minimum flow regime is expected to have negligible effects on downstream estuarine resources near the northern end of the St. Johns River. ECT (2002) concluded that a 320 cfs maximum freshwater withdrawal from the St. Johns River near Deland would provide protection of the estuarine resources in the lower river. The proposed 31 cfs reduction at Blue Spring is factored into that proposed reduction and will not result in cumulative impacts downstream. Some fish and other wildlife species that are predominantly or partially dependent upon estuaries and saltwater for critical life history requirements are

WETLAND SOLUTIONS, INC.
3-31
periodically found in Blue Spring Run (e.g., tarpon, American eel, striped mullet, etc.). Protection of these species from significant harm due to decreased flows was considered above in Section 3.4. For these reasons, the estuarine resources WRV is not considered further for this aquatic system.
3.6 Transfer of Detrital Material Detrital materials are organic solid materials resulting from the shedding of plant and animal tissues during normal growth and death processes. For example, freshwater and saltwater marshes lose large quantities of senescent plant leaves and stems that may be flushed out to adjacent water bodies by the tides (Mitsch and Gosselink, 2002). Large populations of snails, fish, and birds produce wastes that may be transported and concentrated within an aquatic ecosystem. Streams and rivers adjacent to forested wetlands and uplands receive large amounts of plant detritus in the form of leaves and branches. All forms of detrital material may have value within an aquatic ecosystem. These organic materials retain nutritive value for populations of microbes and benthic insects and are the basis of a detrital food web.
Detritus entering a stream is often transported and re-distributed to adjacent waters where it may support additional community production. Relative to Blue Spring, the origins of detrital materials are primarily the leaves and twigs falling from trees and shrubs in the watershed and the internally produced wastes of the fish and manatee populations. The processing (physicochemical and biological) and transport of these materials is flow dependent. Reduced flows (greater reductions in flow than those recommended by the District) could limit the transport of detrital materials and thereby reduce productivity of adjacent aquatic ecosystems.
Detrital transport can be measured by quantifying the volatile fraction of total suspended solids (VSS). Upstream-downstream measurements for VSS are recommended (Table 3-2).
The Blue Spring conceptual ecosystem model (Figure 2-7) lumps detritus and microbial decomposers (bacteria, fungi, protozoans, etc.) into a single storage compartment (Detritus/Microbes). This compartment is important ecologically because of the function it plays at degrading dead materials and recycling critical chemical elements back to the aquatic ecosystem. In addition to recycling nutrients back to the water column, the Detritus/Microbe compartment serves as a food source for many of the spring’s smaller consumer organisms such as aquatic insects and snails. The interactions between these living and non-living compartments could be illustrated at much greater detail in order to better define specific effects of flows and levels on this WRV. However, for the purposes of this report, the overall function of detrital transport is considered as a single lumped process.
There are no existing quantitative estimates for production and transport of detrital materials in Blue Spring Run. It can be expected that a predominance of detrital inputs to the spring run occur during the autumn months through leaf fall. Based on existing observations in the spring run there are no apparent deposits of this material, indicating that existing flows are sufficient to transport the detritus that is not immediately consumed in the run out to the St. Johns River. These observations are supported by the

WETLAND SOLUTIONS, INC.
3-32
low HRT estimated for the spring run (average about 1.7 hrs) and the high estimated average velocity (12 cm/s or 0.4 ft/s). Due to the expected relatively high variability in the amount of detrital material transported by Blue Spring Run and the maximum allowable average percent flow reduction recommended for MFs (17%), it is concluded that this WRV will be adequately protected in the future. Also, due to the lack of any estimated stage change as a result of the recommended MF, it is considered unlikely that detrital transport will be affected by stage. In an effort to better characterize the importance of this WRV, preliminary data collection on detrital inputs and transport to Blue Spring and Blue Spring Run are recommended in Section 4.
3.7 Maintenance of Freshwater Storage and Supply For the purposes of this report, it was assumed that proposed alternative water supply development (St. Johns River) will partially offset (reduce) direct aquifer withdrawals that might otherwise affect flows in Blue Spring. Therefore, the WRV requiring maintenance of freshwater storage and supply was not evaluated in this report.
3.8 Aesthetic and Scenic Attributes Recreational use of Blue Spring State Park was described above under Section 3.3 (Recreation In and On the Water). Perhaps the major component of the park’s use is for aesthetic and scenic purposes. Aesthetic and scenic attributes noted at Blue Spring State Park included: viewing scenery, watching wildlife (especially manatees but also fish and birds), breathing clean air, and swimming in clean water on a hot day. Figure 2-7 illustrates how humans using the park interact passively with scenery and wildlife to derive aesthetic benefits. Detailed examination of each type of aesthetic benefit would require quantification of each wild organism (plant and animal) that people view when they use the park. Since the potential effects of the District’s recommended MF on those biological components of Blue Spring and Blue Spring Run were discussed earlier, they are not repeated here.
Aesthetic uses are generally estimated through subjective surveys of resource users. A list of possible approaches for quantifying aesthetic and scenic attributes at Blue Spring includes the following:
• Park exit opinion survey
• Newspaper public service questionnaire
• Student essays on their favorite impressions from visiting the park
• Writing and art workshops to allow expression of subjective opinions about the park and its wildlife
Table 3-2 recommends that park exit surveys be conducted on a regular basis to assess aesthetic and scenic attributes of Blue Spring and Blue Spring Run.
Based on the available information, it is concluded that the District’s recommended minimum flow that will protect manatee habitat at Blue Spring and Blue Spring Run will also protect aesthetic and scenic attributes. This conclusion is based on the District’s goal to protect manatee use and the observed relationship between manatee and human use at Blue Spring State Park. Actual quantitative data to assess the effects of MFs on other

WETLAND SOLUTIONS, INC.
3-33
aesthetic and scenic uses are not available. Monitoring of user’s opinions is recommended to better assess the public’s perception of the importance of spring flows on these subjective functions. Since it is estimated that the water level in Blue Spring and Blue Spring Run will not be affected by the recommended MF, then there is no effect of stage expected for aesthetic and scenic attributes.
3.9 Filtration and Absorption of Nutrients and other Pollutants
3.9.1 Introduction Most aquatic ecosystems naturally assimilate water-borne pollutants (Metcalf and Eddy, 1991; Kadlec and Knight, 1996). This fact has been observed over the past few centuries as wastewater has been released to rivers and wetlands and astute observers have noticed that, as long as they are not over-loaded, most aquatic systems cleanse themselves downstream of the point of discharge. The reasons behind this assimilation potential of aquatic ecosystems are primarily related to the metabolic activity of microbes (i.e., bacteria, fungi, algae, and protozoa) in aquatic environments. These organisms assimilate many organic compounds, macro- and micro-nutrients, as well as trace elements, and other dissolved and particulate compounds. Microbes generally transform some of those pollutants to non-polluting forms through their normal metabolic processes. Similar pollutant assimilation and transformation processes occur in streams, lakes, wetlands, and in man-made wastewater treatment systems. Figure 2-7 illustrates the multiple interactions between the water content of nutrients and other possible pollutants in Blue Spring Run. Detailed mini-models could be prepared for each individual water quality constituent to illustrate possible effects of flow rate and water depth (stage). A few examples provided below illustrate some of the complexity of these interactions.
The ability of aquatic systems to assimilate pollutants is tied to the volumetric flow of the water. Flow rate is especially important in streams and rivers because of the effect of current velocity on diffusion of atmospheric gases (e.g., oxygen) and the turbulent enhancement of transport of the pollutants throughout the water column to sites of metabolic activity. Flow rate also affects hydraulic residence time, and the resulting time available for microbial degradation of pollutants.
Several methods are available to estimate the potential of aquatic systems to transform and assimilate pollutants. One approach is to develop an estimated mass balance that incorporates the effects of all significant loads and removals for each relevant pollutant. Mass loads in the water column are computed based on knowledge of flows and concentrations at upstream and downstream stations. Flow-weighted mean concentrations can also be used for assessing load reduction. For the Blue Spring Run, inflow loads include the spring flow (typically the dominant inflow load), direct rainfall, and non-point and point-source runoff, and litterfall from the surrounding watershed. As long as flows are not very different between upstream and downstream stations (an assumption that is valid in Blue Spring Run), then concentration changes can be used in place of mass loads. Net pollutant load reductions may occur due to chemical transformations and degradation or through sedimentation and storage outside of the

WETLAND SOLUTIONS, INC.
3-34
water column. Once a pollutant mass assimilation rate is known, then changes in this rate can be evaluated to see if they are correlated to environmental factors, including flows.
The historic record of pollutant assimilation rates in Blue Spring is incomplete. Some mass removals may be estimated from existing flow and concentration data. However, to better quantify this WRV, it will be necessary to develop a more complete water quality monitoring program as a benchmark for comparison of future rates and to assess the effects of MFs on those rates.
3.9.2 Filtration and Absorption of Nutrients and Other Pollutants Metrics
The filtration and absorption of nutrients and other pollutants WRV can be assessed by preparing mass balances for the following representative nutrients and pollutants:
• Nitrogen forms (organic N, ammonium N, nitrate+nitrite N, total N)
• Phosphorus forms (particulate, dissolved organic, soluble reactive, total P)
• Trace metals (e.g., copper, iron, lead, mercury, zinc, etc.)
• Trace organics (e.g., pesticides, acid/base extractables, chlorinated hydrocarbons, etc.)
Nine specific mass balances are recommended in Table 3-2. Upstream and downstream loads are calculated by multiplying flow and concentration, and the difference is the net assimilation (or increase) in the pollutant’s load. To be complete in this analysis, upstream loads should include the contribution of the spring boil, as well as atmospheric loads in wet and dry fall and non-point source runoff loads from the surrounding watershed. Once load reductions (or increases) are estimated over a period of record, they can be correlated to Blue Spring flows.
As mentioned earlier in Section 3.4.2, springs provide an excellent venue for estimation of mass load reductions. This advantage is due to their relatively constant inflow concentrations and flow rates (quasi steady-state). They are also close to constant-temperature environments, resulting in relatively constant constituent degradation rates over the annual climatic cycle. The main limitation to quantifying pollutant assimilation rates in a high-flow spring run is the relatively short HRT (average nominal HRT about 1.7 hrs in Blue Spring Run) and resulting relatively small net changes in constituent concentrations between the upstream and downstream sampling stations. Very high turbulence in the spring run leads to a well-mixed water column and reduced need for replicate sampling. However, analytical techniques must be precise to detect relatively small concentration changes. Downstream samples must be collected above the point of influence of the backwaters from the St. Johns River.
3.9.3 Estimated Existing Pollutant Assimilation Rates Some data are available to begin quantification of existing pollutant assimilation metrics for Blue Spring Run. Limited upstream/downstream water quality data are available for total nitrogen (TN), total phosphorus (TP), five-day biochemical oxygen demand, and total suspended solids. However, some of these data sets were collected at different

WETLAND SOLUTIONS, INC.
3-35
times, by different researchers, and analyzed by different methods. Because of these problems, estimates of assimilation (or pollutant increases) are preliminary.
Upstream mass loading was calculated based on the product of the spring flow and the concentration of the constituent in the spring boil. The watershed and rainfall contribution was estimated based on the existing watershed landuse and runoff coefficients obtained from the District (Di, 2002). The Blue Spring Run watershed above the downstream water quality station (150 m upstream from the mouth of Blue Spring Run) is approximately 61.8 acres in size (Figure 3-11). This watershed is comprised of 4 distinct landuse categories: pine flatwoods (41%), upland mixed coniferous/hardwood forest (34%) residential, low density (20%), and the spring run itself and other small feeder streams (5%) (Brown, 2002). The “Marinas and Fish Camps” landuse shown on Figure 3-11 is downstream of this water quality monitoring station and not included in this analysis. Table 3-7 provides a summary of the seasonal runoff estimates, the seasonal runoff water quality coefficients, and the estimated annual mass runoff loading at the downstream water quality monitoring station.
Table 3-8 provides preliminary estimates of mass assimilation (or increase) for each of these four water quality constituents. Estimated loads from the watershed are small compared to loads in the spring flow (less than 0.1%). Estimated mass removals for TN and total suspended solids were positive while the estimated mass of TP and biochemical oxygen demand (BOD) increased downstream (between Stations 4 and 5 in Figure 2-2). It must be noted that the results in Table 3-8 are preliminary and are included in this report to illustrate a methodology rather than to form the basis for final conclusions. These results need to be confirmed by synoptic upstream/downstream water quality measurements and a revised analysis when more complete data are available.
3.9.4 Summary Existing data from Blue Spring are inadequate to precisely determine the effects of spring discharge and stage on rates of pollutant assimilation. It is not necessarily intuitive how pollutant assimilation rate might be a function of flow rate. On one hand, HRT would increase as flow decreases and pollutant assimilation is known to be a direct function of HRT. However, the total pollutant load to Blue Spring Run would be lower at low flows and assimilation rates are known to be correlated with loading rates. While the second effect probably dominates, conflicting factors would be at work if average flows were reduced. An empirical data set that carefully quantifies pollutant assimilation rates under varying flow conditions would be useful to accurately assess the impact of MFs on this WRV metric.
Based on existing information from Blue Spring and based on the typical variability in estimated pollutant filtration and absorption rates, it is tentatively concluded that there will not be a measurable change in this WRV within the range of the proposed MF based on protecting manatee use. However, a larger flow reduction of undetermined magnitude would probably result in a significant reduction in this WRV. Also, based on the assumption of no effect of the proposed Blue Spring and Blue Spring Run MF on stage, there is not expected to be any affect of the future water level on filtration and absorption of nutrients and other pollutants.
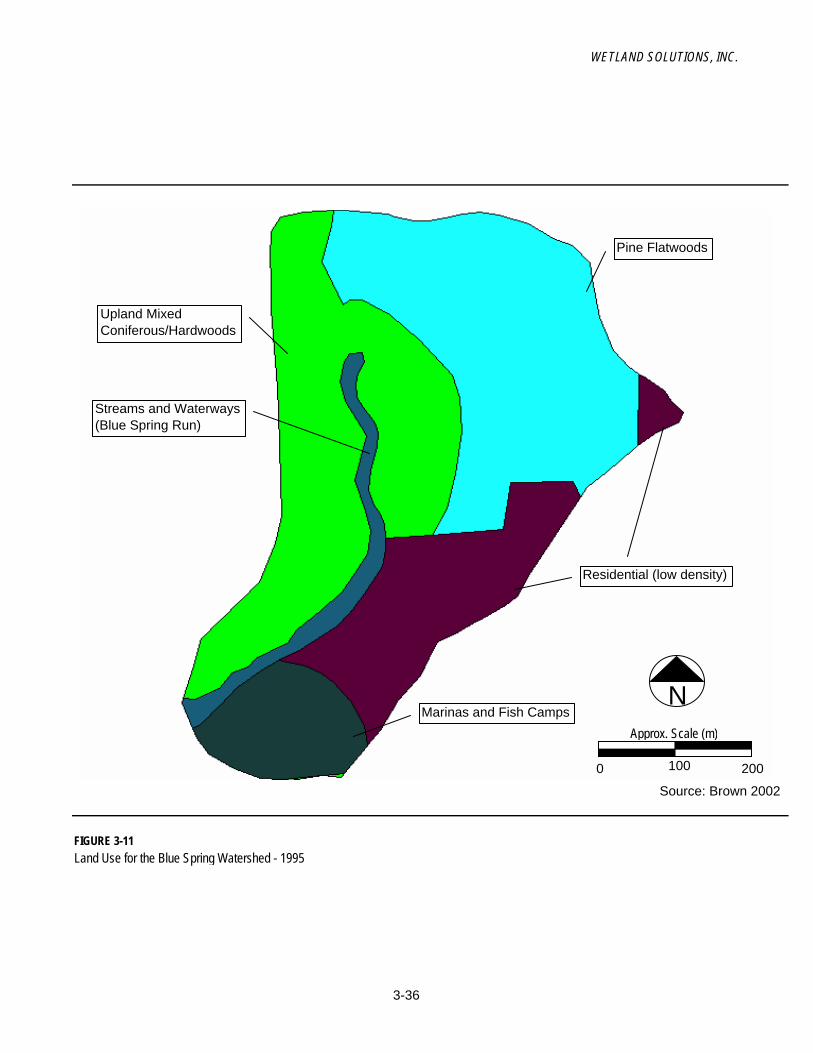
WETLAND SOLUTIONS, INC.
FIGURE 3-11Land Use for the Blue Spring Watershed - 1995
Marinas and Fish Camps
Pine Flatwoods
Residential (low density)
Upland Mixed Coniferous/Hardwoods
Streams and Waterways(Blue Spring Run)
0 100 200
Approx. Scale (m)
N
Source: Brown 2002
3-36

WETLAND SOLUTIONS, INC.
TABLE 3-7Blue Spring Run, Volusia County - 1995 Watershed Land Use and Estimated Mass Loadings
Area (ac)LU DS Stn
Land Use Code 1995 1 2 3 1 2 3 1 2 3 1 2 3 1 2 3 1 2 3 TN TP BOD SSResidential, low density 1100 12.5 0.05 0.00 0.05 673 0 1321 0.80 0.80 0.80 0.08 0.07 0.09 1 1 1 6 6 5 1.6 0.2 2.0 10.6Pine flatwoods 4110 25.2 0.05 0.00 0.05 1358 0 2665 0.70 0.70 0.70 0.06 0.05 0.07 1 1 1 3 3 3 2.8 0.3 4.0 12.1Upland mixed coniferous/hardwood 4340 21.3 0.10 0.00 0.13 2355 0 5636 0.70 0.70 0.70 0.06 0.05 0.07 1 1 1 3 3 3 5.6 0.5 8.0 24.0Streams and waterways 5100 2.9 1.00 1.00 1.00 3141 6851 6163 0.28 0.49 0.47 0.02 0.01 0.03 0 0 0 0 0 0 7.1 0.3 0.0 0.0
Total 61.8 17.1 1.3 14.0 46.7
DS Stn - Land use (LU) area upgradient of downstream WQ station (150 yards from SJ River) Season 1 2 3Season 1 = December - March; 2 = April - July; 3 = August - November Average Rainfall (in) 10.5 22.9 20.6
Est. Seasonal Runoff Coefficients (fraction)
Est. Seasonal Runoff (m3)
Est. Loading to Blue Spring Run (kg/yr)TN (mg/L) TP (mg/L) BOD (mg/L) TSS (mg/L)
Est. Seasonal Water Quality Coefficient
3-37

WETLAND SOLUTIONS, INC.
TABLE 3-8Preliminary Estimates of Representative Pollutant Mass Assimilation Rates in Blue Spring
Estimated Watershed Load
Estimated Boil Load
Estimated Downstream
LoadEstimated Difference
Estimated Mass
RemovedParameter (kg/yr) (kg/yr) (kg/yr) (kg/yr) (kg/ha/d)
TN 17 100,104 50,193 49,928 123.9TP 1 9,658 10,635 -976 -2.4
BOD 14 33,133 59,217 -26,070 -64.7TSS 47 182,432 176,240 6,238 15.5
Average Flow (cfs): 158Spring Run Area (ha): 1.10
3-38

WETLAND SOLUTIONS, INC.
3-39
3.10 Sediment Loads
3.10.1 Introduction Sediments are mineral and organic solid materials that settle in aquatic systems. Relative to Blue Spring, the origins of these materials are: erosion of upland soils and over-hanging banks during heavy rains, leaves and twigs falling from trees and shrubs in the watershed, and mineral or organic based materials being transported through the spring vent. The focus of this WRV is the mineral sediment load (non-volatile suspended solids).The processing (physicochemical and biological) and transport of these materials is flow dependent. The Blue Spring Run conceptual model illustrated in Figure 2-7 incorporates this WRV within the water column as total suspended solids (TSS). The non-volatile component of TSS is of particular relevance and a metric for estimation of this WRV is described below.
Decreased flows will reduce velocity and result in greater sediment load reduction in Blue Spring Run. At the same time flow reduction could conceivably result in a diminution of the sustainable sediment load reduction capacity of aquatic systems. While this WRV attempts to preserve the sediment load reduction capacity of aquatic systems, a high rate of sedimentation might be an ecological problem due to smothering of benthic habitat. For example, decreased flows will result in sediments settling out closer to the spring boil and increased rates of sediment accumulation above the sustainable rate that allows adaptation and maintenance of benthic biota. However, there does not appear to be an existing problem with creation of sediment loads to Blue Spring and Blue Spring Run, due to the limitations on human access and the highly vegetated watershed.
No historical data exist specifically for mineral sediment loads in Blue Spring Run. It is recommended that preliminary monitoring be conducted to assess the level of this function at Blue Spring and to serve as a baseline for comparison of future conditions.
3.10.2 Sediment Load Metric Sediment load should be quantified in the same way as other pollutants. Inflow loads can be estimated by documenting inflow water quality (non-volatile suspended solids) and flows from the spring boil and from the surrounding watershed. Outflow sediment loads can be determined from downstream mass balance estimates. The net difference is the sediment assimilation within the spring run. Based on repeated estimates of these upstream and downstream mass loads over time, this load reduction can be correlated with spring flows.
3.10.3 Estimated Existing Sediment Load Assimilation Rate Limited upstream/downstream water quality data were available for TSS, one approximate measure of suspended sediments. A preliminary estimate of the watershed contribution of total suspended solids is provided in Table 3-7. Table 3-8 provides a preliminary estimate of the assimilation of total suspended solids in Blue Spring Run. The estimated mass removal rate of TSS from the water column based on these historic data was 15.5 kg/ha/d (13.8 lb/ac/d) over about 65% of the spring and spring run area. Mineral sediments cannot be decomposed or truly assimilated; they can only be removed

WETLAND SOLUTIONS, INC.
3-40
by deposition. Since major sediment deposits were not observed in this area of the spring run, it is assumed that the estimated reduction of TSS is actually assimilation of volatile suspended solids (biological materials) rather than suspension and deposition of mineral solids. Additional monitoring should be conducted to better quantify the respective fractions of TSS and VSS in Blue Spring and Blue Spring Run and the removal of mineral sediment loads in this aquatic system as a function of flow.
3.10.4 Summary The mass removal of sediment loads in Blue Spring and Blue Spring Run is expected to be relatively variable due to the variability in measured concentrations of TSS at the upstream and downstream stations (112 to 120% coefficient of variation in the means based on historic data). For this reason it is tentatively concluded that a maximum average flow reduction of 17% is not likely to measurably reduce the potential of this aquatic ecosystem to reduce sediment loads. However, this measurement variability could be reduced through more careful and frequent measurement and it is also concluded that the sediment load reduction of Blue Spring Run might be affected by flow, both as a consequence of total load reduction and conversely as a result of increasing residence time. Since stage is not expected to be affected by the District’s recommended MF, it is concluded that assimilation of sediment loads will not be affected as a result of future water levels.
3.11 Water Quality
3.11.1 Introduction The ambient water quality of Florida surface waters varies in response to environmental conditions such as geology, geography, surrounding land uses and vegetative cover, human uses, climate, atmospheric inputs, and seasonal and daily solar rhythms. Even in the absence of human influences, water quality is expected to vary due to the factors listed above. Additional variation may result from human-caused activities. Figure 2-7 illustrates the complex interaction of water quality with all of the living and non-living components of the spring ecosystem. A few examples of these types of interactions are described below (Section 3.11.4) for dissolved oxygen and specific conductance.
There are many constituents that comprise water quality. These constituents can be quantified by physical, chemical, and biological measurements. Examples of physical measurements of water quality include: temperature, specific conductance, and secchi depth. Examples of measures of chemical water quality include: dissolved oxygen, total iron, TP, and salinity. Examples of biological water quality measures include: fecal coliforms, macroinvertebrate diversity, and algal growth potential. All of the many water quality measures vary within typical ranges characteristic of the water body. The range of these variations has been the subject of considerable research in Florida. FDEP has published a database on the ranges of major water quality measures in Florida surface waters (FDEP, 1989).
Of all aquatic ecosystems in Florida, springs fed by deep artesian aquifers such as the Floridan aquifer, have the most constant water quality. While there may be large water quality differences among different springs that are fed from different regions of the
WETLAND SOLUTIONS, INC.
3-41
Floridan aquifer, a single spring system typically has relatively less temporal water quality variation (Rosenau, et al., 1977; Scott et al., 2002). This reduced susceptibility to water quality variation is reflected in long-term recording of water quality in a number of Florida’s largest springs (Rosenau, et al., 1977; Scott et al., 2002). For example, Scott et al. (2002) report Volusia Blue Spring water quality for the years 1946, 1960, 1972, and 2001. Although analytical methods have changed somewhat within this period and there are some diurnal and seasonal patterns in spring water quality, average temperature only varied between 23.0 and 23.1 degrees Celsius (°C), pH ranged from 7.2 to 7.8, calcium varied from 52 to 76 milligrams per liter (mg/L), and alkalinity from 105 to 142 mg/L as CaCO3.
The largest reported change by Scott et al. (2002) for Volusia Blue Spring was an increase in nitrate and nitrite nitrogen (NOx-N) from 50 to 640 µg/L (based on limited data). Nitrate contamination of springs has been documented in many areas of Florida due to human activities in the contributing watershed such as septic tank drainfields and intense livestock operations (especially dairies) (Scott et al., 2002), and the apparent increased concentration of this parameter might be an indication of such pollution in the watershed (FDEP, 2000).
Flows and levels in springs and in other aquatic ecosystems affect water quality maintenance directly through their effects on physical water quality, on chemical water quality because of increased HRT or lower dilution rates for allocthonous (external) inputs, or due to indirect effects, such as those described above in Section 3.9 (Filtration and Absorption of Nutrients and Other Pollutants).
Some level of change in these WRVs is allowed under the requirements of MFs; however, the change must not be so large that the WRV is not considered protected. One possible standard for this evaluation may be that changes in MFs will not result in impairment of existing designated uses or violations in water quality standards. For metrics without specific numerical standards a conservative test might be to insure that average WQ values will not be significantly different from historic values and that individual measurements will be within the historic range of minimum to maximum values. A less conservative test would be to determine if the change is ecologically significant, resulting in unacceptable harm to the system’s ecology. The level of statistical or ecological significance that is selected may be parameter-specific based on the potential for harm to human and/or ecological uses of the water body.
For the purposes of setting MFs it is necessary to compare water quality WRV metrics to some historical baseline water quality conditions. One defensible approach for implementation of a water quality criterion is to establish a database of water quality for the recent past and establish that data set as the baseline for comparison of future values. This approach is recommended in this report.
3.11.2 Water Quality Metrics There are too many water quality constituents in Blue Spring to allow use of all possible metrics for evaluation of appropriate MFs. Therefore, it is helpful to identify subclasses of water quality metrics, and then choose metrics within those categories that are generally representative of all possible water quality constituents. Table 3-2 provides a list of 15 recommended water quality metrics that should span the breadth of normal

WETLAND SOLUTIONS, INC.
3-42
water quality considerations for insuring maintenance of this WRV in Blue Spring and Blue Spring Run.
The simplest and most available metric for all of these water quality parameters is the time series measurement of concentration or intensity. The ideal metric would be a time series of measurements at multiple stations to allow integration of the concentration or intensity over the entire spring boil and run. This ideal data set is not available, but data for many water quality parameters do exist from two to three discreet stations within the system.
There are two uses that can be made of these water quality metrics. The first is development of correlation analyses between each water quality parameter and flow. If there is a significant correlation, then that relationship may be useful to estimate the effect of reducing flows on the specific water quality indicator. In some cases reducing flow may increase the concentration of a water quality constituent. In other cases reducing flow may result in a lower concentration.
The second use of the water quality metrics is to evaluate the effect of flow on the upstream-downstream concentration changes observed for each water quality parameter. This net change represents a functional aspect of the spring run. For example, the concentration of dissolved oxygen increases between the spring boil and the downstream reach of the run, in response to atmospheric inputs and primary productivity. Diffusion and primary productivity are both known from other studies to be directly correlated with flow rate. Temperature will change in response to flows and atmospheric conditions. Concentrations of salts, alkalinity, and color will change in response to other ecological processes (e.g., weathering of parent rock and the leaching of tannins into the spring run from leaf litter) active within the spring run.
3.11.3 Existing Water Quality Data Table 3-9 summarizes the existing water quality data obtained for Blue Spring and Blue Spring Run and Florida Class III water quality criteria for comparison (Chapter 62-302.530, FAC). These existing water quality data were gathered from numerous sources including:
• U.S. Environmental Protection Agency STORET database (http://oaspub.epa.gov/storpubl)
• Florida Department of Environmental Protection (Bennett, 2002)
• Florida Geological Survey (Scott et al. 2002)
• St. Johns River Water Management District (Hall, 2002; Sucsy, 2002)
• Stetson University Department of Biology (Work, 2002)
• U.S. Geological Survey (Dickerson, 2002; USGS 1995, http://waterdata.usgs.gov/fl/nwis)
• Volusia County Environmental Health Department (Maday, 2002; Rawlins, 2002)

WETLAND SOLUTIONS, INC.
3-43
Based on this review, there is an incomplete water quality data record for Blue Spring. Many of the data summarized in Table 3-9 are relatively old (more than 20 years) and may not be easily compared to more recent data, due to improvements in analytical techniques since that time. Where recent data are available they indicate that there has not been any apparent change in quality of the spring water, except for inorganic (NOx) nitrogen concentrations.
As water exits the spring boil it is essentially groundwater with quality typical of the Floridan aquifer (Fernald and Patton, 1984). Average water temperature at the spring boil was about 23.0 oC with a very narrow range from 22.6 to 23.1 oC (Table 3-9). Average temperature increased downstream (between Stations 4 and 5 in Figure 2-2) to 23.2 oC with a wider range of recorded values (21.5 to 24.5 oC).
The primary differentiating factors between this spring water and the average of other Florida springs is a very low dissolved oxygen concentration in the boil (average 0.43 mg/L) and relatively high salt content (total dissolved solids [TDS] = 816 and conductivity = 1,816 µmhos/cm). Chlorides make up more than half of the dissolved salts (average = 412 mg/L) while sodium is present at a much lower concentration (average = 200 mg/L).
Average dissolved oxygen increased markedly with distance downstream (average = 1.43 mg/L downstream of the swim area) in response to atmospheric diffusion and primary productivity of attached algae. Detailed dissolved oxygen data were also collected during a series of fish surveys conducted by Stetson University in 2000 – 2002 (Work, 2002). These surveys documented dissolved oxygen and fish densities along the length of the run near the shore and in the main channel (Table 3-10). Dissolved oxygen increased from about 0.37 to 0.59 mg/L near the boil to 1.61 to 2.08 mg/L downstream (between Stations 4 and 5 in Figure 2), with higher levels typically in the shallower water near the shore.
Particulate matter concentrations in the spring boil are very low as indicated by low turbidity (3.1 JTU) and total suspended solids (1.3 mg/L). Dissolved color is quite low (2.9 PCU) as are biochemical oxygen demand (0.4 mg/L) and chemical oxygen demand (12.4 mg/L). Alkalinity, hardness, and pH are relatively high due to dissolved calcium carbonate in this spring water (Table 3-9).
Nutrient levels are typical of Florida spring waters with an average TN concentration of 0.49 mg/L with 0.13 mg/L in the organic form, 0.09 mg/L as ammonium N, and 0.27 mg/L in the dissolved oxidized form (nitrate + nitrite N). Average TP was measured as 0.08 mg/L with 0.07 mg/L in the soluble reactive P form (Table 3-9).
Additional statistics are also listed in Table 3-9. The minimum, maximum, standard deviation, coefficient of variation (CV), and count are also listed for each parameter. The CV is relatively small (<10%) for a few parameters such as temperature, pH, TP, calcium, and silica, especially at the upstream station. However, most of the parameters have CVs greater than 20% at both stations with some CVs greater than 200%. Assuming that there may be a correlation with spring discharge, detection of statistically significant changes in the average concentrations for these parameters will be difficult with anything less than a 20% reduction in average spring flows.
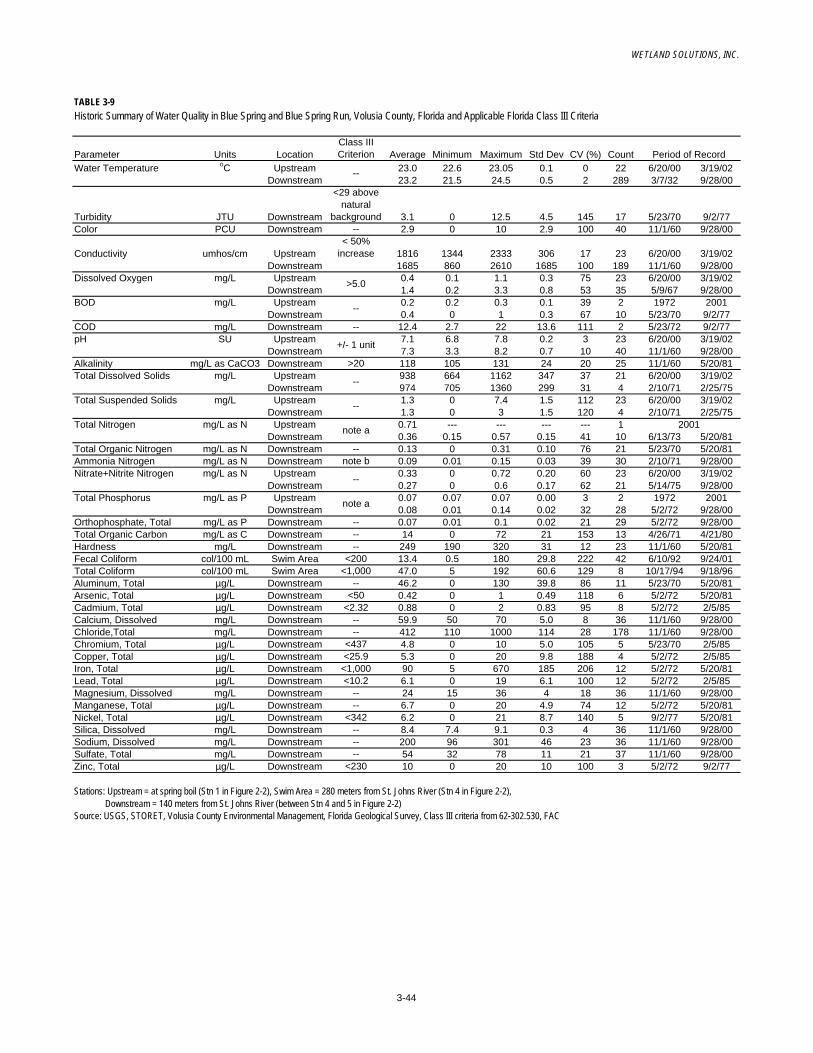
WETLAND SOLUTIONS, INC.
TABLE 3-9Historic Summary of Water Quality in Blue Spring and Blue Spring Run, Volusia County, Florida and Applicable Florida Class III Criteria
Parameter Units LocationClass III Criterion Average Minimum Maximum Std Dev CV (%) Count
Water Temperature oC Upstream 23.0 22.6 23.05 0.1 0 22 6/20/00 3/19/02Downstream 23.2 21.5 24.5 0.5 2 289 3/7/32 9/28/00
Turbidity JTU Downstream
<29 above natural
background 3.1 0 12.5 4.5 145 17 5/23/70 9/2/77Color PCU Downstream -- 2.9 0 10 2.9 100 40 11/1/60 9/28/00
Conductivity umhos/cm Upstream< 50%
increase 1816 1344 2333 306 17 23 6/20/00 3/19/02Downstream 1685 860 2610 1685 100 189 11/1/60 9/28/00
Dissolved Oxygen mg/L Upstream 0.4 0.1 1.1 0.3 75 23 6/20/00 3/19/02Downstream 1.4 0.2 3.3 0.8 53 35 5/9/67 9/28/00
BOD mg/L Upstream 0.2 0.2 0.3 0.1 39 2 1972 2001Downstream 0.4 0 1 0.3 67 10 5/23/70 9/2/77
COD mg/L Downstream -- 12.4 2.7 22 13.6 111 2 5/23/72 9/2/77pH SU Upstream 7.1 6.8 7.8 0.2 3 23 6/20/00 3/19/02
Downstream 7.3 3.3 8.2 0.7 10 40 11/1/60 9/28/00Alkalinity mg/L as CaCO3 Downstream >20 118 105 131 24 20 25 11/1/60 5/20/81Total Dissolved Solids mg/L Upstream 938 664 1162 347 37 21 6/20/00 3/19/02
Downstream 974 705 1360 299 31 4 2/10/71 2/25/75Total Suspended Solids mg/L Upstream 1.3 0 7.4 1.5 112 23 6/20/00 3/19/02
Downstream 1.3 0 3 1.5 120 4 2/10/71 2/25/75Total Nitrogen mg/L as N Upstream 0.71 --- --- --- --- 1
Downstream 0.36 0.15 0.57 0.15 41 10 6/13/73 5/20/81Total Organic Nitrogen mg/L as N Downstream -- 0.13 0 0.31 0.10 76 21 5/23/70 5/20/81Ammonia Nitrogen mg/L as N Downstream note b 0.09 0.01 0.15 0.03 39 30 2/10/71 9/28/00Nitrate+Nitrite Nitrogen mg/L as N Upstream 0.33 0 0.72 0.20 60 23 6/20/00 3/19/02
Downstream 0.27 0 0.6 0.17 62 21 5/14/75 9/28/00Total Phosphorus mg/L as P Upstream 0.07 0.07 0.07 0.00 3 2 1972 2001
Downstream 0.08 0.01 0.14 0.02 32 28 5/2/72 9/28/00Orthophosphate, Total mg/L as P Downstream -- 0.07 0.01 0.1 0.02 21 29 5/2/72 9/28/00Total Organic Carbon mg/L as C Downstream -- 14 0 72 21 153 13 4/26/71 4/21/80Hardness mg/L Downstream -- 249 190 320 31 12 23 11/1/60 5/20/81Fecal Coliform col/100 mL Swim Area <200 13.4 0.5 180 29.8 222 42 6/10/92 9/24/01Total Coliform col/100 mL Swim Area <1,000 47.0 5 192 60.6 129 8 10/17/94 9/18/96Aluminum, Total µg/L Downstream -- 46.2 0 130 39.8 86 11 5/23/70 5/20/81Arsenic, Total µg/L Downstream <50 0.42 0 1 0.49 118 6 5/2/72 5/20/81Cadmium, Total µg/L Downstream <2.32 0.88 0 2 0.83 95 8 5/2/72 2/5/85Calcium, Dissolved mg/L Downstream -- 59.9 50 70 5.0 8 36 11/1/60 9/28/00Chloride,Total mg/L Downstream -- 412 110 1000 114 28 178 11/1/60 9/28/00Chromium, Total µg/L Downstream <437 4.8 0 10 5.0 105 5 5/23/70 2/5/85Copper, Total µg/L Downstream <25.9 5.3 0 20 9.8 188 4 5/2/72 2/5/85Iron, Total µg/L Downstream <1,000 90 5 670 185 206 12 5/2/72 5/20/81Lead, Total µg/L Downstream <10.2 6.1 0 19 6.1 100 12 5/2/72 2/5/85Magnesium, Dissolved mg/L Downstream -- 24 15 36 4 18 36 11/1/60 9/28/00Manganese, Total µg/L Downstream -- 6.7 0 20 4.9 74 12 5/2/72 5/20/81Nickel, Total µg/L Downstream <342 6.2 0 21 8.7 140 5 9/2/77 5/20/81Silica, Dissolved mg/L Downstream -- 8.4 7.4 9.1 0.3 4 36 11/1/60 9/28/00Sodium, Dissolved mg/L Downstream -- 200 96 301 46 23 36 11/1/60 9/28/00Sulfate, Total mg/L Downstream -- 54 32 78 11 21 37 11/1/60 9/28/00Zinc, Total µg/L Downstream <230 10 0 20 10 100 3 5/2/72 9/2/77
Source: USGS, STORET, Volusia County Environmental Management, Florida Geological Survey, Class III criteria from 62-302.530, FAC
Period of Record
2001
Stations: Upstream = at spring boil (Stn 1 in Figure 2-2), Swim Area = 280 meters from St. Johns River (Stn 4 in Figure 2-2), Downstream = 140 meters from St. Johns River (between Stn 4 and 5 in Figure 2-2)
--
>5.0
--
+/- 1 unit
--
--
note a
--
note a
3-44

WETLAND SOLUTIONS, INC.
TABLE 3-10Blue Spring Dissolved Oxygen Statistics Collected During Stetson University Fish Survey
Statistic Units 1 2 3 4 5SHOREAverage mg/L 0.59 1.50 2.14 2.05 2.08Median mg/L 0.52 1.39 1.73 1.77 2.01Maximum mg/L 1.79 4.55 5.64 4.81 4.06Minimum mg/L 0.19 0.32 0.56 0.88 1.20Std Dev mg/L 0.36 0.85 1.09 0.90 0.70Count 65 65 58 53 44CHANNELAverage mg/L 0.37 0.89 1.40 1.62 1.61Median mg/L 0.32 0.82 1.28 1.46 1.57Maximum mg/L 1.15 2.10 3.70 5.10 2.88Minimum mg/L 0.06 0.17 0.41 0.45 0.00Std Dev mg/L 0.21 0.44 0.67 0.79 0.56Count 86 108 100 95 79
Source: Stetson University Department of Biology (Work, 2002)Average from 26 sample events (10/20/00 - 3/29/02)Station Locations: 1 - boil, 2 - diver entry, 3 - stream, 4 - swimming area, 5 - observation platform (upstream)
Stations Identfied in Figure 2
Location
3-45

WETLAND SOLUTIONS, INC.
3-46
3.11.4 Analysis of Possible Water Quality Changes as a Function of Spring Flow and Stage
Table 3-11 provides linear correlation coefficients for a number of the water quality maintenance metrics and spring discharge and stage. Data scatter plots for these metrics are provided in Appendix B. It should be noted that some of these data sets are small and not sufficient to support strong conclusions concerning a relationship between flow and water quality. The following water quality constituent concentrations were positively correlated with spring discharge (concentration increases as flow increases and concentration decreases as flow decreases): NOx-N, TN, organic nitrogen, and TP. Water quality metrics that increased with decreasing flow were: calcium, chloride, conductivity, TDS, and zinc.
The latter group includes water quality metrics that are most likely to show a possible increase in response to decreased flows in Blue Spring Run. Other metrics (temperature, dissolved oxygen, pH, color, PO4, NH4, and mercury) had no measurable correlation to flow within the range of existing data.
As an illustration of how time-series water quality data could be used for determination of MFs, the inverse correlation between conductivity and spring flow is used to estimate the effects of lowering flow on this Class III water quality criterion, which states that:
“specific conductance shall not be increased more than 50% above background or to 1,275 µmhos/cm, whichever is greater” [Florida Administrative Code 62-302.530]
Since the spring temperature is near 25 oC (the temperature at which specific conductance is measured) conductivity values recorded in the spring run are close to the specific conductance used for the Class III standard. The average value of conductivity at the downstream station in Blue Spring Run is 1,685 µmhos/cm. The allowable increased specific conductance of 50% over the background is 2,528 µmhos/cm.
The correlation between spring discharge and conductivity is illustrated in Figure 3-12 and the best-fit linear regression model can be summarized as:
Conductivity (µmhos/cm) = -9.85xDischarge (cfs) +3194 R2 = 0.28 [Eqn. 1]
This correlation indicates that at a mean discharge of about 68 cfs, the Class III standard for specific conductance would be exceeded on a long-term average basis. An even smaller flow reduction (higher average flow than 68 cfs) might conceivably result in a higher rate of daily exceedances of this Class III standard. However, since this is an extrapolation outside the range of the actual range of the regression data, such an interpretation is very tentative. Specific conductance is not expected to be significantly affected within the range of the maximum permitted flow reduction anticipated by the District’s recommended MF for Blue Spring and Blue Spring Run (average annual flow 130 cfs).

WETLAND SOLUTIONS, INC.
TABLE 3-11Blue Spring Run Water Qualiity Metrics and Correlation with Discharge
ParameterCorrelationCoefficient Count
Water Temperature (oC) -0.083 282pH (SU) 0.146 33Dissolved Oxygen (mg/L) -0.151 29Conductivity (umhos/cm) -0.536 181TDS (mg/L) -0.483 33Hardness (mg/L) -0.588 20Alkalinity (mg/L as CaCO3) -0.551 18Ca, Dissolved (mg/L) -0.461 33Chloride (mg/L) -0.492 170Color (CPU) 0.156 33NH4-N (mg/L) -0.185 24NOX-N (mg/L) 0.341 19TON (mg/L) 0.262 15TN (mg/L) 0.762 8PO4 (mg/L) 0.014 24TP (mg/L) 0.345 24Copper (µg/L) -0.398 4Mercury (µg/L) 0.082 9Zinc (µg/L) -0.728 3
Discharge (cfs)
3-47

WETLAND SOLUTIONS, INC.
Period of Record: 11/60 - 9/00FIGURE 3-12Relationship Between Blue Spring Discharge and Downstream Conductivity
y = -9.8478x + 3193.6R2 = 0.2814
500
1000
1500
2000
2500
3000
90 110 130 150 170 190 210 230
Discharge (cfs)
Con
duct
ivity
(um
hos/
cm)
3-48

WETLAND SOLUTIONS, INC.
3-49
Another water quality parameter that is likely to be closely aligned to discharge is dissolved oxygen. Oxygen diffusion rate can be estimated based on flow velocity and water depth (Kadlec and Knight, 1996). Knight (1980) showed that oxygen diffusion rates increased linearly with flow rate in the Silver River. One common formulation for estimating oxygen diffusion is the mass transfer equation:
Diff = K(Csat – C) [Eqn. 2] where:
Diff = diffusion of dissolved oxygen (g/m2/d) K = mass transfer coefficient (m/d) Csat = saturation dissolved oxygen concentration (mg/L) C = actual dissolved oxygen concentration (mg/L)
The O’Connor and Dobbins (1958) correlation estimates the value of the mass transfer coefficient, K, based on water velocity (V in m/d) and water depth (H in m):
K = ((DV)/H)1/2 [Eqn. 3] where: D = molecular diffusivity of oxygen in water (D = 1.76 x 10⁻⁴ m2/d @ 20 oC)
Based on the District’s recommended MF, the average water velocity in Blue Spring Run would decrease from an estimated 10,368 m/d (34,000 ft/d) at an average flow of 156.6 cfs to a velocity of about 8,600 m/d (28,225 ft/d) at a reduced flow of 130 cfs. This change in velocity would lower the estimated initial value of K from about 1.35 to 1.23 m/d at an assumed average depth of 1.0 m (3.3 ft). Assuming a spring boil dissolved oxygen concentration of 0.43 mg/L, and a saturated dissolved oxygen concentration of 8.5 mg/L at the spring run temperature of 23oC, the estimated average diffusion rate for dissolved oxygen near the spring boil will be reduced from about 10.9 to 9.93 g/m2/d (an estimated 9% reduction). This level of change is not considered likely to be biologically significant.
On the other hand, reduced flow will increase the average residence time of the water in the spring run (from about 1.7 to 2.0 hrs), allowing a greater period of time for re-aeration at the assumed lower rate. The net effect of these opposing processes, increases and/or decreases in primary productivity and community respiration, and the effect of the resulting changed dissolved oxygen concentration on the quantity of fish and macroinvertebrate habitat could be assessed by correlating flows with a greater frequency of dissolved oxygen measurements. Based on existing data and this preliminary analysis, it is concluded that there will not be a significant effect of the District’s recommended MF or water stage on dissolved oxygen concentrations.
3.11.5 Summary Water quality WRVs cover a broad spectrum of physical, chemical, and biological properties of Blue Spring and Blue Spring Run. Some of the metrics describing these properties are likely to increase with decreasing flow and some are likely to decrease in response to flow reductions. However, the existing data indicate that most chemical constituent concentrations are variable, due to a combination of actual variation and measurement error. As long as this normal variation is fairly wide (coefficient of

WETLAND SOLUTIONS, INC.
3-50
variations around the mean greater than about 17%), then it is considered unlikely that there will be measurable water quality changes within the range of flow reductions proposed by the District’s recommended MFs for Blue Spring (maximum average decrease less than 17%).
For water quality parameters with existing data, this assessment holds for all parameters with the exception of temperature, pH, conductivity, hardness, calcium, and silica. For each of these parameters it is concluded that a measurable change from the existing average may occur as a response to this proposed flow decrease. In no case is that change considered likely to be large enough to exceed a Florida Class III water quality criterion or to cause measurable harm to the rest of the ecosystem. However, flow reductions greater than those proposed might cause water quality changes that could impair the designated uses of this water body.
3.12 Navigation Recreational and commercial boating and navigation are not allowed in Blue Spring and Blue Spring Run. Therefore, this potential WRV is not realized at this location and is not considered further in this report.

WETLAND SOLUTIONS, INC.
4-1
4.0 Summary, Conclusions, and Recommendations
4.1 Inventory of Existing Uses Section 62-40.473, FAC requires that a determination of minimum flows and levels must consider the protection of 10 classes of WRVs including:
a. Recreation in and on the water (62.40.473 (1) (a), FAC)
b. Fish and wildlife habitats and the passage of fish (62.40.473 (1) (b), FAC)
c. Estuarine resources (62.40.473 (1) (c), FAC)
d. Transfer of detrital material (62.40.473 (1) (d), FAC)
e. Maintenance of freshwater storage and supply (62.40.473 (1) (e), FAC)
f. Aesthetic and scenic attributes (62.40.473 (1) (f), FAC)
g. Filtration and absorption of nutrients and other pollutants (62.40.473 (1) (g), FAC)
h. Sediment loads (62.40.473 (1) (h), FAC)
i. Water quality (62.40.473 (1) (i), FAC)
j. Navigation (62.40.473 (1) (j), FAC)
Seven of these WRV classes were confirmed for Blue Spring and Blue Spring Run and were evaluated for this report. The effect of Blue Spring on Estuarine Resources is being evaluated as part of setting MFLs for the St. Johns River and was not described in this report. Maintenance of Freshwater Storage and Supply is also being dealt with in the establishment of MFLs for the St. Johns River and is not described in this report. There is no navigation allowed in Blue Spring or Blue Spring Run and therefore, that potential WRV is not realized and was not a consideration in this report.
The purpose of this report was to determine, to the extent possible with existing information, whether the remaining 7 WRVs would be protected under the District’s recommended MFs established for Blue Spring and Blue Spring Run based on protecting the West Indian manatee. This recommended MF determination allows an interim maximum permitted reduction of average flows in Blue Spring and Blue Spring Run of about 17% and re-establishment of existing flows by 2029 as other surface water supplies are developed in the project area.
4.2 Summary of Estimated Changes to Ecological and Human Use Resource Values for Blue Spring and Blue Spring Run
A large amount of data is presented in this report that describes the ecological resources in Blue Spring and Blue Spring Run. However, historic data collection has emphasized factors directly or indirectly affecting manatee use, with minor focus on general water quality, use by other wildlife groups, and human recreational and aesthetic uses. As a result, there are many data gaps that become apparent when trying to assess whether the recommended MF for Blue Spring will protect the WRVs.
WETLAND SOLUTIONS, INC.
4-2
A total of 46 quantifiable metrics are proposed to assess the effects of MFs on water quality, pollutant assimilation, wildlife habitat, and human use WRVs at Blue Spring and Blue Spring Run in Volusia County, Florida. Existing data have been summarized and subjected to preliminary analyses to illustrate methodologies for evaluation of these WRVs and to provide a preliminary assessment of effects of MFs on some of these metrics. Existing quantitative data are available to assess the correlation between only 17 (~37%) of the WRV metrics and flows in Blue Spring Run. Since limited data are currently available to assess quantitative changes to these WRV metrics, preliminary estimates for the other metrics are based on best professional judgment.
A number of water quality characteristics (e.g., TN, zinc, conductivity, hardness, and TP) of Blue Spring and Blue Spring Run were found to be correlated with spring flows and preliminary regressions indicate that excessive reduction in spring flow (much greater than recommended by the District) could lead to the exceedance of at least one Class III water quality standard (specific conductance) and statistically significant changes to a number of others. However, existing data ranges are limited and extrapolations outside the range of existing flows should be interpreted cautiously. In general, existing environmental data are not sufficient to support detailed and quantitative assessments of the recommended MFs for Blue Spring that will protect the other (non-manatee) ecological WRVs.
It is considered likely that the quantitative values of additional WRV metrics described in this report would also be found to be affected by spring flow, if adequate data were available for analysis. Some metrics are likely to decrease and others to increase in response to flows less than current levels. Metrics are also expected to have a wide range of sensitivities to the magnitude of those flow changes.
Table 4-1 provides a summary of estimated effects of the proposed reduced flows on the 46 WRV metrics proposed in this report. There are generally not enough data to comprehensively address the precise relationship between spring flow and each WRV. However, based on the information that is available and the best professional judgment of the author, it is tentatively concluded that the District’s recommended MF regime should protect all of the WRVs from adverse impacts. Additional data collection is recommended in the future to develop better relationships between the WRVs and spring discharge, and the MF regime can be adjusted as necessary.
Based on the analysis of the limited data available for this report and the observed variability of these data in response to the range of measured flows, it is concluded that only a few of these ecological and human use WRV metrics would be measurably affected within the range of the District’s proposed phased maximum average 17% reduction for the MF in Blue Spring based on protecting manatee use. It is also tentatively concluded that any metrics that are affected will not change enough to measurably affect the spring’s overall ecological functioning.
Based on the District’s finding of no measurable change in water levels in Blue Spring and Blue Spring Run as a result of the recommended flow regime (Sucsy et al., 1998), it is concluded that none of the WRVs described above will be affected by a change in levels.
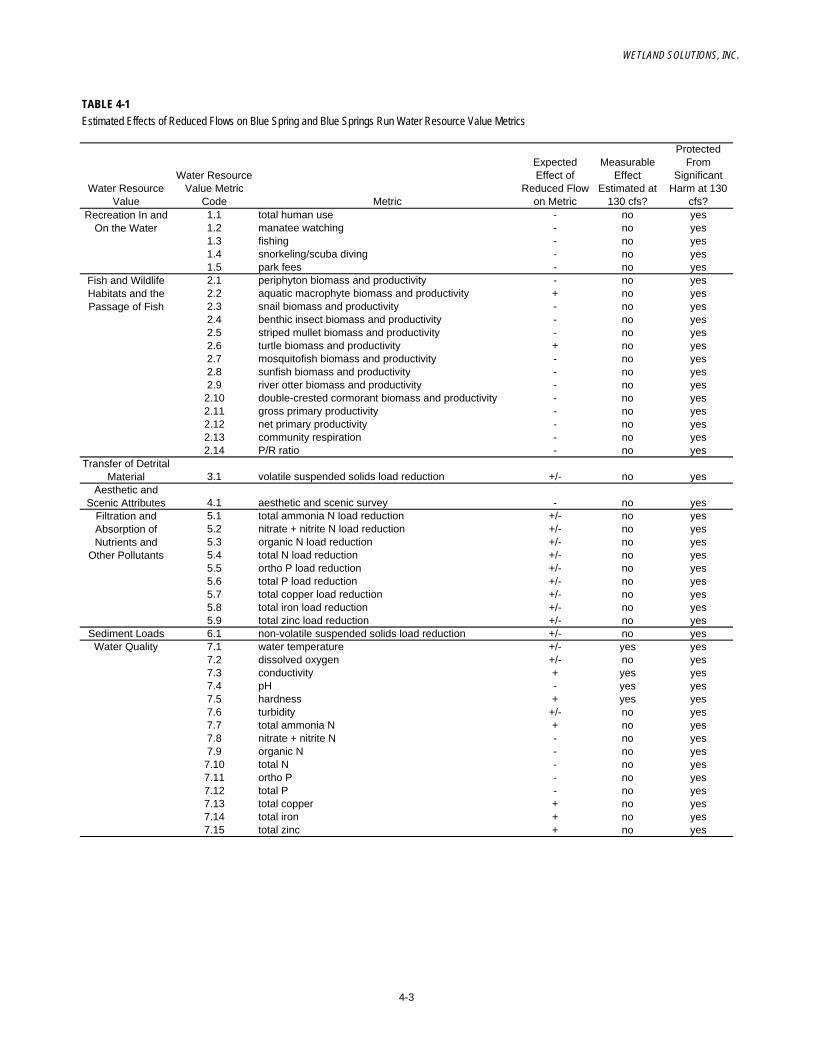
WETLAND SOLUTIONS, INC.
TABLE 4-1Estimated Effects of Reduced Flows on Blue Spring and Blue Springs Run Water Resource Value Metrics
Water Resource Value
Water Resource Value Metric
Code Metric
Expected Effect of
Reduced Flow on Metric
Measurable Effect
Estimated at 130 cfs?
Protected From
Significant Harm at 130
cfs?1.1 total human use - no yes1.2 manatee watching - no yes1.3 fishing - no yes1.4 snorkeling/scuba diving - no yes1.5 park fees - no yes2.1 periphyton biomass and productivity - no yes2.2 aquatic macrophyte biomass and productivity + no yes2.3 snail biomass and productivity - no yes2.4 benthic insect biomass and productivity - no yes2.5 striped mullet biomass and productivity - no yes2.6 turtle biomass and productivity + no yes2.7 mosquitofish biomass and productivity - no yes2.8 sunfish biomass and productivity - no yes2.9 river otter biomass and productivity - no yes2.10 double-crested cormorant biomass and productivity - no yes2.11 gross primary productivity - no yes2.12 net primary productivity - no yes2.13 community respiration - no yes2.14 P/R ratio - no yes
Transfer of Detrital Material 3.1 volatile suspended solids load reduction +/- no yes
Aesthetic and Scenic Attributes 4.1 aesthetic and scenic survey - no yes
5.1 total ammonia N load reduction +/- no yes5.2 nitrate + nitrite N load reduction +/- no yes5.3 organic N load reduction +/- no yes5.4 total N load reduction +/- no yes5.5 ortho P load reduction +/- no yes5.6 total P load reduction +/- no yes5.7 total copper load reduction +/- no yes5.8 total iron load reduction +/- no yes5.9 total zinc load reduction +/- no yes
Sediment Loads 6.1 non-volatile suspended solids load reduction +/- no yesWater Quality 7.1 water temperature +/- yes yes
7.2 dissolved oxygen +/- no yes7.3 conductivity + yes yes7.4 pH - yes yes7.5 hardness + yes yes7.6 turbidity +/- no yes7.7 total ammonia N + no yes7.8 nitrate + nitrite N - no yes7.9 organic N - no yes7.10 total N - no yes7.11 ortho P - no yes7.12 total P - no yes7.13 total copper + no yes7.14 total iron + no yes7.15 total zinc + no yes
Recreation In and On the Water
Fish and Wildlife Habitats and the Passage of Fish
Filtration and Absorption of Nutrients and
Other Pollutants
4-3
WETLAND SOLUTIONS, INC.
4-4
4.3 Data Collection and Analysis Needs It is recommended that a variety of additional data be collected to assess the effects of MFs on the non-manatee WRV metrics for Blue Spring and Blue Spring Run. Any new data collection should be considered to be preliminary, and designed for the purpose of establishing a baseline and defining existing ranges for specific metrics. This report has described several possible techniques for analyzing these data to assess whether measurable changes have occurred to the WRV metrics. The magnitude of change that constitutes significant harm within the context of the MFL program will need to be defined for each WRV metric of interest. Based on this initial range-finding effort, long-term monitoring could be reduced to a more limited subset of water quality and biological parameters that best illustrate the effects of flows on each critical WRV.
Based on the findings of this report, the following recommendations are proposed:
• An enhanced water quality data collection program should be implemented to quantify upstream and downstream concentrations over a multi-year period for the parameters listed in Table 4-1. This data set would provide a baseline for comparison of future values.
• A water quality multi-probe could be installed upstream (near the boil) and downstream, near the mouth of Blue Spring Run (above the influence of the St. Johns River), to provide the data to estimate daily community metabolism (gross and net primary productivity and ecosystem respiration). This multi-probe sensor would need to record temperature, dissolved oxygen, and oxygen percent saturation hourly to provide the raw data needed for these estimates. Data for temperature would also be very useful for assessing the accuracy of the model developed by the District for manatee use in Blue Spring Run. Additional parameters including TDS, pH, and conductivity could also be included in this multi-probe and would be useful for assessing other aspects of the spring’s ecology. A second multi-probe located upstream at the spring boil, while not absolutely necessary for the analysis of community metabolism, would be useful to detect subtle changes in groundwater quality affecting Blue Spring and Blue Spring Run.
• Based on continuing and expanded data collection and analyses as illustrated in this report, the list of possible WRV metrics of interest in Blue Spring and Blue Spring Run could be further refined and possibly reduced in length to include only those metrics that are confirmed to be affected by spring flow.
• An historic record of pollutant assimilation rates in Blue Spring is not available. The upstream-downstream water quality data described above, in concert with continuous flow measurements can be used to quantify the existing assimilation rates as a benchmark for comparison of future rates and to assess the effects of MFs on those rates.

WETLAND SOLUTIONS, INC.
4-5
• Future fish population studies in Blue Spring and Blue Spring Run should estimate or measure fish lengths and weights to allow development of biomass and productivity estimates for species that are found to be affected by flow rates
• Changes in habitat resources should generally be evaluated within the context of historical variations and should include quantification of both beneficial and detrimental effects of flows in Blue Spring and Blue Spring Run

WETLAND SOLUTIONS, INC.
5-1
5.0 References Cited Barbour, M.T., J. Gerritsen, and J.S. White. 1996. Development of the Stream Condition Index for Florida. Prepared for the Fla. Dept. Environ. Protection. 105 pp.
Bennett, Amy.2002. Department of Environmental Protection. Bureau of Laboratories - Environmental Assessment. 'EcoSummary' data for Blue Spring (personal communication 4/2/02)
Bonn, M.A. and F.W. Bell. 2003. Economic Impact of Selected Florida Springs on Surrounding Local Areas. Prepared for the Florida Department of Environmental Protection, Florida Springs Task Force. Tallahassee, Florida. 102 pp.
Brown, Steve. 2002. St. John River Water Management District, Palatka, Florida. GIS Land Use / Land Cover for Blue Spring Watershed. (personal communication 5/17/02)
Environmental Consulting & Technology, Inc. (ETC). 2002. Lower St. Johns River Salinity Regime Assessment: Effects of Upstream Flow Reduction near Deland. Prepared for the St. Johns River Water Management District. Gainesville, FL.
Di, Jian. 2002. St. John River Water Management District, Palatka, Florida. Pollutant Loading Rates for Different Land Use Groups for Blue Spring Park. (personal communication 5/16/02)
Dickerson, Sandra. 2002. U.S. Geological Survey. Blue Spring (Stn 02235500) continuous discharge, temperature, and specific conductance records (personal communication 5/21/02).
Fernald E. A. and D.J. Patton 1984. Water Resources Atlas of Florida. Library of Congress Catalog Number 84-081758. Edited by.
Florida Department of Environmental Protection. 2000. Abstracts of Talks Presented at the Florida Springs Conference: Natural Gems-Troubled Waters, February 8-10, 2000, Sheraton Gainesville Hotel, Gainesville, Florida. Website, http://susdl.fcla.edu/related/springs.html. viewed 5/9/2002
Florida Department of Environmental Protection. 1999. Blue Spring State Park and Hontoon Island State Park Unit Management Plan. Tallahassee, FL.
Florida Department of Environmental Protection. 1989. Typical Water Quality Values for Florida’s Lakes, Streams and Estuaries. Tallahassee, FL.
Florida Springs Task Force. 2000. Florida’s Springs – Strategies for Protection and Restoration. Prepared for Florida Department of Environmental Protection and the Citizens of the State of Florida.
Hall, Sonny. 2002. St. John River Water Management District, Palatka, Florida. Blue Spring Discharge, Stage, and Manatee Surveys. (personal communication 5/9/02)
Kadlec, R.H. and R.L. Knight. 1996. Treatment Wetlands. Lewis Publishers, Boca Raton, FL 893 pp.
Knight, R.L. 1980. Energy Basis of Control in Aquatic Ecosystems. Ph.D. Dissertation, University of Florida, Gainesville, FL. 200 pp.

WETLAND SOLUTIONS, INC.
5-2
Maday, Eric. 2002. Volusia County Health Department – Environmental Health, Orange City, Florida. Surface Water Quality Data from Blue Spring – Bacteria. (personal communication 5/10/02)
McBride, G.B., J.C. Loftis, and N.C. Adkins. 1993. What do significance tests really tell us about the environment? Environmental Management 17(4):423-432.
Metcalf and Eddy, Inc. 1991. Wastewater Engineering Treatment, Disposal, and Reuse. Third Edition. McGraw-Hill, Inc. NY.
Mitsch, W.J. and J.G. Gosselink. 2000. Wetlands. Third Edition. John Wiley & Sons, Inc. New Yourk, NY.920 pp.
O’Connor, D.J. and W.E. Dobbins. 1958. Mechanism of Reaeration in Natural Streams. ASCE Transactions Paper No. 2934:641-684.
Odum, H. T. 1983. Systems Ecology. Whiley-Interscience, NY.644 pp.
Odum, H.T. 1971. Environment, Power, and Society. Whiley-Interscience. NY. 336 pp.
Odum, H.T. 1957. Trophic structures and productivity of Silver Springs, Florida. Ecological Monographs 27:55-112.
Odum, H.T., E.C. Odum and M.T. Brown. 1998. Environment and Society in Florida. Lewis Publishers, Boca Raton, FL
Post, Buckley, Shuh & Jernigan. 1995. Special Purpose Survey of Crescent City Ridge Lakes Cross Sections & Profiles Blue Springs Outfall. Prepared for the St. Johns River Water Management District. 6 drawings.
Rawlins, Jack. 2002. Volusia County Environmental Management. Surface Water Quality Data from Blue Spring. (personal communication 4/8/02)
Rosenau, J.C., G.L. Faulkner, C.W. Hendry Jr., and R.W. Hull. 1977. Springs of Florida - Geological Bullentin No. 31, revised. Florida Geological Survey, Tallahassee, Florida.
Rouhani, S., P. Sucsy, G. Hall, W. Osburn, and M. Wild. 2004. Analysis of Blue Spring Discharge Data for Determining Minimum Flows to Protect Manatee Habitat. Draft Report. Prepared in cooperation with the Blue Spring Minimum Flow Interagency Working Group. Prepared for the St. Johns River Water Management District, Palatka, FL. Prepared by New Fields, Inc., Atlanta, Georgia.
Scott, T.M., G.H. Means, R.C. Means, and R.P. Meegan, 2002. First Magnitude Springs of Florida. Florida Geological Survey Open File Report No. 85.
St. John River Water Management District. 1998. Chapter 40C-8, F.A.C. Minimum Flow and Levels.
Sucsy, P. 2002. St. John River Water Management District, Palatka, Florida. Maximum and Minimum Daily Air Temperature at DeLand for 1931-2000. (personal communication 5/9/02).
Sucsy, P., R. Hupalo, and B. Freeman. 1998. Minimum Flow Determination for Blue Spring, Volusia County: the Relationship Between Ground Water Discharge and Winter Refuge for Manatees. Draft Technical Report. Department of Water Resources, St. Johns River Water Management District, Palatka, FL.

WETLAND SOLUTIONS, INC.
5-3
U.S. Geological Survey. 1995. Springs of Florida. Fact Sheet FS-151-95. Tallahassee, Florida.
Webb, Kathy. 2002. Department of Environmental Protection. District 3 - Florida Park Service. Blue Spring State Park Visitor Data – Blue Spring.htm. (personal communication 5/7/02)
Website, http://oaspub.epa.gov/storpubl/legacy/proc_advanced_query (Organization Code 21FLA; Station ID: 20010148) viewed 5/7/2002
Website, http://waterdata.usgs.gov/fl/nwis/inventory/?site_no=02235500. viewed 2/25/2002
Website, http://waterdata.usgs.gov/fl/nwis/uv?02235500. viewed 5/10/2002
Website, http://www.abfla.com/parks/BlueSpring/bluespring.html. viewed 2/21/2002
Website, http://www.floridadep.org/labs/reports/spring.htm. viewed 4/2/2002
Website, http://www.stetson.edu/departments/biology/amb/florida. viewed 3/18/2002
Website, http://www4.ncdc.noaa.gov/cgi-win/wwwcgi.dll?wwDI~StnSrch~StnID~20004479. viewed 5/9/2002
Work, Kirsten., 2002. Stetson University Department of Biology – Fish Survey Data from October 2000 to March 2002.

.
Appendix A Plant and Animal List for Blue Spring State Park

WETLAND SOLUTIONS, INC.
APPENDIX ASpecies List Observed in Blue Spring Run
SCIENTIFIC NAMEINVERTEBRATESMollusks
Blue Spring hydrobe Aphaostracon asthenesBlue Spring siltsnail Cincinnatia parva
FISHSpotted gar Lepisosteus oculatusLongnose gar Lepisosteus osseusFlorida gar Lepisosteus platyrhincusLadyfish Elops saurusTarpon Megalops atlanticusAmerican eel Anguilla rostrataHickory shad Alosa mediocrisGizzard shad Dorosoma cepedianumThreadfin shad Dorosoma petenenseGolden shiner Notemigonus crysoleucasLake chubsucker Erimyzon sucettaWhite catfish Ameiurus catusYellow bullhead Ameiurus natalisBrown bullhead Ameiurus nebulosusBlue catfish Ictalurus furcatusChannel catfish Ictalurus punctatusPirate perch Aphredoderus sayanusNeedlefish Strongylura sppSeminole killifish Fundulus seminolisBluefin killifish Lucania goodeiWestern mosquitofish Gambusia affinisEastern mosquitofish Gambusia holbrookiLeast killifish Heterandria formosaSailfin molly Poecilia latipinnaBluespotted sunfish Enneacanthus gloriosusRedbreast Lepomis auritusWarmouth Lepomis gulosusBluegill Lepomis macrochirusLongear sunfish Lepomis megalotisRedear sunfish Lepomis microlophusSpotted sunfish Lepomis punctatusLargemouth Micropterus salmoidesBlack crappie Pomoxis nigromaculatusBlue tilapia Tilapia aureaStriped mullet Mugil cephalus
COMMON NAME
A-1

WETLAND SOLUTIONS, INC.
APPENDIX ASpecies List Observed in Blue Spring Run
SCIENTIFIC NAMECOMMON NAMEAMPHIBIANS
Two-toed amphiuma Amphiuma meansGreater siren Siren lacertinaGreen treefrog Hyla cinereaSquirrel treefrog Hyla squirellaBullfrog Rana catesbeianaPig frog Rana grylioRiver frog Rana heckscheriFlorida leopard Rana utricularia sphenocephala
REPTILESFlorida snapping turtle Chelydra serpentina osceolaStriped mud turtle Kinosternon bauriFlorida mud turtle Kinosternon subrubrum steindachneriLoggerhead musk turtle Sternotherus minor minorCommon musk turtle Sternotherus odoratusEastern chicken turtle Deirochelys reticularia reticulariaFlorida cooter Pseudemys floridana floridanaPeninsula cooter Pseudemys floridana peninsularisFlorida redbelly turtle Pseudemys nelsoniFlorida box turtle Terrapene carolina bauriFlorida softshell Apalone feroxAmerican alligator Alligator mississippiensisMississippi green water snake Nerodia cyclopionBanded water snake Nerodia fasciata fasciataFlorida water snake Nerodia fasciata pictiventrisFlorida green water snake Nerodia floridanaBrown water snake Nerodia taxispilotaFlorida cottonmouth Agkistrodon piscivorus conanti
BIRDSPied-billed Grebe Podilymbus podicepsHorned Grebe Podiceps auritusAmerican White Pelican Pelecanus erythrorhynchosBrown Pelican Pelecanus occidentalisDouble-crested Cormorant Phalacrocorax auritusAnhinga Anhinga anhingaAmerican Bittern Botaurus lentiginosusGreat Blue Heron Ardea herodiasGreat Egret Ardea albaSnowy Egret Egretta thulaLittle Blue Heron Egretta caeruleaTricolored Heron Egretta tricolorCattle Egret Bubulcus ibisGreen Heron Butorides virescensBlack-crowned Night-heron Nycticorax nycticoraxYellow-crowned Night-heron Nyctanassa violacea
A-2

WETLAND SOLUTIONS, INC.
APPENDIX ASpecies List Observed in Blue Spring Run
SCIENTIFIC NAMECOMMON NAMEWhite Ibis Eudocimus albusGlossy Ibis Plegadis falcinellusWood Stork Mycteria americanaBlack Vulture Coragyps atratusTurkey Vulture Cathartes auraMuscovy Duck Cairina moschataWood Duck Aix sponsaMottled Duck Anas fulvigulaMallard Anas platyrhynchosBlue-winged Teal Anas discorsNorthern Shoveler Anas clypeataAmerican Wigeon Anas americanaLesser Scaup Aythya affinisHooded Merganser Lophodytes cucullatusRed-breasted Merganser Mergus serratorOsprey Pandion haliaetusSwallow-tailed Kite Elanoides forficatusBald Eagle Haliaeetus leucocephalusNorthern Harrier Circus cyaneusSharp-shinned Hawk Accipiter striatusCooper's Hawk Accipiter cooperiiRed-shouldered Hawk Buteo lineatusBroad-winged Hawk Buteo platypterusRed-tailed Hawk Buteo jamaicensisPurple Gallinule Porphyrula martinicaCommon Moorhen Gallinula chloropusAmerican Coot Fulica americanaLimpkin Aramus guaraunaKilldeer Charadrius vociferusSolitary Sandpiper Tringa solitariaSpotted Sandpiper Actitis maculariaCommon Snipe Gallinago gallinagoRing-billed Gull Larus delawarensisHerring Gull Larus argentatusCaspian Tern Sterna caspiaForster's Tern Sterna forsteriBelted Kingfisher Ceryle alcyonFish Crow Corvus ossifragusBoat-tailed Grackle Quiscalus majorCommon Grackle Quiscalus quiscula
MAMMALSRiver otter Lutra canadensisWest Indian manatee Trichechus manatus latirostris
Source:Blue Spring State Park and Hontoon Island State Park Unit Management Plan(FDEP Division of Recreation and Parks, June 17, 1999)
A-3

.
Appendix B Scatter-Plots for Blue Spring Water Quality and Flows

WETLAND SOLUTIONS, INC.
y = -0.0022x + 23.557R2 = 0.0074
21.0
21.5
22.0
22.5
23.0
23.5
24.0
24.5
25.0
0 50 100 150 200 250
Discharge (cfs)
Wat
er T
empe
ratu
re (o C
)
y = -0.0031x + 1.8956R2 = 0.007
0.0
0.5
1.0
1.5
2.0
2.5
3.0
3.5
0 50 100 150 200 250
Discharge (cfs)
Dis
solv
ed O
xyge
n (m
g/L)
y = 0.0027x + 6.9917R2 = 0.0063
0.0
1.0
2.0
3.0
4.0
5.0
6.0
7.0
8.0
9.0
0 50 100 150 200 250
Discharge (cfs)
pH (S
U)
y = -9.8478x + 3193.6R2 = 0.2814
0.0
500.0
1000.0
1500.0
2000.0
2500.0
3000.0
0 50 100 150 200 250
Discharge (cfs)
Con
duct
ivity
(um
hos/
cm)
B-1

WETLAND SOLUTIONS, INC.
y = -3.5736x + 1391.3R2 = 0.3001
400.0
500.0
600.0
700.0
800.0
900.0
1000.0
1100.0
1200.0
0 50 100 150 200 250
Discharge (cfs)
TDS
(mg/
L)
y = -0.1573x + 142.71R2 = 0.3034
90.0
95.0
100.0
105.0
110.0
115.0
120.0
125.0
130.0
135.0
0 50 100 150 200 250
Discharge (cfs)
Alk
alin
ity (m
g/L
as C
aCO
3)
y = -0.8671x + 387.05R2 = 0.3452
150.0
170.0
190.0
210.0
230.0
250.0
270.0
290.0
310.0
330.0
0 50 100 150 200 250
Discharge (cfs)
Har
dnes
s (m
g/L)
y = -0.1262x + 79.659R2 = 0.328
40.0
45.0
50.0
55.0
60.0
65.0
70.0
75.0
0 50 100 150 200 250
Discharge (cfs)
Ca,
Dis
solv
ed (m
g/L)
B-2

WETLAND SOLUTIONS, INC.
y = -2.7163x + 827.13R2 = 0.2367
0.0
200.0
400.0
600.0
800.0
1000.0
1200.0
0 50 100 150 200 250
Discharge (cfs)
Chl
orid
e (m
g/L)
y = -0.0005x + 0.1686R2 = 0.1079
0.00
0.02
0.04
0.06
0.08
0.10
0.12
0.14
0.16
0 50 100 150 200 250
Discharge (cfs)
NH
4-N
(mg/
L)
y = 0.0175x + 0.0749R2 = 0.022
0.0
2.0
4.0
6.0
8.0
10.0
12.0
0 50 100 150 200 250
Discharge (cfs)
Col
or (C
PU)
y = 0.0031x - 0.1708R2 = 0.1957
0.0
0.1
0.2
0.3
0.4
0.5
0.6
0.7
0 50 100 150 200 250
Discharge (cfs)
NO
x-N
(mg/
L)
B-3
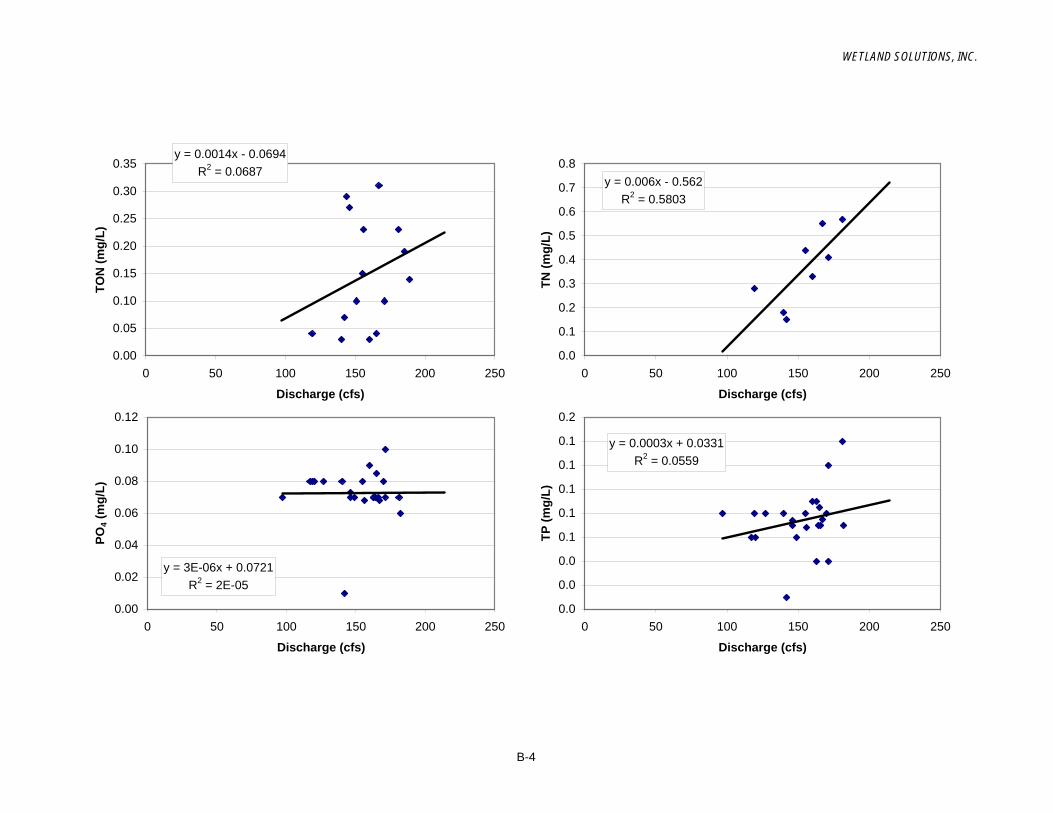
WETLAND SOLUTIONS, INC.
y = 0.0014x - 0.0694R2 = 0.0687
0.00
0.05
0.10
0.15
0.20
0.25
0.30
0.35
0 50 100 150 200 250
Discharge (cfs)
TON
(mg/
L)
y = 3E-06x + 0.0721R2 = 2E-05
0.00
0.02
0.04
0.06
0.08
0.10
0.12
0 50 100 150 200 250
Discharge (cfs)
PO4 (
mg/
L)
y = 0.006x - 0.562R2 = 0.5803
0.0
0.1
0.2
0.3
0.4
0.5
0.6
0.7
0.8
0 50 100 150 200 250
Discharge (cfs)
TN (m
g/L)
y = 0.0003x + 0.0331R2 = 0.0559
0.0
0.0
0.0
0.1
0.1
0.1
0.1
0.1
0.2
0 50 100 150 200 250
Discharge (cfs)
TP (m
g/L)
B-4

WETLAND SOLUTIONS, INC.
y = -0.2699x + 47.155R2 = 0.1581
0.00
5.00
10.00
15.00
20.00
25.00
0 50 100 150 200 250
Discharge (cfs)
Cop
per (
µg/L
)
y = -0.5577x + 93.845R2 = 0.5298
0.00
5.00
10.00
15.00
20.00
25.00
30.00
35.00
40.00
45.00
0 50 100 150 200 250
Discharge (cfs)
Zinc
(µg/
L)
y = 0.0013x + 0.0666R2 = 0.0067
0.00.10.20.30.40.50.60.70.80.91.0
0 50 100 150 200 250
Discharge (cfs)
Mer
cury
(µg/
L)
B-5