in the frontal area spm’s impact dampens the promotion
TRANSCRIPT

We appreciate the thoughtful and helpful comments on our manuscript. We reply below. Original
text from reviewers in black color and our answers are in blue color. Some contents were added
in the supplementary materials, which are referred to in our answer.
1) The present limitation to only organic SPM is not acceptable to describe the dynamics
of suspended matter realistically enough, in particular in the southern North Sea.
We agree that inorganic SPM has the potential to reduce primary production, specifically in
tidally influenced shallow water. We considered this effect through a slightly elevated
background attenuation (line120 in the submitted version, Eq.S2 in the supplementary materials).
We further assumed that the spatial variability in SPM can be neglected for the sensitivity study
performed here. However, the reviewer is right and our assumption needs to be verified. We
agree that the impact of inorganic matter on light attenuation merits further analysis and have
performed further sensitivity experiment to verify our assumption, which we discuss below. We
will include a respective discussion as outlined below in a revised version of the manuscript.
To address the uncertainties related to SPM, we tested the effect of spatial-temporal varied
inorganic SPM on our findings while performing an additional numerical sensitivity experiment.
Here we implemented a climatological SPM filed (daily resolution, with 31 vertical layers)
(Fig.S1) and added the SPM’s contribution explicitly in the light attenuation scheme. Details of
the SPM data set and implementation are given in the supplementary material. By running the
tidal/non-tidal scenarios again using the new light attenuation scheme, we evaluated the impact of
tides on NPP firstly by comparing annual mean NPP between tidal scenario and non-tidal
scenario. We found the most significant change appearing in the frontal area where the tidal
induced NPP elevation was decreased by about 10 𝑔𝐶𝑚−2𝑦−1 (Fig.S2) compared to the original
version (Fig. 2c), which indicates that in the frontal area SPM’s impact dampens the promotion
process on NPP by nutrients pumping. However, the positive and negative responding pattern as
identified by the original simulations remain consistent even after considering spatial and
seasonal variations in SPM (Fig.S2). This confirms that the general mechanism discussed in the
manuscript and our conclusions regarding the former parameterizations remain valid.
Many earlier published studies support our assumption and the conclusion of the additional
sensitivity experiment. First, with regard to the seasonality, SPM concentration and contribution
to turbidity are low during summer (see also Fig.S1), (Capuzzo et al., 2013; Dobrynin et al.,
2010), which is critical in our analysis since most differences in NPP actually occur and
accumulate in summer. Measurements suggested that in the central North Sea, the water body
itself triggers most of the attenuation; in Oyster grounds, attenuation has been controlled to a
large extend by CDOM and phytoplankton; SPM in the surface layer decreases after the onset of
stratification (Jones et al., 1998). The SPM is more relevant to attenuation in nearshore area due
to cliff erosion and river input. Astoreca et al. (2009) suggested that CDOM is mainly derived
from local autochthonous rather than terrestrial source in offshore waters (salinity>34). The
relevance to turbidity of fluvial SPM is confined to river mouths because SPM deposits quickly
(Pleskachevsky et al., 2011; Siegel et al., 2009). In spring, simulation study in the German Bight
found that implementing SPM is only critical at the onset of bloom, given reasonable
parameterization, similar bloom amplitude was achieved in both scenarios including or omitting

SPM (Tian et al., 2009). Horizontally, organic suspended matter shares a high fraction of total
suspended matter (TSM) in most areas in the southern North Sea except in very near shore areas.
The area where inorganic matter dominates reaches 8.5°𝐸 in stormy season (autumn) and are
confined further inshore in summer (Schartau et al., 2018). The inorganic suspended matter
dominating areas are in the negative responding regions based on our simulation results (Fig.2c).
Considering enhanced resuspension and further attenuation caused by tidal forcing, the NPP in
the near shore area would also respond negatively.
The distribution of inorganic suspended matter is influenced by many factors, such as
transportation with residual currents, aggregation with organic matter, type of benthic sediments
and so on. Clearly, interaction processes as mentioned above cannot be resolved by implementing
a climatological SPM field. Thus, the numerical experiment presented can are a first step towards
understanding tidal impacts, and future studies are suggested, given reasonable boundary
conditions of inorganic matter from benthic sediments and river inputs as well as a more
reasonable representation of bio-physical interactions related to inorganic matter. However, this
is beyond the scope of the current study and should be emphasized more thoroughly in future
work.
(2)As stated, compared to their reference paper Daewel & Schrum (2013), the implementation of
the SPM dynamics was significantly modified. If this is the case, a thorough validation of this
strongly modified scheme is indispensable, in particular since SPM dominates the light
attenuation.
Yes, we agree that due to the modification of the parameterization, an assessment of the changed
model performance is necessary. New parameterizations of sedimentary respiration and light
shading have been implemented in the new version (following Nissen, 2014)). Therefore, we will
add a discussion of changes in mean primary production pattern and we will repeat the validation
exercise proposed by Daewel and Schrum, (2013)) focusing on surface nutrient concentration,
and compared results from with and without the new parameterizations. We found only small
changes in production pattern from the new parameterization introduced (Fig S4). Frontal
production is slightly enhanced and production increased slightly in deeper stable stratified
waters and decreased weakly near the coast. The rigid validation of nutrient surface
concentrations also revealed only small changes (Fig.S3). Here we found that the performance of
the model in the North Sea region is rather stable and changes only marginally. The validation
will be included in the revised manuscript.
(3) General criticism of minor importance is the missing predation by fish and higher trophic
levels. This deficit is only mentioned in the conclusions. However, a more serious discussion of
this aspect would definitely be appropriate, in particular since it was noted in line 129 that the
predator - prey interaction is considered, which at the first glance is even misleading.
We agree that the definition of predator-prey interaction is misleading and will define this more
appropriately as predator-prey interaction at lower trophic levels between the considered
functional groups of zooplankton and phytoplankton in the model.
Since the North Sea can in general be considered as bottom-up controlled (Daewel et al., 2014;
Heath, 2005), using a lower trophic level model for investigating tidal impacts on NPP is a valid

approach. Although situations with clear top-down control on zooplankton has been observed
(Munk and Nielsen, 1994), these events occurred highly restricted in time and space and assumed
to be only of minor relevance for the general processes described in this manuscript. However,
we will include a more thorough discussion about the relevance of fish predation in the
discussion. In previous studies, which addressed similar scientific question, constant grazing rate
(Sharples, 2008) or grazing loss being proportional to phytoplankton biomass (Cloern, 1991)
were prescribed in their simulations. In this study, we utilize a lower trophic level NPZD-type
model only considering lower trophic level dynamics up to zooplankton, which is simulated as a
state variable considering feeding preference, growth, excretion and mortality. Fish predation is
only implicitly considered as part of the zooplankton mortality rate. Simulations with ECOSMO
E2E (an updated version of the ECOSMO model) including functional groups for fish and
macrobenthos revealed that temporal and spatial variations in zooplankton mortality due to fish
predation are determined by the specific hydrodynamics of the North Sea (Daewel et al., 2018).
Repeating a similar study with an NPZD-Fish model would be interesting, however, beyond the
scope of our study.
(4) Line 138: The term “southern coast” should be specified more clearly.
Yes, we agree that this term is ambiguous. In the updated version, we change it as “European
continental coast”.
(5) Line 280: The sentence is not clear. How can the “energy” of tidal currents interact with the
atmospheric forcing? Moreover, it is not clear whether this specific interaction process is
considered in this study. I guess so, but however, this should be stated.
We agree that it is necessary to change the way this is expressed and a similar comment was
added by reviewer 2. To address the comments of both reviewers, line 280 was changed to “In
addition to tidal forcing, atmospheric forcing and bathymetry modulates stratification (Van
Leeuwen et al., 2015) and productivity pattern (Daewel and Schrum, 2017); consequently tidal
impacts on stratification and hence primary production are subject to spatial-temporal
variability.”
(6) Line 540: Obviously, the difference to observation is larger than one order of magnitude. The
arguments, which are presented to defend this inconsistency are not fully convincing to explain
such a very large discrepancy. In particular, the argument given at line 547 that observations over
a few days between July and August cannot be compared with seasonally averaged model data is
not acceptable. It should be easy to extract the actual observation period from a 25 years’ model
results data set.
This seem to be a misunderstanding. Here we explore a discussion and conclusion by Richardson
et al. (2000). The upscaling of the short-term observation to seasonal pattern was initially
proposed by Richardson et al. (2000). They upscaled their measured NPP (4-6 𝑔𝐶𝑚−2per spring
neap cycle during 29 July to 4 August, 1997, in their publication) to the whole stratified season
(May to October) which contains 6-8 times of spring neap cycle as they assumed. Based on this
simple upscaling, they suggested NPP contributed by the spring neap cycle of about 24-48
𝑔𝐶𝑚−2𝑦−1. We believe that this upscaling is too simplistic and discussed the mean local
impacts based on our simulations to provide dynamically consistent estimates. Making use of our
simulations, we have analyzed monthly variability regarding to the NPP contributed by tides. As
we have pointed out in our manuscript (line 547-553), the strongest contribution by tides to NPP

is in June, July and August; in other seasons, the contributions are weaker or even negative. In
the supplementary materials, we also provided monthly mean contribution to NPP by tides to
prove that the monthly variability is considerable and has to be considered (Fig. S5). To avoid
misunderstanding, we replace the sentence in line 536: “The subsurface NPP attributed by nitrate
fluxes driven by spring-neap tides by Richardson et al. were 4-6 𝑔𝐶𝑚−2 for one spring-neap
cycle; considering 6-8 times of spring neap cycle during the whole stratified season per year, they
did an upscaling and proposed that the additional NPP contributed by the spring neap cycle was
in the range of 24-48 𝑔𝐶𝑚−2𝑦−1. ”
We added a direct comparison between our results with the observations made by Richardson.
For the comparison between our simulation and Richardson’s observation, we have extracted
NPP at the exact location where they did their measurements for the same period (29/07-04/08
1997 in Richardson et al., 2000. We extended it to 26/07/1997-08/08/1997 to cover a full spring-
neap cycle). In the previous version, we only used the NPP generated in the subsurface layer to
make comparison, since they stated that the NPP was mainly generated in the subsurface layer
(Richardson et al., 2000). However, in their study, they used the integrated oxygen surplus in the
whole water column to estimate NPP. We think it would make more sense to use integrated NPP
in our simulation to compare with Richardson et al.’s results. It is true that our simulated changes
in NPP is smaller than the observed changes at the same location (the magenta transect, Fig.S6,
Table S1). However, we found substantial small scale variability in the response to tidal forcing
at the order of a gird cell (Fig. S6) and only at a distance of several grid points further south
where the front exactly locates in our simulation (the black transect, Fig.6), the modelled tidal
contribution (M2+S2) reaches the level with the observed value (Table. S1). We think that the
discrepancy stem from uncertainties introduced by unresolved sub-scale processes, which remain
unconsidered in a 10km x 10 km model resolution and coarse scale atmospheric forcing
(NCEP/NCAR reanalysis); intensity of simulated fronts is likely influenced. Keeping the
uncertainties in estimating the exact location of a front in mind when comparing to point-
observations, we think that the overall response of the model is rather consistent with
observations and can be used to assess the overall tidal vs the spring-neap tidal impact to update
Richardson et al. estimates of tidal impacts on primary production and to conclude improved
seasonal mean estimates.
We will improve the discussion in the revised manuscript to clarify our point.
Reference
Astoreca, R., Rousseau, V. and Lancelot, C.: Coloured dissolved organic matter (CDOM) in
Southern North Sea waters: Optical characterization and possible origin, Estuar. Coast. Shelf Sci.,
85(4), 633–640, doi:10.1016/j.ecss.2009.10.010, 2009.
Capuzzo, E., Painting, S. J., Forster, R. M., Greenwood, N., Stephens, D. T. and Mikkelsen, O.
A.: Variability in the sub-surface light climate at ecohydrodynamically distinct sites in the North
Sea, Biogeochemistry, 113(1–3), 85–103, doi:10.1007/s10533-012-9772-6, 2013.
Cloern, J. E.: Tidal Stirring and Phytoplankton Bloom Dynamics in an Estuary, J. Mar. Res.,
49(1), 203–221, doi:10.1357/002224091784968611, 1991.
Daewel, U. and Schrum, C.: Simulating long-term dynamics of the coupled North Sea and Baltic
Sea ecosystem with ECOSMO II: Model description and validation, J. Mar. Syst., 119–120, 30–

49, doi:10.1016/j.jmarsys.2013.03.008, 2013.
Daewel, U. and Schrum, C.: Low-frequency variability in North Sea and Baltic Sea identified
through simulations with the 3-D coupled physical-biogeochemical model ECOSMO, Earth Syst.
Dyn., 8(3), 801–815, doi:10.5194/esd-8-801-2017, 2017.
Daewel, U., Hjøllo, S. S., Huret, M., Ji, R., Maar, M., Niiranen, S., Travers-Trolet, M., Peck, M.
A. and Van De Wolfshaar, K. E.: Predation control of zooplankton dynamics: A review of
observations and models, ICES J. Mar. Sci., doi:10.1093/icesjms/fst125, 2014.
Daewel, U., Schrum, C. and Macdonald, J.: Towards End-2-End modelling in a consistent
NPZD-F modelling framework (ECOSMOE2E_vs1.0): Application to the North Sea and Baltic
Sea, Geosci. Model Dev. Discuss., (November), 1–40, doi:10.5194/gmd-2018-239, 2018.
Dobrynin, M., Gayer, G., Pleskachevsky, A. and Günther, H.: Effect of waves and currents on the
dynamics and seasonal variations of suspended particulate matter in the North Sea, J. Mar. Syst.,
82(1–2), 1–20, doi:10.1016/j.jmarsys.2010.02.012, 2010.
Heath, M. R.: Changes in the structure and function of the North Sea fish foodweb, 1973-2000,
and the impacts of fishing and climate, ICES J. Mar. Sci., doi:10.1016/j.icesjms.2005.01.023,
2005.
Jones, S. E., Jago, C. F., Bale, a J., Chapman, D., Howland, R. J. M. and Jackson, J.:
Aggregation and resuspension of suspended particulate matter at a stratified site in the southern
North Sea: physical and biological controls, Cont. Shelf Res., 18, 1283–1309,
doi:10.1016/S0278-4343(98)00044-2, 1998.
Van Leeuwen, S., Tett, P., Mills, D. and Van Der Molen, J.: Stratified and nonstratified areas in
the North Sea: Long-term variability and biological and policy implications, J. Geophys. Res. C
Ocean., 120(7), 4670–4686, doi:10.1002/2014JC010485, 2015.
Munk, P. and Nielsen, T. G.: Trophodynamics of the plankton community at Dogger Bank:
Predatory impact by larval fish, J. Plankton Res., doi:10.1093/plankt/16.9.1225, 1994.
Nissen, C.: Physical-Biogeochemical Couplings in the Land-Ocean Transition Zone, The
University of Bergen. [online] Available from: http://hdl.handle.net/1956/18682, 2014.
Pleskachevsky, A., Dobrynin, M., Babanin, A. V., Günther, H. and Stanev, E.: Turbulent Mixing
due to Surface Waves Indicated by Remote Sensing of Suspended Particulate Matter and Its
Implementation into Coupled Modeling of Waves, Turbulence, and Circulation, J. Phys.
Oceanogr., 41(4), 708–724, doi:10.1175/2010JPO4328.1, 2011.
Richardson, K., Visser, A. W. and Bo Pedersen, F.: Subsurface phytoplankton blooms fuel
pelagic production in the North Sea, J. Plankton Res., 22(9), 1663–1671,
doi:10.1093/plankt/22.9.1663, 2000.
Schartau, M., Riethmüller, R., Flöser, G., Beusekom, J. E. E. Van, Krasemann, H., Hofmeister,
R. and Wirtz, K.: On the separation between inorganic and organic fractions of suspended matter

in a marine coastal environment, Prog. Oceanogr.,
doi:https://doi.org/10.1016/j.pocean.2018.12.011, 2018.
Sharples, J.: Potential impacts of the spring-neap tidal cycle on shelf sea primary production, J.
Plankton Res., 30(2), 183–197, doi:10.1093/plankt/fbm088, 2008.
Siegel, H., Gerth, M., Heene, T., Ohde, T., Rüß, D. and Kraft, H.: Hydrography, currents and
distribution of suspended matter during a dumping experiment in the western Baltic Sea at a site
near Warnemünde, J. Mar. Syst., doi:10.1016/j.jmarsys.2008.04.005, 2009.
Tian, T., Merico, A., Su, J., Staneva, J., Wiltshire, K. and Wirtz, K.: Importance of resuspended
sediment dynamics for the phytoplankton spring bloom in a coastal marine ecosystem, J. Sea
Res., 62(4), 214–228, doi:10.1016/j.seares.2009.04.001, 2009.

Supplementary materials
1) Impact of SPM. To estimate the impact of SPM on the under-water light climate in the
simulation, we implemented a climatological SPM filed of the North Sea (with daily
resolution and 31 vertical layers) in our simulation. This SPM filed was derived from
statistical regression model which considers tidal currents, salinity and water depth (Heath
et al., 2002). This SPM filed is able to resolve spatial distribution pattern and seasonal
cycling of SPM concentration in the North Sea (Fig.S1). This SPM field has been applied
in many hydrodynamic-biogeochemical coupling (Große et al., 2016; Kerimoglu et al.,
2017).
Taking the parameterization scheme in (Tian et al., 2009), we evaluate shading effect due
to SPM as:
𝐾𝑑𝑠𝑝𝑚 = 𝑘𝑠𝑝𝑚 ∙ √𝑆𝑃𝑀 (S1)
The 𝑘𝑠𝑝𝑚 was set as 0.02 𝑚2𝑔−1. We added the contribution of SPM to the light shading
scheme as described in the paper (Eq.1 in the submitted version). We decreased the
background attenuation co-efficient 𝑘𝑤1, 0.03 𝑚−1, to 0.025 𝑚−1 (𝑘𝑤2) and subsequently
generated the new light shading scheme:
𝐾𝑑1 = 𝑘𝑤2 + 𝑘𝑝 ∙ 𝑃 + 𝑘𝐷𝑂𝑀 ∙ 𝐷𝑂𝑀 + 𝑘𝐷𝑒𝑡 ∙ 𝐷𝑒𝑡 + 𝑘𝑠𝑝𝑚 ∙ √𝑆𝑃𝑀 (S2)
We implemented the new light shading scheme (Eq.S2) in the simulation and evaluated
the difference in NPP contributed by tide, by comparing the annual mean NPP in tidal and
non-tidal scenarios (Fig.S2). The general pattern remain. The positive and negative
responding area hold the same distribution pattern, except for frontal areas where elevated
NPP decreases slightly when SPM impact is explicitly considered. This is because the
elevated NPP fueled by pumped up nutrients are partly offset by increased shading effects
due to SPM. However, the changes are minor and do not affect the general sensitivity
pattern.
2) Subsurface NPP compared to observation.
Table S1. NPP contributed by tidal forcing in the transect where Richardson did their
observation (Northern edge of DB) and in the transect where fronts locate in our
simulation (frontal transect), a few grid points away
Difference Tide (M2 +S2) – Tide (M2)
(𝑔𝐶𝑚−2per spring-neap cycle)
Difference Tide (M2 +S2) - no-tide (𝑔𝐶𝑚−2per spring-neap cycle)
Northern edge of DB 0.11 3.03 Frontal transect 0.14 5.987
Reference: Große, F., Greenwood, N., Kreus, M., Lenhart, H. J., Machoczek, D., Pätsch, J., Salt, L. and Thomas, H.: Looking beyond stratification: A model-based analysis of the biological drivers of oxygen deficiency in the North Sea, Biogeosciences, 13(8), 2511–2535, doi:10.5194/bg-13-2511-2016, 2016. Heath, M. R., Edwards, A. C., Patsch, J. and Turrell, W. R.: Modelling the behaviour of nutrient in the coastal waters of Scotland, , (10), 106, 2002. Kerimoglu, O., Hofmeister, R., Maerz, J. and Wenzel Wirtz, K.: A novel acclimative biogeochemical

model and its implementation to the southern North Sea, Biogeosciences Discuss., (March), 1–33, doi:10.5194/bg-2017-104, 2017. Tian, T., Merico, A., Su, J., Staneva, J., Wiltshire, K. and Wirtz, K.: Importance of resuspended sediment dynamics for the phytoplankton spring bloom in a coastal marine ecosystem, J. Sea Res., 62(4), 214–228, doi:10.1016/j.seares.2009.04.001, 2009.

Figure S1. Monthly mean of inorganic SPM concentration in the first layer (upper 5 meters)
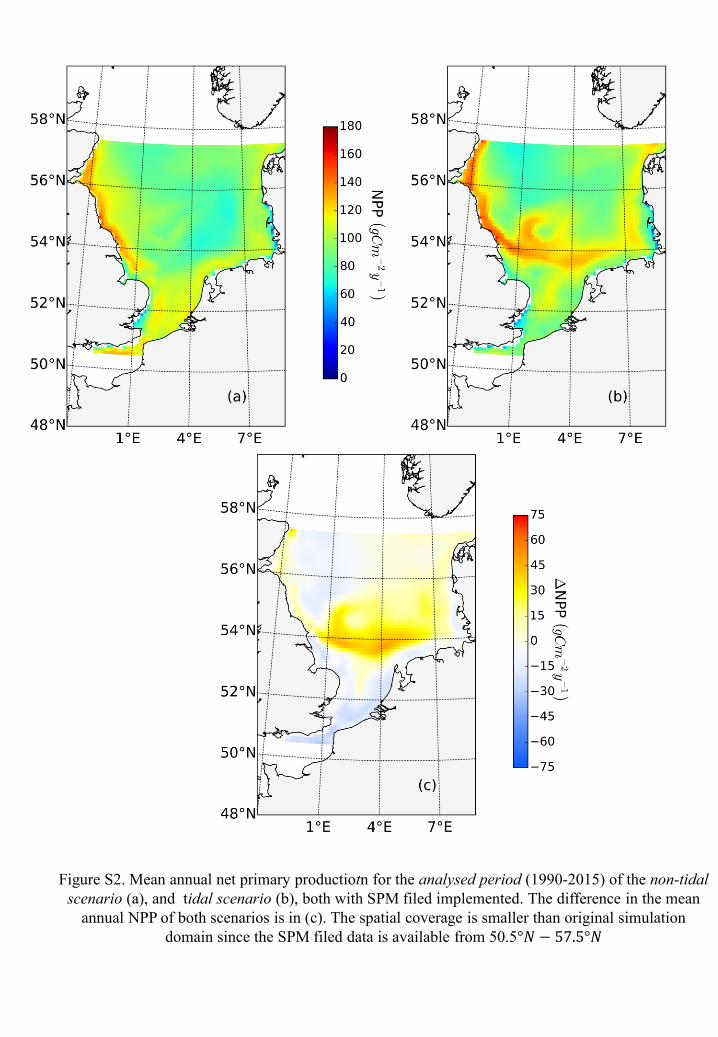
Figure S2. Mean annual net primary productiotn for the analysed period (1990-2015) of the non-tidal
scenario (a), and tidal scenario (b), both with SPM filed implemented. The difference in the mean
annual NPP of both scenarios is in (c). The spatial coverage is smaller than original simulation
domain since the SPM filed data is available from 50.5°𝑁 − 57.5°𝑁

Po4No3
B
C
D
E F
G
H
I J
K
L
Figure S3 Taylor diagram for surface (above 20 m) nutrient validation (model versus ICES data) in
different areas of the North Sea for phosphate (b) and nitrogen (c). Area separation is given in (a).
(a)
(c)(b)
old version (Daewel and Schrum, 2013)
new version

Figure S4. Mean annual net primary production for the analysed period
(1990-2015) of the former setup (Schrum and Daewel, 2013) (a ) and the
setup in this study (b)

May June
July August
September October
Figure S5. Monthly mean of NPP’s response to tide (M2+S2). In the subsurface layer (a) , with colorbar
ranging from -6~6 𝑔𝐶𝑚−2; for the surface layer (b), the colorbar ranges from -16~16 𝑔𝐶𝑚−2

Figure S6. Vertically integrated NPP contributed by tide (M2+S2) (a) and spring-neap tidal cycle (b)
for one spring neap cycle (26/07/1997-08/08/1997) as the same period when the measurements were
taken in Richardson et al., 2000. Magenta dots depict the location of the transects which Richardson
et al. (2000) has analyzed. Black dots depict the exact location of fronts in our simulation.