interaction of h2o with the platinum pt (001), (011), and
TRANSCRIPT

Interaction of H2O with the Platinum Pt (001), (011), and (111)Surfaces: A Density Functional Theory Study with Long-RangeDispersion CorrectionsMarietjie J. Ungerer,†,‡ David Santos-Carballal,‡,§ Abdelaziz Cadi-Essadek,‡
Cornelia G. C. E. van Sittert,*,† and Nora H. de Leeuw*,‡,#
†Laboratory for Applied Molecular Modelling, Research Focus Area: Chemical Resource Beneficiation, North-West University,Private Bag X6001, Potchefstroom 2520, South Africa‡School of Chemistry, Cardiff University, Main Building, Park Place, Cardiff CF10 3AT, United Kingdom§Materials Modelling Centre, School of Physical and Mineral Sciences, University of Limpopo, Private Bag X1106, Sovenga 0727,South Africa#Department of Earth Sciences, Utrecht University, Princetonplein 8A, 3584 CD Utrecht, The Netherlands
*S Supporting Information
ABSTRACT: Platinum is a noble metal that is widely usedfor the electrocatalytic production of hydrogen, but thesurface reactivity of platinum toward water is not yet fullyunderstood, even though the effect of water adsorption on thesurface free energy of Pt is important in the interpretation ofthe morphology and catalytic properties of this metal. In thisstudy, we have carried out density functional theorycalculations with long-range dispersion corrections [DFT-D3-(BJ)] to investigate the interaction of H2O with the Pt(001), (011), and (111) surfaces. During the adsorption of asingle H2O molecule on various Pt surfaces, it was found thatthe lowest adsorption energy (Eads) was obtained for thedissociative adsorption of H2O on the (001) surface, followedby the (011) and (111) surfaces. When the surface coverage was increased up to a monolayer, we noted an increase in Eads/H2Owith increasing coverage for the (001) surface, while for the (011) and (111) surfaces, Eads/H2O decreased. Consideringexperimental conditions, we observed that the highest coverage was obtained on the (011) surface, followed by the (111) and(001) surfaces. However, with an increase in temperature, the surface coverage decreased on all the surfaces. Total desorptionoccurred at temperatures higher than 400 K for the (011) and (111) surfaces, but above 850 K for the (001) surface. From themorphology analysis of the Pt nanoparticle, we noted that, when the temperature increased, only the electrocatalytically active(111) surface remained.
1. INTRODUCTION
Increasingly, global research is focusing on clean, renewable,and sustainable energy production. Some of the morepromising alternative methods for the production of energyinclude wind,1,2 solar,3,4 hydroelectricity,5−7 or combinationsthereof.8−13 Another potentially viable energy source ishydrogen (H2), which is an ideal energy carrier for a varietyof fuel cell applications, including in stationary, mobile, andportable power applications.14
H2 gas can be produced via a number of technologies,including from carbon-based fuels15 or from renewable sourcessuch as biomass16 and water.17,18 Among the different routesto the production of H2, the non-carbon-based hybrid sulfur(HyS) cycle has shown itself as a promising, potentially large-scale process.19,20 In this process, the net reaction is thesplitting of water into H2 and O2 via the electro-oxidation of
SO2/H2SO4. In this system, various anode catalysts have beentested,20 and metallic platinum (Pt) consistently showed bothhigh activity and stability,13,21,22 especially when it wassupported on carbon particles. Moreover, Pt is already usedas a catalyst23 in a wide variety of reactions, where water acts asa reactant or spectator, influencing the behavior of thesurface.24
Water has a complex structure; when monolayers areadsorbed on a surface, it does not only form two-dimensionalstructures, but it can also create three-dimensional structuresresembling bulk liquid water.25 Both computational andexperimental works have shown that water molecules on a
Received: June 27, 2019Revised: September 25, 2019Published: September 25, 2019
Article
pubs.acs.org/JPCCCite This: J. Phys. Chem. C 2019, 123, 27465−27476
© 2019 American Chemical Society 27465 DOI: 10.1021/acs.jpcc.9b06136J. Phys. Chem. C 2019, 123, 27465−27476
This is an open access article published under a Creative Commons Attribution (CC-BY)License, which permits unrestricted use, distribution and reproduction in any medium,provided the author and source are cited.
Dow
nloa
ded
via
CA
RD
IFF
UN
IV o
n N
ovem
ber
15, 2
019
at 1
1:44
:36
(UT
C).
See
http
s://p
ubs.
acs.
org/
shar
ingg
uide
lines
for
opt
ions
on
how
to le
gitim
atel
y sh
are
publ
ishe
d ar
ticle
s.
metal surface are arranged in several layers interacting throughan extensive hydrogen-bond network.26,27 It is thereforeimportant in computational studies that appropriate long-range dispersion interactions are included in the calculations todescribe accurately the water−metal interface,28,29 for example,by employing density functional theory (DFT) methods withvan der Waals corrections.30,31 Another challenge in modelingthe adsorption of water on a metallic surface is the highfluctuations in the atomic positions in a liquid, which requiresthe inclusion of several different configurations32,33 in theinitial computational setup. It has been shown34,35 that themost reliable computational results are not necessarilyobtained via the addition of more waters to a surface but,more importantly, by considering the way the water moleculesinteract with each other through the creation of hydrogenbonds and higher-order structures, including hexamers,heptamers, and octamers. However, the detailed descriptionof the binding of water molecules onto Pt surfaces is still notcomplete, even though it is important for the improvement ofthe catalytic properties of the Pt material that we understandthe fundamental reaction processes that take place on the Ptcatalytic surface. The starting point here will be an in-depthunderstanding of the interactions between the water moleculesand the metal surface atoms.In this paper, we have used DFT calculations to predict the
interaction of water with the Pt (001), (011), and (111)surfaces. We examine the electronic properties of the system,including simulated scanning tunneling microscopy (STM)images, the work function, and local densities of states. Surfacephase diagrams have also been generated through consid-eration of the surface free energies and water chemicalpotential to determine the effects of temperature and pressureon the surface coverage. The aim of our study was thedevelopment of a comprehensive understanding of the water−surface chemistry, including adsorption and desorption and theeffect of water on the electrocatalytically active surfaces ofplatinum metal.
2. COMPUTATIONAL METHODS2.1. Calculation Details. The Vienna Ab Initio Simulation
Package (VASP)36−39 was used to simulate the Pt surfaces andtheir interactions with water. The projector augmented wave(PAW)40,41 potential was employed to describe the interactionbetween the valence and the core electrons. The core electronsof Pt and O were defined up to and including the 5p and 1sorbitals, respectively. For the H atoms, all the electrons weretreated as valence electrons. The Perdew, Burke, and Ernzerhof(PBE)42,43 functional within the generalized gradient approx-imation (GGA) was applied in all calculations. Plane waveswere included to a cutoff of 400 eV. The Methfessel−Paxtonscheme order 145 was used with a smearing of 0.05 eV todetermine the partial occupancies during geometry optimiza-tion, ensuring an electronic entropy of less than 1 meV·atom−1.However, the tetrahedron method with Blochl corrections46
was used in the final static simulations to obtain accurate totalenergies, charges, and density of states. The electronic andionic optimization criteria were 10−5 eV and 10−2 eV·Å−1,respectively, and the conjugate gradient technique was adoptedfor the geometry optimizations.Pt has an Fm3m crystal structure.47 The bulk Pt structure
was calculated within a primitive face-centered cubic (fcc) cellusing a Γ-centered 17 × 17 × 17 Monkhorst-Pack48 k-pointmesh. Our calculated fcc Pt lattice constant was 3.926 Å, in
excellent agreement with the experimental value of 3.924Å.49,50
The Pt (001), (011), and (111) surfaces were investigatedby simulating the periodic p(3 × 3), p(3 × 3), and p(4 × 4)supercells, respectively, which were generated from the bulkusing the METADISE code.51 Vacuum of 15 Å, in the zdirection, was added to avoid interaction between theneighboring cells. Four atomic layers were considered for theslabs, and the surface areas of the supercells were 138.17,196.18, and 106.79 Å2 for the (001), (011), and (111)surfaces, respectively. The atoms in the two bottom layers ofthe supercell were fixed in the calculated bulk locations, andthe atoms in the remaining two layers were allowed to relax. AΓ-centered 7 × 7 × 1 Monkhorst-Pack k-point grid was used inall the surfaces to sample the Brillouin zone.The unrelaxed (γu) and relaxed (γr) surface energies were
determined using eqs 1 and 2, respectively
E N E
A2uslab,u Pt,slab Pt,bulk
slabγ =
−
(1)
E N E
Arslab,r Pt,slab Pt,bulk
slabuγ γ=
−−
(2)
where Eslab, u, Eslab, r, and EPt, bulk are the energies of theunrelaxed slab, the half-relaxed slab, and the bulk, respectively.NPt, slab and Aslab represent the number of Pt atoms in the slaband the surface area of the slab, respectively. The percentage ofrelaxation (R) was calculated as the difference between theunrelaxed and relaxed surface energies, divided by theunrelaxed surface energy, multiplied by 100.Atomic charges were obtained using the Bader analysis,52−55
which partitions space into nonspherical atomic regionsenclosed by local minima in the charge density. TheTersoff−Hamann56 approach was used to simulate scanningtunneling microscopy (STM) images. In this approach, thetunneling current is proportional to the local density of states(LDOS) of the surface at the position of the tip integratedbetween the Fermi level and the applied bias. The STM imageswere mapped in terms of the height as a function of the tipposition over the surface using the HIVE57 program.The isolated H2O molecule was modeled in a periodic box
of 12 × 13 × 14 Å3 to ensure negligible interaction with itsimages of neighboring cells. The Gaussian smearing scheme45
was used during geometry optimization and energy calcu-lations with a smearing of 0.05 eV. A Γ-centered 1 × 1 × 1Monkhorst-Pack48 k-point mesh was also used. Dipolecorrections were added in all directions, and the H2O moleculewas computed without symmetry.
2.2. Coverage-Dependent Surface Energies. Theaverage adsorption energy Eads per water molecule on the Ptsurface was calculated as follows58
EN
E E N E1
( )N Nads
wslab,r
0slab,r
0w w
w w= [ − + ]≠ =
(3)
where Eslab, rNw ≠ 0, Eslab, r
Nw = 0, and Ew are the energies of the slab withthe water molecules adsorbed, the clean surface, and theisolated water molecule, respectively. Nw corresponds to thenumber of adsorbed water molecules.To determine the thermodynamics of different H2O
coverages on Pt (001), (011), and (111) surfaces, the surfacefree energy (σ) is calculated for different temperatures (T) and
The Journal of Physical Chemistry C Article
DOI: 10.1021/acs.jpcc.9b06136J. Phys. Chem. C 2019, 123, 27465−27476
27466

H2O chemical potential (μw). The resulting change in surfacefree energy upon H2O adsorption is denoted as
T pA
E E N( , )1 N N
slabslab,r
0slab,r
0w w
w wσ μΔ = [ − − · ]≠ =
(4)
Surface coverage (θ) represents the number of adsorbed watermolecules (Nw) divided by the total number of adsorption sites(N) as
NN
wθ =(5)
θ = 0 indicates that no adsorption has taken place, while θ =1shows that adsorption has reached a monolayer.The chemical potential of molecular H2O in the gas phase
can also be expressed as
T p E G T p k Tpp
( , ) ( , ) lnw w w 0 B0
μ = + Δ +(6)
where Ew is the DFT energy of the H2O molecule, ΔGw(T, p0)is the Gibbs free energy difference per H2O molecule between0 K and T at p0 = 1 bar, which has been extracted fromthermodynamic tables.59 The last term (k T ln p
pB0) denotes the
free energy change of H2O gas at constant temperature (T)when the partial pressure changes from p0 to p. To express thechemical potential, independent of the calculated quantities,the energy of water was omitted from eq 6 and added to eq 4.To determine the effect of H2O adsorption on the Pt (001),
(011), and (111) surfaces, Wulff morphologies60 wereconstructed using the GDIS program.61 The equilibriumWulff crystal is constructed, assuming that the distance of thecrystal face (d001, d011, d111) to the center of the nanoparticle isproportional to their surface free energies as
d d d001
001
011
011
111
111σ σ σ= =
(7)
3. RESULTS AND DISCUSSION3.1. Surface Structures. Figure 1 shows the side and top
views of the Pt (001), (011), and (111) surfaces as constructedfor our simulations. All three surfaces are planar, bulk-terminated structures, with four layers in each slab. All threesurfaces were nonpolar, with the Pt (001) being a smoothsurface, Pt (011) being atomically rough and forming channelson the surface, and Pt (111) again being smooth with an fccarrangement. It has been shown that long-range dispersionapproximations influence not only the lattice parameters of amodeled surface, but also the surface energy of the surface.62
To optimize the geometry of the Pt (001), (011), and (111)surfaces, three different long-range dispersion approximationswere tested, including (i) without dispersion interactions(DFT), (ii) the DFT-D2 method of Grimme,63 (iii) the zerodamping DFT-D3 method of Grimme,64 and (iv) the DFT-D3method with Becke−Johnson damping.44
Table 1 shows the lattice parameters, relaxed and unrelaxedsurface energies, and the surface areas for the Pt (001), (011),and (111) surfaces, as determined using the different long-range dispersion correction approximations. From the latticeparameters, it was seen that the best correlation was obtainedusing the DFT-D3(BJ) method, followed by the DFT-D3,DFT, and DFT-D2 methods. The experimental latticeparameter of Pt is 3.925 Å,65 which was overestimated by
0.03 and 1.1% by the DFT-D3(BJ) and standard DFTmethods, while with DFT-D3 and DFT-D2, it was under-estimated by 0.2 and 2.1%, respectively. In terms of surfaceenergy, all methods followed the same trend where Pt (111)has the lowest surface energy, followed by the (001) and (011)surfaces. An experimental surface energy of 2.48 J/m2 has beenreported in the literature,66 and compared to this priorinvestigation, the DFT method underestimates the energies by48, 37, and 65% for the Pt (001), (011), and (111) surfaces,respectively, while DFT-D2 overestimates the energies for allthree surfaces by 68, 78, and 60%, respectively. The bestcorrelation for surface energies was with DFT-D3 and DFT-D3(BJ) methods, both of which have less than 18% deviationfor all the surfaces with respect to the experiment, which alsocorrelated with the literature.67
A number of calculations were benchmarked using the opt-PBE self-consistent van der Waals functional29,68 and found thelattice parameter of 3.841 Å, which compares to the DFT-D2method. Furthermore, the unrelaxed (γu) and relaxed (γr)surface energies were underestimated at 1.633 and 1.603 J/m2,respectively, when compared to 2.17 eV obtained with themodified embedded-atom method.69
Taking all of the data into consideration, the DFT-D3(BJ)setting gave the best agreement with the experimental latticeparameter, but a range of different values for the surface energyhave been reported. Comparing the surface energy determinedwith the different methods for the three surfaces to theexperimental value of 2.49 J/m2,72 it can be seen that the DFT-D3(BJ) method gave the best agreement and was thereforeused in the determination of the surface properties andadsorption energies in the following sections.The work function, a descriptor inversely related to chemical
reactivity, was calculated for the pristine Pt (001), (011), and(111) surfaces (Table 1), where it was determined thatremoving an electron would be the easiest from the (001)surface, followed by the (111) and (011) surfaces. Theliterature also reports this tendency,70 with the lowest workfunction for the (011) surface, followed by (001) and (111)surfaces, which were, however, dependent on the surface areaand modeling approximation used. The work function alone
Figure 1. Side and top views of the Pt (001), (011), and (111)surfaces. The symmetrically inequivalent adsorption sites for H2O areindicated, that is, fourfold hollow (4F), bridge (B), atop (A), face-cubic centered (fcc), and hexagonal close packed (hcp) sites. Thegold color is used throughout this paper for Pt.
The Journal of Physical Chemistry C Article
DOI: 10.1021/acs.jpcc.9b06136J. Phys. Chem. C 2019, 123, 27465−27476
27467

cannot be used to predict reactivity though as it is dependenton the surface properties, as well as the temperature.74
The positions of the d-band center have been used before toexplain adsorption tendencies on transition metal surfaces.75
The general trend is that the higher in energy the occupied d-states, the stronger the bond with a molecule that acceptselectrons from the metal. Among the three surfaces, it wascalculated (Table 1) that the Pt (111) surface had the highestd-band center energy, followed by the (001) and (011)surfaces. We found that our calculated d-band center for the Pt(111) surface is in excellent agreement with the value of −2.45eV reported by Xin et al.73
STM images were simulated for the optimized Pt surfacesand derived from the spatial distribution of the valence bandstates in the vicinity of the Fermi level (EF). Figure 2 showsour STM images for the Pt (001), (011), and (111) surfaces.For Pt (001), a checker board-like structure can be seen, whichis similar to the pattern reported for Cu(100)76 andAg(100).77 For Pt (011), the grooves formed in the [001]direction on the surface are evident, with every second rowhigher in the surface shown in a darker color, which means thatthey are closer to the scanning tip. The alternating rows in the[010] direction are lower and therefore in a lighter gray color.
This missing row arrangement was also reported by Feenstraand Hla78 for the isostructural fcc Au (110) surface. The STMimage of the Pt (111) shows the honeycomb structure of Pt, asreported in previous experimental findings.79 As these are allpristine surfaces, no deformations or reconstructions wereobserved.
3.2. Single H2O Molecule Adsorption. Figure 1 showsthe side and top views of the Pt (001), (011), and (111)surfaces, where we have indicated all the possible uniqueadsorption sites for H2O. The (001) and (011) surfaces havefourfold hollow (4F), bridge (B), and atop (A) sites, while the(111) surface has bridge (B), top (T), face-centered cubic(fcc), and hexagonal close-packed (hcp) sites. Three differentadsorption modes80 were investigated on each surface, onewhere the H2O molecule is parallel to the Pt surface and allthree atoms could interact with the surface, the second whereone H was turned upward and only the OH could interact withthe surface, and the third where one of the H atoms was turneddownward to interact with the Pt surface. All three adsorptionmodes were investigated for each adsorption site shown inFigure 1.Water on metal surfaces is usually believed to be intact,
except when coadsorbed with other molecules or atoms.82,83
Table 1. Lattice Parameters (a) for the Bulk Pt System, Unrelaxed (γu) and Relaxed (γr) Surface Energies, Percentage ofRelaxation (R) and the Surface Areas (A) for the Pt (001), (011) and (111) Surfaces Calculated with Several Long-RangeDispersion Correction Methodsa
surface parameter DFT DFT-D2 DFT-D3 DFT-D3(BJ) other works
a (Å) 3.968 3.841 3.918 3.926 3.92449,50
Pt (001) γu (J/m2) 1.327 4.170 2.580 2.472
γr (J/m2) 1.294 4.166 2.575 2.462 1.81,70 2.1769
R (%) 2.48 0.09 0.23 0.40A (Å2) 141.68 132.76 138.17 138.72Φ (eV) 5.89 5.6670
d-band center (eV) −2.24Pt (011) γu (J/m
2) 1.639 4.461 2.789 2.691γr (J/m
2) 1.557 4.407 2.710 2.615 1.85,70 2.3771
R (%) 5.03 1.22 2.83 2.83A (Å2) 200.36 125.16 195.40 196.18Φ (eV) 5.49 5.2670
d-band center (eV) −2.00Pt (111) γu (J/m
2) 0.871 3.961 2.209 2.055γr (J/m
2) 0.866 3.961 2.193 2.046 1.49,70 2.4972
R (%) 0.62 1.05 0.72 0.43A (Å2) 109.07 102.20 106.36 106.79Φ (eV) 5.64 5.6970
d-band center (eV) −2.44 −2.4573aThe work function (Φ) and d-band center values for these surfaces were only calculated using the DFT-D3(BJ) method.
Figure 2. Simulated STM images of the Pt (001), (011), and (111) surfaces. The density (ϱ), tip distance (d), and bias (ΔV) are also indicated.
The Journal of Physical Chemistry C Article
DOI: 10.1021/acs.jpcc.9b06136J. Phys. Chem. C 2019, 123, 27465−27476
27468
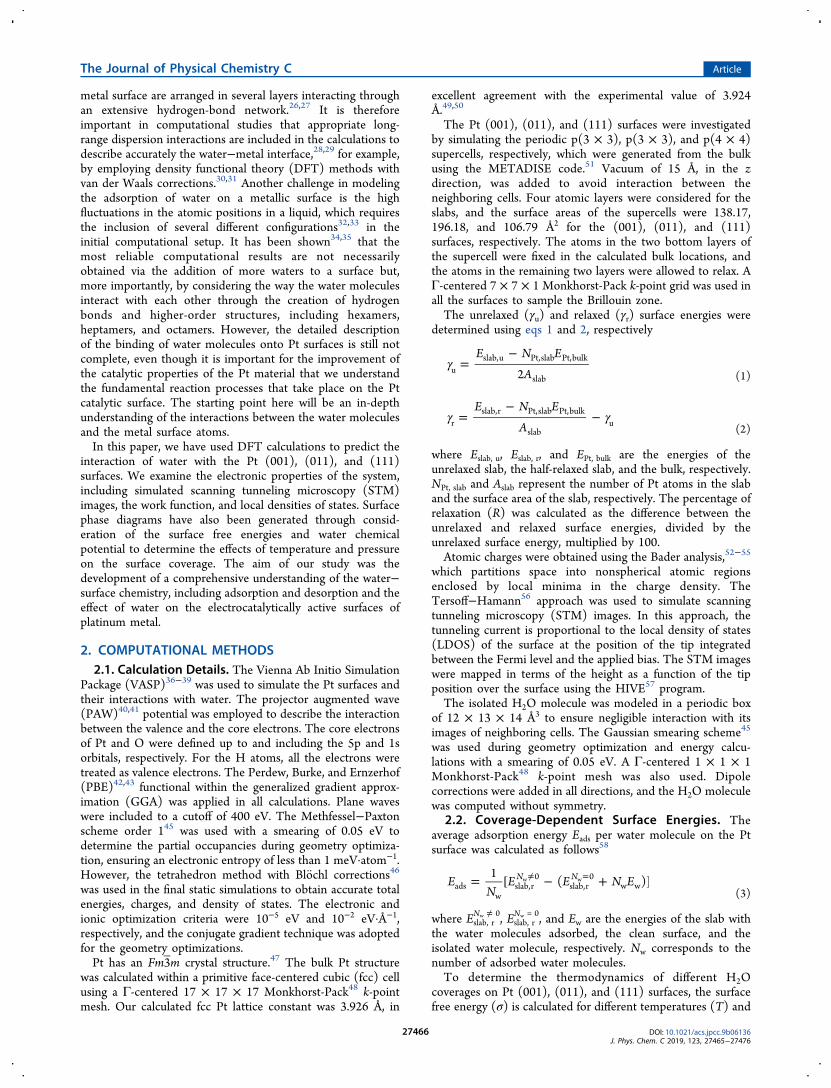
However, a recent DFT study has suggested that a waterbilayer on Ru (0001) is half-dissociated, with one O−H bondbroken in the dissociated water molecules.84 In another studyof water bilayers on Pt, up to 9% of the H2O moleculesdissociated.34 Even though it would be less likely to have asingle molecule of water dissociate on the surface, it was stilldecided to include the (001)diss data for both single adsorptionand higher surface coverage. For reasons of comparison, it wasalso decided to include the most stable dissociationconfigurations on both the (011) and (111) surfaces. Themost stable structures found for the adsorption of the watermonomer on top of the Pt surfaces are shown in Figure 3, withthe bond distances and angles of the adsorbed H2O withrespect to the Pt surfaces listed in Table 2.
On the (001) surface, two very different configurationsreleased the largest adsorption energies, that is, dissociated andmolecular H2O, which will be denoted as (001)diss and(001)mol, respectively. In the case of (001)diss, the OH groupand dissociated H atom sat in the bridge hollow site, with theO−Pt distance at 2.096 Å, hydroxy H−Pt1 distance at 2.531 Å,and hydroxy H−Pt2 distance at 2.956 Å. The H−Pt2 distancefor the dissociated H was 1.754 Å. When associativelyadsorbed on Pt (001)mol, the H2O molecule laid parallel tothe Pt surface with the H atoms directed toward the bridgehollow position, where the O−Pt distance was 2.311 Å and the
H−Pt distances were 2.831 and 2.786 Å for Pt1 and Pt2(Figure 3), respectively. The H−O−H angle correlated withexperimental values at 104.48°,81 suggesting that the water wasphysisorbed.On the (011) surface, one of the hydrogens of H2O is
pointing along the direction of the ridge it is adsorbed to,whereas the other H points toward the neighboring ridge, ascan be seen in Figure 3. The O−Pt distances on the (011)surface are slightly shorter than on the other surfaces, althoughthe H−O−H angle differs by less than 1° from the calculatedvalue for Pt (001). In the dissociated system Pt (011)diss, theOH group is bound at the oxygen to the surrounding Pt atomson the neighboring ridges, following the direction of the valley.The dissociated H atom is bound in a bridge position betweentwo Pt atoms on the ridge, which was also found by Shi andSun.85
Similar to the Pt (001)mol adsorption, on the (111) surface,the H2O molecule adsorbs flat, with one H atom directedtoward a surface Pt (Pt1) and the other in the direction of anfcc Pt (Pt2) (Figure 3). Carrasco and co-workers30 alsoshowed that the most stable single H2O molecule adsorptionwas parallel atop the Pt atom. In this work, the O−Pt distancewas calculated at 2.386 Å, and the H−O−H angle wascalculated at 104.94°, while in the literature, the O−Pt distancewas reported as between 2.49 and 2.82 Å, depending on thetype of dispersion correction method used in the calcu-lations.30 Similar to our work on the pristine surfaces, Carrascoand co-workers30 have found that, when either no dispersioncorrection, opt-PBE, or opt-B8829 was added, the O−Ptdistance correlated with our work, but when revPBE was used,it was overestimated by 15%. The DFT-D3(BJ)44,64 methodwe have used is geometry-dependent and therefore accountsfor the coordination number of the adsorbed atoms. Oursimulations suggest that water may bind more strongly to thePt (111) surface than was found previously.30 Similar to the(001)diss and (011)diss systems, adsorption of the dissociatedH2O on the (111) surface showed that the OH group is in thebridge position, where the oxygen is bound to two neighboringPt atoms. The dissociated hydrogen was in a neighboring fcchollow site, which was also reported as energetically the moststable adsorption manner of hydrogen on the Pt (111) surfaceby Shi and Sun.85
The adsorption energy for a single water molecule, Nw = 1,was calculated to be much larger on the (001) surface than the(011) and (111) surfaces, indicating that adsorption anddissociation are favored on the (001) surface. Carrasco and co-workers30 reported monomer adsorption energies for the Pt(111) surface between −0.24 and −0.40 eV, again dependingon the dispersion correction approximation chosen. Thesevalues are in fair agreement with our adsorption energycalculated for the (111) surface, again indicating somewhatstronger binding in this study compared to the literature.30
Comparing the adsorption energy of the dissociated water onall the surfaces, it can be seen that it was energetically favoredon the (001) surface, followed by the (111) and (011)surfaces. As part of the opt-PBE benchmarking, for theadsorption of both molecular and dissociative adsorption ofH2O, we found the values to be slightly endothermic at 0.108and 0.098 eV, respectively, which differed by more than 0.5 eVfrom reported values.30
Table 2 lists the simulated wavenumbers of the fundamentalvibrational modes of the adsorbed H2O molecule on the (001),(011), and (111) surfaces, which include the asymmetric
Figure 3. Lowest energy adsorption sites of H2O on Pt (001), (011),and (111) surfaces. Pt (001)diss and Pt (001)mol indicate theadsorption of dissociated and molecular H2O, respectively. Theatom colors red, white, and gold denote oxygen, hydrogen, andplatinum atoms, respectively. The lighter gold color is used todistinguish between the platinum atoms of different layers.
The Journal of Physical Chemistry C Article
DOI: 10.1021/acs.jpcc.9b06136J. Phys. Chem. C 2019, 123, 27465−27476
27469

stretching (νasym), symmetric stretching (νsym), and bending(δ) vibrational modes. For completeness, the data for thedissociated H2O adsorptions were also included. For thedissociated H2O, we can only report the OH stretching at 3558cm−1, which falls within 100 cm−1 for the stretching andbending modes, when we compare our vibrational results withexperimentally measured values.86 Comparing our results withmodeled vibrational data, these were again within 60 cm−1 forthe single H2O molecule on Pt (111).87 Due to the way thedissociated H2O adsorbed onto the (011) surface, no OHstretching could be calculated.From the charge analysis in Table 2, in the case of the
dissociated H2O, it was observed that electrons between 0.3and 0.5 e− were transferred from the Pt surfaces to themolecule, whereas in the adsorption of H2O on all threesurfaces, the molecule provided ∼0.1 e− to the Pt surface.Figure 4 shows the isosurfaces of the electron densitydifference between H2O and the Pt surfaces, which wascalculated by subtracting the electron density of a pristine Ptsurface and that of a single H2O molecule from the totalelectron density of the modeled system using the samegeometries. Yellow and blue represent positive (electron-depleted) and negative (electron-gained) electron densities,respectively. As expected, in the (001)diss system, thedissociated H atom was electron-depleted (Δq = 0.623 e−)relative to the surrounding Pt atoms, whereas the OH partfollowed a more complex pattern. However, from the Badercharge of each atom, it was seen that the OH group, as awhole, gained electrons (Δq = −1.016 e−). Dissociation on the(111) surface showed similar results, where H was electron-depleted (Δq = 0.639 e−) and the OH group gained electrons(Δq = −0.977 e−). However, even though the (011) surfacefollows the same trend, the values differ, with H becomingmore electron-depleted (Δq = 1.000 e−) and OH gainingnearly another 50% more electron density (Δq = −1.458 e−).In contrast, for molecular adsorption, that is, the (001), (011),and (111) systems, electrons were donated from the moleculeto the surface, and as also suggested by the positive Δq valuesfrom Table 2, the adsorption energies followed the same trendas the charge transfer values.3.3. H2O Surface Coverage. To consider the effect of
surface coverage, the number of adsorbed H2O molecules (Nw)was increased until a monolayer was obtained on all Pt
Table 2. Adsorption Energy (Eads), Bond Distance (d), and Angles (∠) as well as the Simulated Wavenumbers (cm−1) of theFundamental Vibrational Modes of the Adsorbed H2O Molecule on the Pt (001), (011), and (111) Surfacesa
parameter (001)diss (001)mol (011)diss (011)mol (111)diss (111)mol literature
Eads (eV) −1.758 −1.675 −0.258 −0.699 −0.380 −0.464d (Å)O−Pt 2.096 2.311 2.225 2.240 2.169 2.386H−Pt1 2.531 2.831 2.619 3.050 2.591 2.973H−Pt2 2.956, 1.754 2.786 3.292, 1.714 2.430 3.317, 1.873 3.164∠ (°)H−O−H 104.55 103.76 104.94 104.48b
Pt−O−H 104.55 97.94 102.51 99.40 104.14 97.72
νasym (cm−1) 3558 3617 3620 3572 3684 3756c, 3727d
νsym (cm−1) 3521 3178 3574 3657c, 3613d
δ (cm−1) 1365 1547 1524 1118 1553 1595c, 1552d
Δq (e) −0.393 0.109 −0.458 0.095 −0.338 0.087aThe presented vibrational modes are the asymmetric stretching (νasym), symmetric stretching (νsym), and bending (δ) modes. Charge transfer(Δq) for H2O adsorption on the different Pt surfaces is also given. bExperimental value.81 cExperimental frequency values.86 dOther modeledvibrational data.87
Figure 4. Isosurfaces of the electron density difference between H2Oand Pt (001), (011), and (111), both for the molecular anddissociative adsorbed systems. Yellow and blue represent positive(electron-gained) and negative (electron-depleted) electron densitieswith ±0.00098, ±0.00101, and ± 0.00252 e/Å3 for the molecularisosurfaces and ±0.00255, ±0.00239, and ±0.00276 e/Å3 for thedissociative isosurfaces, respectively, for Pt (001), (011), and (111).
The Journal of Physical Chemistry C Article
DOI: 10.1021/acs.jpcc.9b06136J. Phys. Chem. C 2019, 123, 27465−27476
27470
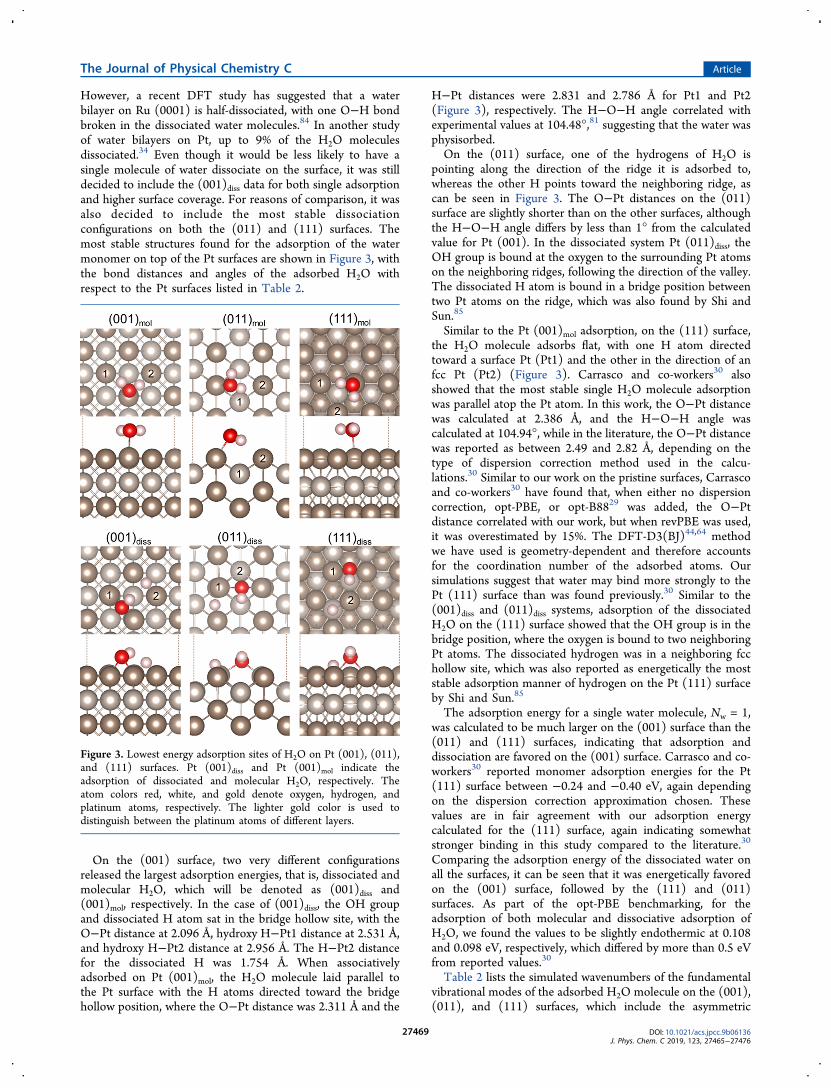
surfaces. The lowest energy configurations for single H2Oadsorption were used as the initial geometries for theincreasing surface coverages. More than 30 configurations foreach surface and at different coverages were considered, withthe lowest energy configurations shown below. Figure 5 shows
the geometries of water molecules with increasing coverages ofmolecularly adsorbed H2O until full coverage was reached. Asthe concentration increased, the adsorbed H2O molecules tendto form hexagonal rings when the metal surface allows, ascould be expected from the hexagonal structure of water ice Ias a result of donor and acceptor hydrogen bonding betweenwater molecules. As already mentioned, owing to theobservation of water dissociation on the Pt surface, weconsidered that it would be interesting to see how H2O wouldbehave in its dissociated state when a surface is fully covered,as shown in Figure 5. However, as the surface coverageincreased, the mode of adsorption remained the same; nofurther dissociation or recombination occurred during thegeometry optimizations.Similarly, it was seen on the (011) surface in Figure 6 that
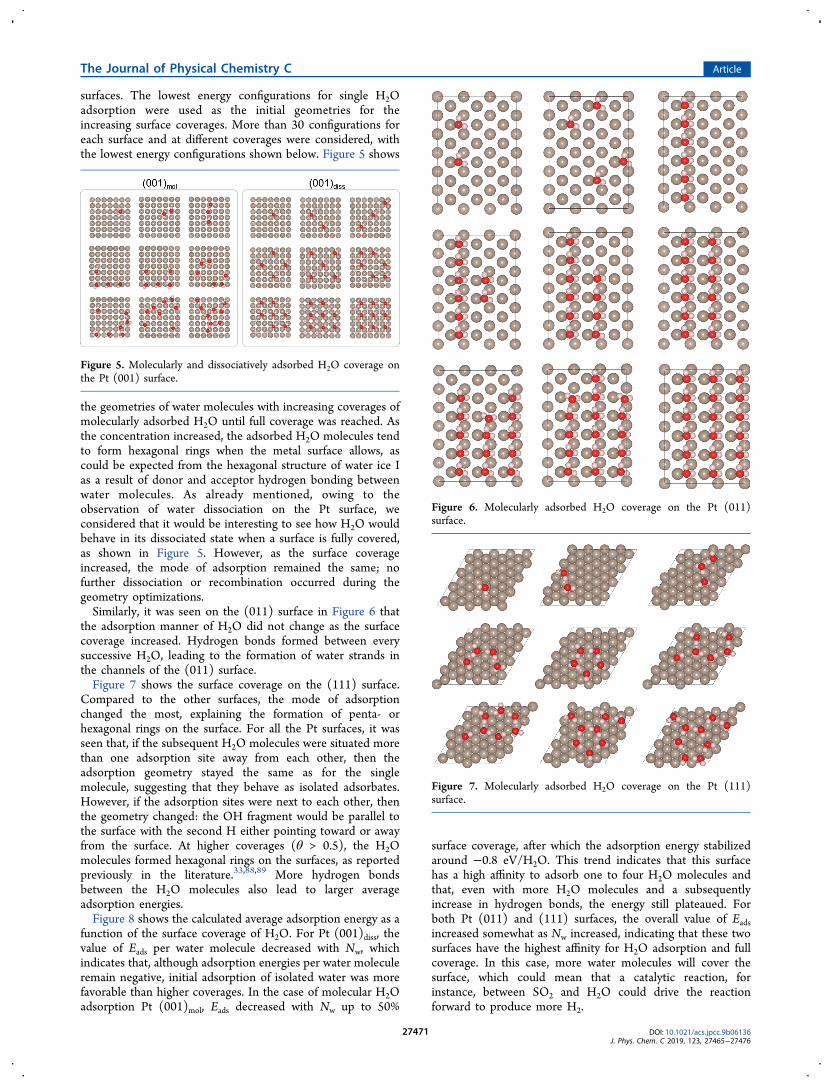
the adsorption manner of H2O did not change as the surfacecoverage increased. Hydrogen bonds formed between everysuccessive H2O, leading to the formation of water strands inthe channels of the (011) surface.Figure 7 shows the surface coverage on the (111) surface.
Compared to the other surfaces, the mode of adsorptionchanged the most, explaining the formation of penta- orhexagonal rings on the surface. For all the Pt surfaces, it wasseen that, if the subsequent H2O molecules were situated morethan one adsorption site away from each other, then theadsorption geometry stayed the same as for the singlemolecule, suggesting that they behave as isolated adsorbates.However, if the adsorption sites were next to each other, thenthe geometry changed: the OH fragment would be parallel tothe surface with the second H either pointing toward or awayfrom the surface. At higher coverages (θ > 0.5), the H2Omolecules formed hexagonal rings on the surfaces, as reportedpreviously in the literature.33,88,89 More hydrogen bondsbetween the H2O molecules also lead to larger averageadsorption energies.Figure 8 shows the calculated average adsorption energy as a
function of the surface coverage of H2O. For Pt (001)diss, thevalue of Eads per water molecule decreased with Nw, whichindicates that, although adsorption energies per water moleculeremain negative, initial adsorption of isolated water was morefavorable than higher coverages. In the case of molecular H2Oadsorption Pt (001)mol, Eads decreased with Nw up to 50%
surface coverage, after which the adsorption energy stabilizedaround −0.8 eV/H2O. This trend indicates that this surfacehas a high affinity to adsorb one to four H2O molecules andthat, even with more H2O molecules and a subsequentlyincrease in hydrogen bonds, the energy still plateaued. Forboth Pt (011) and (111) surfaces, the overall value of Eadsincreased somewhat as Nw increased, indicating that these twosurfaces have the highest affinity for H2O adsorption and fullcoverage. In this case, more water molecules will cover thesurface, which could mean that a catalytic reaction, forinstance, between SO2 and H2O could drive the reactionforward to produce more H2.
Figure 5. Molecularly and dissociatively adsorbed H2O coverage onthe Pt (001) surface.
Figure 6. Molecularly adsorbed H2O coverage on the Pt (011)surface.
Figure 7. Molecularly adsorbed H2O coverage on the Pt (111)surface.
The Journal of Physical Chemistry C Article
DOI: 10.1021/acs.jpcc.9b06136J. Phys. Chem. C 2019, 123, 27465−27476
27471
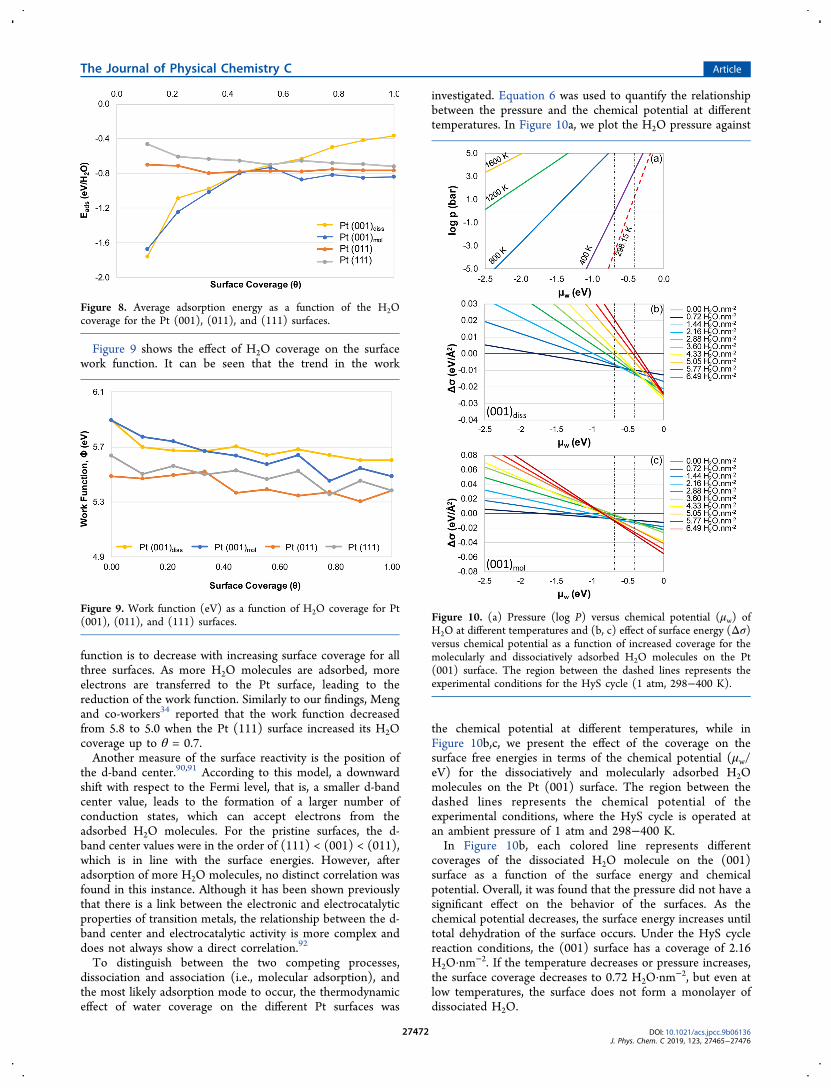
Figure 9 shows the effect of H2O coverage on the surfacework function. It can be seen that the trend in the work
function is to decrease with increasing surface coverage for allthree surfaces. As more H2O molecules are adsorbed, moreelectrons are transferred to the Pt surface, leading to thereduction of the work function. Similarly to our findings, Mengand co-workers34 reported that the work function decreasedfrom 5.8 to 5.0 when the Pt (111) surface increased its H2Ocoverage up to θ = 0.7.Another measure of the surface reactivity is the position of
the d-band center.90,91 According to this model, a downwardshift with respect to the Fermi level, that is, a smaller d-bandcenter value, leads to the formation of a larger number ofconduction states, which can accept electrons from theadsorbed H2O molecules. For the pristine surfaces, the d-band center values were in the order of (111) < (001) < (011),which is in line with the surface energies. However, afteradsorption of more H2O molecules, no distinct correlation wasfound in this instance. Although it has been shown previouslythat there is a link between the electronic and electrocatalyticproperties of transition metals, the relationship between the d-band center and electrocatalytic activity is more complex anddoes not always show a direct correlation.92
To distinguish between the two competing processes,dissociation and association (i.e., molecular adsorption), andthe most likely adsorption mode to occur, the thermodynamiceffect of water coverage on the different Pt surfaces was
investigated. Equation 6 was used to quantify the relationshipbetween the pressure and the chemical potential at differenttemperatures. In Figure 10a, we plot the H2O pressure against
the chemical potential at different temperatures, while inFigure 10b,c, we present the effect of the coverage on thesurface free energies in terms of the chemical potential (μw/eV) for the dissociatively and molecularly adsorbed H2Omolecules on the Pt (001) surface. The region between thedashed lines represents the chemical potential of theexperimental conditions, where the HyS cycle is operated atan ambient pressure of 1 atm and 298−400 K.In Figure 10b, each colored line represents different
coverages of the dissociated H2O molecule on the (001)surface as a function of the surface energy and chemicalpotential. Overall, it was found that the pressure did not have asignificant effect on the behavior of the surfaces. As thechemical potential decreases, the surface energy increases untiltotal dehydration of the surface occurs. Under the HyS cyclereaction conditions, the (001) surface has a coverage of 2.16H2O·nm
−2. If the temperature decreases or pressure increases,the surface coverage decreases to 0.72 H2O·nm
−2, but even atlow temperatures, the surface does not form a monolayer ofdissociated H2O.
Figure 8. Average adsorption energy as a function of the H2Ocoverage for the Pt (001), (011), and (111) surfaces.
Figure 9. Work function (eV) as a function of H2O coverage for Pt(001), (011), and (111) surfaces. Figure 10. (a) Pressure (log P) versus chemical potential (μw) of
H2O at different temperatures and (b, c) effect of surface energy (Δσ)versus chemical potential as a function of increased coverage for themolecularly and dissociatively adsorbed H2O molecules on the Pt(001) surface. The region between the dashed lines represents theexperimental conditions for the HyS cycle (1 atm, 298−400 K).
The Journal of Physical Chemistry C Article
DOI: 10.1021/acs.jpcc.9b06136J. Phys. Chem. C 2019, 123, 27465−27476
27472
Similarly, for the molecularly adsorbed water molecules onthe Pt (001) surface (Figure 10c), we observe that, as thechemical potential decreases, the surface energy increases. Inthe experimental region, irrespective of temperature orpressure, the surface coverage was 6.49 H2O·nm
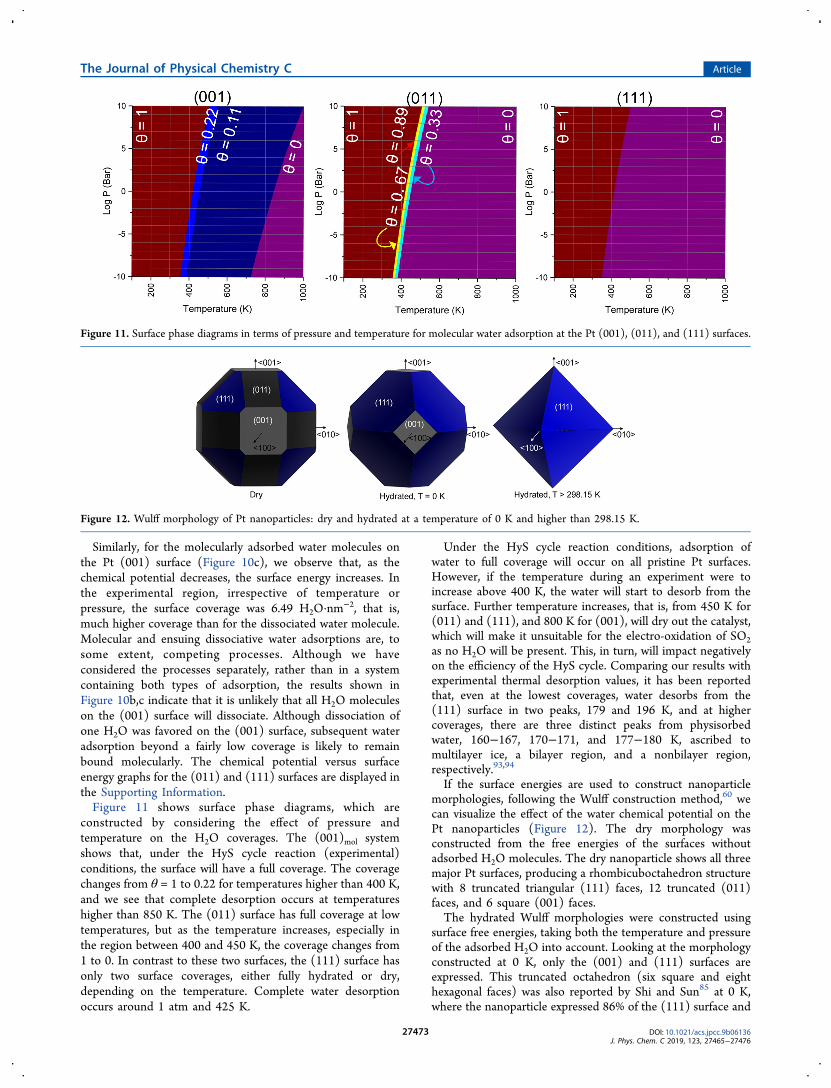
−2, that is,much higher coverage than for the dissociated water molecule.Molecular and ensuing dissociative water adsorptions are, tosome extent, competing processes. Although we haveconsidered the processes separately, rather than in a systemcontaining both types of adsorption, the results shown inFigure 10b,c indicate that it is unlikely that all H2O moleculeson the (001) surface will dissociate. Although dissociation ofone H2O was favored on the (001) surface, subsequent wateradsorption beyond a fairly low coverage is likely to remainbound molecularly. The chemical potential versus surfaceenergy graphs for the (011) and (111) surfaces are displayed inthe Supporting Information.Figure 11 shows surface phase diagrams, which are
constructed by considering the effect of pressure andtemperature on the H2O coverages. The (001)mol systemshows that, under the HyS cycle reaction (experimental)conditions, the surface will have a full coverage. The coveragechanges from θ = 1 to 0.22 for temperatures higher than 400 K,and we see that complete desorption occurs at temperatureshigher than 850 K. The (011) surface has full coverage at lowtemperatures, but as the temperature increases, especially inthe region between 400 and 450 K, the coverage changes from1 to 0. In contrast to these two surfaces, the (111) surface hasonly two surface coverages, either fully hydrated or dry,depending on the temperature. Complete water desorptionoccurs around 1 atm and 425 K.
Under the HyS cycle reaction conditions, adsorption ofwater to full coverage will occur on all pristine Pt surfaces.However, if the temperature during an experiment were toincrease above 400 K, the water will start to desorb from thesurface. Further temperature increases, that is, from 450 K for(011) and (111), and 800 K for (001), will dry out the catalyst,which will make it unsuitable for the electro-oxidation of SO2as no H2O will be present. This, in turn, will impact negativelyon the efficiency of the HyS cycle. Comparing our results withexperimental thermal desorption values, it has been reportedthat, even at the lowest coverages, water desorbs from the(111) surface in two peaks, 179 and 196 K, and at highercoverages, there are three distinct peaks from physisorbedwater, 160−167, 170−171, and 177−180 K, ascribed tomultilayer ice, a bilayer region, and a nonbilayer region,respectively.93,94
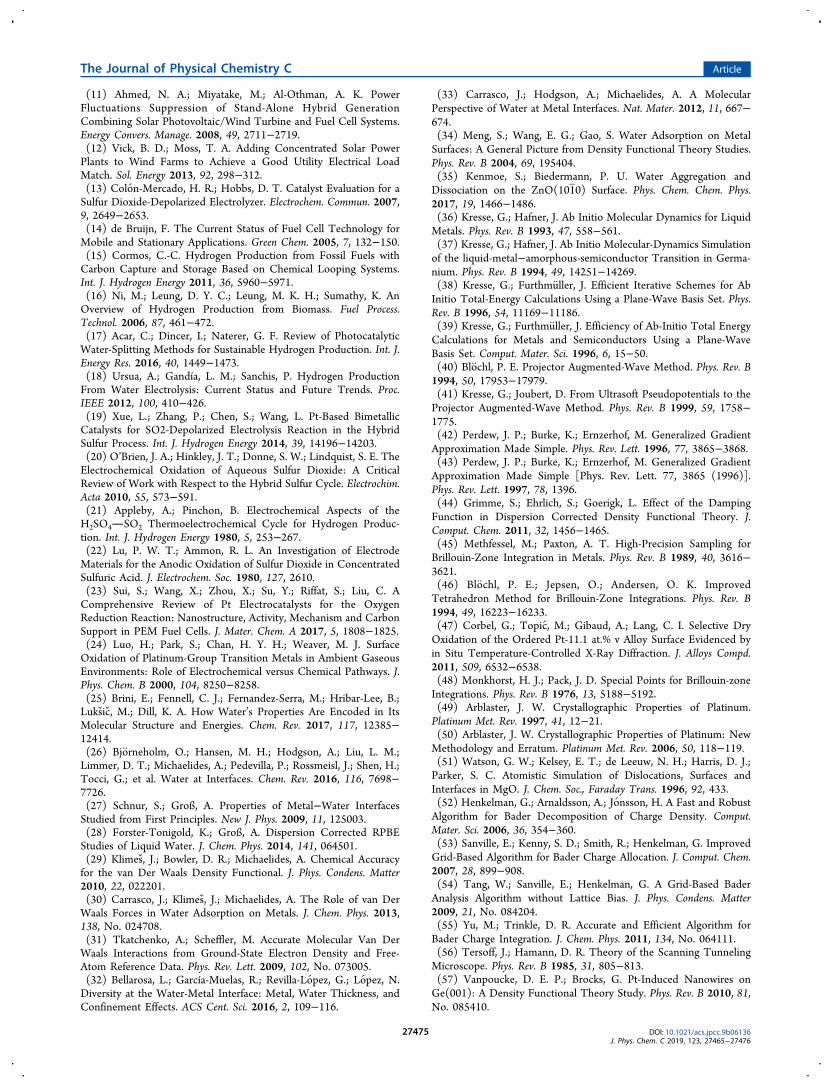
If the surface energies are used to construct nanoparticlemorphologies, following the Wulff construction method,60 wecan visualize the effect of the water chemical potential on thePt nanoparticles (Figure 12). The dry morphology wasconstructed from the free energies of the surfaces withoutadsorbed H2O molecules. The dry nanoparticle shows all threemajor Pt surfaces, producing a rhombicuboctahedron structurewith 8 truncated triangular (111) faces, 12 truncated (011)faces, and 6 square (001) faces.The hydrated Wulff morphologies were constructed using
surface free energies, taking both the temperature and pressureof the adsorbed H2O into account. Looking at the morphologyconstructed at 0 K, only the (001) and (111) surfaces areexpressed. This truncated octahedron (six square and eighthexagonal faces) was also reported by Shi and Sun85 at 0 K,where the nanoparticle expressed 86% of the (111) surface and
Figure 11. Surface phase diagrams in terms of pressure and temperature for molecular water adsorption at the Pt (001), (011), and (111) surfaces.
Figure 12. Wulff morphology of Pt nanoparticles: dry and hydrated at a temperature of 0 K and higher than 298.15 K.
The Journal of Physical Chemistry C Article
DOI: 10.1021/acs.jpcc.9b06136J. Phys. Chem. C 2019, 123, 27465−27476
27473

14% of the (110) surface. Three temperatures (298.15, 400,and 800 K) at pH2O = 1 atm were chosen to present the effectof temperature change on the Pt morphology. An increase intemperature changed the Pt morphology to one where only the(111) surface was expressed at all these temperatures, shown asthe third octahedron morphology (eight triangular faces) inFigure 12. Zhu and co-workers95 also utilized the DFT-GGAmethod to optimize varying sizes of Pt surfaces to constructWulff morphologies and reported that the vapor pressure andtemperature had a significant effect on the shape of the Ptnanoparticle. In another experimental study by Lee et al.,96 itwas seen that colloidal particles of Pt preferentially expressedthe (001) and (111) facets. However, in Lee’s study, all threeMiller indexes were expressed to varying extent in thenanoparticles, depending on the temperature.
4. CONCLUSIONSIn this paper, we have used density functional theorycalculations to predict the interaction of H2O with the Pt(001), (011), and (111) surfaces. It was determined that theDFT-D3(BJ) dispersion method provides the best surfaceenergies and lattice parameter when compared to experimentalvalues. When considering adsorption of an isolated H2Omolecule, it adsorbs dissociatively on the (001) surface,whereas on both the (011) and (111) surfaces, the H2Omolecule adsorbs parallel atop the Pt atoms. Bader analysisshows that the molecularly bound H2O provides ∼0.1 e− to thePt surface, while ∼0.4 e− was transferred from the surface tothe molecule when it dissociates.Surface coverage was increased until a monolayer was
obtained, where Eads/H2O decreased for the (001) surface asthe coverage increased, while for the (011) and (111) surfaces,Eads/H2O increased. Under the conditions at which the HySreaction takes place, the highest coverage was obtained for the(011) surface, followed by (111) and (001). The Wulffmorphology of the Pt nanoparticle showed that, in a dryenvironment, all three surfaces are expressed. However, in ahydrated environment and with increasing temperature, thepercentage of the expressed (001) and (011) faces changesuntil only the (111) surface is present.Future work will include the consideration of SO2 on various
Pt surfaces, as well as a mixture of H2O and SO2. In addition,we will also investigate the mechanism of the SO2 oxidation onthe Pt surfaces.
■ ASSOCIATED CONTENT*S Supporting InformationThe Supporting Information is available free of charge on theACS Publications website at DOI: 10.1021/acs.jpcc.9b06136.
Graph showing the d-band center values versus H2Ocoverage on the Pt (001)diss, (001)mol, (011) and (111)surfaces; and graph showing the effect of surface energyversus chemical potential as a function of increasedcoverage for Pt (011) and (111) (PDF)
■ AUTHOR INFORMATIONCorresponding Authors*E-mail: [email protected] (C.G.C.E.v.S.).*E-mail: [email protected] (N.H.d.L.).ORCIDMarietjie J. Ungerer: 0000-0002-9073-1186David Santos-Carballal: 0000-0002-3199-9588
Cornelia G. C. E. van Sittert: 0000-0001-5786-5409Nora H. de Leeuw: 0000-0002-8271-0545NotesThe authors declare no competing financial interest.
■ ACKNOWLEDGMENTSWe acknowledge the Economic and Social Research Council(ESRC grant no. ES/N013867/1) and the Engineering andPhysical Sciences Research Council (EPSRC grant nos. EP/K016288/1 and EP/K009567/2). This work was performedusing the computational facilities of the Advanced ResearchComputing at Cardiff (ARCCA) Division, Cardiff University,and the Centre of High Performance Computing (CHPC) inCape Town, South Africa. In addition, the calculations werecarried out using the Supercomputing Facilities at CardiffUniversity operated by ARCCA on behalf of the HPC Walesand Supercomputing Wales (SCW) projects. We acknowledgethe support of the latter, which is part-funded by the EuropeanRegional Development Fund (ERDF) via the Welsh Govern-ment. We wish to acknowledge the use of the EPSRC-fundedNational Chemical Database Service hosted by the RoyalSociety of Chemistry. D.S.-C. is grateful to the Department ofScience and Technology (DST) and the National ResearchFoundation (NRF) of South Africa for the provision of aPostdoctoral Fellowship for Early Career Researchers fromU.K. M.J.U. would like to acknowledge the National ResearchFoundation (NRF grant no. 116728) for their financial supportand the North-West University for their support and resources.All data created during this research are openly available fromCardiff University’s Research Portal at http://dx.doi.org/10.17035/d.2019.0068143277.
■ REFERENCES(1) Dai, K.; Bergot, A.; Liang, C.; Xiang, W.-N.; Huang, Z.Environmental Issues Associated with Wind Energy − A Review.Renewable Energy 2015, 75, 911−921.(2) Harvey, L. D. D. The Potential of Wind Energy to LargelyDisplace Existing Canadian Fossil Fuel and Nuclear ElectricityGeneration. Energy 2013, 50, 93−102.(3) Bahadori, A.; Nwaoha, C. A Review on Solar Energy Utilisationin Australia. Renewable Sustainable Energy Rev. 2013, 18, 1−5.(4) Sarver, T.; Al-Qaraghuli, A.; Kazmerski, L. L. A ComprehensiveReview of the Impact of Dust on the Use of Solar Energy: History,Investigations, Results, Literature, and Mitigation Approaches.Renewable Sustainable Energy Rev. 2013, 22, 698−733.(5) Kaldellis, J. K. The Contribution of Small Hydro Power Stationsto the Electricity Generation in Greece: Technical and EconomicConsiderations. Energy Policy 2007, 35, 2187−2196.(6) Philpott, A.; Guan, Z.; Khazaei, J.; Zakeri, G. ProductionInefficiency of Electricity Markets with Hydro Generation. Util. Policy2010, 18, 174−185.(7) Rehman, S.; Al-Hadhrami, L. M.; Alam, M. M. Pumped HydroEnergy Storage System: A Technological Review. RenewableSustainable Energy Rev. 2015, 44, 586−598.(8) Angarita, J. L.; Usaola, J.; Martínez-Crespo, J. Combined Hydro-Wind Generation Bids in a Pool-Based Electricity Market. Electr.Power Syst. Res. 2009, 79, 1038−1046.(9) Suomalainen, K.; Pritchard, G.; Sharp, B.; Yuan, Z.; Zakeri, G.Correlation Analysis on Wind and Hydro Resources with ElectricityDemand and Prices in New Zealand. Appl. Energy 2015, 137, 445−462.(10) Santos-Alamillos, F. J.; Pozo-Vazquez, D.; Ruiz-Arias, J. A.; VonBremen, L.; Tovar-Pescador, J. Combining Wind Farms withConcentrating Solar Plants to Provide Stable Renewable Power.Renewable Energy 2015, 76, 539−550.
The Journal of Physical Chemistry C Article
DOI: 10.1021/acs.jpcc.9b06136J. Phys. Chem. C 2019, 123, 27465−27476
27474
(11) Ahmed, N. A.; Miyatake, M.; Al-Othman, A. K. PowerFluctuations Suppression of Stand-Alone Hybrid GenerationCombining Solar Photovoltaic/Wind Turbine and Fuel Cell Systems.Energy Convers. Manage. 2008, 49, 2711−2719.(12) Vick, B. D.; Moss, T. A. Adding Concentrated Solar PowerPlants to Wind Farms to Achieve a Good Utility Electrical LoadMatch. Sol. Energy 2013, 92, 298−312.(13) Colon-Mercado, H. R.; Hobbs, D. T. Catalyst Evaluation for aSulfur Dioxide-Depolarized Electrolyzer. Electrochem. Commun. 2007,9, 2649−2653.(14) de Bruijn, F. The Current Status of Fuel Cell Technology forMobile and Stationary Applications. Green Chem. 2005, 7, 132−150.(15) Cormos, C.-C. Hydrogen Production from Fossil Fuels withCarbon Capture and Storage Based on Chemical Looping Systems.Int. J. Hydrogen Energy 2011, 36, 5960−5971.(16) Ni, M.; Leung, D. Y. C.; Leung, M. K. H.; Sumathy, K. AnOverview of Hydrogen Production from Biomass. Fuel Process.Technol. 2006, 87, 461−472.(17) Acar, C.; Dincer, I.; Naterer, G. F. Review of PhotocatalyticWater-Splitting Methods for Sustainable Hydrogen Production. Int. J.Energy Res. 2016, 40, 1449−1473.(18) Ursua, A.; Gandía, L. M.; Sanchis, P. Hydrogen ProductionFrom Water Electrolysis: Current Status and Future Trends. Proc.IEEE 2012, 100, 410−426.(19) Xue, L.; Zhang, P.; Chen, S.; Wang, L. Pt-Based BimetallicCatalysts for SO2-Depolarized Electrolysis Reaction in the HybridSulfur Process. Int. J. Hydrogen Energy 2014, 39, 14196−14203.(20) O’Brien, J. A.; Hinkley, J. T.; Donne, S. W.; Lindquist, S. E. TheElectrochemical Oxidation of Aqueous Sulfur Dioxide: A CriticalReview of Work with Respect to the Hybrid Sulfur Cycle. Electrochim.Acta 2010, 55, 573−591.(21) Appleby, A.; Pinchon, B. Electrochemical Aspects of theH2SO4SO2 Thermoelectrochemical Cycle for Hydrogen Produc-tion. Int. J. Hydrogen Energy 1980, 5, 253−267.(22) Lu, P. W. T.; Ammon, R. L. An Investigation of ElectrodeMaterials for the Anodic Oxidation of Sulfur Dioxide in ConcentratedSulfuric Acid. J. Electrochem. Soc. 1980, 127, 2610.(23) Sui, S.; Wang, X.; Zhou, X.; Su, Y.; Riffat, S.; Liu, C. AComprehensive Review of Pt Electrocatalysts for the OxygenReduction Reaction: Nanostructure, Activity, Mechanism and CarbonSupport in PEM Fuel Cells. J. Mater. Chem. A 2017, 5, 1808−1825.(24) Luo, H.; Park, S.; Chan, H. Y. H.; Weaver, M. J. SurfaceOxidation of Platinum-Group Transition Metals in Ambient GaseousEnvironments: Role of Electrochemical versus Chemical Pathways. J.Phys. Chem. B 2000, 104, 8250−8258.(25) Brini, E.; Fennell, C. J.; Fernandez-Serra, M.; Hribar-Lee, B.;Luksic, M.; Dill, K. A. How Water’s Properties Are Encoded in ItsMolecular Structure and Energies. Chem. Rev. 2017, 117, 12385−12414.(26) Bjorneholm, O.; Hansen, M. H.; Hodgson, A.; Liu, L. M.;Limmer, D. T.; Michaelides, A.; Pedevilla, P.; Rossmeisl, J.; Shen, H.;Tocci, G.; et al. Water at Interfaces. Chem. Rev. 2016, 116, 7698−7726.(27) Schnur, S.; Groß, A. Properties of Metal−Water InterfacesStudied from First Principles. New J. Phys. 2009, 11, 125003.(28) Forster-Tonigold, K.; Groß, A. Dispersion Corrected RPBEStudies of Liquid Water. J. Chem. Phys. 2014, 141, 064501.(29) Klimes, J.; Bowler, D. R.; Michaelides, A. Chemical Accuracyfor the van Der Waals Density Functional. J. Phys. Condens. Matter2010, 22, 022201.(30) Carrasco, J.; Klimes, J.; Michaelides, A. The Role of van DerWaals Forces in Water Adsorption on Metals. J. Chem. Phys. 2013,138, No. 024708.(31) Tkatchenko, A.; Scheffler, M. Accurate Molecular Van DerWaals Interactions from Ground-State Electron Density and Free-Atom Reference Data. Phys. Rev. Lett. 2009, 102, No. 073005.(32) Bellarosa, L.; García-Muelas, R.; Revilla-Lopez, G.; Lopez, N.Diversity at the Water-Metal Interface: Metal, Water Thickness, andConfinement Effects. ACS Cent. Sci. 2016, 2, 109−116.
(33) Carrasco, J.; Hodgson, A.; Michaelides, A. A MolecularPerspective of Water at Metal Interfaces. Nat. Mater. 2012, 11, 667−674.(34) Meng, S.; Wang, E. G.; Gao, S. Water Adsorption on MetalSurfaces: A General Picture from Density Functional Theory Studies.Phys. Rev. B 2004, 69, 195404.(35) Kenmoe, S.; Biedermann, P. U. Water Aggregation andDissociation on the ZnO(1010) Surface. Phys. Chem. Chem. Phys.2017, 19, 1466−1486.(36) Kresse, G.; Hafner, J. Ab Initio Molecular Dynamics for LiquidMetals. Phys. Rev. B 1993, 47, 558−561.(37) Kresse, G.; Hafner, J. Ab Initio Molecular-Dynamics Simulationof the liquid-metal−amorphous-semiconductor Transition in Germa-nium. Phys. Rev. B 1994, 49, 14251−14269.(38) Kresse, G.; Furthmuller, J. Efficient Iterative Schemes for AbInitio Total-Energy Calculations Using a Plane-Wave Basis Set. Phys.Rev. B 1996, 54, 11169−11186.(39) Kresse, G.; Furthmuller, J. Efficiency of Ab-Initio Total EnergyCalculations for Metals and Semiconductors Using a Plane-WaveBasis Set. Comput. Mater. Sci. 1996, 6, 15−50.(40) Blochl, P. E. Projector Augmented-Wave Method. Phys. Rev. B1994, 50, 17953−17979.(41) Kresse, G.; Joubert, D. From Ultrasoft Pseudopotentials to theProjector Augmented-Wave Method. Phys. Rev. B 1999, 59, 1758−1775.(42) Perdew, J. P.; Burke, K.; Ernzerhof, M. Generalized GradientApproximation Made Simple. Phys. Rev. Lett. 1996, 77, 3865−3868.(43) Perdew, J. P.; Burke, K.; Ernzerhof, M. Generalized GradientApproximation Made Simple [Phys. Rev. Lett. 77, 3865 (1996)].Phys. Rev. Lett. 1997, 78, 1396.(44) Grimme, S.; Ehrlich, S.; Goerigk, L. Effect of the DampingFunction in Dispersion Corrected Density Functional Theory. J.Comput. Chem. 2011, 32, 1456−1465.(45) Methfessel, M.; Paxton, A. T. High-Precision Sampling forBrillouin-Zone Integration in Metals. Phys. Rev. B 1989, 40, 3616−3621.(46) Blochl, P. E.; Jepsen, O.; Andersen, O. K. ImprovedTetrahedron Method for Brillouin-Zone Integrations. Phys. Rev. B1994, 49, 16223−16233.(47) Corbel, G.; Topic, M.; Gibaud, A.; Lang, C. I. Selective DryOxidation of the Ordered Pt-11.1 at.% v Alloy Surface Evidenced byin Situ Temperature-Controlled X-Ray Diffraction. J. Alloys Compd.2011, 509, 6532−6538.(48) Monkhorst, H. J.; Pack, J. D. Special Points for Brillouin-zoneIntegrations. Phys. Rev. B 1976, 13, 5188−5192.(49) Arblaster, J. W. Crystallographic Properties of Platinum.Platinum Met. Rev. 1997, 41, 12−21.(50) Arblaster, J. W. Crystallographic Properties of Platinum: NewMethodology and Erratum. Platinum Met. Rev. 2006, 50, 118−119.(51) Watson, G. W.; Kelsey, E. T.; de Leeuw, N. H.; Harris, D. J.;Parker, S. C. Atomistic Simulation of Dislocations, Surfaces andInterfaces in MgO. J. Chem. Soc., Faraday Trans. 1996, 92, 433.(52) Henkelman, G.; Arnaldsson, A.; Jonsson, H. A Fast and RobustAlgorithm for Bader Decomposition of Charge Density. Comput.Mater. Sci. 2006, 36, 354−360.(53) Sanville, E.; Kenny, S. D.; Smith, R.; Henkelman, G. ImprovedGrid-Based Algorithm for Bader Charge Allocation. J. Comput. Chem.2007, 28, 899−908.(54) Tang, W.; Sanville, E.; Henkelman, G. A Grid-Based BaderAnalysis Algorithm without Lattice Bias. J. Phys. Condens. Matter2009, 21, No. 084204.(55) Yu, M.; Trinkle, D. R. Accurate and Efficient Algorithm forBader Charge Integration. J. Chem. Phys. 2011, 134, No. 064111.(56) Tersoff, J.; Hamann, D. R. Theory of the Scanning TunnelingMicroscope. Phys. Rev. B 1985, 31, 805−813.(57) Vanpoucke, D. E. P.; Brocks, G. Pt-Induced Nanowires onGe(001): A Density Functional Theory Study. Phys. Rev. B 2010, 81,No. 085410.
The Journal of Physical Chemistry C Article
DOI: 10.1021/acs.jpcc.9b06136J. Phys. Chem. C 2019, 123, 27465−27476
27475
(58) Santos-Carballal, D.; Roldan, A.; Grau-Crespo, R.; de Leeuw,N. H. A DFT Study of the Structures, Stabilities and Redox Behaviourof the Major Surfaces of Magnetite Fe3O4. Phys. Chem. Chem. Phys.2014, 16, 21082−21097.(59) Chase, M. W. NIST-JANAF Thermochemical Tables; 4thedition; American Institute of Physics,1998; Vol. Monograph.(60) Wulff, G. XXV. Zur Frage Der Geschwindigkeit DesWachsthums Und Der Auflosung Der Krystallflachen. Z. Kristallogr.Cryst. Mater 1901, 34, 449−530.(61) Fleming, S.; Rohl, A. GDIS: A visualization Program forMolecular and Periodic Systems. Z. Kristallogr. Cryst. Mater. 2005,220, 580−584.(62) Posada-Perez, S.; Santos-Carballal, D.; Terranova, U.; Roldan,A.; Illas, F.; de Leeuw, N. H. CO2 interaction with Violarite (FeNi2S4)Surfaces: A Dispersion-Corrected DFT Study. Phys. Chem. Chem.Phys. 2018, 20, 20439−20446.(63) Grimme, S. Semiempirical GGA-Type Density FunctionalConstructed with a Long-Range Dispersion Correction. J. Comput.Chem. 2006, 27, 1787−1799.(64) Grimme, S.; Antony, J.; Ehrlich, S.; Krieg, H. A Consistent andAccurate Ab Initio Parametrization of Density Functional DispersionCorrection (DFT-D) for the 94 Elements H-Pu. J. Chem. Phys. 2010,132, 154104.(65) Getman, R. B.; Xu, Y.; Schneider, W. F. Thermodynamics ofEnvironment-Dependent Oxygen Chemisorption on Pt(111). J. Phys.Chem. C 2008, 112, 9559−9572.(66) Skriver, H. L.; Rosengaard, N. M. Surface Energy and WorkFunction of Elemental Metals. Phys. Rev. B 1992, 46, 7157−7168.(67) Santos-Carballal, D.; Ngoepe, P. E.; de Leeuw, N. H. Ab InitioInvestigation of the Thermodynamics of Cation Distribution and ofthe Electronic and Magnetic Structures in the LiMn2O4 Spinel. Phys.Rev. B 2018, 97, 085126.(68) Klimes, J.; Bowler, D. R.; Michaelides, A. Van Der WaalsDensity Functionals Applied to Solids. Phys. Rev. B 2011, 83, 195131.(69) Jian-Min, Z.; Fei, M.; Ke-Wei, X. Calculation of the SurfaceEnergy of Fcc Metals with Modified Embedded-Atom Method. Chin.Phys. 2004, 13, 1082−1090.(70) Singh-Miller, N. E.; Marzari, N. Surface Energies, WorkFunctions, and Surface Relaxations of Low-Index Metallic Surfacesfrom First Principles. Phys. Rev. B 2009, 80, 235407.(71) Keene, B. J. Review of Data for the Surface Tension of PureMetals. Int. Mater. Rev. 2013, 38, 157−192.(72) Tyson, W. R.; Miller, W. A. Surface Free Energies of SolidMetals: Estimation from Liquid Surface Tension Measurements. Surf.Sci. 1977, 62, 267−276.(73) Xin, H.; Linic, S. Communications: Exceptions to the d -BandModel of Chemisorption on Metal Surfaces: The Dominant Role ofRepulsion between Adsorbate States and Metal d -States. J. Chem.Phys 2010, 132, 221101.(74) Caglar, B.; Kizilkaya, A. C.; Niemantsverdriet, J. W.; Weststrate,C. J. Application of Work Function Measurements in the Study ofSurface Catalyzed Reactions on Rh(1 0 0). Catal., Struct. React. 2018,4, 1−11.(75) Norskov, J. K.; Abild-Pedersen, F.; Studt, F.; Bligaard, T.Density Functional Theory in Surface Chemistry and Catalysis. Proc.Natl. Acad. Sci. 2011, 108, 937−943.(76) Walen, H.; Liu, D.-J.; Oh, J.; Yang, H. J.; Spurgeon, P. M.; Kim,Y.; Thiel, P. A. Sulfur Atoms Adsorbed on Cu(100) at Low Coverage:Characterization and Stability against Complexation. J. Phys. Chem. B2017, 122, 963−971.(77) Andryushechkin, B. V.; Zhidomirov, G. M.; Eltsov, K. N.;Hladchanka, Y. V.; Korlyukov, A. A. Local Structure of the Ag(100)Surface Reacting with Molecular Iodine: Experimental and Theoreti-cal Study. Phys. Rev. B 2009, 80, 125409.(78) Feenstra, R. M.; Hla, S. W. Introduction to Scanning TunnelingMicroscopy of Metals and Semiconductor. In Physics of Solid Surfaces;Springer: 2015; pp 15.(79) Lee, S.; Park, J.; Ragan, R.; Kim, S.; Lee, Z.; Lim, D. K.;Ohlberg, D. A. A.; Williams, R. S. Self-Assembled Monolayers on
Pt(111): Molecular Packing Structure and Strain Effects Observed byScanning Tunneling Microscopy. J. Am. Chem. Soc. 2006, 128, 5745−5750.(80) Ludwig, R. How Does Water Bind to Metal Surfaces: HydrogenAtoms Up or Hydrogen Atoms Down? Angew. Chem., Int. Ed. 2003,42, 3458−3460.(81) Benedict, W. S.; Gailar, N.; Plyler, E. K. Rotation-VibrationSpectra of Deuterated Water Vapor. J. Chem. Phys. 1956, 24, 1139−1165.(82) Thiel, P. A.; Madey, T. E. The Interaction of Water with SolidSurfaces: Fundamental Aspects. Surf. Sci. Rep. 1987, 7, 211−385.(83) Henderson, M. The Interaction of Water with Solid Surfaces:Fundamental Aspects Revisited. Surf. Sci. Rep. 2002, 46, 1−308.(84) Feibelman, P. J. Partial Dissociation of Water on Ru(0001).Science 2002, 295, 99−102.(85) Shi, Q.; Sun, R. Adsorption Manners of Hydrogen on Pt(1 0 0),(1 1 0) and (1 1 1) Surfaces at High Coverage. Comput. Theor. Chem.2017, 1106, 43−49.(86) Iwasita, T.; Xia, X. Adsorption of Water at Pt(111) Electrode inHClO4 Solutions. The Potential of Zero Charge. J. Electroanal. Chem.1996, 411, 95−102.(87) Mohamed, F.; VandeVondele, J.; Hutter, J.; Krack, M.;Parrinello, M.; Chassaing, T. Quickstep: Fast and Accurate DensityFunctional Calculations Using a Mixed Gaussian and Plane WavesApproach. Comput. Phys. Commun. 2005, 167, 103−128.(88) Feibelman, P. J.; Bartelt, N. C.; Nie, S.; Thurmer, K.Interpretation of High-Resolution Images of the Best-Bound WettingLayers on Pt(111). J. Chem. Phys. 2010, 133, 154703.(89) Standop, S.; Redinger, A.; Morgenstern, M.; Michely, T.; Busse,C. Molecular Structure of the H2O Wetting Layer on Pt(111). Phys.Rev. B 2010, 82, 161412.(90) Hammer, B.; Nørskov, J. K. Electronic Factors Determining theReactivity of Metal Surfaces. Surf. Sci. 1995, 343, 211−220.(91) Hammer, B.; Norskov, J. K. Why Gold Is the Noblest of All theMetals. Nature 1995, 376, 238−240.(92) Gorzkowski, M. T.; Lewera, A. Probing the Limits of D-BandCenter Theory: Electronic and Electrocatalytic Properties of Pd-Shell−Pt-Core Nanoparticles. J. Phys. Chem. C 2015, 119, 18389−18395.(93) Fisher, G. B.; Gland, J. L. The Interaction of Water with thePt(111) Surface. Surf. Sci. 1980, 94, 446−455.(94) Jo, S. K.; Kiss, J.; Polanco, J. A.; White, J. M. Identification ofSecond Layer Adsorbates: Water and Chloroethane on Pt(111). Surf.Sci. 1991, 253, 233−244.(95) Zhu, B.; Xu, Z.; Wang, C.; Gao, Y. Shape Evolution of MetalNanoparticles in Water Vapor Environment. Nano Lett. 2016, 16,2628−2632.(96) Lee, I.; Morales, R.; Albiter, M. A.; Zaera, F. Synthesis ofHeterogeneous Catalysts with Well Shaped Platinum Particles toControl Reaction Selectivity. Proc. Natl. Acad. Sci. 2008, 105, 15241−15246.
The Journal of Physical Chemistry C Article
DOI: 10.1021/acs.jpcc.9b06136J. Phys. Chem. C 2019, 123, 27465−27476
27476