intercontinental transport of ozone and precursors (itop)
TRANSCRIPT

Intercontinental Transport of Ozone and Precursors (ITOP)
Ally Lewis, Ruth Purvis, Jim Hopkins, James Lee, Nicola WatsonDepartment of Chemistry, University of York
Mike Pilling, Dwayne Heard, Trevor Ingham, Lisa Whalley, Cedric Floquet, Department of Chemistry, University of Leeds
Steve Arnold, Mat Evans, Jim McQuaid, Dominick Spracklen, Kirsty PringleSchool of the Environment, University of Leeds
Paul Monks, Mark Jacob, Alex ParkerDepartment of Chemistry, University of Leicester
Stuart Penkett, Claire Reeves, Graham Mills, David Oram, Brian Bandy, Debbie Wylding, Jana Slemr, Dave Stewart, Anne Hulse
School of Environmental Sciences, University of East AngliaHugh Coe, Paul Williams, Jonny Crozier, Rami Alfarra
Department of Physics, UMISTJohn Methven
Department of Meteorology, University of ReadingJohn Pyle, Rod Jones, Will Flynn, James Levine, Peter Cook
Department of Chemistry, University of CambridgeJohn Reid, Ken Dewey, Nick Price, Steve Devereux, Doug Anderson
Facility for Airborne Atmospheric MeasurementsAlan Foster, Alan Roberts, Gaynor Ottoway, Peter Chappell
DirectFlight LtdMartin Darling, Andrew ‘Rodders’ Boardman, Simon Tooley
Avalon Aero Ltd

ICARRT Summer 2004
FAAM BAe146, based in Faial, Azores, flew 12 science flights ~70 hoursincluding intercomparison flights with DLR Falcon and NASA DC8

The Facility for Airborne Atmospheric Measurements BAe-146 Research Aircraft
Instrument Air Exhausts
Forward and Upward Facing Cameras
Air sample pipes
Temperature and Ice/Water
probes
Turbulence Probe
FAGE OH inlet
Broad-band Radiometers
Microwave Radiometer
Dropsonde Ejector
Peroxy radical inlet
Wing mount pods

Flight Highlights
Three-point Lagrangian opportunities: 19/7 + 25/728/7 + 29/7 and 31/7 + 1/8.
Two-point Lagrangian opportunities: 17/7, 20/7 (fire).Forest fires: 15/7, 19/7, 20/7, 31/7 (with strat), 1/8.Pico flypass: 15/7, 17/7, 19/7, 31/7, 1/8.Comparisons: 28/7 (DC8), 3/8 (Falcon).ENVISAT underpass: 22/7.

B028 – 12/7/04 – Fire plumes in SW approaches
B029 – 15/7/04 – W to E Low level pollution + forest fires
B030 – 17/7/04 – First Lagrangian opportunity, - skimmed P3 air
B031 – 19/7/04 – New York plume + fire layers
B032 – 20/7/04 – Dominated by Alaskan fires, low T
B033 – 22/7/04 – ENVISAT underpass / cyclone
B034 – 25/7/04 – Re interception of NY plume + African outflow
B035 – 28/7/04 – DC8 comparison / air exported by wcb
B036 – 29/7/04 – Upper level export in wcb from US + fires higher T
B037 – 31/7/04 – low level wcb sampled by P3, + fires + strat
B038 – 01/8/04 – low level wcb 2
B039 – 03/8/04 – Transit / Falcon intercomparison

ITOP data coverage
YYYYYNYYYYNNCPC
YYYYYYYYYYYYAMS
YYYYYYYYYYYNPERCA
YYYYYYYYYYYYradiometers
NNNNNNNNNNNNOH/HO2
346261483259524861586026WAS VOCs
YYYYYYYYYYYYPAN
YNNNNNNNNNNNHalocarbons
YYYYYYYYYNNNalkyl nitrates
NNNYYNNNNNNNPTR-MS
NNYYNYYNYYNNH2O2
NNYYYYYYYYYNHCHO
????????????NOy
?????????NNNNO2
YYYYYYYYYNNNNO
YYYYYYYYYYYYO3
YYYYYYYYYYYYCO
YYYYYYYYYYYYCore data
B039B038B037B036B035B034B033B032B031B030B029B028

Overview of U.K. activitiesComplete ITOP campaign ozone as a function of altitude. Coloured by flight.ITOP flight summary: lat / long
ITOP flight summary: latitude / pressure
Clean MBL / 15 ppb Significant long range continental influence at both low and high altitudes during campaign

NMHC variability – campaign overview
0.1
1
10
100
1000
10000
100000
10000 100000 1000000 10000000
KOH
conc
ppt
v
Alkanes
Alkenes
Alkynes
DMS
Aromatics
acetaldehyde
methanol
acetone
BO29
BO32
BO32
BO35
BO35
BO32
BO32
BO35
BO32
BO35BO29
BO34
Acetylene
Ethane
Benzene
Isoprene
Ethene
m + p xylene
B029 / 32 fire dominated, B035 DC8 comparison

Forecasting target for upstream domain
BA
Domain filling trajectory forecasts for E.Coast America domain on 15 July.
a) NOx emissions tracer at 900 hPa
b) 2-point and 3-point opportunities highlight targets A and B.
c) 7 days forward from target B A
B
a)
b) c)

Forward Trajectories from NOAA P3 flight track
4 day forward trajectories from part of NOAA P3 flight track immediately downwindof New York City on 15/7(CO very variable between 140-240ppb).
BAE146 flight intercepted this air on 19/7(saw CO ~ 115-125ppb).
BAE146 flight intercepted this air again on 25/7 (saw increased CO ~ 115-125ppb).
Intercepted by DLR Falcon off NW corner of Spain on 22/7(saw CO ~ 90-100ppb).
7 day forward trajectories from NOAA P3flight off NYC on 15/7.
10 day forward trajectories from NOAA P3flight off NYC on 15/7. Airmass doubles back from Spain to the Azores.

Analysis: Second interception of polluted airmass from USA
Long
Lat
Horta
• NOx emissions tracer on 925hPa at 12UT 19/7 with BAE146 (air mass relative) flight track overlaid.
• Indicates high emissions into low level outflow from East Coast USA.
•Section along dashed line, with flight track as solid grey line.
•Didn’t quite reach target X but into NYC air with similar characteristics.
Back trajectories from target X confirm NYC as being air mass origin

Did the aircraft make the interception?
31
1
2
3
23
1
Trajectories from BAe146 flight track back and forwards for 4 days.
Best matches with trajectories from other flight tracks.
Time series along flight track.
Line shows pressure and colour bars mark air masses intercepted on other flights.

Was the Quasi-Lagrangian expt successful?
Trajectories based on analyses show that downstream aircraft flew very close to air masses already sampled upstream.But, can it be regarded as the same air mass?
1. Do hydrocarbon fingerprints agree (using ratios to acetylene to allow for mixing and dilution with surrounding air)?
2. Is observed ∆O3 (τ) > instrumental error (comparison flights)?> uncertainty in value at origins, O3 (t0 - τ)?
3. What is the sensitivity of ∆O3 to initial conditions, reaction pathways, mixing history, …?


Upper level WCB from US

15 %39 %(PAN/NOy)*100
268.0 K263.4 KTemperature
132.8 ppbV261.2 ppbVCO
133 ppbV92 ppbVO3
0.43 ppbV1.72 ppbVPAN
B036 PlumeB032 Plume
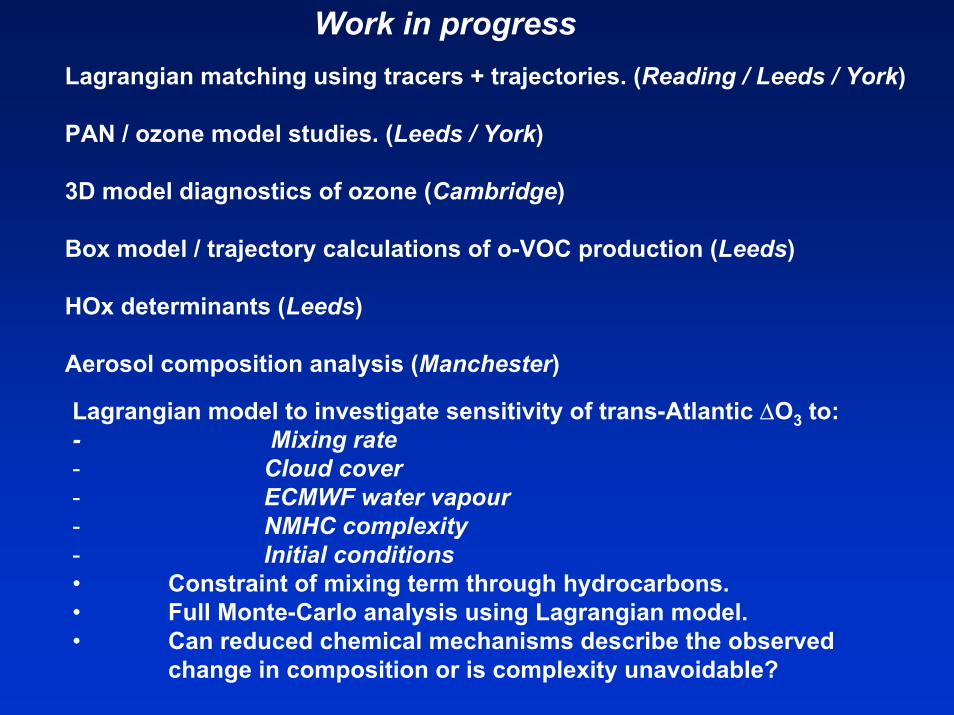
Work in progressLagrangian matching using tracers + trajectories. (Reading / Leeds / York)
PAN / ozone model studies. (Leeds / York)
3D model diagnostics of ozone (Cambridge)
Box model / trajectory calculations of o-VOC production (Leeds)
HOx determinants (Leeds)
Aerosol composition analysis (Manchester)
Lagrangian model to investigate sensitivity of trans-Atlantic ∆O3 to: - Mixing rate- Cloud cover- ECMWF water vapour- NMHC complexity- Initial conditions• Constraint of mixing term through hydrocarbons.• Full Monte-Carlo analysis using Lagrangian model.• Can reduced chemical mechanisms describe the observed
change in composition or is complexity unavoidable?


UK ITOP flight by flight summary

B029: 15/07/04 Low level pollution and fires
Horta Air passing close to Pease

B030: 17/07/04 First Lagrangian opportunity
Target sampled by P3 on 15 July
Unfortunately only skimmed edge because out of time.

B031: 19/07/04 “New York plume”
Target sampled by P3 on 15 July (on limit of range)

B031 continued: thin brown fire layer
Narrow filament and thin layer - visibly brown. Adjusted altitude to stay within layer.
Originated from UT above Alaskan forest fires (but diluted by mixing while thinning).

B032: 20/07/04 Alaskan forest fires
Alaskan fire plume with CO up to 600ppb. Similar plume was intercepted by P3 on 15 July (but not same air mass).
Was targeted on 23/7 by Falcon.

B032 NHMCs
0
500
1000
1500
2000
2500
3000
3500
4000
4500
10:00 11:00 12:00 13:00 14:00Time GMT
VOC
(ppt
V)
0
100
200
300
400
500
600
CO
(ppb
v), A
ltitu
de
etheneacetyleneacetone LOWOXmethanol(LOWOX)CO (ppbV)(Altitude/40) + 350
Significant Alaskan Fire influence Small Alaskan Fire influence

B033: 22/07/04 ENVISAT underpass
Cyclone
Deep profile under satellite through air re-circulating over mid-Atlantic for more than a week.

B034: 25/07/04 African air
African air throughout profile
New York plume 4th interception
3
2
41

CO ozone time series
0
50
100
150
200
250
300
350
9:36:00AM
10:48:00 AM
12:00:00 PM
1:12:00PM
2:24:00PM
3:36:00PM
4:48:00PM
6:00:00PM
7:12:00PM
8:24:00PM
Time UTC
CO
ozo
ne p
pbv
0
20
40
60
80
100
120
Ethe
ne p
ptv
CO (ppbV)acetylenepropanePressure height (mOzone (ppbV)ethene
African outflow sampled
Alaskan outflow sampled
Marine air sampled
Spanish/ Portuguese outflow sampled
American outflow sample
B034: 25/07/04 African air

B035: 28/07/04 Comparison with DC8
Upper level WCB
1
2
3
Comparison below air exported by WCB. Relatively clean but sampled again by Falcon on 30/7 and 31/7.

B036: 29/07/04 Upper level export in WCB
Polluted air on North side of WCB but crossed under maximum because could not achieve altitude early enough.
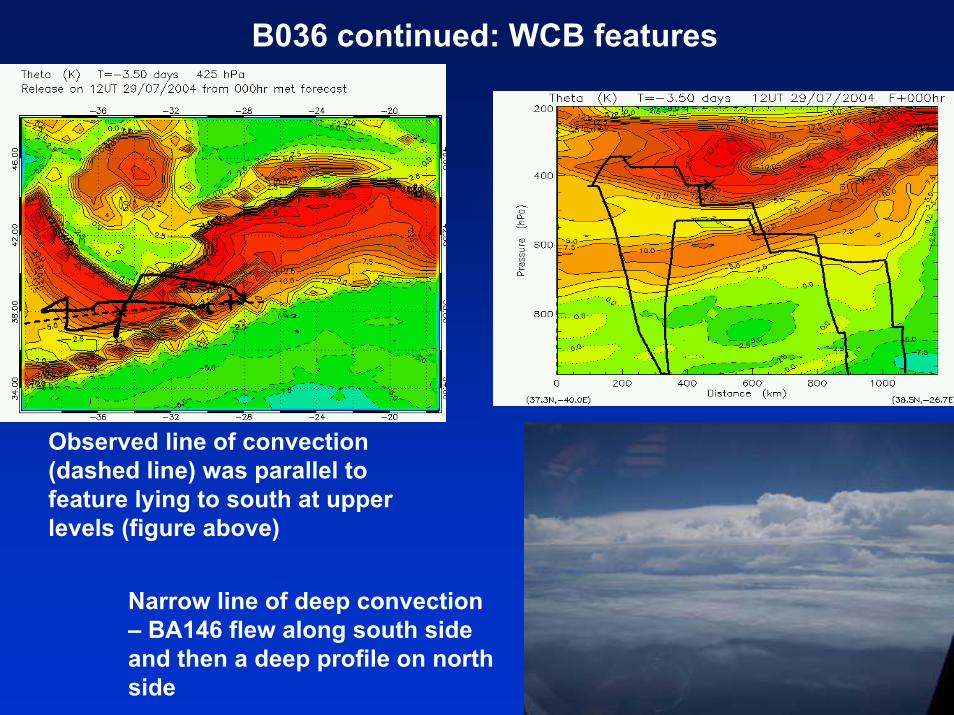
B036 continued: WCB features
Observed line of convection (dashed line) was parallel to feature lying to south at upper levels (figure above)
Narrow line of deep convection – BA146 flew along south side and then a deep profile on north side

Flight B036
Acetone and acetaldehydeFlight Track
Bottom of WCB outflow at FL180-160.Through Cu-Nim gap
Along southern edge of WCB
Along northern edge of WCB
North of WCBSouthern edge of WCB
PAN
EthaneAcetylenepropene
Passing north through western end of line of convection
Crossing line of convection at western edge

B037: 31/07/04 Low level WCB (1)
Target already sampled by P3 on 27 and 28 July

B037 continued: forest fire mixed with stratospheric air
strat strat
fire
fire
strat
stratfire
Strong evidence for forest fire CO mixed with stratospheric ozone

B038: 01/08/04 Low level WCB (2)
firemid-American
Rapidly receding target already sampled by P3 on 27 and 28 July and BAe146 on 31 July.

Possible multiple interception of New York polluted airmass: 1
4 day forward trajectories from part of NOAA P3 flight track immediately downwindof New York City on 15/7(CO very variable between 140-240ppb).
BAE146 flight intercepted this air on 19/7(saw CO ~ 115-125ppb).
7 day forward trajectories from NOAA P3flight off NYC on 15/7.
Intercepted by DLR Falcon off NW corner of Spain on 22/7(saw CO ~ 90-100ppb).
10 day forward trajectories from NOAA P3flight off NYC on 15/7. Airmass doubles back from Spain to the Azores.
BAE146 flight intercepted this air again on 25/7 (saw increased CO ~ 115-125ppb).

Sensitivity Analysis
Use Lagrangian model to investigate sensitivity of trans-Atlantic ∆O3 to:
- Mixing rate- Cloud cover- ECMWF water vapour- NMHC complexity- Initial conditions

Mixing Rate
τ=2d
τ=5d
τ=10d
No mix
More NOx mixed into air mass ⇒ more ozone producedmore ozone produced

NMHC complexity
Standard NMHCs
+ acetone
+ acetone + C4-C7
Formation of PAN through NMHC oxidation ⇒ less less NOxNOx available for ozone productionavailable for ozone production

Conclusions
Trajectory forecasts are sufficiently accurate to execute intercontinental Lagrangian experiment.
Uncertainties in observed ∆O3 and air-mass matches influence diagnosis of trans-Atlantic photochemical ∆O3.
Investigations Underway
Constraint of mixing term through hydrocarbons.
Full Monte-Carlo analysis using Lagrangian model.
Can reduced chemical mechanisms describe the observed change in composition or is complexity unavoidable?

Possible multiple interception of New York polluted airmass 2First BAE146 interception flight into NYC air 19/7
• NOx emissions tracer on 925hPa on 19/7 with BAE146 (air mass relative) flight track overlaid. • High NOx predicted from NYC outflow.• Obtained using RDF3D trajectories and also accumulating NOx from EDGAR emissions inventory when in ECMWFboundary layer.
•Section along dashed line, with flight track assolid grey line.•Didn’t quite reach target X but into NYC air with similar characteristics and origin.•BAE146 reached over 1000km range on a round trip (flight duration of 5hr46).
Back trajectories calculated from flight track confirm NYC as being at air mass origin
Long
Lat
Horta

Identifying Lagrangian Opportunities
Selected out of ~30000 trajs from each domain based on criteria:
1. Passing within range of 2 or 3 bases (Pease, Azores, Creil),2. Accumulated NOx emissions > threshold (along back trajs),3. Further NOx emissions < threshold (along forward trajs).
(surface emissions [EDGAR] are picked up within BL as defined by ECMWF forecasts)
Black diamonds – 2-point opportunitiesGreen triangles – 3-point opportunities
(US – Azores – Europe) Red squares - 3-point opportunities
(any other order)
Example
Forward trajs from US domain
Release time 12UT 15 July 2004 Based on ECMWF forecast from 12UT 14 July 2004
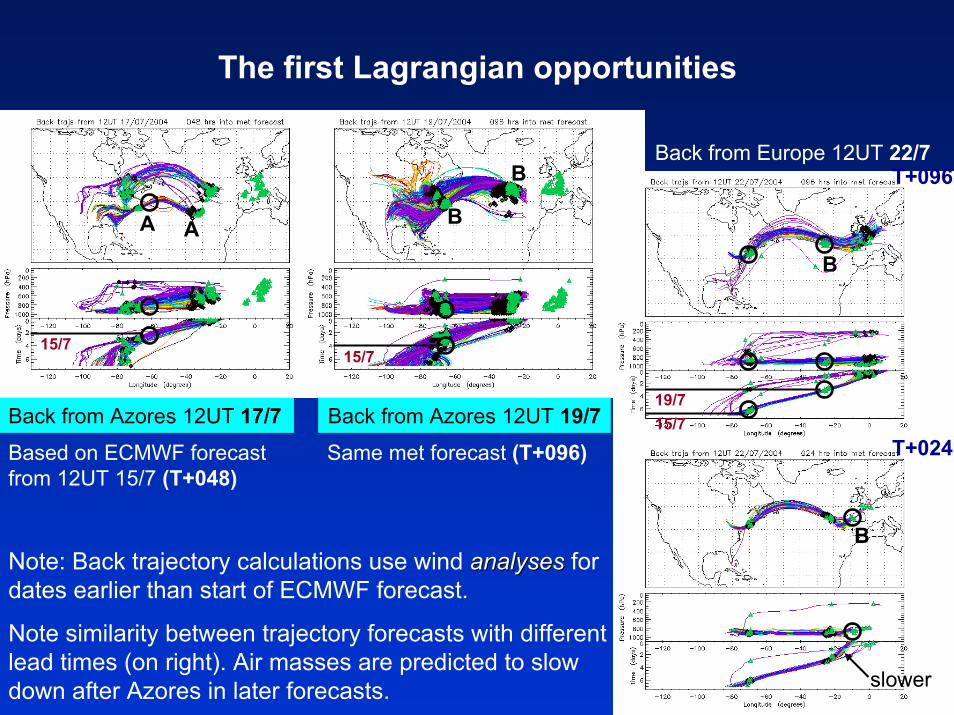
The first Lagrangian opportunities
Back from Azores 12UT 17/7Based on ECMWF forecast from 12UT 15/7 (T+048)
A A
15/7
Back from Azores 12UT 19/7Same met forecast (T+096)
B
B
15/7
Back from Europe 12UT 22/7T+096
B
15/719/7
T+024
B
slower
Note: Back trajectory calculations use wind analysesanalyses for dates earlier than start of ECMWF forecast.
Note similarity between trajectory forecasts with different lead times (on right). Air masses are predicted to slow down after Azores in later forecasts.

Sample collection