ispod district report - moore 10oct01
Upload: north-carolina-alliance-for-athletics-health-physical-education-recreation-and-dance-ncaahperd
Post on 08-Mar-2016
213 views
DESCRIPTION
IsPOD Data Results Spring 2010 2010 NC IsPOD Evaluation All rights reserved. DEMOGRAPHICS SPARK FITNESSGRAM % Needy ID School Name Grades 3-5 Grades 1-2 SPARK Trained? 2009- 2010 ADM Using FG? FG Response Rates 2010 NC IsPOD Evaluation Conducted by NCAAHPERD/NC DPH All rights reserved. # Staff TrainedTRANSCRIPT
2010 NC IsPOD Evaluation All rights reserved.
MOORE COUNTY
The North Carolina Alliance for Athletics, Health, Physical Education, Recreation,
and Dance (NCAAHPERD), launched In-school Prevention of Obesity and Disease (IsPOD) in 2007. The initiative began with a grant from the NC Health and Wellness Trust Fund and was expanded with grants from the Blue Cross
Blue Shield of North Carolina Foundation. The expansion to a state-wide program
is supported by a $3.6 million grant from the Kate B. Reynolds Charitable Trust. NCAAHPERD is engaged with a large network of health and physical education
groups seeking greater opportunities for a healthier and more creative North Carolina.
IsPOD Data Results
Spring 2010

2010 NC IsPOD Evaluation
Conducted by NCAAHPERD/NC DPH All rights reserved.
Moore County
SPARK Training
Staff from Moore County began receiving SPARK training in the 2008-2009
school year with the KBR Grant. Moore County has 19 K-8 public schools. Of
these 19 schools, 16 schools (or 84%) have received SPARK training. At these
schools, a total of 31 PE teachers and 0 coordinators have been trained in
SPARK. Table 1 shows the Moore County K-8 schools that have received
SPARK training and the number of staff trained. FitnessGram Response Rates
are also given for each of the K-8 schools.
Table 1
Moore County K-8 Schools
Schools with SPARK Training and FitnessGram Response Rates
ID School Name
DEMOGRAPHICS SPARK FITNESSGRAM
2009-2010 ADM
% Needy
SPARK Trained?
# Staff Trained
Using FG?
FG Response Rates
Grades 1-2
Grades 3-5
Grades 6-8
304 Aberdeen Primary 327 77% NO 0 NO 0% NA NA
308 Aberdeen Elementary 325 73% YES 1 YES NA 98% NA
312 Cameron Elementary 240 62% YES 2 NO 0% 0% NA
316 Carthage Elementary 372 58% YES 1 YES 0% 96% NA
320 Elise Middle 205 82% YES 1 NO NA NA 0%
324 Sandhills Farm Life Elem 517 25% NO 0 YES 0% 100% NA
328 Highfalls Elementary 289 35% YES 1 YES 15% 98% 101%
330 Pinckney Academy 69 100% YES 2 YES NA NA 36%
331 New Century Middle 905 41% YES 5 YES NA NA 97%
340 Academy Heights Elem 267 12% YES 2 YES 0% 32% NA
342 Pinehurst Elementary 651 25% YES 1 YES 0% 99% NA
348 Robbins Elementary 438 92% YES 1 YES 0% 97% NA
350 Southern Middle 712 53% YES 4 YES NA NA 98%
352 Southern Pines Primary 442 58% NO 0 NO 0% NA NA
356 Southern Pines Elem 421 51% YES 2 NO NA 0% NA
364 Vass-Lakeview Elem 552 65% YES 1 NO 0% 0% NA
368 West End Elementary 537 41% YES 2 YES 0% 98% NA
374 West Pine Middle 823 26% YES 3 NO NA NA 0%
376 Westmoore Elementary 414 52% YES 2 YES 0% 99% 41%
2010 NC IsPOD Evaluation Conducte4d by NCAAHPERD/NC DPH
All rights reserved.
2
Moore County
FitnessGram Response Rates
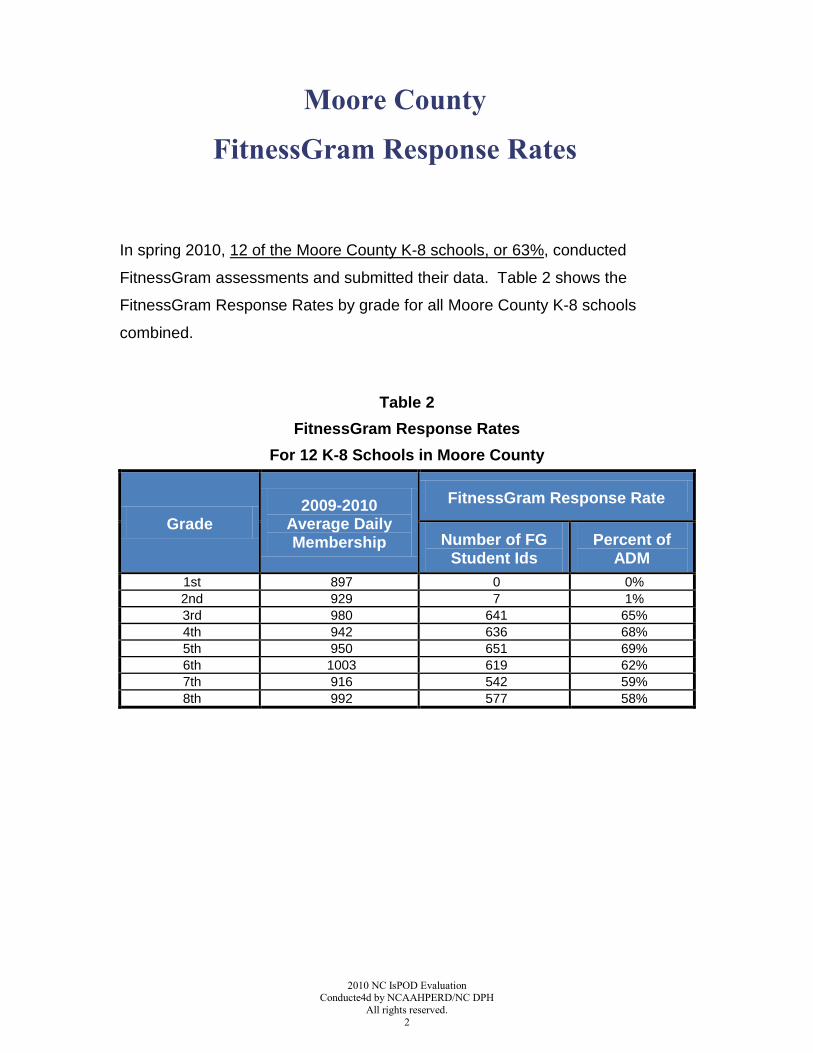
In spring 2010, 12 of the Moore County K-8 schools, or 63%, conducted
FitnessGram assessments and submitted their data. Table 2 shows the
FitnessGram Response Rates by grade for all Moore County K-8 schools
combined.
Table 2
FitnessGram Response Rates
For 12 K-8 Schools in Moore County
Grade 2009-2010
Average Daily Membership
FitnessGram Response Rate
Number of FG Student Ids
Percent of ADM
1st 897 0 0%
2nd 929 7 1%
3rd 980 641 65%
4th 942 636 68%
5th 950 651 69%
6th 1003 619 62%
7th 916 542 59%
8th 992 577 58%

2010 NC IsPOD Evaluation Conducted by NCAAHPERD/NC DPH
All rights reserved.
3
Body Mass Index (BMI)
North Carolina
Spring 2010 Percent in Health Fitness Zone (HFZ)
FitnessGram Results for 370 NC K-8 Schools in 61 NC Counties
Grade
Percent in HFZ Counts in HFZ
Female Male
Female Male
Total FG Results
N in HFZ Total FG Results
N in HFZ
1st 56% 57% 937 528 884 500
2nd 55% 57% 1175 642 1209 689
3rd 57% 55% 9670 5556 10075 5558
4th 54% 52% 9624 5227 10103 5260
5th 53% 51% 9396 4961 9857 5043
6th 54% 50% 3528 1893 3550 1785
7th 57% 52% 3315 1897 3149 1644
8th 56% 54% 3174 1780 3321 1802
56
%
55
% 57
%
54
%
53
%
54
% 57
%
56
%
57
%
57
%
55
%
52
%
51
%
50
%
52
%
54
%
0%
10%
20%
30%
40%
50%
60%
70%
80%
90%
100%
1st 2nd 3rd 4th 5th 6th 7th 8th
Pe
rce
nt
in H
FZ
Grade
Female Male

2010 NC IsPOD Evaluation Conducte4d by NCAAHPERD/NC DPH
All rights reserved.
4
Body Mass Index (BMI)
Moore County
Spring 2010 Percent in Healthy Fitness Zone (HFZ)
FitnessGram Results for 12 K-8 Schools in Moore County
Grade
Percent in HFZ Counts in HFZ
Female Male
Female Male
Total FG Results
N in HFZ Total FG Results
N in HFZ
1st NA NA 0 0 0 0
2nd 25% 33% 4 1 0 1
3rd 58% 52% 308 178 315 164
4th 52% 46% 296 154 320 146
5th 52% 53% 308 160 310 165
6th 48% 51% 306 147 301 153
7th 51% 51% 264 134 263 135
8th 52% 56% 278 145 291 163
58
%
52
%
52
%
48
% 51
%
52
%
52
%
46
%
53
%
51
%
51
% 56
%
0%
10%
20%
30%
40%
50%
60%
70%
80%
90%
100%
3rd 4th 5th 6th 7th 8th
Pe
rce
nt
in H
FZ
Grade
Female Male

2010 NC IsPOD Evaluation Conducted by NCAAHPERD/NC DPH
All rights reserved.
5
PACER
North Carolina
Spring 2010 Percent in Healthy Fitness Zone (HFZ)
FitnessGram Results for 370 NC K-8 Schools in 61 NC Counties
Grade
Percent in HFZ Counts in HFZ
Female Male
Female Male
Total FG Results
N in HFZ Total FG Results
N in HFZ
4th 95% 61% 6952 6625 7321 4485
5th 82% 58% 6569 5398 6994 4047
6th 77% 54% 1882 1452 1936 1039
7th 68% 50% 1787 1222 1825 906
8th 58% 52% 1774 1036 1908 997
95
%
82
%
77
%
68
%
58
%61
%
58
%
54
%
50
% 52
%
0%
10%
20%
30%
40%
50%
60%
70%
80%
90%
100%
4th 5th 6th 7th 8th
Pe
rce
nt
in H
FZ
Grade
Female Male

2010 NC IsPOD Evaluation Conducte4d by NCAAHPERD/NC DPH
All rights reserved.
6
PACER
Moore County
Spring 2010 Percent in Healthy Fitness Zone (HFZ)
FitnessGram Results for 12 K-8 Schools in Moore County
Grade
Percent in HFZ Counts in HFZ
Female Male
Female Male
Total FG Results
N in HFZ Total FG Results
N in HFZ
4th 95% 51% 182 173 202 104
5th 81% 50% 217 175 211 106
6th 50% 21% 150 75 159 33
7th 32% 19% 117 37 129 25
8th 14% 20% 131 18 143 28
95
%
81
%
50
%
32
%
14
%
51
%
50
%
21
%
19
%
20
%
0%
10%
20%
30%
40%
50%
60%
70%
80%
90%
100%
4th 5th 6th 7th 8th
Pe
rce
nt
in H
FZ
Grade
Female Male

2010 NC IsPOD Evaluation Conducted by NCAAHPERD/NC DPH
All rights reserved.
7
CURL-UP
North Carolina
Spring 2010 Percent in Healthy Fitness Zone (HFZ)
FitnessGram Results for 370 NC K-8 Schools in 61 NC Counties
Grade
Percent in HFZ Counts in HFZ
Female Male
Female Male
Total FG Results
N in HFZ Total FG Results
N in HFZ
1st 83% 84% 917 759 879 742
2nd 78% 79% 1260 989 1300 1032
3rd 82% 82% 11285 9254 11683 9544
4th 80% 81% 11221 8954 11729 9512
5th 78% 80% 10865 8483 11370 9152
6th 86% 87% 3857 3316 3895 3373
7th 86% 87% 3477 2978 3427 2990
8th 84% 88% 3402 2869 3448 3029
83
%
78
% 82
%
80
%
78
%
86
%
86
%
84
%
84
%
79
% 82
%
81
%
80
% 87
%
87
%
88
%
0%
10%
20%
30%
40%
50%
60%
70%
80%
90%
100%
1st 2nd 3rd 4th 5th 6th 7th 8th
Pe
rce
nt
in H
FZ
Grade
Female Male

2010 NC IsPOD Evaluation Conducte4d by NCAAHPERD/NC DPH
All rights reserved.
8
CURL-UP
Moore County
Spring 2010 Percent in Healthy Fitness Zone (HFZ)
FitnessGram Results for 12 K-8 Schools in Moore County
Grade
Percent in HFZ Counts in HFZ
Female Male
Female Male
Total FG Results
N in HFZ Total FG Results
N in HFZ
1st NA NA 0 0 0 0
2nd 100% 100% 4 4 3 3
3rd 91% 87% 311 282 317 277
4th 84% 90% 289 242 312 280
5th 83% 81% 286 238 297 242
6th 85% 83% 307 261 299 247
7th 85% 85% 268 229 261 222
8th 81% 86% 274 221 286 247
91
%
84
%
83
%
85
%
85
%
81
%87
% 90
%
81
%
83
% 85
%
86
%
0%
10%
20%
30%
40%
50%
60%
70%
80%
90%
100%
3rd 4th 5th 6th 7th 8th
Pe
rce
nt
in H
FZ
Grade
Female Male

2010 NC IsPOD Evaluation Conducted by NCAAHPERD/NC DPH
All rights reserved.
9
PUSH-UP
North Carolina
Spring 2010 Percent in Healthy Fitness Zone (HFZ)
FitnessGram Results for 370 NC K-8 Schools in 61 NC Counties
Grade
Percent in HFZ Counts in HFZ
Female Male
Female Male
Total FG Results
N in HFZ Total FG Results
N in HFZ
1st 50% 63% 627 314 592 372
2nd 48% 62% 935 451 924 573
3rd 56% 70% 9157 5163 9527 6638
4th 52% 68% 9129 4713 9510 6475
5th 52% 66% 8900 4642 9309 6117
6th 68% 72% 3092 2093 3165 2272
7th 69% 72% 2768 1912 2742 1984
8th 68% 70% 2696 1830 2811 1965
50
%
48
%
56
%
52
%
52
%
68
%
69
%
68
%
63
%
62
%
70
%
68
%
66
% 72
%
72
%
70
%
0%
10%
20%
30%
40%
50%
60%
70%
80%
90%
100%
1st 2nd 3rd 4th 5th 6th 7th 8th
Pe
rce
nt
in H
FZ
Grade
Female Male

2010 NC IsPOD Evaluation Conducte4d by NCAAHPERD/NC DPH
All rights reserved.
10
PUSH-UP
Moore County
Spring 2010 Percent in Healthy Fitness Zone (HFZ)
FitnessGram Results for 12 K-8 Schools in Moore County
Grade
Percent in HFZ Counts in HFZ
Female Male
Female Male
Total FG Results
N in HFZ Total FG Results
N in HFZ
1st NA NA 0 0 0 0
2nd 50% 100% 4 2 3 3
3rd 37% 59% 261 96 265 156
4th 39% 62% 251 97 266 164
5th 32% 58% 257 81 266 153
6th 72% 73% 199 144 185 135
7th 87% 77% 172 150 149 114
8th 78% 74% 157 123 152 113
37
%
39
%
32
%
72
%
87
%
78
%
59
% 62
%
58
%
73
% 77
%
74
%
0%
10%
20%
30%
40%
50%
60%
70%
80%
90%
100%
3rd 4th 5th 6th 7th 8th
Pe
rce
nt
in H
FZ
Grade
Female Male

2010 NC IsPOD Evaluation Conducted by NCAAHPERD/NC DPH
All rights reserved.
11
SIT AND REACH
North Carolina
Spring 2010 Percent in Healthy Fitness Zone (HFZ)
FitnessGram Results for 370 NC K-8 Schools in 61 NC Counties
Grade
Percent in HFZ Counts in HFZ
Female Male
Female Male
Total FG Results
N in HFZ Total FG Results
N in HFZ
1st 66% 64% 702 460 664 423
2nd 68% 66% 922 629 935 618
3rd 70% 69% 6371 4486 6681 4581
4th 69% 65% 6229 4292 6596 4319
5th 62% 62% 6219 3839 6558 4060
6th 58% 58% 2371 1376 2445 1413
7th 66% 65% 2197 1447 2134 1382
8th 66% 67% 2131 1411 2247 1510
66
% 68
%
70
%
69
%
62
%
58
%
66
%
66
%
64
% 66
% 69
%
65
%
62
%
58
%
65
% 67
%
0%
10%
20%
30%
40%
50%
60%
70%
80%
90%
100%
1st 2nd 3rd 4th 5th 6th 7th 8th
Pe
rce
nt
in H
FZ
Grade
Female Male

2010 NC IsPOD Evaluation Conducte4d by NCAAHPERD/NC DPH
All rights reserved.
12
SIT AND REACH
Moore County
Spring 2010 Percent in Healthy Fitness Zone (HFZ)
FitnessGram Results for 12 K-8 Schools in Moore County
Grade
Percent in HFZ Counts in HFZ
Female Male
Female Male
Total FG Results
N in HFZ Total FG Results
N in HFZ
1st NA NA 0 0 0 0
2nd NA NA 0 0 0 0
3rd 50% 55% 296 149 306 167
4th 53% 48% 285 151 309 148
5th 45% 46% 287 129 287 133
6th 38% 31% 289 110 285 89
7th 51% 45% 243 124 249 112
8th 47% 41% 257 121 273 113
50
% 53
%
45
%
38
%
51
%
47
%
55
%
48
%
46
%
31
%
45
%
41
%
0%
10%
20%
30%
40%
50%
60%
70%
80%
90%
100%
3rd 4th 5th 6th 7th 8th
Pe
rce
nt
in H
FZ
Grade
Female Male

2010 NC IsPOD Evaluation Conducted by NCAAHPERD/NC DPH
All rights reserved.
13
TRUNK LIFT
North Carolina
Spring 2010 Percent in Healthy Fitness Zone (HFZ)
FitnessGram Results for 370 NC K-8 Schools in 61 NC Counties
Grade
Percent in HFZ Counts in HFZ
Female Male
Female Male
Total FG Results
N in HFZ Total FG Results
N in HFZ
1st 91% 88% 744 680 746 659
2nd 91% 92% 1063 963 1056 971
3rd 93% 91% 10281 9572 10608 9648
4th 84% 80% 10205 8587 10688 8573
5th 81% 77% 9821 7973 10336 8001
6th 83% 79% 3438 2859 3361 2646
7th 82% 77% 3231 2656 3086 2364
8th 84% 79% 3136 2631 3161 2492
91
%
91
% 93
%
84
%
81
%
83
%
82
%
84
%88
% 92
%
91
%
80
%
77
%
79
%
77
%
79
%
0%
10%
20%
30%
40%
50%
60%
70%
80%
90%
100%
1st 2nd 3rd 4th 5th 6th 7th 8th
Pe
rce
nt
in H
FZ
Grade
Female Male

2010 NC IsPOD Evaluation Conducte4d by NCAAHPERD/NC DPH
All rights reserved.
14
TRUNK LIFT
Moore County
Spring 2010 Percent in Healthy Fitness Zone (HFZ)
FitnessGram Results for 12 K-8 School in Moore County
Grade
Percent in HFZ Counts in HFZ
Female Male
Female Male
Total FG Results
N in HFZ Total FG Results
N in HFZ
1st NA NA 0 0 0 0
2nd 100% 100% 4 4 3 3
3rd 95% 96% 259 245 265 254
4th 89% 88% 253 226 275 243
5th 89% 86% 260 232 261 224
6th 43% 40% 309 132 303 121
7th 38% 34% 256 97 257 87
8th 51% 37% 273 138 284 105
95
%
89
%
89
%
43
%
38
%
51
%
96
%
88
%
86
%
40
%
34
% 37
%
0%
10%
20%
30%
40%
50%
60%
70%
80%
90%
100%
3rd 4th 5th 6th 7th 8th
Pe
rce
nt
in H
FZ
Grade
Female Male