issaquah high school #4 and elementary #17 noise …
TRANSCRIPT

ISSAQUAH HIGH SCHOOL #4 AND ELEMENTARY #17 NOISE STUDY ISSAQUAH, WASHINGTON
September 2, 2020
Prepared for:
Prepared by:
1900 West Nickerson Street Suite 201
Seattle, Washington 98107

September 2, 2020 Page 1 Issaquah High School #4 and Elementary School #17 Noise Study
The Greenbusch Group, Inc. p) 206.378.0569 f) 206.378-0641 www.greenbusch.com 1900 West Nickerson Street, Suite 201 Seattle, WA 98119
INTRODUCTION This Noise Study evaluates sound levels associated with the new High School (HS) #4 and Elementary School (ES) #17 project (“Project”) located at 4221 228th Ave Southeast in Issaquah, Washington and is an update to the Draft Issaquah High School #4 and Elementary School #17 Noise Study issued in 2019. Project sound sources include stationary mechanical equipment, on-site traffic, a school bus lot, two loading docks, and a Scene Shop. Updates to rooftop mechanical equipment and on-site traffic routes are included in this Noise Study. This Noise Study also includes a discussion of compliance with local regulatory criteria, ambient sound level measurements, predicted sound levels at neighboring property lines, and recommend mitigation measures. A separate noise study was issued for the football stadium in October 2019.
SUMMARY Based on the analysis presented in this Noise Study updated sound levels for stationary equipment and on-site traffic routes are anticipated to comply with Issaquah Municipal Code and Sammamish Municipal Code sound level limits and regulations with the addition of mitigation measured recommended in the Draft Issaquah High School #4 and Elementary School #17 Noise Study issued in 2019. Updated mitigation measures include a recommendation for pre-trip checks in the school bus lot to not occur between 10:00 PM and 7:00 AM.
NOMENCLATURE
Decibel The auditory response to sound is a complex process that occurs over a wide range of frequencies and intensities. Decibel levels, or “dB,” are a form of shorthand that compresses this broad range of intensities with a convenient numerical scale. The decibel scale is logarithmic. For example, using the decibel scale, a doubling or halving of energy causes the sound level to change by 3 dB; it does not double or halve the sound loudness as might be expected.
The minimum sound level variation perceptible to a human observer is generally around 3-dB. A 5-dB change is clearly perceptible, and an 8 to 10 dB change is associated with a perceived doubling or halving of loudness. The human ear has a unique response to sound pressure. It is less sensitive to those sounds falling outside the speech frequency range. Sound level meters and monitors utilize a filtering system to approximate human perception of sound. Measurements made utilizing this filtering system are referred to as “A weighted” and are called “dBA”. Common sound pressure levels are reported below in Table 1.

September 2, 2020 Page 2 Issaquah High School #4 and Elementary School #17 Noise Study
The Greenbusch Group, Inc. p) 206.378.0569 f) 206.378-0641 www.greenbusch.com 1900 West Nickerson Street, Suite 201 Seattle, WA 98119
Table 1. A-weighted Levels of Common Sounds
Sound Sound Level
(dBA) Approximate Relative
Loudness1
Jet Plane @ 100 feet 130 128
Rock Music with Amplifier 120 64
Thunder, Danger of Permanent Hearing Loss 110 32
Boiler Shop, Power Mower 100 16
Orchestral Crescendo at 25 feet 90 8
Busy Street 80 4
Interior of Department Store 70 2
Ordinary Conversation @ 3 feet 60 1
Quiet Car at Low Speed 50 1/2
Average Office 40 1/4
City Residence, Interior 30 1/8
Quiet Country Residence, Interior 20 1/16
Rustle of Leaves 10 1/32
Threshold of Hearing 0 1/64
1. As compared to ordinary conversation at 3 feet.
Source: US Department of Housing and Urban Development, Aircraft Noise Impact Planning Guidelines for Local Agencies, November 1972.
Metrics
• Equivalent Sound Level, Leq Leq is the A-weighted level of a constant sound having the same energy content as the actual time-varying level during a specified interval. The Leq is used to characterize complex, fluctuating sound levels with a single number. Typical intervals for Leq are hourly, daily and annually.
• Sound Pressure Level, SPL Sound pressure level correlates with what is heard by the human ear. SPL is defined as the squared ratio of the sound pressure with reference to 20 μPa. Sound pressure is affected by distance, path, barriers, directivity, etc.
• Sound Power Level, LwA Sound power is the amount of energy per second generated by a source, measured in watts. The sound power level (LwA) is a decibel representation with a reference value of 1 pico-watt (pW). Sound power is independent of distance, path, or influence from any nearby surfaces.
REGULATORY CRITERIA Noise emissions from the Project are governed by the Issaquah Municipal Code (IMC), Sammamish Municipal Code (SMC), and Washington Administrative Code (WAC).
Issaquah Municipal Code IMC Chapter 18.07.136 adopts, by reference, the Washington Administrative Code (WAC) Chapters 173-60-020 through 173-60-050:
IMC Chapter 18.07.136.B specifically limits sound levels from mechanical equipment to those listed in WAC 173-60-040. IMC Chapter 18.07.136.C provides an exemption from sound limits

September 2, 2020 Page 3 Issaquah High School #4 and Elementary School #17 Noise Study
The Greenbusch Group, Inc. p) 206.378.0569 f) 206.378-0641 www.greenbusch.com 1900 West Nickerson Street, Suite 201 Seattle, WA 98119
during emergency situations as defined by the City’s Comprehensive Emergency Management Plan.
Chapter 9.22.101 classifies noise as a public disturbance. A public disturbance Noise is defined as a person causing noise, or any person in possession of property allowing noise to originate from the property. The following sounds are determined to be public disturbance noises:
• The frequent, repetitive or continuous sounding of any horn or siren attached to a motor vehicle, except as a warning of danger or as specifically permitted or required by law;
• The creation of frequent, repetitive or continuous sounds in connection with the starting, operation, repair, rebuilding or testing of any motor vehicle, motorcycle, off-highway vehicle or internal combustion engine within a residential district so to unreasonably disturb or interfere with the peace, comfort and repose of owners or possessors of real property;
• Yelling, shouting, hooting, whistling or singing on or near the public streets, particularly between the hours of 11:00 PM and 7:00 AM or at any time and place so as to unreasonably disturb or interfere with the peace, comfort and repose of owners or possessors of real property;
• The creation of frequent, repetitive or continuous sounds which emanate from any building, structure, apartment or condominium, which unreasonably interferes with the peace, comfort and repose of owners or possessors of real property, such as sounds from musical instruments, audio sound systems, band sessions or social gatherings;
• Sound from any motor vehicle audio sound systems, such as tape players, radios and compact disc players, operated at volumes so as to be audible greater than 50 feet from the vehicle itself;
• Frequent, repetitive or continuous noise made by any animal which unreasonably disturbs or interferes with the peace, comfort and repose of property owners or possessors, except that such sound shall be exempt when originating from lawfully operated animal shelters, kennels, pet shops and veterinary clinics;
• The use of a sound amplifier or other device capable of producing or reproducing amplified sound on public streets for the purpose of commercial advertising or sales or for attracting the attention of the public to any vehicle, structure or property or the contents therein, except that vendors whose sole method of selling is from a moving vehicle shall be exempt from this subsection;
• Sound from portable audio equipment, such as tape players, radios and compact disc players, operated a volume so as to be audible greater than 50 feet from the source, and if not operated upon the property of the owner;
The foregoing provisions shall not apply to regularly scheduled events at parks, such as public address systems for baseball games or park concerts.
Sammamish Municipal Code Although the Project is located within the City of Issaquah, properties located east of 228th Avenue Southeast are within the City of Sammamish. Sounds produced by the Project that are received within the City of Sammamish are subject to City of Sammamish regulatory criteria. Noise emissions within the City of Sammamish are regulated under SMC Chapter 8.15. The code addresses noise as a public disturbance with similar language as the IMC.
Since SMC does not quantify sound level limits, regulatory criteria for the City of Sammamish will be sound level limits established by WAC. These limits are applied at the property line of the receiving properties within the City of Issaquah and the City of Sammamish.

September 2, 2020 Page 4 Issaquah High School #4 and Elementary School #17 Noise Study
The Greenbusch Group, Inc. p) 206.378.0569 f) 206.378-0641 www.greenbusch.com 1900 West Nickerson Street, Suite 201 Seattle, WA 98119
Washington Administrative Code Permissible noise levels established in the State of Washington Administrative Code (WAC) 173-60 are defined by the environmental designation for noise abatement (EDNA) of the area, which is based upon present, future and historical use land use. WAC 173-60-030 defines the EDNA classifications as follows:
• Class A EDNA – “Lands where human beings reside and sleep.” Typically, the following types of property are included:
o Residential o Multiple family living accommodations o Recreational and entertainment (camps, parks, camping facilities, and resorts)
• Class B EDNA – “Lands involving uses requiring protection against noise interference with speech.” Typically, these properties include the following:
o Commercial living accommodations o Commercial dining establishments o Motor vehicle services o Retail services o Banks and office buildings o Miscellaneous commercial services, property not used for human habitation o Recreation and entertainment, property not used for human habitation (theaters,
stadiums, fairgrounds, and amusement parks) o Community services, property not used for human habitation (educational,
religious, governmental, cultural, and recreational facilities)
• Class C EDNA – “Lands involving economic activities of such a nature that higher noise levels than experienced in other areas is normally to be anticipated.” Typically, these properties include the following:
o Storage, warehouse, and distribution centers o Industrial property used for the production and fabrication of durable and
nondurable manmade goods o Agricultural and silvicultural property used for the production of crops, wood
products, or livestock
The maximum permissible hourly sound levels associated with the various EDNA classifications are shown in Table 2.
Table 2. Maximum Permissible Sound Levels, dBA
EDNA of Source Property EDNA of Receiving Property
Class A Class B Class C
Class A 55 57 60
Class B 57 60 65
Class C 60 65 70 Source: WAC Chapter 173-60

September 2, 2020 Page 5 Issaquah High School #4 and Elementary School #17 Noise Study
The Greenbusch Group, Inc. p) 206.378.0569 f) 206.378-0641 www.greenbusch.com 1900 West Nickerson Street, Suite 201 Seattle, WA 98119
Modifications to the sound level limits set forth in Table 2 are provided in WAC 173-60-040 and include the following:
• Sound levels are reduced by 10 dB between the hours of 10:00 PM and 7:00 AM for Class A EDNA receiving properties
• Sound level increases for short durations for any receiving property at any time as follows: o 5 dB for a total of 15 minutes in any one-hour period; or o 10 dB for a total of 5 minutes in any one-hour period; or o 15 dB for a total of 1.5 minutes in any one-hour period
WAC 173-60-050-3.f exempts sounds created by emergency equipment and work necessary in the interests of law enforcement or for the health, safety or welfare of the community from the WAC 173-60-040 sound level limits.
Because the Project will be used for educational purposes the property is considered a Class B EDNA, resulting in the maximum permissible sound levels provided in Table 3.
Table 3. Maximum Permissible Sound Levels, dBA
EDNA of Source Property
WAC Daytime Sound Level Limits
WAC Nighttime Sound Level Limits
North
57 47 South
East
West Source: WAC Chapter 173-60
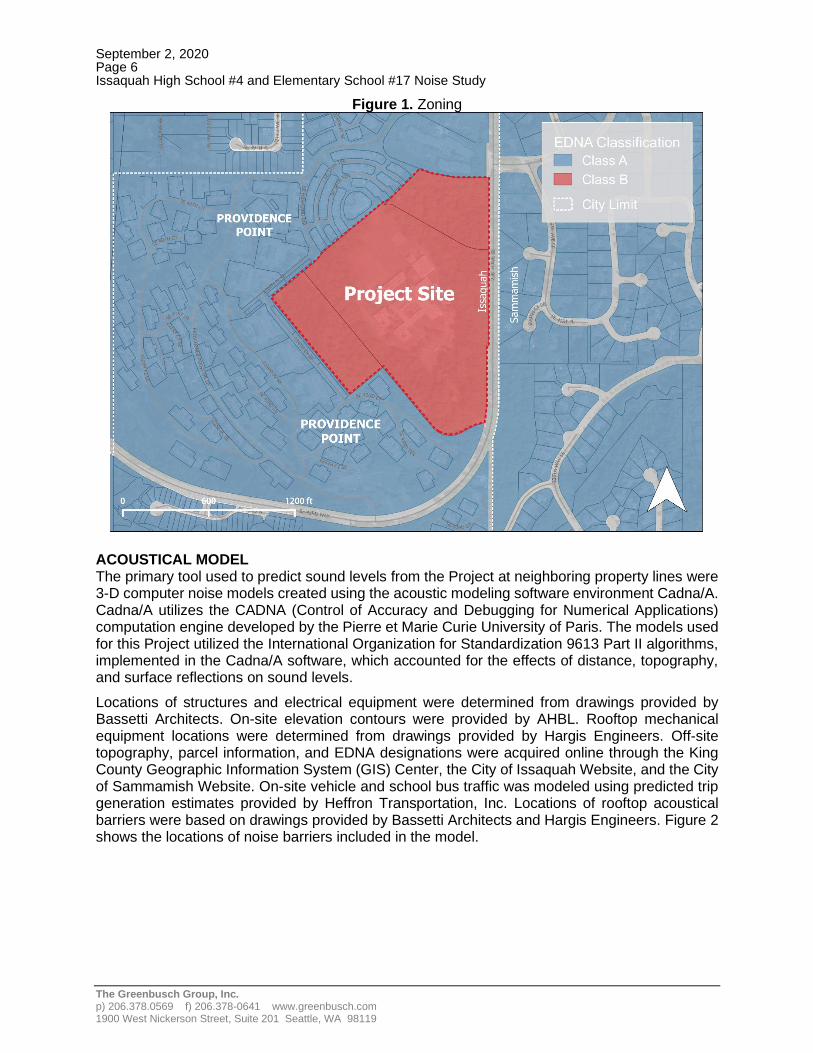
Zoning
The Project is located within the City of Issaquah. The City of Sammamish borders the Project to the east. A retirement community (Providence Point) is located along the Project’s north, west, and south property boundaries. Single-Family Residential homes are located east of the Project in the City of Sammamish. All properties adjacent to the Project are Class A EDNA. The EDNA classifications of the Project and nearby properties are illustrated in Figure 1 below.
September 2, 2020 Page 6 Issaquah High School #4 and Elementary School #17 Noise Study
The Greenbusch Group, Inc. p) 206.378.0569 f) 206.378-0641 www.greenbusch.com 1900 West Nickerson Street, Suite 201 Seattle, WA 98119
Figure 1. Zoning
ACOUSTICAL MODEL The primary tool used to predict sound levels from the Project at neighboring property lines were 3-D computer noise models created using the acoustic modeling software environment Cadna/A. Cadna/A utilizes the CADNA (Control of Accuracy and Debugging for Numerical Applications) computation engine developed by the Pierre et Marie Curie University of Paris. The models used for this Project utilized the International Organization for Standardization 9613 Part II algorithms, implemented in the Cadna/A software, which accounted for the effects of distance, topography, and surface reflections on sound levels.
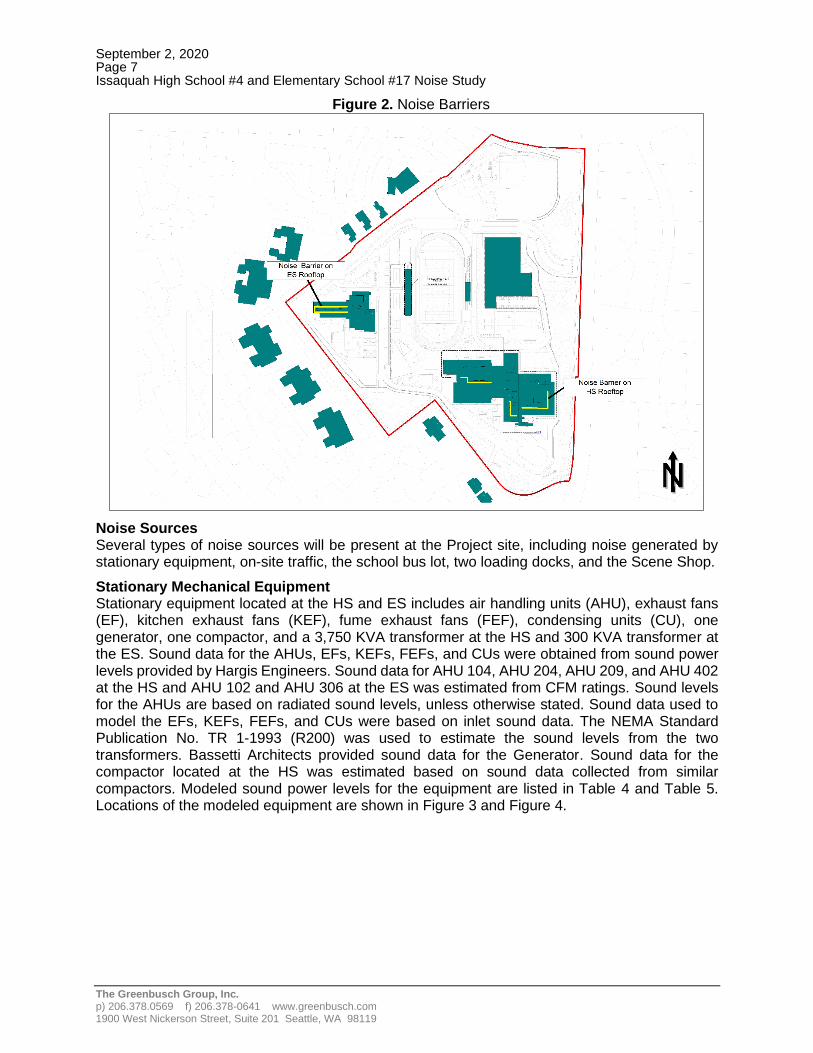
Locations of structures and electrical equipment were determined from drawings provided by Bassetti Architects. On-site elevation contours were provided by AHBL. Rooftop mechanical equipment locations were determined from drawings provided by Hargis Engineers. Off-site topography, parcel information, and EDNA designations were acquired online through the King County Geographic Information System (GIS) Center, the City of Issaquah Website, and the City of Sammamish Website. On-site vehicle and school bus traffic was modeled using predicted trip generation estimates provided by Heffron Transportation, Inc. Locations of rooftop acoustical barriers were based on drawings provided by Bassetti Architects and Hargis Engineers. Figure 2 shows the locations of noise barriers included in the model.
September 2, 2020 Page 7 Issaquah High School #4 and Elementary School #17 Noise Study
The Greenbusch Group, Inc. p) 206.378.0569 f) 206.378-0641 www.greenbusch.com 1900 West Nickerson Street, Suite 201 Seattle, WA 98119
Figure 2. Noise Barriers
Noise Sources Several types of noise sources will be present at the Project site, including noise generated by stationary equipment, on-site traffic, the school bus lot, two loading docks, and the Scene Shop.
Stationary Mechanical Equipment Stationary equipment located at the HS and ES includes air handling units (AHU), exhaust fans (EF), kitchen exhaust fans (KEF), fume exhaust fans (FEF), condensing units (CU), one generator, one compactor, and a 3,750 KVA transformer at the HS and 300 KVA transformer at the ES. Sound data for the AHUs, EFs, KEFs, FEFs, and CUs were obtained from sound power levels provided by Hargis Engineers. Sound data for AHU 104, AHU 204, AHU 209, and AHU 402 at the HS and AHU 102 and AHU 306 at the ES was estimated from CFM ratings. Sound levels for the AHUs are based on radiated sound levels, unless otherwise stated. Sound data used to model the EFs, KEFs, FEFs, and CUs were based on inlet sound data. The NEMA Standard Publication No. TR 1-1993 (R200) was used to estimate the sound levels from the two transformers. Bassetti Architects provided sound data for the Generator. Sound data for the compactor located at the HS was estimated based on sound data collected from similar compactors. Modeled sound power levels for the equipment are listed in Table 4 and Table 5. Locations of the modeled equipment are shown in Figure 3 and Figure 4.

September 2, 2020 Page 8 Issaquah High School #4 and Elementary School #17 Noise Study
The Greenbusch Group, Inc. p) 206.378.0569 f) 206.378-0641 www.greenbusch.com 1900 West Nickerson Street, Suite 201 Seattle, WA 98119
Table 4. Stationary Equipment Sound Power Levels at the High School, dB re: 1 pW
Stationary Equipment
Frequency, Hz LwA
63 125 250 500 1,000 2,000 4,000 8,000
AHU
AHU 102 80 74 76 76 75 72 73 65 84
AHU 103 80 74 76 76 75 72 73 65 84
AHU 104 79 83 82 74 69 64 59 59 87
AHU 105 44 78 83 88 88 86 85 82 94
AHU 106 80 74 76 76 75 72 73 65 84
AHU 107 85 85 81 78 76 71 64 57 89
AHU 108 80 74 76 76 75 72 73 65 84
AHU 109A/B 44 78 83 88 88 86 85 82 94
AHU 110 80 74 76 76 75 72 73 65 84
AHU 201 80 74 76 76 75 72 73 65 84
AHU 202 80 74 76 76 75 72 73 65 84
AHU 203 85 85 81 78 76 71 64 57 89
AHU 204 79 83 82 74 69 64 59 59 87
AHU 205A 44 78 83 88 88 86 85 82 94
AHU 205B 44 78 83 87 88 86 86 82 94
AHU 206 80 74 76 76 75 72 73 65 84
AHU 207 80 74 76 76 75 72 73 65 84
AHU 208 85 85 81 78 76 71 64 57 89
AHU 209 79 83 82 74 69 64 59 59 87
AHU 301 44 78 83 88 88 86 85 82 94
AHU 302 85 85 81 78 76 71 64 57 89
AHU 303 44 78 83 88 88 86 85 82 94
AHU 304 85 85 81 78 76 71 64 57 89
AHU 401 44 78 83 88 88 86 85 82 94
AHU 402 79 83 82 74 69 64 59 59 87
AHU 403 85 85 81 78 76 71 64 57 89
AHU 404 80 74 76 76 75 72 73 65 84
AHU 405 80 74 76 76 75 72 73 65 84
AHU 406 85 85 81 78 76 71 64 57 89
AHU 407 85 85 81 78 76 71 64 57 89
AHU 408 80 74 76 76 75 72 73 65 84
AHU 409 80 74 76 76 75 72 73 65 84
EF
EF 101 77 75 71 73 68 67 63 59 81

September 2, 2020 Page 9 Issaquah High School #4 and Elementary School #17 Noise Study
The Greenbusch Group, Inc. p) 206.378.0569 f) 206.378-0641 www.greenbusch.com 1900 West Nickerson Street, Suite 201 Seattle, WA 98119
Stationary Equipment
Frequency, Hz LwA
63 125 250 500 1,000 2,000 4,000 8,000
EF 102 81 77 76 70 63 62 58 54 84
EF 103 71 71 71 63 57 57 51 46 76
EF 203 71 69 66 61 58 57 52 42 74
EF 204 69 75 69 65 64 60 55 50 77
EF 301 74 73 75 71 64 60 57 52 80
EF 401 77 75 71 73 68 67 63 59 81
EF 402 78 69 63 56 50 49 42 35 79
FEF
FEF 301 72 67 63 55 52 52 40 35 74
FEF 302 72 67 63 55 52 52 40 35 74
FEF 303 72 67 63 55 52 52 40 35 74
FEF 304 72 67 63 55 52 52 40 35 74
FEF 305 72 67 63 55 52 52 40 35 74
FEF 306 72 67 63 55 52 52 40 35 74
FEF 307 72 67 63 55 52 52 40 35 74
FEF 308 72 67 63 55 52 52 40 35 74
KEF
KEF 301 81 77 79 72 65 63 60 56 84
KEF 302 79 77 81 71 66 64 61 56 84
KEF 303 74 72 75 67 61 62 56 51 79
CU
CU 301 69 73 67 69 68 64 59 60 72
Other
Generator1 - - - - - - - - 97
Compactor2 - - - - - - - - 112
Transformer3 - - - - - - - - 84 1. Sound level of 72 dBA at 23 feet based on a generator sound data provided by Bassetti Architects 2. Estimated sound level of 80 dBA at a distance of 50 feet. 3. Sound level of 71 dBA at a distance of 20 feet based on NEMA Standards

September 2, 2020 Page 10 Issaquah High School #4 and Elementary School #17 Noise Study
The Greenbusch Group, Inc. p) 206.378.0569 f) 206.378-0641 www.greenbusch.com 1900 West Nickerson Street, Suite 201 Seattle, WA 98119
Table 5. Stationary Equipment Sound Power Levels at the Elementary School, dB re: 1 pW
Stationary Equipment
Frequency, Hz LwA
63 125 250 500 1,000 2,000 4,000 8,000
AHU
AHU 101 44 78 83 88 88 86 85 82 94
AHU 102 79 83 82 74 69 64 59 59 87
AHU 103 80 74 76 76 75 72 73 65 84
AHU 104 85 85 81 78 76 71 64 57 89
AHU 105 44 78 83 88 88 86 85 82 94
AHU 202 85 85 81 78 76 71 64 57 89
AHU 203 85 85 81 78 76 71 64 57 89
AHU 301 80 74 76 76 75 72 73 65 84
AHU 302 80 74 76 76 75 72 73 65 84
AHU 303 80 74 76 76 75 72 73 65 84
AHU 304 80 74 76 76 75 72 73 65 84
AHU 305 82 82 78 75 73 68 61 54 86
AHU 306 79 83 82 74 69 64 59 59 87
EF
EF 101 76 72 69 62 54 55 49 35 78
EF 102 75 79 82 75 68 68 62 57 85
EF 104 79 77 64 56 52 45 36 35 81
EF 201 77 72 72 67 62 62 59 51 80
EF 202 71 80 78 71 64 68 58 52 83
EF 203 71 69 66 60 57 56 50 41 74
EF 301 71 74 68 61 59 57 49 46 77
EF 302 68 68 61 60 53 49 45 41 72
KEF
KEF 201 75 76 77 75 68 64 58 51 82
KEF 202 73 71 71 66 62 61 56 48 77
CU
CU 301 69 73 67 69 68 64 59 60 72
Other
Transformer1 - - - - - - - - 80 1. Sound level of 67 dBA at a distance of 20 feet based on NEMA Standards

September 2, 2020 Page 11 Issaquah High School #4 and Elementary School #17 Noise Study
The Greenbusch Group, Inc. p) 206.378.0569 f) 206.378-0641 www.greenbusch.com 1900 West Nickerson Street, Suite 201 Seattle, WA 98119
Figure 3. Stationary Equipment Modeled at the High School
Figure 4. Stationary Equipment Modeled at Elementary School

September 2, 2020 Page 12 Issaquah High School #4 and Elementary School #17 Noise Study
The Greenbusch Group, Inc. p) 206.378.0569 f) 206.378-0641 www.greenbusch.com 1900 West Nickerson Street, Suite 201 Seattle, WA 98119
On-Site Traffic On-site vehicle and school bus traffic was modeled using predicted trip generation estimates provided by Heffron Transportation, Inc. Traffic data used in the computer noise models consist of peak daytime and nighttime hours. The peak nighttime hour at the HS and ES is 6:00 AM to 7:00 AM. Daily trips for the HS and ES do not coincide with each other because the schools have different start times. Due to this, peak hours for the HS and ES were modeled separately. The peak daytime hour at the HS is 7:00 AM to 8:00 AM, while the peak daytime hour at the ES is from 8:15 AM to 9:15 AM.
In addition to vehicles and school buses, one commercial delivery vehicle is anticipated to enter and exit the property to service both schools daily. The commercial delivery vehicle was modeled during peak daytime HS and ES hours.
Table 6 below lists trip generation estimates for 6:00 AM to 7:00 AM, 7:00 AM to 8:00 AM, and 8:15 AM to 9:15 AM. Estimates were adjusted from the Heffron report to show the approximate traffic volume for each anticipated traffic route.
Table 6. Modeled Trip Generation Estimates, Vehicles Per Hour
Traffic Routes 6:00 AM – 7:00
AM (Peak Nighttime)
7:00 AM – 8:00 AM (Peak
Daytime HS)
8:15 AM – 9:15 AM (Peak
Daytime ES)
HS Passenger Load Inbound 18 344 12
HS Passenger Load Outbound 18 344 12
HS Parking Inbound 12 309 8
ES Passenger Load Inbound - 59 147
ES Passenger Load Outbound - 59 147
HS Employee Inbound 124 114 -
ES Employee Inbound - 74 23
Bus Employee Inbound 30 - -
Bus Employee Outbound - - 30
School Bus Inbound - 30 6
School Bus Outbound 30 6 -
Commercial Inbound - 1 1
Commercial Outbound - 1 1
Traffic routes were based on drawings provided by Bassetti Architects. On-site traffic routes include HS passenger load inbound and outbound, ES passenger load inbound and outbound, HS parking inbound, HS employee parking inbound, ES employee parking inbound, school bus employee parking inbound and outbound, school bus inbound and outbound, and commercial inbound and outbound. Sound data from the Federal Highway Administration’s Traffic Noise Model (FHWA TNM), Version 1.0 Technical Manual was used to model passenger and commercial haul vehicles. Sound data for school buses were based on measurements made by the Greenbusch Group. Table 7 list the sound levels for modeled traffic. Figure 5 and Figure 6 illustrate the anticipated traffic routes for the Project.

September 2, 2020 Page 13 Issaquah High School #4 and Elementary School #17 Noise Study
The Greenbusch Group, Inc. p) 206.378.0569 f) 206.378-0641 www.greenbusch.com 1900 West Nickerson Street, Suite 201 Seattle, WA 98119
Table 7. Modeled Traffic Sound Power Levels, dB re:1 pW
Sound Source Frequency, Hz
LwA 63 125 250 500 1,000 2,000 4,000 8,000
Vehicle1 - - - - - - - - 82
Commercial Haul2 - - - - - - - - 107
School Bus 95 93 88 86 89 87 83 77 93 1. Sound level of 50 dBA at a distance of 50 feet based on TNM sound data. 2. Sound level of 75 dBA at a distance of 50 feet based on TNM sound data.
Figure 5. Modeled Traffic Routes

September 2, 2020 Page 14 Issaquah High School #4 and Elementary School #17 Noise Study
The Greenbusch Group, Inc. p) 206.378.0569 f) 206.378-0641 www.greenbusch.com 1900 West Nickerson Street, Suite 201 Seattle, WA 98119
Figure 6. Modeled Traffic Routes
School Bus Lot, Loading Dock, and Scene Shop Other sound sources that were modeled at the ES and HS include the bus lot, two loading docks, and the Scene Shop.
The HS and ES property will double as a school bus lot for buses servicing the two schools. Per WAC 392-145-041, pre-trip inspections are to take place prior to each bus trip. Pre-trip inspections include testing of all brakes, lights, stop signs, warning signals, and other safety devices. During these pre-trip inspections the bus brakes and back-up alarms will generate noise.
Both the HS and ES will have a loading dock with commercial vehicle activity. Sound sources from the loading docks will include commercial vehicle idling, backup alarms, and compression breaks.
Noise from tools used inside the Scene Shop were also included in the noise models. For modeling purposes, it was assumed the Scene Shop’s exterior rollup door was open. Tools modeled inside the Scene Shop include an air gun stapler, saw dust extractor, table saw, bench sander, portable sander, and a lathe.
Sound data for the school bus lot, commercial haul delivery loading dock, and Scene Shop are based on measurements made of similar equipment by the Greenbusch Group. Sound data for the school bus lot, loading dock, and Scene Shop are listed in Table 8 below.

September 2, 2020 Page 15 Issaquah High School #4 and Elementary School #17 Noise Study
The Greenbusch Group, Inc. p) 206.378.0569 f) 206.378-0641 www.greenbusch.com 1900 West Nickerson Street, Suite 201 Seattle, WA 98119
Table 8. Modeled Sound Power Levels, dB re: 1 pW
Sound Source Frequency, Hz
LwA 63 125 250 500 1,000 2,000 4,000 8,000
School Bus Lot
Brakes 95 94 90 87 106 91 93 93 106
Backup Alarm 98 100 90 87 99 81 77 70 99
Loading Dock
Air Brakes 82 74 72 73 73 74 78 82 84
Idling 94 99 93 94 94 94 87 79 99
Backup Alarms 104 105 100 101 112 102 102 99 113
Scene Shop
Air Gun Stapler 82 89 96 93 101 98 97 95 105
Saw Dust Extractor 86 82 84 81 75 87 84 73 90
Table Saw 90 96 87 85 84 92 95 91 98
Bench Sander 79 84 78 86 88 88 88 88 94
Portable Sander 77 76 89 94 89 91 84 78 96
Lathe 73 87 81 91 91 87 85 84 95
Figure 7. Modeled School Bus Lot, Loading Docks, and Scene Shop

September 2, 2020 Page 16 Issaquah High School #4 and Elementary School #17 Noise Study
The Greenbusch Group, Inc. p) 206.378.0569 f) 206.378-0641 www.greenbusch.com 1900 West Nickerson Street, Suite 201 Seattle, WA 98119
ANALYSIS AND RESULTS Three models were generated to predict nighttime and daytime sound levels. The nighttime model predicted sound levels for the peak nighttime hour (6:00 AM to 7:00 AM). The daytime model was split between peak traffic at the HS (7:00 AM to 8:00 AM) and peak traffic at the ES (8:15 AM to 9:15 AM). Because the schools start at different times, the Project will experience two different peak traffic hours that require separate models.
Nighttime Sound levels from the Project were predicted 5 feet above grade at neighboring property lines. The model includes the rooftop mechanical equipment, the two transformers, on-site traffic, and pre-trip inspection activity at the school bus lot. Sounds produced by the two loading docks, generator, compactor, and Scene Shop where not modeled during nighttime hours.
Several nearby multistory residences may have line-of-sight to the screened rooftop mechanical units. Because areas near the ground do not always have line-of-sight to these units, sound levels were also predicted at multiple elevations at nearby residential structures to determine if predicted sound levels comply with codified sound limits at different elevations.
Table 9 lists predicted sound levels at neighboring property lines and buildings during peak nighttime hours. Sound levels exceed nighttime code at properties to the south of the Project due to pre-trip inspections at the school bus lot. Figure A1 in Appendix A illustrates predicted sound levels without mitigation at neighboring properties
Table 9. Predicted Unmitigated Nighttime Sound Levels, dBA
Property Sound Level
Limit Predicted
Sound Levels Complies with Sound Limits?
North
47
28 Yes
Northeast 32 Yes
East 39 Yes
Southeast 39 Yes
South 53 No
Southwest 43 Yes
West 46 Yes
Northwest 41 Yes
Mitigation to reduce sound levels at the southern property line include prohibiting pre-trip bus inspections between 10:00 PM and 7:00 AM. Pre-trip bus inspections should not take place during these nighttime hours. Pre-trip inspections should only take place during daytime hours, between 7:00 AM and 10:00 PM.
The following Table shows predicted nighttime sound levels without noise generated from pre-trip inspections at the school bus lot.

September 2, 2020 Page 17 Issaquah High School #4 and Elementary School #17 Noise Study
The Greenbusch Group, Inc. p) 206.378.0569 f) 206.378-0641 www.greenbusch.com 1900 West Nickerson Street, Suite 201 Seattle, WA 98119
Table 10. Predicted Peak Nighttime Sound Levels, dBA
Property Sound
Level Limit
Predicted Sound Levels without
Mitigation
Predicted Sound Levels with Mitigation
Complies with Sound Limits
North
47
28 27
Yes
Northeast 32 32
East 39 39
Southeast 39 37
South 53 45
Southwest 43 40
West 46 46
Northwest 41 41
As shown the Table above, mitigated sound levels produced by the Project are predicted to comply with codified nighttime sound level limits. Figure A2 in Appendix A illustrates predicted sound levels for peak nighttime hours at the HS and ES without the pre-trip inspections at the school bus lot.
Daytime Two models where used to predict daytime sound levels at neighboring property lines during peak hours for the HS and ES. Each model included sound levels from rooftop mechanical equipment, two transformers, one generator, the pre-trip checks at the school bus lot, two loading docks, the Scene Shop, and on-site traffic. The only difference between the two models were traffic routes and traffic volumes (see Table 6).
Table 11 and Table 12 below list predicted sound levels from each peak daytime hour. Predicted sound levels did not exceed code limits during both peak hours for the HS and ES. Figure A3 and Figure A4 in Appendix A illustrate predicted sound levels for peak daytime hours at the HS and ES.
Table 11. Predicted Peak Daytime HS Sound Levels, dBA
Property Sound Level
Limit Predicted
Sound Levels Complies with Sound Limits?
North
57
32
Yes
Northeast 36
East 39
Southeast 39
South 53
Southwest 45
West 40
Northwest 51

September 2, 2020 Page 18 Issaquah High School #4 and Elementary School #17 Noise Study
The Greenbusch Group, Inc. p) 206.378.0569 f) 206.378-0641 www.greenbusch.com 1900 West Nickerson Street, Suite 201 Seattle, WA 98119
Table 12. Predicted Peak Daytime ES Sound Levels, dBA
Property Sound Level
Limit Predicted
Sound Levels Complies with Sound Limits?
North
57
31
Yes
Northeast 35
East 47
Southeast 39
South 52
Southwest 45
West 40
Northwest 50
CONCLUSION Based on this analysis detailed above, sound produced by updated stationary equipment and on-site traffic at the HS and ES are expected to comply with local regulatory criteria with the inclusion of recommended noise mitigation. To comply with nighttime sound level limits, pre-trip school bus inspections should not take place between 10:00 PM and 7:00 AM.

September 2, 2020 Page A1 Appendix A Predicted Sound Levels
The Greenbusch Group, Inc. p) 206.378.0569 f) 206.378-0641 www.greenbusch.com 1900 West Nickerson Street, Suite 201 Seattle, WA 98119
APPENDIX A. PREDICTED SOUND LEVELS Figure A1. Predicted Nighttime Sound Levels with School Bus Lot Pre-Trip Noise Generation

September 2, 2020 Page A2 Appendix A Predicted Sound Levels
The Greenbusch Group, Inc. p) 206.378.0569 f) 206.378-0641 www.greenbusch.com 1900 West Nickerson Street, Suite 201 Seattle, WA 98119
Figure A2. Predicted Nighttime Sound Levels without School Bus Lot Pre-Trip Noise Generation

September 2, 2020 Page A3 Appendix A Predicted Sound Levels
The Greenbusch Group, Inc. p) 206.378.0569 f) 206.378-0641 www.greenbusch.com 1900 West Nickerson Street, Suite 201 Seattle, WA 98119
Figure A3. Predicted Peak Daytime HS Sound Levels

September 2, 2020 Page A4 Appendix A Predicted Sound Levels
The Greenbusch Group, Inc. p) 206.378.0569 f) 206.378-0641 www.greenbusch.com 1900 West Nickerson Street, Suite 201 Seattle, WA 98119
Figure A4. Predicted Peak Daytime ES Sound Levels

September 2, 2020 Page B1 Appendix B Baseline Measurements
The Greenbusch Group, Inc. p) 206.378.0569 f) 206.378-0641 www.greenbusch.com 1900 West Nickerson Street, Suite 201 Seattle, WA 98119
APPENDIX B. BASELINE NOISE MEASUREMENTS The intent of this Appendix is to present a summary of baseline noise measurements made as part of the Issaquah High School #4 and Elementary School #17 Project (“Project”).
BASELINE NOISE MEASUREMENTS Continuous sound level measurements were made at two locations between Monday September 23, 2019 and Thursday September 26, 2019. However, due to an equipment malfunction, measurements at Location 1 were conducted Tuesday October 1, 2019 to Friday October 4, 2019. The intent of the measurements was to document existing background sound levels near the project site prior to construction to aid in the development of the Project’s design criteria. Local noise sources included street traffic and birds.
Wind conditions between September 23 and September 26, 2019 averaged one to five miles per hour and came from the southeast and northwest. Temperatures ranged between 55-and-70-degrees Fahrenheit. Rain occurred during the measurements and ranged between 0.02 and 0.06 inches per day. Wind conditions between October 1 and October 4, 2019 averaged one to three miles per hour and were generally from the southeast. Temperatures ranged between 33-and 63- degrees Fahrenheit and rainfall was between 0 and 0.04 inches per day. The rain did not appear to significantly influence the measurement data but may have increased the ambient levels at measurement locations near roadways because of tire noise. Environmental windscreens were used on all microphones during the measurements.
Equipment used during the measurements is identified in Table B1 below.
Table B1. Measurement Equipment
Make and Model Description Serial
Location 1
Svantek 971 Sound Level Analyzer
51818
Aco Pacific 7052E Microphone 62522
Svantek SV18 Preamplifier 49561
LD CAL200 Calibrator 9512
Location 2
RION NL-52 Sound Level Analyzer
821097
RION UC-59 Microphone 6064
RION NH-25 Preamplifier 21138
LD CAL200 Calibrator 9253
All equipment was factory calibrated within one year of the measurement date. Field calibrations were performed before the measurements and verified immediately after the measurements were completed. Measurement setups are shown in Figure B1 and Figure B2 and the locations are identified in Figure B3.

September 2, 2020 Page B2 Appendix B Baseline Measurements
The Greenbusch Group, Inc. p) 206.378.0569 f) 206.378-0641 www.greenbusch.com 1900 West Nickerson Street, Suite 201 Seattle, WA 98119
Figure B1. Location 1
Figure B2. Location 2
Figure B3. Measurement Locations

September 2, 2020 Page B3 Appendix B Baseline Measurements
The Greenbusch Group, Inc. p) 206.378.0569 f) 206.378-0641 www.greenbusch.com 1900 West Nickerson Street, Suite 201 Seattle, WA 98119
Sound levels at all measurement locations were below daytime and nighttime code limits. Measurement Location 2 at the south end of the property was louder than measurement Location 1 at the northwest side of the of site. This is likely because of the proximity of 228th Avenue Northeast. Measured sound levels are summarized in Table B2 and Figure B4 and Figure B5 below.
Table B2. Measured Hourly Sound Levels, Hourly Leq dBA re: 20 Pa
Location Low High Median1
Daytime2 Nighttime3
Location 1 32 55 45 40
Location 2 29 58 46 42 1. Median hourly Leq values. 2. Between the hours of 7:00 AM and 10:00 PM 3. Between the hours of 10:00 PM and 7:00 AM

September 2, 2020 Page B3 Issaquah High School #4 and Elementary School #17 Noise Study
Figure B4. Hourly Sound Levels at Location 1 over Entire Measurement Period
Note: Leq average is logarithmic average
30
35
40
45
50
55
60
0:00
1:00
2:00
3:00
4:00
5:00
6:00
7:00
8:00
9:00
10:0
0
11:0
0
12:0
0
13:0
0
14:0
0
15:0
0
16:0
0
17:0
0
18:0
0
19:0
0
20:0
0
21:0
0
22:0
0
23:0
0H
ou
rly
L eq
Sou
nd
Lev
els,
dB
A r
e: 2
0
Pa
Start of Hour
Range of Values Average Hourly Leq Code Limit

September 2, 2020 Page B4 Appendix B Baseline Measurements
The Greenbusch Group, Inc. p) 206.378.0569 f) 206.378-0641 www.greenbusch.com 1900 West Nickerson Street, Suite 201 Seattle, WA 98119
Figure B5. Hourly Sound Levels at Location 2 over Entire Measurement Period
Note: Leq average is logarithmic average
30
35
40
45
50
55
60
0:00
1:00
2:00
3:00
4:00
5:00
6:00
7:00
8:00
9:00
10:0
0
11:0
0
12:0
0
13:0
0
14:0
0
15:0
0
16:0
0
17:0
0
18:0
0
19:0
0
20:0
0
21:0
0
22:0
0
23:0
0H
ou
rly
L eq
Sou
nd
Lev
els,
dB
A r
e: 2
0
Pa
Start of Hour
Range of Values Average Hourly Leq Code Limit