laboratory simulations of fluid-induced seismicity ... ·...
TRANSCRIPT
Please cite this article as: P.M. Benson, D.C. Austria, S. Gehne et al., Laboratory simulations of fluid-induced seismicity, hydraulic fracture, and fluid flow, Geomechanics forEnergy and the Environment (2020) 100169, https://doi.org/10.1016/j.gete.2019.100169.
Geomechanics for Energy and the Environment xxx (xxxx) xxx
Contents lists available at ScienceDirect
Geomechanics for Energy and the Environment
journal homepage: www.elsevier.com/locate/gete
Laboratory simulations of fluid-induced seismicity, hydraulic fracture,and fluid flowPhilip M. Benson a,∗, David Carlo Austria a,b,∗∗, Stephan Gehne a, Emily Butcher a, ClaireE. Harnett c, Marco Fazio d, Pete Rowley e, Ricardo Tomas a
a Rock Mechanics Laboratory, School of Earth and Environmental Sciences, University of Portsmouth, PO1 3QL, UKb Geosciences and Reservoir Engineering Group, Energy Development Corporation, Ortigas Centre, Pasig City, Philippinesc School of Earth Sciences, University College Dublin, Dublin, Irelandd Geowissenschaftliches Zentrum, Universität Göttingen, Angewandte Geologie Goldschmidtstrasse 3, 37077, Göttingen, Germanye Department of Geography and Environmental Management, University of the West of England, Frenchay campus, Bristol, BS16 1QY, UK
a r t i c l e i n f o
Article history:Received 28 May 2019Received in revised form 16 December 2019Accepted 17 December 2019Available online xxxx
Keywords:Fluid-induced seismicityAcoustic emissionHydraulic fractureGeomechanics
a b s t r a c t
Fluid-induced seismicity has been observed and recorded for decades. Seismic energy necessarilyrequires a source, which is frequently related to rock fracture either in compression or tension.In both cases, such fracture may be promoted by crustal fluids. In this paper, we review someof the advances in the field of fluid-induced seismicity, with a particular focus on the use andapplication of new and innovative laboratory methods to better understand the complex, coupled,processes in shallow sub-surface energy extraction applications. We discuss the current state-of-the-art with specific reference to Thermal-Hydraulic-Coupling in volcanotectonic environments, which hasa long history of fluid-driven seismic events linked to deep fluid movement. This ranges from localearthquakes to fluid-driven resonance, known as volcanic tremor. More recently so-called non-volcanictremor has been identified in a range of scenarios where motion at an interface is primarily drivenby fluids rather than significant stress release. Finally, we review rock fracture in the tensile regimewhich occurs naturally and in the engineered environment for developing fractures for the purpose ofresource extraction, such as hydraulic fracturing in unconventional hydrocarbon industry or developingHot-Dry-Rock geothermal reservoirs.
© 2019 The Authors. Published by Elsevier Ltd. This is an open access article under the CC BY license(http://creativecommons.org/licenses/by/4.0/).
1. Introduction
Fluids in the crust are ubiquitous, generally following a hydro-static pressure increase with depth as long as the host rock massis sufficiently porous and permeable to allow free movement offluids (e.g. Refs. 1, 2). Such a relationship applies to most crustalrocks, with the hydrostatic gradually deviating to the lithostaticpressure gradient over a depth range spanning 4 to 6 km. Below8 km, most crustal rocks have insufficient connected porosity forsignificant permeability and so pore pressure is essentially thesame as lithostatic pressure (e.g. Ref. 3; Ref. 4). Consequently,pore pressures at depth, when trapped in low permeability coun-try rocks, give rise to natural hydraulic fracturing and are seenin a range of environments resulting in features such as veiningand mineralization.5,6 In addition, elevated temperatures maydrive more exotic styles of fluid-driven fracture via dehydration
∗ Corresponding author.∗∗ Corresponding author at: Geosciences and Reservoir Engineering Group,Energy Development Corporation, Ortigas Centre, Pasig City, Philippines.
E-mail addresses: [email protected] (P.M. Benson),[email protected] (D.C. Austria).
and friction on faults, which locally increase pore fluid pressure(e.g. Refs. 7–9) to fracture rocks in tension, their weakest failuremode (e.g. Refs. 1, 4).
At shallower levels (0–2 km), fluid-driven fracture is seen ina range of environments. In volcanic areas the combination ofhigh geothermal gradient, geothermal and magmatic fluids, andan often complex hydrogeological system provides evidence fortensile fracture in magmatic bodies.10,11 There is evidence thata diverse range of seismo-tectonic activity (e.g. Chouet et al.,1996) accompanies these processes. This covers brittle (tensile)failure, known as volcano-tectonic (VT) events, to characteristicseismic signals resulting from resonance within the pressurizedfluid, likened to the ‘tone’ generated from an organ pipe orresonator12,13 and known as long-period (LP) tremor. Althoughstill controversial, a number of laboratory studies (e.g. Ref. 14;Fig. 1; Ref. 15) have confirmed the general principle of rock-fluid coupling behind these characteristic signals. For a time,this was thought to be specific to volcanoes, however recentevidence has revealed similar effects at depth (e.g. subductionzones), where fluids lubricating the fault zone and over pres-surized fluids reducing the effective normal stress result in a
https://doi.org/10.1016/j.gete.2019.1001692352-3808/© 2019 The Authors. Published by Elsevier Ltd. This is an open access article under the CC BY license (http://creativecommons.org/licenses/by/4.0/).

Please cite this article as: P.M. Benson, D.C. Austria, S. Gehne et al., Laboratory simulations of fluid-induced seismicity, hydraulic fracture, and fluid flow, Geomechanics forEnergy and the Environment (2020) 100169, https://doi.org/10.1016/j.gete.2019.100169.
2 P.M. Benson, D.C. Austria, S. Gehne et al. / Geomechanics for Energy and the Environment xxx (xxxx) xxx
plethora of slip events including similar signals known as non-volcanic tremor (e.g. Refs. 8, 16). In the case of the engineeredenvironment, intentional hydraulic fracturing has now become acommon method to extract unconventional oil and gas from oth-erwise inaccessible and unconnected porosity (e.g. Refs. 17–19).This method, although controversial, has transformed the energylandscape, particularly in the US. However, induced seismicity,primarily generated as the rock mass is fractured in tension andtriggering local earthquake swarms, also results from the reac-tivation of local fault zones. This remains a significant concern(e.g. Refs. 20–25).
Applications combining fluid-driven tensile failure and ele-vated heat flow, such as the volcano-tectonic areas noted above,also include geothermal energy production. Two forms of reser-voirs are generally considered, the conventional ‘‘Hot-Wet-Rock’’type of reservoir where the porosity of the host rock mass isnaturally filled with fluid and engineered geothermal systems(EGS). In the former, extraction requires a simple well, as ex-ploited in Iceland, where this system provides some 700 MWof power. In EGS (also known as ‘‘Hot-Dry-Rock’’) two wells arerequired: a first well drilled into a rock mass is used to stimulate(fracture) the surrounding country rock, in addition to any naturalporosity and permeability, and thus be hydraulically connected toa second well. Fluid is then pumped from one well to a second(or via a network of wells) using the natural heat from the rockmass to increase the temperature of a working fluid for energyextraction. Many areas are suitable for such development, such asmountain ranges (e.g. Italian Alps: Zappone et al26) and volcano-tectonic areas (e.g. Long Valley, California: Hildreth27). In thePhilippines, which produces more than 1.8 GW of electricity fromgeothermal energy, conventional geothermal systems are com-bined with hydrofracturing to further improve well permeabilityand promote more water-rock heat transfer. However, stimu-lating a rock mass by injecting fluids to create tensile fracturenetworks to link the wells is not without risk. Unmapped pre-existing fractures, in common with hydrocarbon-driven hydraulicfracture, have frequently given rise to unexpected seismicity dueto reactivation of dormant faults, such as reported during thegeothermal project in Basel, Switzerland and in other geothermalsystems (e.g. Refs. 28–31).
In all these cases, the energy release is often monitored forthe purposes of fundamental research, safety and forecasting,as well as to better optimize resource extraction. In the caseof geothermal extraction and hydraulic fracking, simple ‘‘trafficlight’’ systems are often used which pause operation if seismicevents above a threshold are detected and thus to provide a safetycontrol for seismic hazard.21,28 In geothermal extraction, experi-ence in the Philippines suggests that the number and magnitudeof seismic events is generally higher in areas with fluid extractioncompared to the fluid injection areas. This is consistent with datafrom volcano-tectonics both in the field (e.g. Refs. 13, 32, 33)and the laboratory (e.g. Refs. 14, 34) which show that the fluid-rock interaction has a significant control on the radiated energyduring pressure release, which is also related to phase changes(water to steam). The use of controlled laboratory experiments isnow starting to place better constraints on the triggers (pressure,stress) that result in tensile fracture and shear events, and oncea permeable network is generated, yield characteristic seismicsignals generated by fluid-rock interaction. Acoustic Emission(AE) has a long history in the field of laboratory rock deformationand rock physics, with early work pioneered by researchers inthe late 1970’s (e.g. Refs. 35–37). AE is typically described as ahigh frequency strain wave in the kilohertz to megahertz range,and is now well established as a proxy for field scale seismicity(e.g. Refs. 15, 34, 38–41). Such AE sensors may be operated pas-sively (for 3D hypocentre location) or actively for determinationof elastic wave velocities (e.g. Refs. 42, 43).
Importantly, the scaling of AE data follows power law rela-tionships and thus allows similar statistics across these scales tobe employed.44–46 The similarity arises because the probability offracturing follows the classical Boltzmann statistical distributionat all length scales. It is likely that similar unifying principles willhold for events at different scales. This suggests that the eventgeneration process is governed by crack morphology; under thestress conditions of interest, the crack distribution and morphol-ogy is likely to be scale-invariant.47 Such statistical methods areof crucial importance, as this type of analysis permits laboratoryexperiments (which we control) to investigate natural processes(which we cannot control) with some level of confidence. Finally,although the majority of experiments have tended to focus onqualitative effects (e.g. Refs. 15, 43, 48), recent data from cali-brated AE is now closing the gap between quantified seismic datain the field, and how this links to the seismic source.49–52
Understanding these complex coupled processes is thereforedifficult, both due to the inherent difficulty in observing the deep-seated processes, as well as the difficulty of rigorously measuringfluid-pressure driven mechanical effects in time and space. Yet,a full understanding of these is needed to optimize energy ex-traction in hydraulic fracture and geothermal systems, to namejust two examples. In this paper, we review some of the methodsdeveloped over the last 15 years that apply innovative laboratorymethods to simulate the process of hydraulic fracture and fluid-driven tensile mechanics. We then discuss this in the contact ofsome recently acquired data using andesite taken from the SouthNegros geothermal field in the Philippines.
2. Methods
To better understand processes in the field, innovative labo-ratory methods have been widely developed. More recent workhas now evolved to a point where a diverse range of parame-ters are measured simultaneously at very high sampling rates(e.g. fluid pressure, stress, strain), performed in conventionaltriaxial setups (e.g. Refs. 49, 53), and true-triaxial setups oftenusing cubic specimens (e.g. Refs. 54, 55). In addition, innovativepost-test techniques such as X-ray Computed Tomography (CT),and fluorescence of the crack tip are now exploring the details ofthe fluid-dynamics operating at the crack tip (e.g. Refs. 48, 56, 57).At the elevated temperatures applicable to geothermal extraction(but employing similar tensile fracture mechanics), the extremeconditions pose unique challenges to the experimentalist. Despitethese challenges, a small number of laboratory studies have beenreported ranging from the use of pressurized semi-molten rock(e.g. Refs. 58, 59), to a lower temperature (and more controllable)proxy such as softened PMMA (polymethyl methacrylate) or wax(e.g. Refs. 60–62). In these cases, the investigation is often morealigned to high temperature dyke injection and dynamics, ratherthan hydraulic fracturing. However, many authors in the field ofvolcanology do note that despite the obvious high temperaturesinvolved, the fundamental tensile mechanics are essentially thesame as per engineered applications such as fracking (e.g. Ref. 63).Finally, laboratory methods at elevated pressure and tempera-ture include simulations of fundamental fracture mechanics butwithout using high-pressure fluid, by using short rod specimens(e.g. Refs. 64, 65). However, this type of setup does carry withit the disadvantage that the specimen failure also concludes theexperiment, as the short rod sample is no longer sealed.66
Importantly, and in common with all the above examples,the use of a well-controlled laboratory methodology has the keyadvantage of offering a controlled and consistent environmentwith which to test ideas. And, whilst the smaller scale samplesare often cited as a weakness, the ability to quickly investigate thechanging material properties and the effects on external stimuli

Please cite this article as: P.M. Benson, D.C. Austria, S. Gehne et al., Laboratory simulations of fluid-induced seismicity, hydraulic fracture, and fluid flow, Geomechanics forEnergy and the Environment (2020) 100169, https://doi.org/10.1016/j.gete.2019.100169.
P.M. Benson, D.C. Austria, S. Gehne et al. / Geomechanics for Energy and the Environment xxx (xxxx) xxx 3
Fig. 1. Example of laboratory seismicity (known as Acoustic Emission) generated during high temperature simulations of melting in Mid Ocean Ridge Basalt (MORB).As fluid migrates, characteristic ‘‘Low Frequency events are preferentially generated, with the number of events (black line) accelerating dramatically as the temperateincreases through the glass transition. After Ref. 14.
(stress, pressures and temperatures) on the sample allows fora powerful holistic rock physics interpretation to be formulated.And, although the true stress state in the Earth is best describedas ‘‘true triaxial’’ whereby σ1 > σ2 > σ3, the complexity andexpense of designing, fabricating, and operating such apparatuswith cubic specimens (e.g. Refs. 55, 57) has led to researchersopting for the so-called ‘‘conventional’’ triaxial cell (e.g. Refs. 34,49, 67, 68). By modifying these apparatus (Fig. 2) to replace thesample assembly for different fluid-injection scenarios, a num-ber of physical properties may be measured, including AcousticEmission (Fig. 2A). A typical setup is of a cylindrical core (15–50 mm diameter and up to 125 mm length, typically with alength: diameter ratio of between 2 and 2.5 and with ends groundflat to a precision of 0.01 mm) encapsulated in a rubber jacketto isolate the sample from the confining pressure medium. Toinvestigate fluids within the damage zone a sample drilled witha thin axial conduit (Fig. 2B), has been developed (e.g. Ref. 15;Benson et al., 2011). In these experiments, reported by Fazio etal.34,69), a water saturated 40 mm diameter sample (100 mmlong) drilled with a 3 mm conduit was first deformed at 35 MPaconfining pressure to generate a shear fault. After returning tothe initial conditions (35 MPa confining pressure and 5 MPa porepressure), the high-pressure pore fluid (water) is released to at-mosphere to promote fluid-decompression generated turbulencein the damage zone analysing these fluid-mechanical effects withan array of AE sensors.15
To understand fracture in tension, the use of so-called thick-walled cylinder tests has an extensive literature with early workconcentrating on the mechanical effects and developing modelsof the process.70–72 In low permeability rock such as shale andgranite (crystalline rock), designing an apparatus to fracture ashale in tension due to fluid overpressure is relatively simple(e.g. Fig. 2C). Conversely, using a rock of higher porosity (andhence permeability) needs some form of rubber ‘liner’ inside theinner bore (e.g. Ref. 67) to allow the stress to build at the innerwall of the setup. Without this, a simple shear fracture will de-velop, promoted by the decrease of the effective pressure (peff =
pc − pp) as fluid is injected (e.g. Ref. 68). Newer approaches nowcombine these fluid-mechanical methods with AE recorders tobetter understand the developing fracture (e.g. Refs. 57, 68, 73).The laboratory setup described by Gehne et al,53 is a variationof this, but further modified to additionally measure very-highspeed mechanical data (stress, strain, pore pressure) as well asthe permeability74 by using the high speed data recorders for AE
as a digitization tool for stress, strain, and pressure data (Fig. 2A;Gehne et al.53).
In some apparatus, an integrated furnace allows the setup tobe heated, with the maximum achievable temperature usuallydependent on the type of furnace used. For external furnaces,typically wrapped around the pressure vessel in ‘clam-shell’ orprinted form, this is typically around 200 ◦C (e.g. Refs. 34, 69).Furnaces that are internal to the pressure vessel, usually utilizingArgon gas for the confining pressure medium rather than sili-cone oil to avoid polymerization effects at high temperature andpressure, reach up to 1200 ◦C. Of the designs, the most ubiq-uitous is the ‘‘Paterson’’ apparatus, after its inventor.4 These al-low a wide range of investigations including High-Pressure/High-Temperature elastic wave velocity measurements (Zappone andBenson, 2011; Fig. 3), fluid-driven seismicity (Refs. 14, 75; Fig. 1),phase changes (e.g. Refs. 7, 76) in addition to triaxial rock defor-mation (e.g. Ref. 77).
The two setups (Fig. 2B, C), in conjunction with high speedrecording systems (Fig. 2A), allow a wide range of rock defor-mation (shear and tensile) studies to be performed, monitoredvia a suite of rock physics methods. Of these, three methods arecommon. Firstly, elastic wave velocity data (P-wave and S-wave)are generated by pulsing each of the AE sensors in sequence, withthe remaining sensors receiving the waveform. Output waveformdata (voltages) are received by a preamplifier and boosted by(typically) 20–60 dB according to received amplitude. By referringto the known positions of the sensors, elastic wave velocity isderived via the time-of-flight method of Birch.78 Secondly, theAE data may be used to locate the source of fracturing in 3Ddue to deformation (e.g. Refs. 37, 41, 79) by recording the fullwaveform received at each sensor and recording the onset timeat each channel. Inversion for 3D hypocentre location may thenbe made based on the measured velocity model. The AE recordingsystems have evolved over the last 20 years from systems thatsimply digitize the discrete waveforms once a trigger criterion(typically when any single channel observes an AE event abovea target threshold of approximately 5× noise level, or approx-imately 100 mV) had been met (e.g. Ref. 37), to continuous AEsystems that continuously digitize the voltage to storage for lateroffline processing (e.g. Refs. 41, 68, 80). The later systems have theadvantage of not missing any information during the time neededfor the processors to record and then ‘re-arm’ for the next event.Both types of recorder typically digitize the data at a samplingrate of 10 MHz at 16-bit resolution.

Please cite this article as: P.M. Benson, D.C. Austria, S. Gehne et al., Laboratory simulations of fluid-induced seismicity, hydraulic fracture, and fluid flow, Geomechanics forEnergy and the Environment (2020) 100169, https://doi.org/10.1016/j.gete.2019.100169.
4 P.M. Benson, D.C. Austria, S. Gehne et al. / Geomechanics for Energy and the Environment xxx (xxxx) xxx
Fig. 2. Typical laboratory triaxial deformation apparatus (panel A) and sample assemblies for standard deformation with a shear-fault (panel B), and fluid-driventensile fracture (panel C). In all cases a network of Acoustic Emission (AE) sensors records the generated micro-seismic activity for comparison to mechanical andfluid pressure data.Source: Modified from Refs. 34, 53.
If fluids are present, further experiments may then be madeof the fluid flow through those damage zones, akin to the rock-fluid-turbulence driven volcanic tremor introduced earlier. Whilsthypocentre locations of the fluid-driven stage have been reported(e.g. Ref. 15; Benson et al., 2011) the emergent nature of thewaveform and the generally lower energy of these events resultin fewer locations compared to compressional/shear fracture. Asan alternative, a simple ‘hit rate’ – defined as the number oftimes a channel exceeds a threshold voltage in a short timewindow – may be calculated. Although basic, this method isstill useful for defining the rate of change of fracturing duringvery high-speed events, such as during tensile fracture, withoutrecourse to exotic means to slow down the deformation such asAE feedback (e.g. Ref. 37). Thirdly, mechanical data consisting ofaxial and radial deformation is collected using sensors such aslinear variable displacement transducers (LVDT’s), load cells andpressure sensors, and across a range of sampling rates appropriateto the process under test and suitable signal conditioning. Axialdeformation is used as a servo control feedback loop to controlthe sample deformation (where used), at typical strain rates be-tween of 1 × 10⁻⁵ s−1 to 1 × 10⁻⁵ s−1. To understand high pore
fluid pressure changes during hydraulic fracture of samples orduring the venting of water, data in recent studies34,53 is sampledat low (1 Hz), high (10 kHz), and very high (10 MHz) rates. Takentogether, these three methods permit a full ‘rock physics’ profileof the deforming system – either compression or tensile – to berecorded for later processing.
3. Typical data generated from modified triaxial assemblesand ‘‘rock physics ensembles’’
The methods above have been widely reported in the rockdeformation and rock physics literature, and although the re-production of the precise conditions is not always feasible, theuse of holistic approaches have greatly elucidated how changesin recorded parameters occur due to the imposed (measured)conditions simulating deep geophysical processes. To reinforcethis, we present below three examples of recently published dataacross the three methods reviewed above.
(i) Elastic wave data: mineral effects and fracture damage zones.It is well known that elastic wave velocities are very sensitive
to changes in mineral composition, phases, and fracture and crack

Please cite this article as: P.M. Benson, D.C. Austria, S. Gehne et al., Laboratory simulations of fluid-induced seismicity, hydraulic fracture, and fluid flow, Geomechanics forEnergy and the Environment (2020) 100169, https://doi.org/10.1016/j.gete.2019.100169.
P.M. Benson, D.C. Austria, S. Gehne et al. / Geomechanics for Energy and the Environment xxx (xxxx) xxx 5
Fig. 3. Evolution of P-wave elastic velocity from a quartz-rich metapelite fromNorthern Italy. For each of the three confining pressures tested (200 MPa: solidline; 300 MPa, dashed line; 400 MPa, dotted line) the P-wave velocity decreasesbefore recovering at 890, 920 and 950 K respectively. This pressure dependentinflexion mirrors the alpha–beta phase change in the quartz. After Zappone andBenson, 2011.
damage of a rock mass (e.g. Refs. 42, 67, 81). This is due toa range of factors such as energy partitioning, reflection, andscattering/attenuation effects (e.g. Ref. 82). For this reason, it isimportant to both understand the effects that fracturing has onthe seismic propagation in the material, often used for seismictomography imaging of structures (e.g. Refs. 83, 84), and alsoto better understand the seismic source from measured surfacedata (e.g. Refs. 76, 85). Increasing temperature also has an effect,both from thermal stressing effects from differential expansionof mineral phases leading to grain boundary cracking loweringelastic wave velocity (e.g. Refs. 83, 86–88) but also due to phasechanges, likely to be especially important in geothermal areas(e.g. Fig. 3; Zappone and Benson26). In addition, the directionaldependence of the elastic wave velocity may be used to infer theorientation of a damage plane if sufficient data is available.89,90Fig. 4 shows this effect using data from three volcanic rocks fromthe volcanic islands of El Hierro and Tenerife (Canary Islands,Spain) and Stromboli (Aeolian Islands, Italy) with initial porositiesof 1.7%, 12.3% and 6.1% respectively89 where the normalized elas-tic wave velocity (P-wave) is tracked during fracture developmentacross a range of incident angles relative to the shear fault plane(measured via post-test examination).
Using these rocks and the triaxial apparatus described above(Fig. 2A and B) with a dry sample, and a strain rate of 10−5 s−1 togenerate a shear fault due to compression, it is evident that theformation of the fault has a dramatic effect on the evolution ofelastic wave velocity. In each case, as the experiments progress,elastic-wave velocity first increases, reaching a maximum as pre-existing cracks close. Cracks then reopen, finally coalescing into ashear fault when a significant decrease in P-wave elastic velocityis seen (e.g. Ref. 91).
In addition to this overall trend, the normalized velocity de-crease is strongly dependent on the angle of the raypath withrespect to the shear plane as verified from post-mortem anal-ysis (Fig. 4). In samples with a low initial porosity (e.g. 1.7%Basalt from El Hierro volcano) the decrease in P-wave velocityis particularly high, varying from a 96% of initial (unfractured)
velocity to 87% for raypaths at an oblique angle of 4 degreesto the failure plane. Conversely, velocity decreases for the otherrocks (of higher initial porosities), whilst decreasing by 7%–8%,did not exhibit such a large decrease regardless of raypath angle(Fig. 4). In all cases, the velocity anisotropy (difference betweenlowest and highest wave velocities) increases markedly by theend of the experiment, due to the preferential alignment of thedamage zone. The use of such data is useful as it acts as a controlor calibration for methods that employ seismic tomography andreflection seismic data to understand the subsurface volcanicplumbing system (e.g. Refs. 86, 92, 93).
(ii) Induced seismicity due to shear fracture, fluid-rock interac-tion, and fluid-turbulence
With a fracture established, regardless of setting or system, itis natural to consider the fluids present, as the majority of crustalrocks are fluid saturated.94 When fluids move rapidly throughfractures and cracks, as widely postulated in active geologicalareas, swarms of seismic events are often recorded. Early ev-idence for so-called ‘‘tremor’’ was first noticed in and aroundactive volcanoes where the method was once thought to herald anew and more accurate method to forecast volcanic unrest.12,33,95Later studies have now found similar fluid-triggered seismicity inother tectonically active areas, such as in subduction zones wherethey are often referred to as ‘‘non-volcanic’’ tremor.8,16,75,85,96,97Using the laboratory methods of Benson et al.15 and Fazio etal.34 there is clear evidence that these swarms are generated bya complex combination of the fluid-mechanical response of thesystem, and the effects of fluids decompressing and resonatingthrough fractures and conduits in the rock mass.98 Fig. 5 showstypical data from such an experiment, where high fluid flow isinduced by rapidly venting a high pressure pore fluid (water)via an electrically operated solenoid valve (Fig. 5A–C; Bensonet al.15; Fazio et al.34). During the venting stage, a clear swarmof acoustic emission is seen, and linked to the damage zone.15Furthermore, recent data suggests a link between the phase (orviscosity) of the fluid and the resonance frequency recordedduring the swarm stage of the experiment.34 The complex rock-fluid coupled system also generates very specific signals knownas tornillo events98–100 that are characterized by long coda ofdecreasing amplitude (Fig. 5D). These signals were amongst theearliest evidence for rock-fluid driven seismicity measured byvolcano seismologists, and have now also been simulated in thelaboratory,69 shown in Fig. 5(D–E).
Here, during fluid decompression at 175 ◦C (from a porepressure of 10–16 MPa to 0.1 MPa) via an electrically operatedvalve, a swarm of AE events was recorded, continuing for sev-eral 10’s of seconds in a number of discrete swarms after thisinitial pressure decrease (or ‘venting’) stage. This is longer thana typical decompression experiment at ‘room’ temperature asshown in Fig. 5C.34 This type of effect has clear application in thearea of geothermal energy, as the process of resource extraction(implying decompression) will – by definition – require fluids tobe received at a well, after moving through a damage zone athigh flow rates, changing the state of stress of the crust and thuslikely to stimulate a local seismic response. The use of field datais established in many geothermal areas for such monitoring ofproduction. Induced seismicity also includes scenarios wherebypore fluids are sufficiently high to locally fracture rocks in tension.In volcanic areas, this is seen in the form of veining and dykingand is a natural extension and compliment to the fluid-flowexperiments above.
(iii) Induced seismicity due to tensile fracture, fluid flow, andpermeability
The counterpoint to the seismic response of shear faults andrapid fluid flow (turbulence) is the effect of fluid overpressureto generate stress sufficiently high to fracture rock directly. In

Please cite this article as: P.M. Benson, D.C. Austria, S. Gehne et al., Laboratory simulations of fluid-induced seismicity, hydraulic fracture, and fluid flow, Geomechanics forEnergy and the Environment (2020) 100169, https://doi.org/10.1016/j.gete.2019.100169.
6 P.M. Benson, D.C. Austria, S. Gehne et al. / Geomechanics for Energy and the Environment xxx (xxxx) xxx
Fig. 4. Normalized P-wave velocity as a function of damage formation during standard triaxial deformation experiments for a basalt from Stromboli, El Hierro andTenerife volcanic island (after Ref. 89). In all cases the velocity decreases significantly as the shear plane is formed, with raypath angles at a shallow angle to theshear plane undergoing more significant normalized decreases compared to raypaths at high incidence angles.
Fig. 5. Induced laboratory AE events in fractured Etna basalt from, (A): fracture (VT) events and direct fluid (LP events) movement in a shear (damage) zone; (B):fluid venting induced AE and (C) AE from fluid movement of a multi-phase mixture (water and steam) due to fluid depressurization at elevated temperatures. Finally,(D) Long coda waveform and (E) monochromatic spectrogram characteristic of tornillio events. After Refs. 15, 34, 69.
volcanic areas, this commonly results in extensive dyking.63 Al-though these processes have been simulated in the laboratory,the extremely high temperatures required to simulate volcanicrelated processes pose unique challenges as equipment cannoteasily control or measure geophysical data of such processes, de-spite a small number of attempts (e.g. Refs. 59, 101). To overcomethe issue of temperature, analogue experiments using a setupsimilar to that described in Fig. 2C have successfully reproducedthe effects of hydraulic fracture but using softened PMMA. At
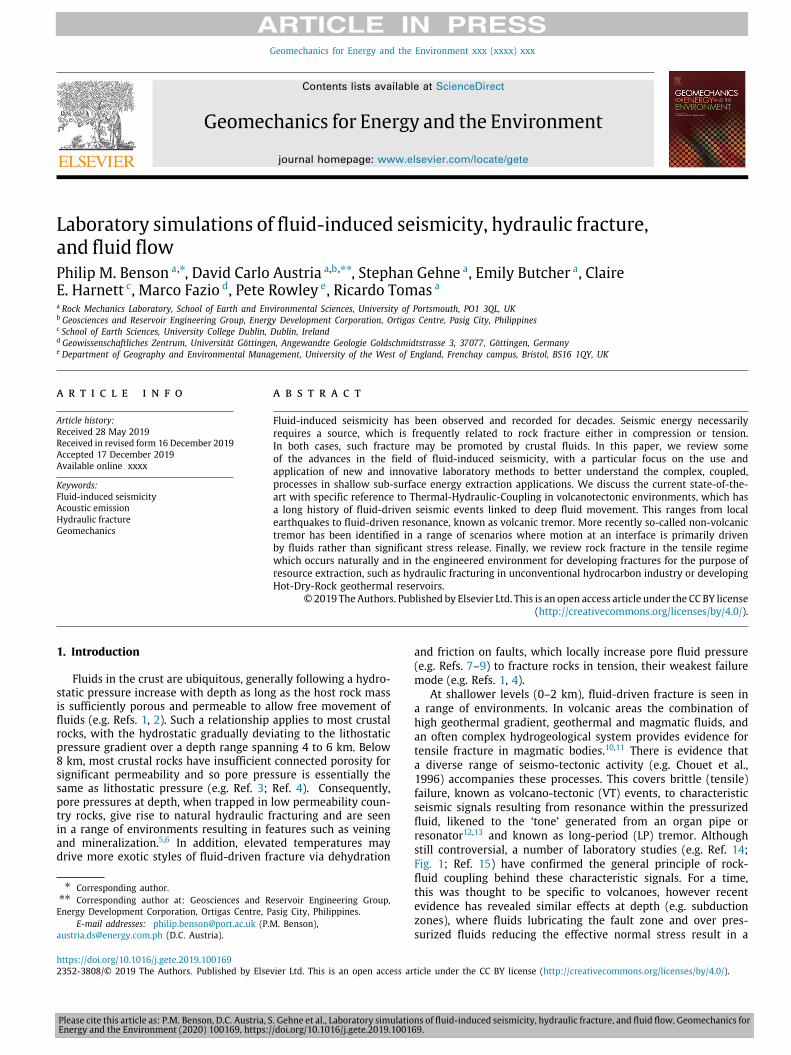
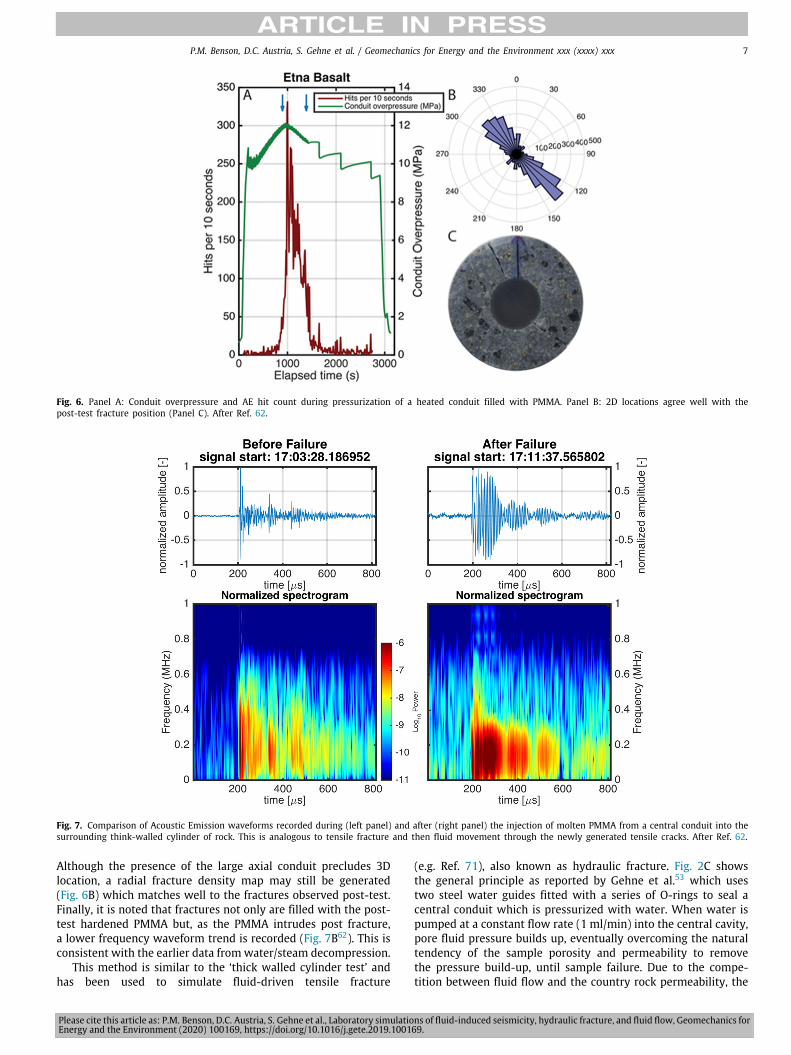
elevated temperature (175 ◦C) and pressure (30 MPa) a PMMArod, simulating an intruding magma body, behaves as a viscousliquid under these conditions (Fig. 6).62 Data from these exper-iments shows that the pressurized conduit exerts a radial stresson the inner bore of the outset country rock until fracture (Fig. 7).The accompanying AE trend initially increases very slowly up toapproximately 800 s, after which the AE trend increases expo-nentially until a decrease in conduit overpressure (rock failure)is recorded at 1000 s, the same time as the peak in AE hit rate.
Please cite this article as: P.M. Benson, D.C. Austria, S. Gehne et al., Laboratory simulations of fluid-induced seismicity, hydraulic fracture, and fluid flow, Geomechanics forEnergy and the Environment (2020) 100169, https://doi.org/10.1016/j.gete.2019.100169.
P.M. Benson, D.C. Austria, S. Gehne et al. / Geomechanics for Energy and the Environment xxx (xxxx) xxx 7
Fig. 6. Panel A: Conduit overpressure and AE hit count during pressurization of a heated conduit filled with PMMA. Panel B: 2D locations agree well with thepost-test fracture position (Panel C). After Ref. 62.
Fig. 7. Comparison of Acoustic Emission waveforms recorded during (left panel) and after (right panel) the injection of molten PMMA from a central conduit into thesurrounding think-walled cylinder of rock. This is analogous to tensile fracture and then fluid movement through the newly generated tensile cracks. After Ref. 62.
Although the presence of the large axial conduit precludes 3Dlocation, a radial fracture density map may still be generated(Fig. 6B) which matches well to the fractures observed post-test.Finally, it is noted that fractures not only are filled with the post-test hardened PMMA but, as the PMMA intrudes post fracture,a lower frequency waveform trend is recorded (Fig. 7B62). This isconsistent with the earlier data fromwater/steam decompression.
This method is similar to the ‘thick walled cylinder test’ andhas been used to simulate fluid-driven tensile fracture
(e.g. Ref. 71), also known as hydraulic fracture. Fig. 2C showsthe general principle as reported by Gehne et al.53 which usestwo steel water guides fitted with a series of O-rings to seal acentral conduit which is pressurized with water. When water ispumped at a constant flow rate (1 ml/min) into the central cavity,pore fluid pressure builds up, eventually overcoming the naturaltendency of the sample porosity and permeability to removethe pressure build-up, until sample failure. Due to the compe-tition between fluid flow and the country rock permeability, the

Please cite this article as: P.M. Benson, D.C. Austria, S. Gehne et al., Laboratory simulations of fluid-induced seismicity, hydraulic fracture, and fluid flow, Geomechanics forEnergy and the Environment (2020) 100169, https://doi.org/10.1016/j.gete.2019.100169.
8 P.M. Benson, D.C. Austria, S. Gehne et al. / Geomechanics for Energy and the Environment xxx (xxxx) xxx
Fig. 8. Laboratory data obtained at a confining pressure of 25.4 MPa in the anisotropic Nash Point Shale cored with bedding parallel to sample axis; (a) Time-recordof internal fluid injection pressure (blue line), radial deformation (green line) and AE hit counts (red dots). (b) Fluid pressure decay rate (black line), fluid pressure(blue line) and AE hit count rate (red dots). (c) Snapshot of the continuous waveform (red line) including the signal envelope at the time of failure. (d) Respectivespectrogram at the time of failure. The spectrogram data illustrates the frequency range exhibiting power (colour) with time. Time scales zeroed at maximum fluidinjection pressure. After Ref. 53.
method works well for low permeability samples with permeabil-ities lower than approximately 10−15 m2. Data is collected usingradial and axial strain gauges, a network of 11 AE sensors, andmechanical and pore pressure transducers, all sampling data at arate of 10 kHz. An additional pore fluid pressure sensor is sampledat the highest data acquisition rate of 10 MHz by using a channelof the continuous AE recorder with suitable signal conditioning.
This allows a very high temporal resolution experiment to besynchronized in time. A typical dataset is shown in Fig. 8.
Simulating hydraulic fracturing using water as pore fluid andsilicone oil as confining pressure, at 25.4 MPa representative of aburial depth of approximately 900 m, results in tensile fractureat a breakdown pressure just over 36 MPa. Defining the timeof maximum pore fluid pressure, Pinj(max) of 0 s, radial strain

Please cite this article as: P.M. Benson, D.C. Austria, S. Gehne et al., Laboratory simulations of fluid-induced seismicity, hydraulic fracture, and fluid flow, Geomechanics forEnergy and the Environment (2020) 100169, https://doi.org/10.1016/j.gete.2019.100169.
P.M. Benson, D.C. Austria, S. Gehne et al. / Geomechanics for Energy and the Environment xxx (xxxx) xxx 9
first increases slowly up to 0.04 s and then accelerates rapidlyto 25 µm at approximately 0.06 s after breakdown pressure. Thisis preceded slightly by a supra-exponential increase in AE activitywhich reaches a maximum at around the same time (0.05 s). Fluidpressure decay rate increases significantly at 0.035 s from an av-erage of less than 20 MPa/s to a maximum of over 1000 MPa/s at0.055 s. Also noticeable is a pore fluid oscillation or ‘‘bounce’’ withthe pore fluid pressure recovering from a minimum of approxi-mately 30 MPa to approximately 32 MPa, before decreasing again,likely due to the fluid being unable to keep up with the freshlygenerated advancing fracture.53 This behaviour appears to belimited to lower confining pressures (approximately 6 MPa andlower) and is not seen at higher pressure (above approximately12 MPa), as reported by Gehne (2018).
The AE activity mirrors the fluid pressure (an oscillating pat-tern), but with a very small time offset (≈0.005 s). The continuoussignal (Fig. 8C) illustrates the nature of the signal as a seriesof short bursts during the fracturing event, which initially hasa very brief high frequency component at the initial fractureevent but which then quickly give way to a low frequency andimpulsive onset, and a short and fast decreasing tail. The mostsignificant power is in the range 50–200 kHz (Fig. 8D), but ahigher frequency component occurs at 400 kHz. The lower fre-quency component is fairly continuous, and we note that thehigh frequency components appear as shorter bursts or swarms.Following the oscillation, fluid pressure dissipates gradually from0.15 s and the radial strain increases significantly, signalling theend of the experiment at around 0.2 s.
Although these data show the effect of increased confiningpressure (burial depth) on the tensile strength (and strengthanisotropy) of the rock, it does not consider the connected poros-ity and therefore permeability. However, by making an additionalmodification to the setup in Fig. 2D, it is possible to estimate theflow and therefore permeability of the freshly generated fracture,as reported by Gehne and Benson.74 For Nash Point Shale, a lowporosity shale of initial permeability in the range 10−18 to 10−20
m2, the fracture event increased the apparent permeability tobetween 2 × 10⁻¹⁵ to 2.5 × 10⁻¹⁶ for effective pressures from2.5 to 25 MPa respectively, and which does not recover when theeffective pressure is decreased. Such permeability hysteresis wasshown to be particularly evident in the Crab Orchard Sandstone(due to the presence of cracks and clays) as reported by Gehneand Benson,48 and shown in Fig. 9. This tight sandstone,102 hasa porosity of approximately 5%, a nominal permeability in themicro-Darcy (10−18 m2) range and a significant anisotropy gener-ated by mm scale cross-bedding: up to 20% using P-wave elasticvelocities, and nearly 200% in terms of permeability anisotropy.
As shown in Fig. 9, for Crab Orchard sandstone parallel tobedding an initial permeability of 33 × 10−18 m2 is measured,and for flow normal to bedding, 2 × 10⁻¹⁸ m2 both at an ef-fective pressure of 5 MPa. As effective pressure is increased anexponential decrease in permeability is recorded for flow in bothorientations, however for flow parallel, this reaches a ‘floor’ ofaround 10 × 10−18 m2. For flow parallel to bedding, the perme-ability does not increase (recover) with subsequent reduction ineffective pressure, and this general pattern is seen in the secondfull cycle, decreasing to a minimum of 1 × 10⁻¹⁸ m2. For a third(partial) cycle this minimum was maintained in both increasingand decreasing effective pressures. For flow normal to bedding,even though the permeability k is lower overall, the flow doesrecover slightly, such that the permeability anisotropy (kmax −
kmin)/kmean actually decreases significantly during the second half(decreasing pressure) of the second cycle, and then is maintainedin successive cycles at approximately 25%, due to the permeabilityof normal fluid flow of approximately 1.5 × 10⁻¹⁸ m2. Both areevident from the AE and fluid injection pressure which suggest
Fig. 9. Permeability parallel to bedding (panel A), normal to bedding (panel B)and permeability anisotropy (panel C) evolution in Crab Orchard sandstone overan effective hydrostatic pressure range up to 90 MPa; kxp and kzp indicatingthe permanent permeability change — (a) kx , (b) kz , (c) Ak . Effective pressureincrease is shown with solid lines, decrease with dotted lines, and with theinitial increase as a thick black line.Source: From Ref. 48.

Please cite this article as: P.M. Benson, D.C. Austria, S. Gehne et al., Laboratory simulations of fluid-induced seismicity, hydraulic fracture, and fluid flow, Geomechanics forEnergy and the Environment (2020) 100169, https://doi.org/10.1016/j.gete.2019.100169.
10 P.M. Benson, D.C. Austria, S. Gehne et al. / Geomechanics for Energy and the Environment xxx (xxxx) xxx
Table 1Simplified rock physics data of the rock types reviewed in this study. Note permeability data is not available for TB and EHB as this was not an important aim ofthe Harnett89 study. In the case of NPS and COS, the anisotropy due to the bedding/fabric produces noticeable permeability anisotropy with typical low (normal tobedding) and high (parallel to bedding) values cited.Source: Taken from Refs. 34, 48, 53, 89.Property Etna Basalt
(EB)Stromboli Basalt(SB)
Tenerife Basalt(TB)
El Heirro Basalt(EHB)
Dumaguete Andesite(DA)
Nash Point Shale(NPS)
Crab OrchardSandstone (COS)
Porosity, % 2.1 6.1 12.3 1.7 6.0 6.3 7.1Initial Permeability (m2) 10−16 6 × 10⁻¹⁶ n/a n/a 1.5 × 10⁻¹⁶ 10−18–10−21 2–33 × 10−18
P-wave anisotropy, % 1.0 2.0 1.8 2.2 1.0 56.0 20.0
that variations on pore fluid may significantly (and permanently)change the bulk permeability, and therefore resource potential,of fractured reservoirs such as those often used in engineeredgeothermal and unconventional hydrocarbon industries.
These are important details, as no unconventional hydrocar-bon or geothermal reservoir will be effective if pore fluids (water,hydrocarbons) cannot flow easily enough through the rock massto a receiving well. And, whilst flow might be high initially, thereare well documented cases of flow rate significantly decreasingover time, for both geothermal production and for unconven-tional hydrocarbon extraction. Many causes are inferred, suchas mineralogical alteration within the pore space and cyclingof the pore (production) pressure with time, which have theeffect of changing the flow through the rock mass via mechanicalchanges. Such effects often require an unconventional reservoirto be re-fractured at key future stages in the lifetime of theresource (e.g. Ref. 103). Laboratory data suggest that the per-meability of a tight rock formation may decrease significantlyif the effective pressure (difference between confining pressureand pore fluid pressure) is allowed to increase and decreasethrough time.48 Whilst the range of pressure change investi-gated here were higher than a typical field scenario (rangingfrom 5–90 MPa), the reduction in permeability was found tobe not recoverable in subsequent cycles, and that the main re-duction occurred in the first 20 MPa of pressure change. Theinherent anisotropy was a significant factor in determining thepermeability and permeability hysteresis.48,74
4. New data: fracture, flow, and induced seismicity from astudy using Dumaguete andesite from the South Negrosgeothermal field, Philippines
To compliment the review of data and methods above, we herealso report a short study using a variation of the setup shownin Fig. 2, simulating fracture and fluid flow along an inclined,newly generated, shear fracture. The rock used is a DumagueteAndesite (DA) from the Philippines (supplied by Energy Devel-opment Corporation) from a borehole in the Southern Negrosgeothermal field. Key properties for the material are tabulatedbelow alongside the other rocks reviewed for completeness. Asshown in Fig. 10, a set of two offset 3 mm drill holes intersectthe top and bottom of a newly generated fault (due to triaxialdeformation), the orientation of which is further promoted tointersect these drill-holes via ‘notches’ on the outside of thesample and filled with sand/cement to avoid piercing the jacket.This allows measurement of fracture permeability and P-wavevelocity to be made as a function of confining pressure, simulatingburial depth , and up to 175 ◦C (see Table 1).
Fig. 11 shows P-wave velocity data, dynamic Poisson’s ratio,and Dynamic Young’s modulus (i.e. derived from velocity data)from the Dumaguete andesite during triaxial deformation, form-ing the initial shear fault. We note a similar velocity trend tothat seen in Fig. 4, with an increasing velocity as the speci-men is deformed, from 5500 m/s to 5800 m/s, followed by asharp decrease at the point of failure (generation of a shearfault). Post failure, the velocity steadily increases with strain
Fig. 10. Modified setup for flow measurement along a naturally generated faultplane generated using a triaxial cell, using two offset drill-holes to inject andreceive fluids along the fracture plane generated due to axial deformation undertriaxial conditions.
(time). The dynamic Poisson’s ratio shows a steady increase withstrain until sample failure, at which point a significant increase isrecorded, after which Poisson’s ratio decreases steadily. Finally,the dynamic Young’s modulus shows a trend similar to that ofP-wave elastic velocity with a sharp decrease at point of failure,followed by a recovery phase. Taken together, it is likely thatsuch data, if remotely collected and monitored in the field, hasthe potential to provide operators with useful information as towhether a geothermal reservoirs have new fractures opening, orwhether pressure/stress levels are acting to close the fracture andassociated damage zone. These results are consistent with stresscycling experiments showing similar trends in elastic modulias damage is incrementally induced.104 To evaluate the staticYoung’s modulus, a number of small stress cycle loops were madeafter the development of the shear plane at increments of 5MPa confining pressure. Fig. 12 shows these data, also evidentin the time record in Fig. 11 from 4000 s onwards. We measurelittle change in static Young’s modulus with increasing confiningpressure for positive stress loops (increasing strain), whereas asteady increase in modulus is calculated when taking the negative(decreasing strain) portion of the stress–strain loop.
To exploit conventional geothermal resources, some form ofpermeable conduit is needed. In the field, this may be achievedby drilling producer wells into an area where deep geothermal

Please cite this article as: P.M. Benson, D.C. Austria, S. Gehne et al., Laboratory simulations of fluid-induced seismicity, hydraulic fracture, and fluid flow, Geomechanics forEnergy and the Environment (2020) 100169, https://doi.org/10.1016/j.gete.2019.100169.
P.M. Benson, D.C. Austria, S. Gehne et al. / Geomechanics for Energy and the Environment xxx (xxxx) xxx 11
Fig. 11. P-wave velocity (Panel A), dynamic Poisson’s ratio (Panel B), and dynamic Young’s modulus (Panel C) of the Dumaguete andesite from the Southern NegrosGeothermal field (near Dumaguete city) during conventional triaxial deformation deformed at 6.1 MPa confining pressure. The blue dashed line shows the concomitantchange in strain during the experiment (constant strain rate triaxial test).
Fig. 12. Change in static Young’s modulus of Dumaguete andesite. Each data point was derived after the shear plane has been generated after the sample failure(inset 1), by increasing stress due to a strain rate until a maximum of 10%–20% of the failure shear stress (220 MPa) is achieved, before unloading. This was repeated6 times (inset 2). The Young’s modulus was derived by applying a best-fit line to the stress–strain data. This procedure was then repeated for decreasing portionsof the stress loops (inset 2).
fluids are already present, or via the development of engineeredgeothermal systems. In the former case, examples include theextensive Hellishedi geothermal field (Iceland), and the SouthernNegros geothermal field in the Philippines. Using the dual-offsetconduit method (Fig. 10) and applying a differential pressureacross the two drill holes, we performed a series of fluid flowexperiments to determine permeability, shown in Fig. 13. Theflow rate through the shear zone decreases from 7.7 µl/s at 5MPa, to less than 0.03 µl/s at 30 MPa, and shows a sharp decreasein flow rate as pressure is increased from 5 to 15 MPa.
By ascribing this to a notional ‘‘slot’’ that connects the twoconduits, it is possible to measure a permeability via Darcy’s law(Fig. 13) using k = (Q/A) (µL/∆P), where k is permeability, Qis the measured volume flow rate, A is the slot area (thickness xfixed width of 40 mm), µ and L the fluid viscosity and fracturelength, and ∆P the pressure differential. For a slot thickness of0.2 mm, the equivalent permeability decreases from approxi-mately 1.35 × 10⁻¹⁴ m2 at 5 MPa effective pressure to only 0.25× 10⁻¹⁵ m2 at the maximum effective pressure of 30 MPa. Highervalues of slot thickness (0.4 mm, 0.6 mm) produce a concomitantdecrease in permeability, with a value of 0.2 mm fitting well tothe data. The permeability of unfractured DA is extremely low,
less than 1.5 × 10⁻¹⁶ m2, which is similar to Etna Basalt. Weattribute this to the poorly connected porosity of these volcanicrocks. As noted earlier, an ongoing challenge related to bothgeothermal and also unconventional resource extraction is thatof permeability hysteresis. Cyclical pore (or effective) pressure isknown to have serious effects on the ability of a fracture networkto recover to a previous value of permeability (hysteresis effect),as measured on low porosity sandstone (5%). We attribute thiseffect in DA to the presence of clay and other minerals in the crackfabric of this rock type (long, thin, high aspect ratio cracks) thatare less resilient to pressure than equant pore space.
In addition, hysteresis is found to impact elastic wave veloci-ties and moduli. The highest fracture permeability (after sampledeformation) was at low confining pressures. This coincides witha significant reduction in P-wave elastic velocity and Young’smodulus. Conversely, the subsequent increase in confining pres-sure resulted in a partial recovery of elastic attributes but withconsiderable reduction in permeability. Static moduli acquiredvia mechanical stress–strain loops follows a similar trend. Thebehaviour of the examined properties is likely to reflect the

Please cite this article as: P.M. Benson, D.C. Austria, S. Gehne et al., Laboratory simulations of fluid-induced seismicity, hydraulic fracture, and fluid flow, Geomechanics forEnergy and the Environment (2020) 100169, https://doi.org/10.1016/j.gete.2019.100169.
12 P.M. Benson, D.C. Austria, S. Gehne et al. / Geomechanics for Energy and the Environment xxx (xxxx) xxx
Fig. 13. Permeability data for a freshly generated (simulated in-situ) shear fracture linking two offset conduits, simulating fluid-stimulated geothermal systems. Thecalculated permeability, based on measured flow rate and modelled by a parallel slot lining the injection and receiving ports, is primarily controlled by the cumulativecrack aperture. Permeability decreases both with increasing confining pressure, and with subsequent cycles of confining pressure.
changing material competency (elastic properties), and is poten-tially useful in interpreting seismic models of geothermal sys-tems where changes in physical conditions can occur rapidlywhich have severe implications to the economic sustainability ofthe reservoir. New fractures, and movement on existing faults,are manifested as both large and small magnitude earthquakeswarms commonly occurring in tectonically active areas wheregeothermal fields are situated. Therefore, movement and theonset of rock mass instability could be detected by monitoringthe behaviour of seismic attributes modelled from surface seismicinstruments, with the aim of avoiding reactivation of dormantstructures such as in the Basel event (Switzerland: Giardini30;Bachmann et al.31) and the Presse Hall triggered sequence (UK:O’Toole et al.105; Clark et al.24). The ability to detect and monitorfracture permeability hysteresis will be particularly helpful inresource management by determining which part of the reservoircan be further exploited and targeted for drilling productionwells.
Finally, the sample was heated to 175 ◦C and the pore fluid(water) vented to stimulate AE. Fig. 14 shows the AE signal,which is generated, due to the modified setup, by fluid travel-ling along the damage zone and associated shear fault. The AEshows the same low-frequency response at the onset of fluiddecompression as reported by other studies15,34 due to the rock-fluid coupling. We also note that AE data shows a longer lastingwaveform, compared to the previously used Etna basalt which weattribute to the higher porosity of this material (6%, comparedto 2% for Etna basalt). This, combined with the development ofa more extensive damage zone linked by the offset conduits,likely generates conditions whereby fluid is able to vent moreslowly through the fracture damage zone to atmosphere andthus yielding the longer tremor in the AE record. Such datahave been instrumental in covering the key gaps in knowledgebetween these natural systems and the engineered environment.And, although the difference in scale is obvious, scale invariantmethods such as AE location and elastic wave velocity changesmap well to fault shear zones, across a range of controlled con-ditions (e.g. Ref. 15). The seismo-mechanical relationship duringhydraulic fracturing shows that AE activity can generate a usefulgeophysical picture of the evolving tensile fracture nucleation incrustal rocks allowing laboratory experiments to generate datathat help to develop our understanding of fracture in the field,and how seismicity can be used to better understand and monitorthe process remotely. Such warning methods are also widely usedin the mining industry where it is used to guide the process, oftenfor safety reasons (e.g. Collins et al. 2002).
5. Discussion and conclusions: coupled hydro-mechanics inenergy geosciences
Many areas of geomechanics for energy and resource explo-ration rely on fluid flow in porous media for their viability,ranging from conventional hydrocarbon and water reservoirs, tounconventional hydrocarbons and engineered geothermal sys-tems. In the case of unconventional hydrocarbons and geothermalsystems it is often necessary to generate new shear and ten-sile fracture networks in order to fully exploit these resources,in addition to the reactivation of pre-existing discontinuities. Anumber of natural fracture systems have been reported wherethere is evidence for fluid-driven fracture (e.g. Ref. 63). This isevident in the field of volcanology, for example, where dykeand magma intrusions are a good analogue for natural hydraulicfracture — even though the pressure and temperatures are veryhigh. The processes of dyke intrusion and hydrothermal fluidinjection are known to produce a diverse range of seismic activitydepending on the model of rock fracture, or the nature of the fluidresonance within the fractured media (e.g. Chouet et al., 1996).The monitoring of local seismicity in and around volcanoes hasbeen used for decades to better understand the deep volcanicprocesses and plumbing system. The increasing event rate andmagnitude of volcano-tectonic activity has often been used toforecast impending unrest and is now a standard tool in mostvolcano observatories (e.g. Refs. 32, 106–108). In the early 1980’sthis was joined by the discovery of Low Frequency and LongPeriod signals due to fluid resonance and turbulence that, for atime, was thought to herald a new era of forecasting (e.g. Ref. 33).However, this has not transpired due to the complexities of thesenatural systems.
Understanding the physical properties governing fluid-rockinteractions and permeability is critical to the development ofenergy resources previously not sought after due to complexitiesand lack of knowledge. Here, using laboratory methods and rocksamples taken from the field in areas spanning both geothermaland hydraulic fracture potential allows us to collect seismic, me-chanical, and fluid flow data contemporaneously. Properly con-ducted, such calibrations will elucidate the underlying processesby simulating subsurface conditions. We have here reported bothlegacy hydraulic fracture data, and new data focusing on thegeothermal potential of the Southern Negros geothermal field.From these, we conclude that the delay in unstable fracturing isrelated to fracture geometry and the complexity of the fracturenetwork, as revealed by longer delay phases in experiments withmore complex fracture geometries. In the case of fluid-driven

Please cite this article as: P.M. Benson, D.C. Austria, S. Gehne et al., Laboratory simulations of fluid-induced seismicity, hydraulic fracture, and fluid flow, Geomechanics forEnergy and the Environment (2020) 100169, https://doi.org/10.1016/j.gete.2019.100169.
P.M. Benson, D.C. Austria, S. Gehne et al. / Geomechanics for Energy and the Environment xxx (xxxx) xxx 13
Fig. 14. New data showing AE swarms recorded in Dumaguete Andesite as pore fluid heated to 175 ◦C is vented through the damage zone geometry as shown inFig. 1(C). In a similar matter to Fazio et al.34 a swarm of AE is recorded as pressure is vented, which continues as liquid water changes to steam.
tensile failure, once sufficient pressure has built up fracture prop-agation evolves from a stable to an unstable regime, markingthe breakdown of the sample. Combined, these new laboratorysimulations provide an alternative view to the widely appliedassumption that both events occur at maximum fluid pressure.These observations show that AE activity, fluid injection rates,and deformation are key indicators for estimating rock fracturesubjected to elevated fluid pressures.
Fluid production in geothermal fields causes a decrease inpore pressure that in turn promotes the occurrence of cold-waterintrusion and steam cap development. Specifically, the relativelyrapid decrease of pressure around production wells creates adepression in the pressure profile and enhances two-phase (liquidand steam) fluid formation. We find that this liquid–gas phasechange generates characteristic and persistent AEs at low fre-quencies (10–90 kHz in the laboratory). This transition occursat a pressure (around 2 MPa) at which water no longer remainsin the liquid phase at the temperature tested of 175 ◦C,109 andconsistent with typical geothermal reservoir conditions. Studiessimulating fluid movement in volcanic areas have reported simi-lar findings, revealing that events generated from pressure releaseat high temperatures differ from shear fracturing induced eventswhen analysed in terms of source (focal) mechanisms (e.g. Julian2012; Gomez et al., 2014). Such analyses have also been usedto evaluate mining stability (e.g. Collins et al. 2002). Specifically,pure-fluid-turbulence seismic swarms are found to be domi-nated by compensated linear vector dipole (CLVD) type of eventswhile fracture and fault-slip consist mainly of double couple (DC)events (e.g. Ref. 41). This highlights the usefulness of acquiringseismic data in producing geothermal/unconventional fields toidentify areas undergoing processes described above that arecritical to managing geothermal resources. Discriminating suchfluid-induced seismicity from fault generated natural seismicityhas the potential for geohazard applications as well as findingnew areas to develop wherein active faults can be identified.The combined extraction and injection of fluids in geothermalenergy development alters the natural seismicity of the area.It is widely known that fluid-injection creates earthquakes byincreasing pore pressure and driving already critically-stressedfaults and fractures to failure. Using recent data using samplestaken from an existing geothermal reservoir, it would appearthat fluid extraction also contributes to seismicity by means ofpore pressure decrease, causing fluid movement and fluid phasechange.
Finally, we note that fracture permeability has been stud-ied using different geophysical methods with the aim of betterguiding exploration and development of energy resources. Thesegeophysical methods make use of a number of physical properties(e.g. resistivity) that provide information on the state of therock mass. By highlighting how seismic attributes change withexternal stimuli (pressure, temperature), clues to the evolvingpermeability of the deep rock mass might be estimated fromfield-based geophysics methods.
Declaration of competing interest
The authors declare that they have no known competing finan-cial interests or personal relationships that could have appearedto influence the work reported in this paper.
CRediT authorship contribution statement
Philip M. Benson: Conceptualization, Methodology, Fundingacquisition, Project administration, Writing - original draft, Writ-ing - review & editing. David Carlo Austria: Formal analysis,Writing - original draft. Stephan Gehne: Methodology, Formalanalysis. Emily Butcher:Methodology. Claire E. Harnett:Method-ology, Writing - original draft. Marco Fazio: Methodology, Formalanalysis. Pete Rowley: Formal analysis, Project administration,Writing - original draft, Writing - review & editing. RicardoTomas: Formal analysis.
Acknowledgements
This work has been financed by the National EnvironmentalResearch Council (Grant No. NE/L009110/1), a Marie Skłodowska-Curie Reintegration grant (contract No. 333588), and a RoyalSociety equipment grant (Grant No. RG130682) to PMB. The CTscanning has been performed in the Future Technology Centre atthe University of Portsmouth.
References
1. Scholz CH. Fault mechanics. In: Treatise on Geophysics, Vol. 6. Elsevier;2007, p. 441–483. http://dx.doi.org/10.1016/B978-044452748-6.00111-5.
2. Faulkner DR, Mitchell TM, Healy D, Heap MJ. Slip on ’weak’ faults bythe rotation of regional stress in the fracture damage zone. Nature.2006;444:922–925. http://dx.doi.org/10.1038/nature05353.
3. Guéguen Y, Palciauskas V. Introduction to the Physics of Rocks. PrincetonUniversity press: New Jersey; 1994, p. 292.

Please cite this article as: P.M. Benson, D.C. Austria, S. Gehne et al., Laboratory simulations of fluid-induced seismicity, hydraulic fracture, and fluid flow, Geomechanics forEnergy and the Environment (2020) 100169, https://doi.org/10.1016/j.gete.2019.100169.
14 P.M. Benson, D.C. Austria, S. Gehne et al. / Geomechanics for Energy and the Environment xxx (xxxx) xxx
4. Paterson M, Wong T-F. Experimental Rock Deformation: The Brittle Field.Springer: Berlin; 2005, http://dx.doi.org/10.1007/b137431.
5. Etheridge MA, Wall VJ, Cox SF, Vernon RH. High fluid pressures dur-ing regional metamorphism and deformation: Implications for masstransport and deformation mechanisms. J Geophys Res: Solid Earth.1984;89(B6):4344–4358. http://dx.doi.org/10.1029/jb089ib06p04344.
6. Tarling MS, Smith SAF, Scott JM. Fluid overpressure from chemical reac-tions in serpentinite within the source region of deep episodic tremor. NatGeosci. 2019. http://dx.doi.org/10.1038/s41561-019-0470-z.
7. Llana-Funez S, Wheeler J, Faulkner DR. Metamorphic reaction ratecontrolled by fluid pressure not confining pressure: implications of dehy-dration experiments with gypsum. Contrib Mineral Pet. 2012;164:69–79.http://dx.doi.org/10.1007/s00410-012-0726-8.
8. Dragert H, Wang K, James TS. A silent slip event on the deeper Cascadiasubduction interface. Science. 2001;292:1525–1528. http://dx.doi.org/10.1126/science.1060152.
9. Milsch HH, Scholz CH. Dehydration-induced weakening and fault slip ingypsum: Implications for the faulting process at intermediate depth insubduction zones. J Geophys Res. 2005;110:B04202. http://dx.doi.org/10.1029/2004JB003324.
10. Tuffen H, Dingwell DB. Fault textures in volcanic conduits: evidencefor seismic trigger mechanisms during silicic eruptions. Bull Volcanol.2005;67:370–387. http://dx.doi.org/10.1007/s00445-004-0383-5.
11. Tuffen H, Smith R, Sammonds PR. Evidence for seismogenic fractureof silicic magma. Nature. 2008;453:511–514. http://dx.doi.org/10.1038/nature06989.
12. Chouet BA. Ground motion in the near field of a fluid-driven crack andits interpretation in the study of shallow volcanic tremor. J Geophys Res.1981;86:5985–6016. http://dx.doi.org/10.1029/JB086iB07p05985.
13. Chouet B. Long-period volcano seismicity: Its source and use in erup-tion forecasting. Nature. 1996;380:309–316. http://dx.doi.org/10.1038/380309a0.
14. Burlini L, Vinciguerra S, Di Toro G, De Natale G, Meredith P, Burg JP. Seis-micity preceding volcanic eruptions: new experimental insights. Geology.2007;35:183–186. http://dx.doi.org/10.1130/G23195A.1.
15. Benson P, Vinciguerra S, Meredith P, Young R. Laboratory simulation ofvolcano seismicity. Science. 2008;322:249–252. http://dx.doi.org/10.1126/science.1161927.
16. Ito Y, Obara K, Shiomi K, Sekine S, Hirose H. Slow earthquakes coincidentwith episodic tremors and slow slip events. Science. 2007;315:503–506.http://dx.doi.org/10.1126/science.1134454.
17. Andrews I. The Carboniferous Bowland Shale Gas Study: Geology and ResourceEstimation. British Geological Survey for Department of Energy and ClimateChange: London, UK; 2003, https://www.ogauthority.co.uk/media/2782/bgs_decc_bowlandshalegasreport_main_report.pdf.
18. Sesetty V, Ghassemi A. Effect of rock anisotropy on wellbore stresses andhydraulic fracture propagation. Int J Rock Mech Min Sci. 2018;112:369–384.http://dx.doi.org/10.1016/j.ijrmms.2018.09.005.
19. Warpinski NR, Du J, Zimmer U. Measurements of hydraulic-fracture-induced seismicity in gas shales. SPE. 2012;27:240–252. http://dx.doi.org/10.2118/151597-MS.
20. Van Eijs RMHE, Mulders FMM, Nepveu M, Kenter CJ, Scheffers BC. Corre-lation between hydrocarbon reservoir properties and induced seismicityin the netherlands. Eng Geol. 2006;84:99–111. http://dx.doi.org/10.1016/j.enggeo.2006.01.002.
21. Green CA, Styles P, Baptie B. Preese Hall Shale Gas Fracturing Reviewand Recommendations for Induced Seismic Mitigation Report. Report forDECC, 2012, https://assets.publishing.service.gov.uk/government/uploads/system/uploads/attachment_data/file/48330/5055-preese-hall-shale-gas-fracturing-review-and-recomm.pdf.
22. Ellsworth WL. Injection-induced earthquakes. Science. 2013;341. http://dx.doi.org/10.1126/science.1225942.
23. Davies R, Foulger G, Bindley A, Styles P. Induced seismicity and hy-draulic fracturing for the recovery of hydrocarbons. Mar Pet Geol.2013;45:171–185. http://dx.doi.org/10.1016/j.marpetgeo.2013.03.016.
24. Clarke H, Eisner L, Styles P, Turner P. Felt seismicity associated with shalegas hydraulic fracturing: The first documented example in Europe. GeophysRes Lett. 2014;41:8308–8314. http://dx.doi.org/10.1002/2014GL062047.
25. Keranen KM, Weingarten M, Abers GA, Bekins BA, Ge S. Sharp increase incentral oklahoma seismicity since 2008 induced by massive wastewaterinjection. Science. 2014;345(6195):448–451.
26. Zappone A, Benson PM. Effect of phase transitions on seismic propertiesof metapelites: new laboratory evidence. Geology. 2013;41:463–466. http://dx.doi.org/10.1130/G33713.1.
27. Hildreth W. Volcanological perspectives on Long Valley, Mammoth Moun-tain and Mono craters: several contiguous but discrete systems. J VolcanolGeotherm Res. 2004;136:169–1198. http://dx.doi.org/10.1016/j.jvolgeores.2004.05.019.
28. Majer EL, Baria R, Stark M, Oates S, Bommer J, Smith B, Asanuma H.Induced seismicity associated with enhanced geothermal systems. Geother-mics. 2007;36:185–222. http://dx.doi.org/10.1016/j.geothermics.2007.03.003.
29. Häring MO, Schanz U, Ladner F, Dyer BC. Characterisation of the basel1 enhanced geothermal system. Geothermics. 2008;37:469–495. http://dx.doi.org/10.1016/j.geothermics.2008.06.002.
30. Giardini D. Geothermal quake risks must be faced. Nature. 2009;462:848–849. http://dx.doi.org/10.1038/462848a.
31. Bachmann CE, Wiemer S, Goertz-Allmann BP, Woessner J. Influenceof pore-pressure on the event-size distribution of induced earth-quakes. Geophys Res Lett. 2012;39:L09302. http://dx.doi.org/10.1029/2012GL051480.
32. Kilburn CRJ. Fracturing as a quantitative indicator of lava flow dynamics. JVolcanol Geotherm Res. 2004;132(2–3):209–224. http://dx.doi.org/10.1016/S0377-0273(03)00346-9.
33. Neuberg J, Tuffen H, Collier L, Green D, Powell T, Dingwell D. Thetrigger mechanism of low-frequency earthquakes on montserrat. J VolcanolGeotherm Res. 2006;153:37–50. http://dx.doi.org/10.1016/j.jvolgeores.2005.08.008.
34. Fazio M, Benson PM, Vinciguerra S. On the generation mechanisms offluid-driven seismic signals related to volcano tectonics. Geophys Res Lett.2017;44:734–742. http://dx.doi.org/10.1002/2016GL070919.
35. Lockner DA, Walsh JB, Byerlee JD. Changes in seismic velocity and atten-uation during deformation of granite. J Geophys Res. 1977;82:5374–5378.http://dx.doi.org/10.1029/JB082i033p05374.
36. Lockner DA, Byerlee JD. Velocity anomalies: An alternative explanationbased on data from laboratory experiments. PAGEOPH. 1978;116:765–772.http://dx.doi.org/10.1007/BF00876537.
37. Lockner D, Byerlee J, Kuksenko V, Ponomarev A, Sidorin A. Quasi-staticfault growth and shear fracture energy in granite. Nature. 1991;350:39–42.http://dx.doi.org/10.1038/350039a0.
38. Lei X, Kusunose K, Rao MVMSO, Satoh NT. Quasi-static fault growth andcracking in homogeneous brittle rock under triaxial compression usingacoustic emission monitoring. J Geophys Res. 2000;105:6127–6140. http://dx.doi.org/10.1029/1999JB900385.
39. Dobson DB, Meredith PG, Boon SA. Simulation of subduction zone seis-micity by dehydration of serpentine. Science. 2003;15:1407–1410. http://dx.doi.org/10.1126/science.1075390.
40. Thompson BD, Young RP, Lockner DA. Observations of premonitory acous-tic emission and slip nucleation during a stick slip experiment in smoothfaulted westerly granite. Geophys Res Lett. 2005;32:L10304. http://dx.doi.org/10.1029/2005GL022750.
41. Benson PM, Thompson BD, Meredith PG, Vinciguerra S, Young RP.Imaging slow failure in triaxially deformed etna basalt using 3D acoustic-emission location and X-ray computed tomography. Geophys Res Lett.2007;34:L03303. http://dx.doi.org/10.1029/2006GL028721.
42. Schubnel A, Benson PM, Thompson BD, Hazard JF, Young RP. Quantifyingdamage, saturation and anisotropy in cracked rocks by inverting elasticwave velocities. Pure Appl Geophys. 2006;163:947–973. http://dx.doi.org/10.1007/s00024-006-0061-y.
43. Benson PM, Vinciguerra S, Meredith PG, Young RP. Spatio-temporal evo-lution of volcano seismicity: A laboratory study. Earth Planet Sci Lett.2010;297:315–323. http://dx.doi.org/10.1016/j.epsl.2010.06.033.
44. Hatton CG, Main IG, Meredith PG. Non-universal scaling of fracture lengthand opening displacement. Nature. 1994;367:160–162. http://dx.doi.org/10.1038/367160a0.
45. Cowie PA, Knipe RJ, Main IG. Scaling laws for fault and fracturepopulations: Analyses and applications. J Struct Geol. 1996;18:5–11.
46. Baró J, Corral Á, Illa X, Planes A, Salje EKH, Schranz W, Soto-Parra DE,Vives E. Statistical similarity between the compression of a porous materialand earthquakes. Phys Rev Lett. 2013;110. 088702.
47. Main IG. A damage mechanics model for power-law creep and earthquakeaftershock and foreshock sequences. Geophys J Int. 2000;142:151–161.http://dx.doi.org/10.1046/j.1365-246x.2000.00136.x.
48. Gehne S, Benson PM. Permeability and permeability anisotropy in CrabOrchard Sandstone: Experimental insights into spatio-temporal effects.Tectonophysics. 2017;712:589–599. http://dx.doi.org/10.1016/j.tecto.2017.06.014.
49. Goodfellow SD, Nasseri MHB, Maxwell SC, Young RP. Hydraulic frac-ture energy budget: Insights from the laboratory. Geophys Res Lett.2015;42:3179–3187. http://dx.doi.org/10.1002/2015GL063093.
50. McLaskey GC, Lockner DA, Kilgore BD, Beeler NM. A robust calibrationtechnique for acoustic emission systems based on momentum trans-fer from a ball drop. BSSA. 2015;105:257–271. http://dx.doi.org/10.1785/0120140170.
51. Selvadurai PA, Glaser SD. Characterizing frictional interfaces in thelaboratory. Sensors. 2015;15:9791.

Please cite this article as: P.M. Benson, D.C. Austria, S. Gehne et al., Laboratory simulations of fluid-induced seismicity, hydraulic fracture, and fluid flow, Geomechanics forEnergy and the Environment (2020) 100169, https://doi.org/10.1016/j.gete.2019.100169.
P.M. Benson, D.C. Austria, S. Gehne et al. / Geomechanics for Energy and the Environment xxx (xxxx) xxx 15
52. Brantut N, Sulem J, Schubnel A. Effect of dehydration reactions onearthquake nucleation: Stable sliding, slow transients, and unstable slip.J Geophys Res: Solid Earth. 2011;116(5):1–16. http://dx.doi.org/10.1029/2010JB007876.
53. Gehne S, Benson PM, Koor N, Dobson KJ, Enfield M, Barber A. Seismo-mechanical response of anisotropic rocks under simulated hydraulicfracture conditions: new experimental insights. J Geophys Res (solid Earth).2019;124. http://dx.doi.org/10.1029/2019JB017342.
54. Stoeckhert F, Molenda M, Brenne S, Alber M. Fracture propagation in sand-stone and slate-laboratory experiments, acoustic emissions and fracturemechanics. J Rock Mech Geotech Eng. 2015;7:237–249. http://dx.doi.org/10.1016/j.jrmge.2015.03.011.
55. Browning J, Meredith PG, Stuart C, Harland S, Healy D, Mitchell TM. Adirectional crack damage memory effect in sandstone under true triaxialloading. Geophys Res Lett. 2018;45:6878–6886. http://dx.doi.org/10.1029/2018GL078207.
56. Dong J, Chen M, Li Y, Wang S, Zeng C, Zaman M. Experimental andtheoretical study on dynamic hydraulic fracture. Energies. 2019;12:397.http://dx.doi.org/10.3390/en12030397.
57. Li N, Shicheng Z, Zou1 Y, Ma X, Zhang Z, Li1 S, Chen M, Sun Y.Acoustic emission response of laboratory hydraulic fracturing in layeredshale. Rock Mech Rock Eng. 2018;51:3395–3406. http://dx.doi.org/10.1007/s00603-018-1547-5.
58. Lavallée Y, Benson PM, Heap MJ, Flaws A, Hess K-U, Dingwell DB. Volcanicconduit failure as a trigger to magmatic fragmentation. Bull Volcanol.2011;74:11–13. http://dx.doi.org/10.1007/s00445-011-0544-2.
59. Benson PM, Lavallée Y, Heap MJ, Flaws A, Hess KU, Dingwell DB. Laboratorysimulations of tensile fracture via cyclical magma pressurisation. EarthPlanet Sci Lett. 2012;349:231–239. http://dx.doi.org/10.1016/j.epsl.2012.07.003.
60. Lister JR, Kerr RC. Fluid-mechanical models of crack propagationand their application to magma-transport in dykes. J Geophys Res.1991;96:10049–10077. http://dx.doi.org/10.1029/91JB00600.
61. Taisne B, Tait S. Effect of solidification on a propagating dike. J GeophysRes. 2011;116:B01206. http://dx.doi.org/10.1029/2009JB007058.
62. Bakker R, Fazio M, Benson PM, Hess KU, Dingwell DB. The propagationand seismicity of dyke injection, new experimental evidence. Geophys ResLett. 2016;43:1876–1883. http://dx.doi.org/10.1002/2015GL066852.
63. Tuffen H, Dingwell DB, Pinkerton H. Repeated fracture and healingof silicic magma generate flow banding and earthquakes?. Geology.2003;31:1089–1092. http://dx.doi.org/10.1130/G19777.1.
64. Rocchi V, Sammonds PR, Kilburn CRJ. Fracturing of etnean and vesuvianrocks at high temperatures and low pressures. J Volcanol Geotherm Res.2004;132:137–157. http://dx.doi.org/10.1016/S0377-0273(03)00342-1.
65. Smith R, Sammonds PR, Kilburn CRJ. Fracturing of volcanic systems:experimental insights into pre-eruptive conditions. Earth Planet Sci Lett.2009;280:211–219. http://dx.doi.org/10.1016/j.epsl.2009.01.032.
66. Chandler MR, Meredith PG, Brantut N, Crawford BR. Fracture toughnessanisotropy in shale. J Geophys Res: Solid Earth. 2016;121:1706–1729. http://dx.doi.org/10.1002/2015JB012756.
67. Vinciguerra S, Meredith PG, Hazzard J. Experimental and modeling studyof fluid pressure-driven fractures in Darley Dale sandstone. Geophys ResLett. 2004;31:L09609. http://dx.doi.org/10.1029/2004GL019638.
68. Stanchits S, Mayr S, Shapiro S, Dresen G. Fracturing of porous rock inducedby fluid injection. Tectonophysics. 2011;503:129–145. http://dx.doi.org/10.1016/j.tecto.2010.09.022.
69. Fazio M, Alparone S, Benson PM, Cannata A, Vinciguerra S. Genesis andmechanisms controlling Tornillo seismo-volcanic events in volcanic areas.Nat Sci Rep. 2019;9:7338. http://dx.doi.org/10.1038/s41598-019-43842-y.
70. Zoback M, Rummel F, Jung R, Raleigh C. Laboratory hydraulic fracturingexperiments in intact and pre-fractured rock. Int J Rock Mech Min SciGeomech Abstr. 1977;14:49–58. http://dx.doi.org/10.1016/0148-9062(77)90196-6.
71. Schmitt DR, Zoback M. Diminished pore pressure in low-porositycrystalline rock under tensional failure; apparent strengthening by dila-tancy. J Geophys Res Atmos. 1992;97:273–288. http://dx.doi.org/10.1029/91JB02256.
72. Rummel F, Hansen J. Interpretation of hydrofrac pressure recordings usinga simple fracture mechanics simulation model. Int J Rock Mech Min SciGeomech Abstr. 1989;26:483–488. http://dx.doi.org/10.1016/0148-9062(89)91425-3.
73. Zang A, Zimmermann G, Hofmann H, Stephansson O, Min K-B, Kim K-Y. How to reduce fluid-injection-induced seismicity. Rock Mech Rock Eng.2019;52:475–493. http://dx.doi.org/10.1007/s00603-018-1467-4.
74. Gehne S, Benson PM. Permeability enhancement through hydraulic frac-turing: new laboratory measurements combining a 3D printed jacket anddirect over-pressure. Nat Sci Rep. 2019;9:12573. http://dx.doi.org/10.1038/s41598-019-49093-1.
75. Burlini L, Di Toro G, Meredith P. Seismic tremor in subduction zones:Rock physics evidence. Geophys Res Lett. 2009;36:8305. http://dx.doi.org/10.1029/2009GL037735.
76. Brantut N, Schubnel A, David EC, Heripre E, Guéguen Y, Dimanov A.Dehydration-induced damage and deformation in gypsum and implicationsfor subduction zone processes. J Geophys Res. 2012;117:B03205. http://dx.doi.org/10.1029/2011JB008730.
77. Bakker R, Violay ES, Benson PM, Vinciguerra SV. Ductile flow in sub-volcanic carbonate basement as the main control for edifice stability: newexperimental insights. Earth Planet Sci Lett. 2015;430. http://dx.doi.org/10.1016/j.epsl.2015.08.017, 553-541.
78. Birch F. The velocity of compressional waves in rocks to 10 kilo-bars: 1. J Geophys Res. 1960;65:1083–1102. http://dx.doi.org/10.1029/JZ065i004p01083.
79. Goebel THW, Becker TW, Schorlemmer D, Stanchits S, Sammis C, Ry-backi E, Dresen G. Identifying fault heterogeneity through mapping spatialanomalies in acoustic emission statistics. J Geophys Res. 2012;117:B03310.http://dx.doi.org/10.1029/2011JB008763.
80. Thompson BD, Young RP, Lockner DA. Fracture in westerly granite underAE feedback and constant strain rate loading: Nucleation, quasi-staticpropagation, and the transition to unstable fracture propagation. Pure ApplGeophys. 2006;163:995–1019.
81. Benson PM, Meredith PG, Schubnel A. Role of void space geometry inpermeability evolution in crustal rocks at elevated pressure. J Geophys Res:Solid Earth. 2006;111:B12203. http://dx.doi.org/10.1029/2006JB004309.
82. King T, Benson PM, De Siena L, Vinciguerra S. Investigating theapparent seismic diffusivity of near-receiver geology at Mount St. He-lens Volcano, USA. Geosciences. 2018;7:130. http://dx.doi.org/10.3390/geosciences7040130.
83. Nasseri MHB, Benson PM, A. Schubnel, Young RP. Common evolution ofmechanical and transport properties in thermally cracked westerly graniteat elevated hydrostatic pressure. Pure Appl Geophys. 2009;166:927–948.http://dx.doi.org/10.1007/s00024-009-0485-2.
84. Colombero C, Comina C, Vinciguerra S, Benson PM. Microseismicity ofan unstable rock mass: From field monitoring to laboratory testing. JGeophys Res: Solid Earth. 2018;123:1673–1693. http://dx.doi.org/10.1002/2017JB014612.
85. Audet P, Bostock MG, Christen NI, Peacock SM. Seismic evidence for over-pressured subducted oceanic crust and megathrust fault sealing. Nature.2009;457:76–78. http://dx.doi.org/10.1038/nature07650.
86. Vinciguerra S, Trovato C, Meredith P, Benson PM. Relating seismic veloci-ties, thermal cracking and permeability in Mt. Etna and Iceland basalts. IntJ Rock Mech Min Sci. 2005;42:900–910. http://dx.doi.org/10.1016/j.ijrmms.2005.05.022.
87. Vinciguerra S, Trovato C, Meredith P, Benson PM, De Luca G, Troise C,De Natale G. The seismic velocity structure of Campi flegrei caldera(Italy): from the laboratory to the field scale. Pure Appl Geophys.2006;163:2205–2221. http://dx.doi.org/10.1007/s00024-006-0118.
88. Browning J, Meredith P, Gudmundsson A. Cooling-dominated cracking inthermally stressed volcanic rocks. Geophys Res Lett. 2016;43:8417–8425.http://dx.doi.org/10.1002/2016GL070532.
89. Harnett CE, Benson PM, Rowley P, Fazio M. Fracture and damage localiza-tion in volcanic edifice rocks from El Hierro, Stromboli and Tenerife. NatSci Rep. 2018;8:1942. http://dx.doi.org/10.1038/s41598-018-20442-w.
90. Castagna A, Ougier-Simonin A, Benson PM, Browning J, Walker RJ, Fazio M,Vinciguerra S. Temperature and pore pressure effects on brittle-ductiletransition of comiso limestone. J Geophys Res. 2018;123:7644–7660. http://dx.doi.org/10.1029/2017JB015105.
91. Ayling MR, Meredith PG, Murrell SAF. Microcracking during triaxial defor-mation of porous rocks monitored by changes in rock physical properties.I. Elastic-wave propagation measurements on dry rocks. Tectonophysics.1995;245:205–221. http://dx.doi.org/10.1016/0040-1951(94)00235-2.
92. De Natale G, Troise C, Trigila R, Dolfi D, Chiarabba C. Seismicity and 3-Dsubstructure at somma-vesuvius volcano: evidence for magma quenching.Earth Planet Sci Lett. 2004;221:181–196. http://dx.doi.org/10.1016/S0012-821X(04)00093-7.
93. De Natale G, Troise C, Mark D, Mormone A, Piochi M, Di Vito MA,Isaia R, Carlino S, Barra D, Somma R. The Campi Flegrei Deep DrillingProject (CFDDP): New insight on caldera structure, evolution and hazardimplications for the Naples area (Southern Italy). Geochem Geophys Geosyst.2016;17:4836–4847. http://dx.doi.org/10.1002/2015GC006183.
94. Scholz CH. The Mechanics of Earthquakes and Faulting. 2nd ed., CambridgeUniv. Press: Cambridge, UK; 2002.
95. Chouet BA, Page RA, Stephens CD, Lahr JC, Power JAJ. Precursory swarms oflong-period events at Redoubt Volcano (1989 1990). Alaska: Their originand use as a forecasting tool. J Volcanol Geotherm Res. 1994;62:95–135.http://dx.doi.org/10.1016/0377-0273(94)90030-2.
96. Rogers G, Dragert H. Episodic tremor and slip on the Cascadia subductionzone: The chatter of silent slip. Science. 2003;300:1942–1943. http://dx.doi.org/10.1126/science.1084783.
97. Rubinstein J, Vidale JE, Gomberg J, Bodin P, Creager KC, Malone SD.Non-volcanic tremor driven by large transient shear stresses. Nature.2007;448:579–582. http://dx.doi.org/10.1038/nature06017.

Please cite this article as: P.M. Benson, D.C. Austria, S. Gehne et al., Laboratory simulations of fluid-induced seismicity, hydraulic fracture, and fluid flow, Geomechanics forEnergy and the Environment (2020) 100169, https://doi.org/10.1016/j.gete.2019.100169.
16 P.M. Benson, D.C. Austria, S. Gehne et al. / Geomechanics for Energy and the Environment xxx (xxxx) xxx
98. Julian BR. Volcanic tremor: Non-linear excitation by fluid flow. J GeophysRes. 1994;99:11859–11877. http://dx.doi.org/10.1029/93JB03129.
99. Torres RA, Gomez DM, Narvaez ML. Unusual seismic signals associatedwith the activity at galeras volcano, Colombia, from 1992 to 1994. AnnGeophys. 1996;39:299–310.
100. Gómez MDM, Torres C, Roberto A. Unusual low-frequency volcanic seismicevents with slowly decaying coda waves observed at galeras and othervolcanoes. J Volcanol Geotherm Res. 1997;77:173–193. http://dx.doi.org/10.1016/S0377-0273(96)00093-5.
101. Lavallée Y, Benson PM, Heap MJ, Hess K-U, Flaws A, Schillinger B, Mered-ith PG, Dingwell DB. Reconstructing magma failure and the degassingnetwork of dome-building eruptions. Geology. 2013;41:515–518. http://dx.doi.org/10.1130/G33948.1.
102. Benson P, Meredith P, Platzman E, White R. Pore fabric shape anisotropyin porous sandstones and its relation to elastic wave velocity and per-meability anisotropy under hydrostatic pressure. Int J Rock Mech Min Sci.2005;42:890–899. http://dx.doi.org/10.1016/j.ijrmms.2005.05.003.
103. Gandossi L. An Overview of Hydraulic Fracturing and Other FormationStimulation Technologies for Shale Gas Production. Eur. Commission Jt. Res.Cent. Tech. Reports, 2013, http://dx.doi.org/10.2790/133987.
104. Heap MJ, Vinciguerra S, Meredith PG. The evolution of elastic moduliwith increasing crack damage during cyclic stressing of a basalt from Mt.Etna volcano. Tectonophysics. 2009;471:153–160. http://dx.doi.org/10.1016/j.tecto.2008.10.004.
105. O’Toole T, Verdon JP, Woodhouse JH, Kendall JM. Induced seismicityat Preese Hall, UK—A review. In: 75th EAGE Conference and Exhibitionincorporating SPE EUROPEC 2013, London, 2013.
106. Bell AF, Naylor M, Heap MJ, I.G. Main. Forecasting volcanic eruptionsand other material failure phenomena: An evaluation of the failureforecast method. Geophys Res Lett. 2011;38:L15304. http://dx.doi.org/10.1029/2011GL048155.
107. Bean CJ, De Barros L, Lokmer I, Metaxian J, O’Brien G, Murphy S. Long-period seismicity in the shallow volcanic edifice. Nat Geosci. 2014;7:71–75.http://dx.doi.org/10.1038/ngeo2027.
108. Kilburn CRJ, De Natale G, Carlino S. Progressive approach to eruption atCampi flegrei caldera in southern Italy. Nature Commun. 2017;8:15312.http://dx.doi.org/10.1038/ncomms15312.
109. Benson PM, Vinciguerra S, Nasseri MHB, Young RP. Laboratory simulationsof fluid/gas induced micro-earthquakes: application to volcano seismology.Front Earth Sci. 2014;2:32. http://dx.doi.org/10.3389/feart.2014.00032.