labour’s social policy record: policy, spending and...
TRANSCRIPT

ASE
Labour’s Social Policy Record: Policy, Spending and Outcomes 1997-2010
Ruth Lupton, with John Hills, Kitty Stewart and Polly Vizard
Social Policy in a Cold Climate Research Report 1June 2013
POVERTY
EDUCATION
WELFAREEARLY YEARS
NEIGHBOURHOOD RENEWAL
HEALTH
To see underlying data click on the charts/figures or visit www.casedata.org.uk
2
Labour’s Social Policy Record:
Policy, Spending and Outcomes
1997-2010
Ruth Lupton with John Hills, Kitty Stewart and Polly Vizard

3
Preface This is the summary report of a series of working papers which form the first
stage of a programme of research, Social Policy in a Cold Climate, designed
to examine the effects of the major economic and political changes in the UK
since 2007, particularly their impact on the distribution of wealth, poverty,
income inequality and spatial difference. The full programme of analysis will
include policies and spending decisions from the last period of the Labour
government (2007-2010), including the beginning of the financial crisis, as
well as those made by the Coalition government since May 2010. The
programme is funded by the Joseph Rowntree Foundation and the Nuffield
Foundation, with London-specific analysis funded by the Trust for London.
The views expressed are those of the authors and not necessarily those of
the funders.
The research is taking place from October 2011 to May 2015. More detail
and other papers in the series will be found at:
http://sticerd.lse.ac.uk/case/_new/research/Social_Policy_in_a_Cold_Climate
.asp
In our first set of papers, including this, we look back at the policies of the
Labour government from 1997 to 2010, charting their approach and
assessing their impact on the distribution of outcomes and on poverty and
inequality particularly. This provides a baseline for analysing and
understanding the changes that are now taking place under the Coalition
government. All these papers approach this by following a chain from
ultimate policy aims, through specific policy objectives, to public spending
and other policies, to outcomes. This provides a device for the systematic
analysis and comparison of activity and impact in different social policy
areas. A short supplementary paper defining the terms used in the
framework and exploring its uses and limitations is available at
http://sticerd.lse.ac.uk/dps/case/spcc/RN001.pdf
Acknowledgements
We are very grateful to other members of the CASE research team who have
contributed enormously to the collection and analysis of the facts and figures
upon which this report is based: Polina Obolenskaya, Amanda Fitzgerald,
Alex Fenton, Ludovica Gambaro and Tiffany Tsang. Members of our
advisory group helped with guidance and advice. Howard Glennerster, Bert
Provan and Ian Gough made invaluable comments on an earlier draft, while
Abigail McKnight had a key role in commenting on drafts of the underlying
papers, as did a range of independent referees, whom we thank. Cheryl
Conner has contributed a vast amount of administrative support and
cheerfulness throughout. The Social Policy in a Cold Climate project is
supported by the Joseph Rowntree Foundation, Nuffield Foundation and

4
Trust for London, whom we thank. All the views expressed here are our
own, not necessarily theirs.
Ruth Lupton is Professor of Education at the University of Manchester, and
was previously Principal Research Fellow and Deputy Director at the Centre
for Analysis of Social Exclusion (CASE), London School of Economics and
Political Science
John Hills is Professor of Social Policy and Director of the Centre for
Analysis of Social Exclusion at the London School of Economics
Kitty Stewart is Lecturer in Social Policy at the London School of Economics
and Research Associate at CASE
Polly Vizard is a Research Fellow at CASE

5
Contents List of Figures ...................................................................................... 6
Summary ............................................................................................. 7
Chapter 1: Introduction ........................................................................ 8
Social Policy in A Cold Climate ........................................................ 8
Some Important Preliminaries .......................................................... 9
What the Report Does and Does Not Do ......................................... 9
Chapter 2: What Labour Inherited and Aimed to Do .......................... 12
Labour’s Inheritance ....................................................................... 12
Labours Aims and Goals ................................................................ 15
Chapter 3: What Labour Did .............................................................. 19
An Overview ................................................................................... 19
From Welfare to Work : Employment as the Route out of Poverty . 19
Cash Transfers ............................................................................... 21
Expanded Public Services .............................................................. 23
Targeting of Disadvantaged Areas ................................................. 26
Public Sector Reform ..................................................................... 29
Cumulative Effects on Service Provision ........................................ 32
Chapter 4: The Costs of Expansion and Reform ............................... 38
Overall Public Spending ................................................................. 38
Spending on Different Areas of the Welfare State .......................... 40
Financing Public Spending ............................................................. 43
Chapter 6: Effects on Social and Economic Outcomes .................... 46
Assessing the government’s record ............................................... 46
Were outcomes better at the end than the beginning? ................... 46
Were Outcomes Better than they Would Otherwise Have Been? .. 51
Did the Outcomes Represent Value for Money? ............................ 55
Chapter 7: Conclusion ....................................................................... 60
References ........................................................................................ 63
Appendix 1: Opportunity for All and Monitoring Poverty and Social Exclusion Indicators. .......................................................................... 67

6
List of Tables Table 1: Labour’s Outcome Goals ..................................................... 15
Table 2: Labour’s Key Policies ........................................................... 20
Table 3: Pupil:Teacher and Pupil:Adult Ratios in Primary and Secondary Schools ............................................................................ 26
Table 4: Summary of Differences in Access to and Quality of Services for People in 2010 compared with 1997............................................. 33
Table 5: Public Spending in Relation to GDP, 1996/7 to 2009/10 ...... 41
Table 6: Public Spending on Cash Benefits in Relation to GDP, 1997/8 to 2009/10 (Great Britain) .................................................................. 42
Table 7: Indicators of Change in Poverty and Social Exclusion ......... 47
List of Figures Figure 1: Trends in Poverty and Inequality 1961-1996/7 ................... 13
Figure 2: Estimated Change in Volume of Public Services Inputs 1997-2010 .......................................................................................... 25
Figure 3: Overall satisfaction with National Health Service, 1983 to 2010 ................................................................................................... 35
Figure 4: Trends in National Income (GDP) and Public Spending, 1970/71 to 2009/10 ............................................................................ 39
Figure 5: UK Public Spending by Comparison with other EU 15 ....... 40
Figure 6: Spending on Health, Education and Social Security in Historical Perspective ........................................................................ 42
Figure 7: Levels of Public Sector Debt and Current Budget Deficit .... 44
Figure 8: Poverty Rates of Different Groups 1996/7 to 2010/11 ........ 49
Figure 9: Trends in Income Inequality 1961-2010/11 ......................... 51

7
Summary This is the first major report in a wider programme assessing the impact of
the recession, government policy reforms and public spending on poverty
and inequality in the UK. Later work will assess the Coalition’s social policy
record, in the very different economic and fiscal climate of 2010-2014. As a
baseline, this paper looks at what Labour did, at what cost, and with what
impact on people’s lives.
• Labour set out an ambitious agenda to raise outcomes overall,
narrow socio-economic gaps and modernise public services.
• Public spending went up by 60 per cent and from 39.5 to 47.4 per
cent of GDP. This was a large rise but the UK started from a low
point. Until the crisis hit after 2008, spending levels were
unexceptional by historic UK and international standards.
• The extra spending went mainly on services. Health and
education both increased as a proportion of all public spending.
There were new hospitals, schools, equipment and ICT, 48,000 extra
FTE equivalent teachers, 3500 new children’s centres, more doctors
and nurses, and many new programmes aimed at neighbourhood
renewal.
• Nearly all the extra cash Labour spent on benefits went on childrenand pensioners. Benefits for working age people unrelated to
having children fell as a proportion of GDP.
• Access and quality in public services improved. Waiting times for
health services fell. Pupil-teacher ratios improved. Young children
had greater access to early years education. Poor neighbourhoods
had better facilities and less crime and vacant housing.
• Outcomes improved and gaps closed on virtually all the socio-
economic indicators Labour targeted, such as poverty for children
and pensioners and school attainment. However gaps remainedlarge. In health some indicators improved although efforts to tackle
health inequalities had mixed results.
• On some key things Labour did not explicitly target, there was no
progress. Poverty for working age people without children rose.
There was no real change in levels of income inequality. Wage
inequalities grew and disparities in regional economic performance
persisted.
In a more favourable climate than the current one, Labour spent a lot and
achieved a lot. However there was a long way still to go in relation to its
original ambitious vision. We will report in a similar way in 2015 on the
Coalition’s aims, policies and spending in response to the challenges it
faced, and on the outcomes achieved.

8
Chapter 1: Introduction
Social Policy in A Cold Climate
There is no doubt that as we write in 2013 social policy in operating in a ‘cold
climate’. The repercussions of the global financial crisis and recession have
left the UK with a current budget deficit and public sector net debt higher
than at any time since 19751, as well as low forecast economic growth. At
the same time, pressures on the public purse seem set to increase, as the
numbers of very elderly people continues its long term upward trend, and a
new baby boom creates additional demand for early years education and
care and for primary school places in the short term.2 Yet two thirds of the
population polled in the British Election Study in 2009/10 favoured either the
status quo in terms of tax and spend (56 per cent), or cutting taxes and
spending less (10 per cent).3
In this context, the current government is committed to a reduction in the size
of the deficit and also to a reduction in the size of the state, ending the days
of big government and redistributing power away from Westminster and
Whitehall, breaking up state monopolies where they exist and encouraging
responsibility and fairness in the welfare system (Cabinet Office 2010). Its
agenda for government comprises not only reduced public spending but a
restructuring of the welfare state incorporating a reduction in the size and
functions of government at all levels, less central social policy direction, a
shift to private and/or voluntary provision of public goods, and less generous
welfare benefits, including greater conditionality.
It is currently far too early to tell what impact these changes will have: in
particular whether the Coalition can deliver on its promise of a fairer society
with greater opportunities for social mobility, at the same time as spending
less. While some spending cuts and policy reforms have already been
implemented, others are only just coming on stream, notably the major
overhaul of the benefits system with the introduction of Universal Credit in
2013.. Others are scheduled for the next parliament. Below-inflation benefit
increases and continuing reductions in local authority spending will likely
produce longer term effects.
In our final report, in early 2015 we will be making an assessment of these
impacts based on the evidence to date. However any such assessment
needs a baseline. Where was the Coalition starting from? What did it
inherit from Labour both in terms of the state of the country and the capacity
of the welfare state? Were social and economic outcomes improving and
were inequalities widening or narrowing? What did the previous set of
policies - a larger and centralised welfare state – achieve?
1 Institute for Fiscal Studies
Debt and Borrowing Spreadsheet http://www.ifs.org.uk/fiscalFacts/fiscalAggregates.
2Office for National
Statistics 2010-based subnational population projections.
3Author’s analysis using
British Election Study, face to face post-election questionnaire.

9
This report aims to provide that baseline. It sets out an objective record of
Labour’s activity and impact between 1997 and 2010, based on five detailed
studies looking at different aspects of social policy and social and economic
outcomes: Labours Record on Cash Transfers, Poverty, Inequality and the
Life Cycle (Hills 2013) on Health (Vizard and Obolenskaya 2013), on the
Under-Fives (Stewart 2013), on Education (Lupton and Obolenskaya 2013)
and on Neighbourhood Renewal (Lupton, Fenton, and Fitzgerald 2013).
We ask:
• What did the Labour governments of Tony Blair and Gordon Brown aim
to do?
• What did they spend to achieve these objectives?
• What did the money produce?
• How did economic and social outcomes change overall and in particular
how did the distribution of social outcomes change, widening or
narrowing gaps between and within social groups?
We hope that this report and accompanying papers will provide a solid basis
for policy formation and debate. For a broad public audience, they provide
an accurate record of what was actually intended, done and spent in the
Labour years: a substantive and detailed account to aid interpretation of the
claims and counter-claims made by politicians and commentators on all
sides. For researchers, including ourselves as we move on to the next
phase of this programme, they provide a comprehensive set of time-series
data upon which to subsequently assess the record of the Coalition.
Some Important Preliminaries: What the Report Does and Does Not Do
When we last looked at Labour’s social policy achievements, up to 2007
(Hills, Sefton and Stewart 2009) the world was very different, enjoying a
sustained period of economic growth in which most countries were
increasing their social spending both in real terms and as a proportion of
national income. Since then, the collapse of banks worldwide has plunged
most leading industrial nations into what is commonly now known as “the
Great Recession” (Jenkins et al. 2012) and caused their governments to
undertake drastic measures first to stabilise the banking system and then to
cut back spending in order to pay down historically high levels of debt in a
context of low or no predicted growth.
In the UK, this situation has caused more than usually heated debate about
the social policy record of the previous government. Commentators now ask
not only whether Labour pursued the right policies, implemented them
efficiently and made a difference to socially desired outcomes – the

10
questions we might normally ask - but whether it caused the UK’s currently
high structural budget deficit and national debt by ‘excessive’ or
‘irresponsible’ spending, and indeed whether what was achieved in socio-
economic terms was sufficient, now that we can see its cost in a wider and
longer fiscal context. Some people will want to engage another set of
arguments about whether Labour’s promotion of credit-fuelled economic
growth ‘caused’ the bank crisis in the UK, or at least did too little to insulate
the UK from its effects, and what part increased social spending played in
that growth strategy. Furthermore, given that the possibilities for public
spending in the short and medium term appear heavily constrained, bigger
debates are being opened up about whether public spending achieves
anything anyway, or whether governments could achieve their social goals
through better performance management, innovation, focusing more sharply
on ‘what works’, privatisation or stimulating individual and/or community
responsibility.
In this light, while recognising the importance of all these debates, it is
important to be clear about the boundaries of this specific piece of work.
What we attempt to do here is:
• Put down an accurate record of what was actually done over the
entire thirteen year period: a reference guide to policies, spending
and output, including historical and international comparisons where
available.
• Evaluate Labour’s policies and spending in terms of their impact on
social and economic outcomes.
What we do not do is:
• Assess Labour’s overall macro-economic policy or comment on its
role in the evolution of the world financial crisis that unfolded in
2007/08.
• Engage in detailed analysis of Labour’s management of the public
finances – its general taxation and borrowing policies for example.
• Debate the direction of social policy now, given the different scenario
the country faces.
In other words we concentrate on social policies, evaluating them in the
context of the possibilities and constraints open to the government at the
time. We will take the same approach to the Coalition’s social policy record
in 2015.

11
Other intentions, boundaries and limitations should also be transparent: First
we take it as read that a more equal distribution both of opportunities and
outcomes is an implicit goal of social policy, and therefore evaluate the
government in these terms as well as in relation to its more specific
objectives.
Second, when looking at the government’s explicit objectives, we focus on
declared objectives as indicated by manifestos, policy documents and
speeches. Policies are contested within parties, and governments rarely
take office with agreed programmes that remain unwavering and
unchallenged throughout. However we need to summarise policy objectives
relatively simplistically in order to have something to evaluate against.
People wanting an account of the politics and policy-making of the Labour
period should refer to other texts (e.g. Rawnsley 2001; 2010)
Third, we do not cover all areas of social policy4. We focus on those that
absorb most public spending – social security (including pensions and
policies to reduce child poverty), health and education, as well as a relatively
new spending area that Labour made a priority – children under five – and a
smaller spending one, neighbourhood renewal, which specifically addresses
the question of spatial inequality and concentrated poverty.
Fourth, we focus primarily on England, because in most of the areas we look
at, policy is devolved to the constituent nations of the UK. Resources do not
permit full four-country comparative studies, so we focus on Labour in
England, which covers 80 per cent of the UK population. Key policy
differences between England, Scotland, Wales and Northern Ireland that
emerged over the decade since devolution are highlighted.5 Funding from
the Trust for London enables us to report separately elsewhere (Lupton et al.
2013) on the position of London.
Fifth, this document is itself a summary. It draws from much more detailed
papers on the specific policy papers, including illustrative examples but by no
means providing complete coverage. Readers interested in further facts,
figures and analysis are strongly recommended to refer to the more detailed
papers themselves.
4Employment policy and
higher education are covered to some extent here and will be treated more fully in the next round of the research, when housing will also be included.
5A specific paper
comparing neighbourhood renewal policies in the four nations from 1997 to 2012 is also forthcoming. In the next phase of the research we hope to extend cross-country comparisons as the four countries of the UK are now all governed by different parties.

12
Chapter 2: What Labour Inherited and Aimed to Do
Labour’s Inheritance
From the current standpoint, with concerns about faltering economic
recovery and high levels of national debt dominating political debate, the
scale of the social policy challenge that Labour took on in 1997 is easily
forgotten. That situation was documented in detail by Stewart, Sefton and
Hills (2009) and we draw on their account here, without repeating references
to their original sources.
During the 1980s and early 1990s, industrial restructuring, global competition
and technological and social change had placed low-income households and
communities at particular risk. High long-term and youth unemployment,
increasing earnings inequality and an increasing polarisation between
households with two earners and those with none created the conditions for
long term labour market disengagement, child poverty and social exclusion,
and for acute social problems in the industrial neighbourhoods of Scotland,
Wales, Northern Ireland and the North and Midlands of England as jobs and
population declined. In the face of this restructuring, benefits had been
made less generous with the aim of reducing welfare dependency, while
taxes on top incomes were cut in order to reward high earners and there was
an increasing reliance on indirect taxes, which by their nature hit the poorest
hardest. Spending restraint led to low public investment in the physical
stock (social housing, schools, hospitals, health centres and community
buildings), and in the public workforce. In relative terms, public sector pay
was allowed to fall significantly, with nurses, teachers and manual workers
hardest hit, contributing to low morale, staff shortages and high rates of staff
turnover. At the same time, a partial privatisation of delivery of state services
had begun, with quasi-markets in health and education, and actual
privatisation in many local government services, leading a reduction in the
numbers of front line workers and arguably to a degree of fragmentation as
multiple providers delivered services in the same local authority areas.
By 1997, public spending as a percentage of national income (Gross
Domestic Product or GDP), at 39.5 per cent, was at a historic low, at levels
not consistently seen since the mid 1960s (Chote et al. 2010a). It was also
low by international standards. The UK stood as the 14th lowest spender out
of the EU 15 countries6 and 22nd of 28 OECD countries.7 Rankings do not
tell the whole story here as the disparities between countries were wide.
The bottom of the EU 15 countries, Ireland, was fully 24 percentage points of
GDP below the top, Sweden. The UK was 20.7 points below.
Cuts to public spending had contributed to balancing government current
income and expenditure and reducing debt. Public sector net debt, which
was falling anyway, almost halved during Mrs Thatcher’s administration, to
6 Sweden, Denmark,
Finland, France, Austria, Belgium, Italy, Germany, Netherlands, Greece, Portugal, Spain, Luxembourg, the UK and Ireland.
7 The above plus Hungary,
Slovakia, Norway, Poland, Canada, Czech Republic, New Zealand, Iceland, Australia, Japan, Switzerland, the US and South Korea.

13
26 per cent of GDP in 1990-91. The UK current structural budget deficit had
fallen to one per cent of GDP by 1988-89. However, low investment and
large-scale privatisations had also ended the rise in the value of public sector
assets, while liabilities rose (Hills 2005).
At the same time, levels of both poverty and inequality had also risen to
levels unprecedented in post-war history. Figure 1 shows the step change
upwards in both that started in the mid-1970s and accelerated during the
1980s. Unlike every other post-war decade, in which the benefits of
economic growth had been shared across economic groups, the gains of the
1980s disproportionately benefited the rich at the expense of the poor (Hills
2004). The scale of the change in the 1980s was such that even after some
stabilisation during the 1990s, the proportion in poverty (expressed in relative
terms as 60 per cent of the median income) remained almost twice as high in
1996/7 as it had been at the start of the 1960s. Inequality (measured by the
conventional Gini coefficient) was also at record levels. By international
standards, the UK performed very badly on both measures. Its increase in
inequality during the 1990s was the highest of ten comparable industrialised
nations with available data8, and left it more unequal than any of these
countries except (by a small margin) the US. A comparison of child poverty
in 15 Organisation for Economic Co-operation and Development (OECD)
countries placed the UK third from bottom, with only the US and Italy having
a higher percentage of children living in relatively poor households in the
mid-1990s (UNICEF 2000).
Figure 1: Trends in Poverty and Inequality 1961-1996/7
Source: IFS Poverty and Inequality Spreadsheet, Calculations based on Family Expenditure Survey up to
and including 1992 and Family Resources Survey thereafter. Poverty figures are calculated after housing
costs, with poverty defined as household income less than 60 per cent of contemporary national median.
Gini Coefficient relates to GB throughout. Poverty figures are for GB up to and including 2001/02 and for
UK thereafter.
0.0
0.1
0.1
0.2
0.2
0.3
0.3
0.4
0.4
0%
5%
10%
15%
20%
25%
30%
19
61
19
63
19
65
19
67
19
69
19
71
19
73
19
75
19
77
19
79
19
81
19
83
19
85
19
87
19
89
19
91
19
93-9
4
19
95-9
6
Gin
i Coe
ffici
ent o
f Ine
qual
ity
% o
f Pop
ulat
ion
in P
over
ty
% of totalpopulationin poverty
Ginicoefficient
8Sweden, Norway,
Germany, the Netherlands, Australia, Canada, France, the US, Switzerland and Spain (see Hills et al 2009). Subsequent OECD data, including twenty-four countries from the mid 1980s to mid 1990s, confirms this picture of high inequality growth – the UK was sixth out of twenty-four (cited in Hills et al 2010)

14
Socio-economic inequalities in other outcomes remained persistent, in those
areas that we can measure – life expectancy, infant mortality, and smoking.
The phenomenon of ‘social exclusion’ – the co-occurrence of multiple
problems such as low educational attainment, poor employment prospects,
poor mental and physical health, poor housing and neighbourhood
environments and increased risk of crime (both participation and
victimisation) – was increasingly recognised in the late 1990s. Spatial
inequalities appeared to be widening, both on a regional level as London and
the South East gained from economic restructuring and industrial regions
suffered, and at a local level as problems spiralled in low income
communities.
By the time Labour was elected, a majority of the British electorate was in
favour of increasing public spending and of more redistribution towards
poorer members of society. In 1997, 65 per cent of respondents in the
British Election Study were in favour of either increasing taxes and spending
more (31 per cent) or increasing taxes and spending a lot more (34 per cent).
In the British Social Attitudes Survey in 1996, fully 90 per cent wanted more
spending on health, 82 per cent on education, 76 per cent on old age
pensions, and even one-third on unemployment benefits (Sefton 2009). This
despite the fact that the recession of the early nineties had reversed the UKs
healthy financial position, leaving debt at 42.1 per cent of GDP and a
structural deficit of 2.2 per cent of GDP (worse than at any time since 1975)
by the time Labour took office. In fact, the new government characterised its
financial inheritance as “a large structural deficit, low net investment, rising
public debt and falling public sector net worth” (HM Treasury 1999, p7.)
What the incoming government did have in its favour, however, as well as
strong public support for increased social spending and a huge electoral
majority, was a strong underlying economic situation with relatively fast
growth, relatively low inflation and falling unemployment, as well as a firm set
of tax and spending plans put in place by the Conservatives to restore the
balance of the economy (Chote et al. 2010b). It inherited historically and
internationally low public spending and unprecedented poverty and
inequality, but a favourable set of conditions to do something about it.

15
Labours Aims and Goals
Labour articulated two sets of social policy goals in response to this situation.
One related to outcomes – what the state’s social spending should be aiming
to achieve; the other related to delivery – how the public sector should be
run.
In relation to outcomes, the government set out both to raise population-wide
outcomes and to close socio-economic gaps. Table 1 shows these high-
level statements, as they were made in the 1997 Labour election manifesto
and/or in the early Public Service Agreements (PSAs) that were introduced in
the 1998 Spending Review, and/or in other key announcements in Labour’s
first term.
Table 1: Labour’s Outcome Goals
Policy Area Aims Poverty and Inequality To end child poverty forever (over a 20-year
period). To reduce it by a by a quarter by
2004, and by half by 2010.
To end pensioner poverty.
The Under Fives To ensure a more equal starting point for all
young children –
“An inclusive society, where everyone has an
equal chance to achieve their full potential”;
“to make sure that all children are given the
best chance in life.”
Health To improve overall population health
outcomes. To reduce health inequalities
Education To raise achievements overall and to reduce
inequalities “To give everyone the chance
to realise their full potential and build an
inclusive and fair society and a competitive
economy”
Deprived Neighbourhoods and Spatial Inequalities
That no-one should be seriously
disadvantaged by where they live
(within 10-20 years)
Source: 1997 Labour Manifesto and key speeches and policy documents 1997-2001
The most striking thing that emerges from this table is the scale of Labour’s
social justice ambitions. Although many people would have liked the
government to go even further, some of these were extremely challenging
goals – for example to reduce child poverty by a half, and so thoroughly
address neighbourhood inequalities than within a decade or two years no-
one should be seriously disadvantaged by where they lived. Early policy

16
formation was marked by the creation of whole new areas of coordinated
central government activity in the emphasis put on the under fives, social
exclusion and the poorest neighbourhoods (Hills, Sefton, and Stewart 2009;
Eisenstadt 2011). The intention was to do things that were radically different
and to achieve a step-change in levels of socio-economic inequalities, not
merely to make incremental progress.
That this was to be achieved at the same time as making substantial general
social and economic progress and gaining ground on other countries made it
all the more challenging. In one respect, these objectives can work in
tandem. Direct interventions to benefit the most disadvantaged in society can
drive an improvement in a country’s overall performance, and may reduce
also inequalities between people at the bottom and the middle of the
distribution. However, inequalities may also increase during times of
economic growth and expansion of universal services. This partly because
some outcomes (most notably poverty) are measured in relative terms.
Rising median incomes in a period of growth mean that measures aimed at
the poorest households have to work hard to keep them in the same relative
position.9 More substantively, as living standards generally rise and
services improve or expand, it is often those who are best placed to take
advantage who tend to benefit most. For example, it was middle class
children who benefited most from the rapid expansion of higher education in
the 1980s and 1990s, and from the Conservative government’s Assisted
Places Scheme (Edwards and Whitty 1997). New guidance and research on
good nutrition and healthy behaviours is more likely to be absorbed and put
into practice by educated people with high disposable income, leading to
greater gains in life expectancy, than it is by people who are poorly educated
and on constrained budgets, as the 1998 Acheson report into health
inequalities demonstrated (Acheson 1998).
Early on, Labour said little about income inequality overall, as opposed to
improving the living standards of the poorest or creating greater equality of
opportunity. The word ‘redistribution’ was studiously avoided until well into its
second term. The government also seemed particularly unconcerned with
the position of the very rich. Indeed famously Tony Blair said in a Newsnight
television interview that:
“The issue isn’t in fact whether the very richest person ends up
becoming richer. The issue is whether the poorest person is given
the chance that they don’t otherwise have … the justice for me is
concentrating on lifting incomes of those that don’t have a decent
income. It’s not a burning ambition of mine to make sure that David
Beckham earns less money.”10
The 1997 Manifesto made an explicit pledge not to raise top rates of income
tax. However the language did begin to change with the 2006 Equality Act
putting a duty on the newly established Equality and Human Rights
9 By the same token, in a
recession, relative poverty
can reduce because
median incomes fall and
those at the bottom of the
income distribution who are
supported by welfare
payments find themselves
in a slightly better position
relatively. 10
Quoted in Bromley
(2003) p74.
17
Commission to monitor inequality outcomes in a triennial report. The first
clause of the 2010 Equality Act allowed a power to put a duty on all public
authorities to consider socio-economic inequality in all the important
decisions and actions they took – although this was not subsequently
implemented. In 2008 the government also established an independent
National Equality Panel to review the evidence on economic inequalities.
Alongside these outcome goals, Labour also had a second set of ambitions,
relating to democracy and public management. One element of this was its
commitment to devolution, with referenda on devolved powers taking place in
Scotland and Wales in the autumn of 1997 and Northern Ireland in 1998.
Until 2007, Labour was the majority party in Scotland and Wales, although
governing in coalition for most of the time. The Northern Ireland Assembly
was suspended for much of the period between its inauguration in 2000 and
2007. Arguably it is not until 2010 (and particularly since 2011 with the
election of a SNP majority in Scotland) that we would expect to see major
policy differences across the UK, with different parties in power in each
country. Nevertheless some differences did emerge during Labour’s rule in
England, and we point these out in the next section. Labour also proposed
the creation of regional assemblies and regional development agencies,
Another element was Labour’s commitment to public service reform. In
England, the Labour 1999 White Paper, ‘Modernising Government’ set out a
ten-year reform programme to achieve modern, high quality, efficient and
responsive public services (Cabinet Office 1999). Much of the Conservative
New Public Management (NPM) project was retained: a focus on results;
targets and performance indicators, league tables, costing and market
testing activities to obtain value for money; the purchaser/provider split; and
the idea of the service user as customer or chooser. However Labour put
more emphasis on creating structures for long term improvement. It
particularly emphasised continuous improvement within organisations
(through self-assessment, inspection, benchmarking, the development of
better leadership and the valuing of public service) and a ‘joined-up’
approach, with policy coherence across government and a strong emphasis
on partnership rather than single agency ‘silos’ for planning and delivery.
“Information Age government” was also a key theme.
Labour presented this reform agenda as non-ideological - “pragmatic rather
than dogmatic” - and thus entirely compatible with, and indeed a central
component of, the delivery of its social justice agenda. “What counts”, the
Labour 1997 Manifesto stated, is “what works” (Labour Party 1997).
However, it clearly reflected an implicit ideology of governance - about the
appropriate size and functions of the state; responsibilities of different tiers of
government; structures for democracy and representation, for example.
This neither was nor is universally shared, as illustrated by the different paths
taken by the devolved administrations over the same period, and the

18
Coalition in England at present. Moreover, “what works” is itself a contested
approach, because it tends to privilege short term measurable outcomes and
the ‘interventions’ that deliver these. ‘Ends’ are emphasised over ‘means’.
Many people argue that ‘means’ are just as critical to social justice as short-
term ‘ends’. Indeed the wrong choice of means may achieve desired short-
term outcomes (i.e it may “work”) but in the long run be detrimental to the
kind of society ultimately desired, because it redefines the objectives of and
underlying relationships within public services in ways which make the
achievement of desired social outcomes more rather than less difficult (Ball,
2003a, Sandel 2012).
To assess Labour’s record adequately, therefore, we need to consider not
only what was achieved over the lifetime of the administration in terms of
outcomes, but what changed in the organisation and delivery of public
services, with the potential to affect outcomes in the lifetime of future
parliaments.

19
Chapter 3: What Labour Did
An Overview
In the papers that underpin this report, we set out in detail the actual policies
pursued in each policy area, showing how policy agendas evolved over time,
and the key ways in which divergences developed between England and the
devolved nations. Table 2 gives a very brief summary – an overview of what
Labour did - in England. Here we group these under five key types of
approach. First, the emphasis on work as the way out of poverty. Second,
cash transfers which aimed to reduce poverty directly by putting more money
in the pockets of the poor. Third, the expansion of public services generally.
Fourth, the targeting of extra policies and resources towards disadvantaged
areas. Fifth, reforms of service delivery, designed to improve public sector
performance generally and particularly in the poorest areas where it was
weakest. At the end, we look across policy areas to analyse cumulative
effects.
From Welfare to Work : Employment as the Route out of Poverty
Labour’s emphasis on work as the best way out of policy was a dominant
theme – shaping what was done not just in employment policy but in the area
of welfare benefits.
Many of the government’s policies were directed at the supply side of the
Labour market (addressing deficits in skills and employability, matching
people to jobs, and making it harder to claim out-of-work benefits). One of its
first acts was to initiate ‘New Deal’ welfare-to-work programmes for the
young unemployed, lone parents, long-term unemployed, and partners of the
unemployed. Employment Action Zones were initiated in high unemployment
areas, kicking off a series of area-based initiatives aimed at reducing
‘worklessness’. These culminated in the Working Neighbourhoods Fund in
2007, which replaced a much broader Neighbourhood Renewal Fund and
required local strategic partnerships to focus neighbourhood-level
interventions much more strongly on getting people into employment. In
Scotland, the New Deals were supplemented with programmes for ex-
offenders, substance abusers and lone parents with complex needs, and in
Wales with extra help for claimants of Incapacity Benefit.
There was a particular focus on getting parents into work (see Stewart 2013
for a fuller account). As well as the New Deal for Lone Parents, Labour
introduced a National Childcare Strategy to improve the availability and
affordability of childcare. This included funding for a Neighbourhood
Nurseries initiative and also demand-side funding through a childcare
element of Working Tax Credit: working families on lower incomes could
claim back up to 80 per cent of the cost of a registered childcare place. An

20
Table 2: Labour’s Key Policies
Cash Transfers and Poverty • National Minimum Wage
• Welfare-to- Work programmes (New Deals)
• Tax Credits (linked to earnings, loaded towards families)
• Increases in Child Benefit
• Investments in childcare
• Increase in Income Support for pensioners and extra benefits e.g. winter fuel payments,
• More generous second state pension for low earners.
• Abolition of mortgage tax relief and Married Couples Tax Allowance. Rise in National Insurance
contributions
• Reduction in basic income tax rate, and increase in top tax rate (latter only from 2010/11)
The Under Fives• Child Benefit, Tax Credits (as above)
• Extension of free part-time nursery education to all three and four year olds
• National childcare strategy
• Sure Start – integrated health, early education, play and parental support
• Extension of parental leave and pay
• Introduction of an Early Years Curriculum
Health• More capacity - (extra beds, staff, buildings, activities).
• New NHS buildings programme.
• National frameworks for quality standards.
• Structural reorganisation: establishment of Primary Care Trusts/Foundation Trusts/Strategic Health
Authorities. Payment by results. Patient Choice.
• More emphasis on public health: e.g smoking ban, more screening
Education• Increase in school workforce: extra teachers and support staff
• New school buildings programme
• National strategies to improve quality and consistency of teaching
• Performance management: targets and school closures
• Curriculum change: introduction of more vocational options at GCSE
• Structural reform: specialist schools, Academies, Trust Schools, extended schools
• Wider agenda for childhood: Every Child Matters
• Guaranteed post-16 learning place and Educational Maintenance Allowance
• Reform of higher education funding – variable fees, financed by income-contingent loans
Deprived Neighbourhoods and Spatial Inequalities• National Strategy for Neighbourhood Renewal
• Housing Market Renewal and Decent Homes programme
• New Deal for Communities
• Targeted programmes across other spending areas eg Spearhead areas in health, Excellence in
Cities in education, Sure Start

21
In-Work Credit provided a £40 a week bonus to lone parents in their first year
back in work.
There was perhaps less intervention on the demand side (tackling wage
levels and structures within firms and the drift to short-term and part-time
contracts as firms sought to drive down labour costs and maximise flexibility).
One obvious exception to this was the introduction in 1998 of a National
Minimum Wage (NMW) for the first time in the UK. Labour also introduced
‘family friendly’ policies: major changes to parental leave and pay, and rights
to request flexible and part-time working, partly to support child development,
but partly to make it easier for mothers to remain attached to the labour
market after having children (Lewis 2009; Stewart 2013).
At the same time, being out of work got tougher, as Job Seekers Allowance
was linked to prices not earnings, meaning that its relative value decreased
during the period of real earnings growth 1997-2003, and as the conditions
for receipt of working age social security benefits were gradually toughened.
Lone parents were required to seek work when their children were five,
rather than sixteen as formerly. In 2008, new claimants for Incapacity
Benefit or Income Support (on the basis of incapacity to work) were moved
onto a new benefit, the Employment and Support Allowance, which
introduced a ‘work capability assessment’.
Regional Development Agencies were established to promote economic
development. This was a substantial break from traditional regional policy –
it pushed more responsibility from central government to the regions,
emphasised indigenous development rather than inward investment, and
presented the role of government as supporting markets rather that
intervening directly through large scale infrastructure projects and
government job relocation (Fothergill 2005). However, the RDAs in the
poorer regions did get more funding and there was an explicit target that the
gap in growth rates should decline. Several programmes were initiated to
stimulate employment in low-employment areas, including a Local Enterprise
Growth Initiative (LEGI) and the larger-scale Urban Regeneration Companies
(URCs).
Cash Transfers
As Hills (2013) points out, Labour was keen to emphasise that it saw
employment, education, skills and health as more fundamental to its poverty
reduction strategy than cash benefits. However, benefits and tax credits
were an integral part of the approach. Efforts were targeted at families with
children and at pensioners, not at working age families with no children.
Labour adopted a ‘progressive universalist’ approach i.e. many households
benefited but the poorest benefited most.
22
The main reforms affecting children came in two stages in Labour’s first two
terms. In 1999, the rate of Child Benefit was increased for the first child in
each family, the existing Family Credit was replaced by a more generous
Working Families Tax Credit (WFTC), and there were more generous
allowances for younger children in Income Support for workless families. In
2003, this system was reformed again, becoming part of the income tax
system. WFTC was split into a new Child Tax Credit (CTC), which also
incorporated the old Income Support child allowances, and a new Working
Tax Credit went to low paid workers regardless of whether they had children.
Importantly these benefits were uprated in line with earnings, not just prices.
Although CTC included a ‘family element’ (replacing married couples’ income
tax allowance), for which some 90% of families were eligible, the per-child
element was highly progressive, targeting most support to those at the
bottom of the distribution, including those not in work at all or working part-
time on low wages.
While almost all households with children benefited from Labour’s tax-benefit
changes, the position of families with younger children was privileged in
several ways. Most importantly, CTC treated all dependent children under 18
alike, where previously rates had been lower for children under 11, and this
led to a significant boost in the relative incomes of younger families during
Labour’s first term (Gregg, Waldfogel, and Washbrook 2006). In addition, the
family element of CTC was doubled during a child’s first year, while a one-off
Sure Start Maternity Grant payment of £500 was introduced for mothers on
low incomes. From April 2009, Child Benefit was extended to pregnant
women in the third trimester. Adding these and other smaller benefits
together, spending in cash benefits to support children under five increased
by approximately £1,600 per head (in 2009/10 prices), averaged over all
children, more than double what it was in 1997 (Stewart 2013).
Pensioners were the other main group targeted11. Again, the reforms for
existing pensioners came in two stages. Following a Green Paper in 1998,
Income Support for pensioners was separated off to become the ‘Minimum
Income Guarantee’, with its value increased in real terms and then linked to
earnings. This means-tested support was further reformed in 2003, with the
minimum becoming the ‘guarantee credit’ of Pension Credit. This included
an additional means-tested element for those with incomes just above the
minimum, the ‘savings credit’ - designed to reduce the number of pensioners
facing a 100 per cent withdrawal rate on small amounts of retirement income.
The basic pension was not increased, but a number of new concessions
were introduced, all on a universal basis, including Winter Fuel Payments,
free TV licences for the oldest pensioners, and concessionary or free bus
travel.
There were also reforms to general taxation to make it more progressive,
although many of Labour’s critics on the left would have preferred to see
these go much further. Two major income tax allowances – for mortgage
11We concentrate here on
changes that would have
affected the cash incomes
of current pensioners.
However, it is worth noting
that Labour also reformed
the structure of the pension
system to affect the
incomes of future
pensioners. The 2007 and
2008 Pensions Acts
returned the basic pension
to earnings-linked
indexation, widened rights
to it and introduced
‘automatic enrolment’, with
minimum contributions from
employers and employees.
They also announced future
increases in pension age.
These reforms may well be
one of Labour’s biggest
legacies to the tax and
benefit system.

23
interest and for married couples – were finally abolished (with parts of the
latter absorbed into the tax credit system and with pensioner couples
protected), and the main rate of National Insurance Contributions was
increased in 2003 with the proceeds advertised as being earmarked for
increased spending on the NHS. Direct taxes were reduced to some extent
for those on low incomes. An initial move had been to reduce the starting
rate of income tax to 10 per cent, with much made of its positive effects on
the low-paid, but this ‘10p band’ was removed in 2008 at the same time as
the main rate was cut to 20 per cent. The combination of the two left some
low earners who were not entitled to (or did not receive) tax credits as losers,
even after an emergency increase in the general level of tax allowances the
following Autumn (Hills 2013).
Expanded Public Services
A third major element of policy was the expansion of activity and resources in
the public sector: both the better resourcing of existing services and the
addition of new ones. Much of this happened from 2001 onwards. Given
the size of the deficit it inherited, Labour stuck to Conservative spending
commitments in its initial two years, meanwhile piloting initiatives and
developing strategy. The big increase in activity came in the second term.
In health, Labour initiated a major programme of investment and reform
including a new NHS buildings programme, and extra nurses and doctors.
Efforts were concentrated on cancer, heart disease and stroke, and on the
reduction of waiting times for appointments and treatment (Vizard and
Obolenskaya 2013).
There was a major expansion of early education (Stewart 2013). From
1998 all four-year olds were give the right to 12.5 hours per week free early
education for 33 weeks of the year. This was extended to three-year olds in
2004. By 2010 free provision had been extended to 15 hours per week for
38 weeks per year. By 2010, 98 per cent of all four-year olds and 92 per
cent of eligible three-year olds received at least some free early education
although a significant proportion of the extra money funded places for
children who were already attending a pre-school educational setting. But the
high take-up rates suggest that the policy was more successful than
childcare subsidies in drawing children from disadvantaged backgrounds into
early education. In 2010, it was estimated that 76 per cent of three-year olds
from the most disadvantaged households and 95 per cent of four-year olds
were making use of the free places provided. Childcare was also expanded.
The number of centre-based childcare places had increased by a third over
the period 1997 to 2008. However, the number of registered childminders
declined somewhat, in part to do with widening alternative employment
opportunities for women, including in schools and centre-based provision.
By 2010, 59 per cent of children aged 0-2 were receiving some form of non-
parental care, and 39 per cent were attending formal (paid) care. This

24
compares with 25 per cent receiving formal care in 1997. However, the most
disadvantaged families made relatively little use of formal care (15 per cent).
Sure Start probably represents the biggest change in early years provision –
an entirely new programme of integrated health care, parental support,
childcare, play and early education – delivered first through 250 local
programmes but eventually rolled out to 3,500 Sure Start Children’s Centres,
many of them purpose-built buildings.
The compulsory education system received 48,000 extra FTE equivalent
teachers (11.9 per cent) and the number of support staff more than doubled,
with over 133,000 extra teaching assistants and 96,000 extra other support
staff. A new school buildings programme, Building Schools for the Future
(BSF), designed to replace or upgrade the entire stock of secondary school
buildings within 15 years, was launched in 2004. By 2010, over 150 new
schools had been completed with over 450 more well underway. The
Academies programme, initially with private sponsors contributing to capital
costs, also contributed to the provision of around two hundred new schools in
some of the country’s poorest neighbourhoods. ICT in schools was
progressively upgraded, with interactive whiteboards and networked
computers becoming a feature of many classrooms and teachers being given
laptops in order to access and use curriculum materials via the internet. As
all schools were encouraged to become extended schools, there was a
major expansion of pre- and after- school activities, ranging from breakfast
clubs to homework clubs, sports, arts and music (Lupton and Obolenskaya
2013).
Much more detail of these policies and others is given in our detailed papers.
The sheer volume of new policy programmes makes counting all the extra
provision almost impossible. Probably the best overview comes from the
Office for National Statistics, which produces estimates of the volume of
inputs into public services: divided into labour inputs; goods and services
such as medicines, supplies and the costs of maintaining premises; and
capital services.12 These are cost estimates (numbers of inputs multiplied
by unit prices). The numbers are shown in the form of an index, with 1997
set at 100.
ONS’s calculations show that in health the overall volume of inputs rose by
86 percentage points over the period, with labour inputs up 43 points, and
goods and services by 179 points. Capital consumption grew by 32 points
between 1997 and 2004 before declining between 2004 and 2010, with a
four percentage point fall over the period as a whole. The main driver of the
growth in goods and services was non-pay costs in hospitals and community
health services: drugs and other clinical supplies and equipment and running
costs of premises. Growth in the volume of qualified nursing and related
staff contributed most to the growth in labour inputs, but there was also
12Capital services or capital
consumption reflects the
amount of capital used
each year and is made up
of depreciation and other
capital charges.

25
significant growth in the numbers of consultants and registrars and other
qualified health professionals.
In education, input growth was lower but still up by over a third (35
percentage points). Labour inputs grew by 16 points, capital services by 59
points and goods and services by 85 points, although note that labour makes
up by far the biggest share of education expenditure.
Figure 2: Estimated Change in Volume of Public Services Inputs 1997-2010
Sources: Author’s calculations using Massey, F.( 2012 a and b)
These extra inputs translated into similarly substantial increases in outputs.
The relationship of outputs to inputs was up by 6.2 per cent in health and 4.5
per cent in education over the Labour period (ONS 2013), a scale of change
that ONS characterises as broadly constant. In health, indirect (expenditure
based) estimates of volume growth suggest that there was a major increase
in service provided even when NHS specific wage costs and inflation are
taken into account. According to official ONS (direct) estimates, the volume
of publicly financed healthcare output grew by 87.7 percentage points
between 1997 and 2010. The biggest growth in output was in GP
prescribing activities (up 205 percentage points. There was a 57.5
percentage point increase in hospital inpatient, day case and outpatient
episodes, and but GP and practice nurse consultations, and publicly funded
dental and sight tests also increased in number (43 percentage points), all
more so than the overall population and the overall elderly population (taking
this as an indicator of health need).
0
50
100
150
200
250
300
Labour CapitalServices
Goods andServices
Labour CapitalServices
Goods andServices
Health Education
20
10
In
de
x V
alu
e (
19
97
=1
00
)

26
Waiting lists and waiting times improved dramatically. The number of
inpatients waiting for treatment for more than 13 weeks in England peaked at
approximately 0.7 million in 1998 but had fallen to half a million by 2001. By
December 2008, 93 per cent of hospitalised and 97 per cent of home-based
patients were referred to treatment within 18 weeks. The number of GPs
increased, from around 60 per 100,000 in 1997 to over 75 in 2010. The GP
patient experience survey figures for 2007 suggest that 86 per cent of
patients had seen their GP within 48 hours, a figure that fell in 2009/10 to 80
per cent.
In education, the main quantifiable impact of the extra investment in school
staffing was a big reduction in staffing ratios. The average primary school
pupil in 1997 experienced a teacher to pupil ratio of 1:23 and an average
class size of 27.7. By 2010 these numbers had fallen to 1:21 and 26.4,
respectively. The decline in the secondary sector was smaller, because the
number of pupils was rising at the same time as the number of teachers, and
class sizes were smaller to begin with. Nevertheless, teacher to pupil ratios
fell from 1:17 to 1:16 and the average class size in secondary schools fell
from 21.7 in 1998 to 20.5 in 2010. Changes in adult to pupil ratios fell even
more, because of the large increase in numbers of support staff. In primary,
they fell from 1:18 to 1:11, and in secondary from 1:15 to 1.10. What was
happening away from the average is also of interest. Qualitative evaluation
indicates that the most disadvantaged or lowest attaining pupils started to
receive more small group and one-to-one tuition, as well as additional help
from other support staff (such as mentoring, counselling and behaviour
support and family liaison), although these changes appear impossible to
quantify at a system level.
Table 3: Pupil:Teacher and Pupil:Adult Ratios in Primary and Secondary Schools
1997 2002 2007 2010 Primary schools Pupil Teacher Ratio 23.4 22.5 21.8 21.3
Pupil Adult Ratio 17.9 14.6 12.4 11.4
Secondary schools Pupil Teacher Ratio 16.7 16.9 16.5 15.7
Pupil Adult Ratio 14.5 13.3 11.4 10.4
Source: DCSF/DFE School Workforce in England Statistics
Targeting of Disadvantaged Areas
Alongside general expansion, Labour pursued a distinctive strategy of
targeting additional funding and services towards the poorest local

27
authorities and neighbourhoods. Some of this was ‘catch-up’, with the goal
of equalising services and bringing conditions in all neighbourhood up to a
minimum standard. Poor services and conditions, it was argued, made it
worse to be on a low income, and “people on low incomes should not have to
suffer conditions and services that are failing and so different from what the
rest of the population receives”(SEU 2001, p8). Partly it was an attempt to
provide extra services to the most disadvantaged individuals in order to close
long-standing gaps in outcomes.
The most visible articulation of this approach was the National Strategy for
Neighbourhood Renewal (NSNR), introduced in 2001, which introduced a
new way of addressing the problems of low income neighbourhoods and of
reducing spatial inequalities. Whereas previous governments, both Labour
and Conservative, had relied mainly on additional short-term programmes
(such as the Urban Programme, City Challenge and the Single Regeneration
Budget), Labour attempted to build redistribution of effort into the mainstream
activity of central and local government. NSNR set ‘floor targets’ that no
area should fall below, and committed all spending departments to
programmes that would reduce spatial disparities. The floor targets were
initially described as “the social equivalent of the minimum wage”1,
emphasising the point about levelling up for places as well as people.
A Neighbourhood Renewal Unit (NRU) was established at the centre of
government to coordinate this. Local authorities in the poorest parts of the
country were required to form Local Strategic Partnerships with other
organisations and to develop neighbourhood renewal strategies. These
were backed initially by a Neighbourhood Renewal Fund (NRF) but were
also supposed to explore how regular funding could be ‘bent’ towards areas
of greatest need on an ongoing basis. A major investment was made in
neighbourhood-level statistics and Indices of Multiple Deprivation so that
deprivation could be identified and progress monitored.
This approach, combined with a number of specific, tightly targeted, area
regeneration programmes (particularly the New Deal for Communities
regeneration programme, targeted at just 39 of the poorest neighbourhoods
in England), and some specific initiatives run by the NRU such as
neighbourhood management and warden programmes, meant that a large
volume of new activity was stimulated in the poorest neighbourhoods in
addition to the expansion referred to above.
Some of the inputs came in the form of new programmes from major
spending departments. The initial 250 Sure Start local programmes, for
example, were targeted towards the areas of highest child deprivation. The
initial expansion of childcare established Neighbourhood Nurseries with
government funding in the poorest areas, while start-up loans were given in
other areas. There were Employment Action Zones and later a Working
Neighbourhoods Fund (replacing the Neighbourhood Renewal Fund) to fund
13 NRU website (Accessed
9th March 2012)
http://webarchive.nationalar
chives.gov.uk/2006053009
1128/http://neighbourhood.
gov.uk/page.asp?id=585

28
local supply-side employment initiatives. In health, targets were set to
reduce differentials in health outcomes between the 70 ‘Spearhead areas’
(the authorities with the worst health outcomes and deprivation) and the
England average.
In education, an Excellence in Cities scheme was set up, covering about one
third of secondary schools, followed by London Challenge (later City
Challenge, extending to Greater Manchester and the Black Country). The
new Academy schools were initially introduced to replace ‘failing’ schools in
poor areas. Building Schools for the Future was targeted not to the most
dilapidated school buildings but the most deprived neighbourhoods. ‘Aim
Higher’ was set up to stimulate university entries from traditionally low
participation households and areas. In housing, the Decent Homes
programme was established to bring all social housing (much of it in the
poorest areas) up to a decent standard by 2010, and from 2002 a
controversial Housing Market Renewal programme was set up to restore
sustainable housing markets in areas in the North and Midlands with large
swathes of low value and/or empty housing.
On a smaller scale, there was a wide range of smaller grants and initiatives:
for ‘Cleaner, Safer Greener communities, parks improvement, a street
robbery initiative, and a Safer Stronger Communities Fund, many of which
were incorporated, after 2007, into a single Area-Based Grant. The
Neighbourhood Renewal Fund itself produced myriad local interventions.
Local authorities could spend the money how they saw fit so there was no
standard package. About a third of the money went on housing, environment
and community safety initiatives, 18-20 per cent on education (including pupil
and teacher support and volunteer involvement), 15-16 per cent on health,
11-13 per cent on worklessness, and the rest on cross cutting activities
including community capacity building. Examples included employment
advice and training programmes, youth programmes, support to local
voluntary organisations, credit unions, provision of small business units and
advice, street wardens, neighbourhood policing teams and burglary reduction
projects.
The net result was that more money, in total, was directed to more deprived
local authorities for service provision. Lupton, Fenton and Fitzgerald (2013),
show that in 1998/9 the most deprived fifth of local authorities got about two
thirds more funding per head than the richest fifth of local authorities (68 per
cent for unitary authorities, including London Boroughs and Metropolitan
Districts, and 62 per cent for districts). In 2008/9 the most deprived unitary
authorities got 73 per cent more. For districts the increase was more
pronounced, with the most deprived fifth of authorities getting 83 per cent
more funding than the least deprived fifth. Putting this into real terms (in
2008/9 prices), the most deprived unitary authorities (which provide
education and social services, the two biggest spending areas for local
councils) got on average £460 per resident more than the least deprived at

29
the start, increasing to £758. The most deprived districts got £40 more,
increasing to £65. Most of the increase had occurred by 2005. Vizard and
Obolenskaya (2013) show how changes to the funding formula for Primary
Care Trusts(PCTs) put more loading on disadvantage. However, the
changes were designed to phase in over time. By 2010/11, over half of
PCTs were still receiving more than their target allocations. Richmond,
Westminster, and Kensington and Chelsea topped that list. The PCTs that
were most below their target allocation were Bassetlaw PCT, Barnsley PCT
and Lincolnshire Teaching PCT. From the equity perspective, a key issue
facing Labour at the end of its period in Government was that many of the
PCT’s receiving less than their target resource allocation were designated
‘Spearhead areas’ i.e. exactly those areas where the need to close gaps in
health outcomes had been specifically identified.
Public Sector Reform
A fifth approach was public service reform: Labour’s modernising agenda to
which we earlier referred. Underpinning policies of expansion and targeting,
there were substantial changes in the design of the welfare state and the
ways in which services were planned, delivered and monitored.
Perhaps the most distinctive feature of this was the performance
management machinery Labour established. The top tier of this was Public
Service Agreements (PSAs) which were initiated at the 1998 Comprehensive
Spending Review to set out departmental aims, objectives, targets and
delivery mechanisms – a form of contract with the Treasury showing what
would be done with the money allocated. PSA targets (for example to
increase attainment in schools) as well as other targets attaching to specific
programmes, were passed down the system to lower level bodies,
reconfiguring the central/local relationship. For local authorities, a set of 90
Best Value Performance Indicators (BVPIs) were put in place, monitored by
the Audit Commission. From 2007, the number of PSA targets was reduced
and BVPIs were abolished. Instead local strategic partnerships signed Local
Area Agreements (LAAs) with government, committing themselves to
delivery against targets on a selection of 198 National Indicators (NIs).
This development, which was accompanied by the un-ringfenced Area-
Based Grant, signalled the development of Labour social policy from strong
central direction to greater local autonomy. Many things that were initiated
as centrally directed and financed programmes were now ‘mainstreamed’ as
part of local activity. LAAs were intended to enable joined-up local planning
in response to local needs. A loosening of the central reins was also evident
in some other areas, such as the school curriculum. Nevertheless, local
discretion was limited by Labour’s tight accountability frameworks – not just
targets, league tables, and the National Indicator set but strengthened
inspection and audit frameworks in the form of Ofsted (extended to cover all
early education and childcare), the Care Quality Commission and the Audit

30
Commission. Early Labour documents emphasised the importance of
‘bottom-up’ policy, with local people having a key role in design and delivery,
for example as elected representatives on New Deal for Communities
boards. The stated intention was ‘double devolution’ – to local authorities
and then again to the sub local authority level. However, in some areas
there was evidence of the opposite tendency. For example, Sure Start was
originally established in the form of ‘local programmes’. When it was rolled
out it was in the shape of Sure Start children’s centres run by local
authorities.
Efforts to improve quality in public delivery involved ‘workforce remodelling’,
central guidance and support on good practice, and new incentive structures.
Salaries were increased relative to the private sector in order to attract good
graduates and an element of performance –related pay was introduced for
teachers. Roles were redefined and the number of people in para-
professional and support roles was greatly increased. A new graduate-level
qualification was introduced in early years education (the Early Years
Professional or EYP) and other qualifications were encouraged. Half those
working in childcare (excluding childminders) held at least an Level 3 NVQ
qualification by 2008, compared to 29 per cent a decade earlier. To try to
ensure high quality early years provision in all settings, an Early Years
Foundation Stage Curriculum was introduced.
In education the ‘National Strategies’ established and disseminated guidance
on curriculum and pedagogy and all schools were allocated a ‘School
Improvement Partner’. A new professional qualification for headteachers
(NPQH) was introduced. In health, the Cancer Plan in 2000 was the first of a
series evidence-based national frameworks designed to drive up quality and
embed best practice in health. Measures to strengthen clinical governance
included a new duty on service providers to monitor and improve the quality
of care, whilst treatment cost-ineffectiveness was addressed through the
creation of the National Institute for Health and Clinical Excellence (NICE).
‘Payment by results’ was introduced as part of the commissioning
mechanism between Primary Care Trusts and specialist providers.
Greater cross-government planning and policy was a key ambition,
exemplified perhaps most clearly by the early cross-government Social
Exclusion Unit, Sure Start and the National Neighbourhood Renewal
Strategy, with its cross-government ‘floor targets’. New mechanisms for
multi-agency strategic planning were initiated, including the Regional
Development Agencies with their regional economic strategies but more
often through ‘partnerships’ of various kinds at local level: the new Local
Strategic Partnerships, Joint Strategic Needs Assessments for health, social
care and well-being and Crime and Disorder Reduction Partnerships. Multi-
agency working at the ground level was also strongly emphasised, with aims
including better information sharing, task-sharing, and clear lines of
management and responsibility for individual welfare when many agencies
were involved. Significant examples were local neighbourhood managers,

31
Sure Start teams, and the ‘team around the child’ for the protection of
vulnerable children that was instituted as part of the Every Child Matters
(ECM) approach.
There was a major shift from the ‘old Labour’ approach of monopoly state
provision. Diversity of provision was encouraged, not just from the private
sector but from voluntary and community providers and even individual
philanthropists. Notably the large increase in childcare places was enabled
via childcare subsidies through the Working Tax Credit, which stimulated
growth in the private and voluntary sector, as well as via supply side funding
to disadvantaged areas first through a Neighbourhood Nurseries initiative
and then through Sure Start children’s centres. Businesses, universities and
faith groups were among those sponsoring new Academy schools.
Facilitating service users to exercise choice between providers was a key
goal. Choice was already an entitlement in education. The 2005 Schools
White Paper proposed a wider range of schools, with parents in poor areas
supported by ‘choice advisors’ and the piloting of free school transport to
make choice of schools a more realistic option. In health, according to official
ONS estimates, the volume of healthcare publicly financed goods and
services that were provided by private firms outside the NHS increased by a
factor of five during Labour’s period in office (although goods and services
provided from within the NHS made up the majority of the new provision).
Extending patient choice was a key element of the reform programme, with
patients being able to choose (eventually) any provider meeting NHS
standards, and the right choice being incorporated into the new NHS
constitution. Choice policies brought with them a wider range of
performance metrics - including performance ratings for NHS Trusts
providing acute services.
An increased role for private finance in public capital projects was another
hallmark of the Labour administration, which took on and expanded the
Private Finance Initiative (PFI) that it had criticised in opposition. PFI was
the main mechanism for building new hospitals and contributed about half
the investment in Building Schools for the Future. From the mid 2000s,
private redevelopment of social housing estates into higher density mixed
tenure developments became the main tool for neighbourhood renewal – a
strategy which left many schemes stalled when the financial crash put an
end to much new house building. Greater use of private finance – this time
in the form of increased charges to users – was also a major development in
higher education with the introduction of tuition fees.
Finally, there was a large expansion in the use of information and
communications technology both in operational service delivery (online
services, interactive whiteboards in schools, linked patient records in the
NHS) and in planning and monitoring. Significant investments were made in
administrative data collection, for example the National Pupil Database,
Neighbourhood Statistics and the Indices of Multiple Deprivation and in

32
survey data (such as patient surveys, the Citizenship and Place surveys) to
monitor progress towards outcomes. By the time Labour left office, these
tools were routinely used at all levels of governance.
Significant elements of Labour’s reform agenda were rejected in Scotland,
Wales and Northern Ireland. Perhaps the biggest difference was the
rejection of market reforms and privatisation. In Scotland, the NHS Reform
(Scotland) Act (2004) dissolved NHS trusts and transferred their
responsibilities to Local Health Boards. Similar reforms were subsequently
undertaken in Wales in 2009. The use of Independent Sector Treatment
Centres was gradually withdrawn in both Wales and Scotland and the use of
PFIs was ruled out in Wales towards the end of the period. None of the
devolved nations adopted Academy schools or actively promoted a ‘choice
and diversity’ policy in education. English systems of performance
management, which were partly needed to serve market systems but also
reflected particular central/local relations, and Treasury/department relations.
were also not adopted. The PSAs were an English phenomenon and all of
the other countries moved away from school league tables and did not adopt
the English system of performance ratings in health. Partnerships and
collaboration between government and local organisations were
emphasised, rather than accountability in return for funding. However, this
approach was not entirely absent. In Scotland, for example, Community
Planning Partnerships were required to negotiate three year Regeneration
Outcome Agreements (ROAs) which showed how they were using central
government funds in conjunction with their own resources to achieve agreed
regeneration outcomes. A final difference was that England passed more of
the cost of services onto users in some significant areas. Prescription
charges were abolished for over 60s in England, but altogether in Wales
(from 2007) and Northern Ireland (from 2010). Scotland followed suit in 2011.
In 2008, Scotland also restored free higher education for Scottish students,
removing its previous ‘graduate endowment scheme’ (similar to Labour’s
income-contingent loan scheme in England.
Cumulative Effects on Service Provision
Reporting on individual services in isolation overlooks the fact that many of
Labour’s reforms would have affected the same people. Table 4 attempts to
capture a cumulative effect of programmes on service provision, in many
different service areas, by considering the situation for fictional people of
different ages in 2010 compared with fictional counterparts in 1997.
We make no claim that this table is a complete account of how things
changed under Labour. It reports on services not on incomes, benefits,
employment or earnings. Some service changes that would affected people
of all ages (for example the increase in GP numbers) are not included here,
for the sake of avoiding repetition. Changes in areas we have not covered in
our work, such as transport, policing, housing or social care, are also

33
Table 4: Summary of Differences in Access to and Quality of Services for People in 2010 compared with 1997
Situation in 2010, compared to 1997 A child aged under 5
- More likely to have mother at home for longer in first year - More likely to attend formal childcare setting before age 3 - More likely to access early education from age 3 - Access to better quality childcare and early education, structured around a
play-based curriculum and with more chance of contact with a trained graduate professional.
- Access to more local play sessions, art and singing groups and toy libraries, especially if in a disadvantaged area.
- More likely to have well supported mother with easier access to networks of other parents and to more formal advice and information.
A child age 11
- Would have attended a better funded school with higher staff to pupil ratios, better paid, staff, and more ICT
- Less likely to attend a very low performing school - Experienced increased pressure to meet national attainment targets but
also, by the end of the period, to enjoy a wider curriculum that incorporated mental and physical well-being, participation and enjoyment as goals, alongside educational achievement.
A school leaver aged 16-18
- Would have attended a better funded school with higher staff to pupil ratios, better paid, trained and supported staff, more ICT, an area of specialism, and extended services from 8am to 6pm
- More likely to have attended a newly built or refurbished school - Less likely to attend a very low performing school - Experience more pressure to meet national attainment targets but also, from
the mid 2000s, had access to a wider range of curriculum options and work-based learning
- More likely to have had careers’ advice and support services for young people (via Connexions).
- More likely to have had a learning place after 16 and to access financial support via the Educational Maintenance Allowance if needed, but no less likely to be NEET (not in education, employment or training)
- Slightly more likely to go on to higher education
A working age adult
- If employed, entitled to a National Minimum Wage - If unemployed, more likely to be in an active labour market programme
receiving hep getting back to work, but also with tighter conditionality. - Entitled to longer parental leave, more maternity pay, and to childcare
subsidies, and has right to request flexible and part-time working. - If a low-paid worker, better future pension rights, and can receive more
generous top-ups to pay through tax credits, especially if has children
An adult age over 65
- Additional concessions: Winter Fuel Payments; free TV licences for the oldest pensioners, and free bus travel.
- Possible additional ‘Savings Credit’ payment - Free prescriptions

34
missing. Some changes to the way things were done such as upgrading of
buildings, staff training, support and pay, are more visible than others, and
have been included, while others like investments in data and the
involvement of private sector providers, has been harder to capture.
The table focuses on the experience of the average person, and therefore
does not pick up the effect of targeting towards disadvantaged areas and
individuals, nor the fact that some people would have seen less progress in
service access and quality in the areas where they lived. These details, and
the detailed quantification of the changes, can be found in the specific
papers that underpin this overview. However the table does give an
indication of the ways in which increased spending on services, including the
creation of new services, would have impacted in multiple ways on the same
individuals. It suggests a positive story of better experiences.
Hard evidence of people’s perceptions of what got better or worse is hard to
come by. Such as there is also tells a positive story. Data from the British
Social Attitudes Survey point to a trend of sustained increases in overall
satisfaction with the NHS during Labour’s period in power. The run up to the
1997 General Election was characterised by low and declining levels of
satisfaction (with satisfaction levels running at less than 40 per cent). The
trend of declining satisfaction reversed after Labour came to power in 1997,
although satisfaction levels fell back between 1999 and 2001. After 2001,
with resources and capacity expanding and waiting lists and times falling,
satisfaction with the NHS began to rise again, with 70 per cent of
respondents indicating that they were quite or very satisfied with the way that
the NHS was run in 2010. Patient experience scores remained high and
stable.
The British Social Attitudes Survey is less useful for education, since only a
section of the population uses schools and few would have had two children
experiencing the same phases of schooling thirteen years apart. Overall,
between 1998 and 2008, there was an increase from 20 per cent to 25 per
cent of people saying they had ‘a great deal of confidence’ in schools/the
education system. This was achieved at the expense of people having
‘some confidence’, while the numbers with no confidence remained the
same.
Inspection data give another indication of quality, although due to a change
in the Ofsted inspection framework from 2005/6 it is impossible to compare
the numbers of schools deemed ‘failing’ after this date with those before.
Moreover Ofsted changed its approach in 2009/10, inspecting more
frequently those schools deemed to be at risk than those deemed to be
doing well. Unsurprisingly, a higher proportion of schools inspected were
deemed inadequate. The period from 2005/6 to 2008/9 (before the new
framework) saw a halving of the percentage of secondary schools deemed
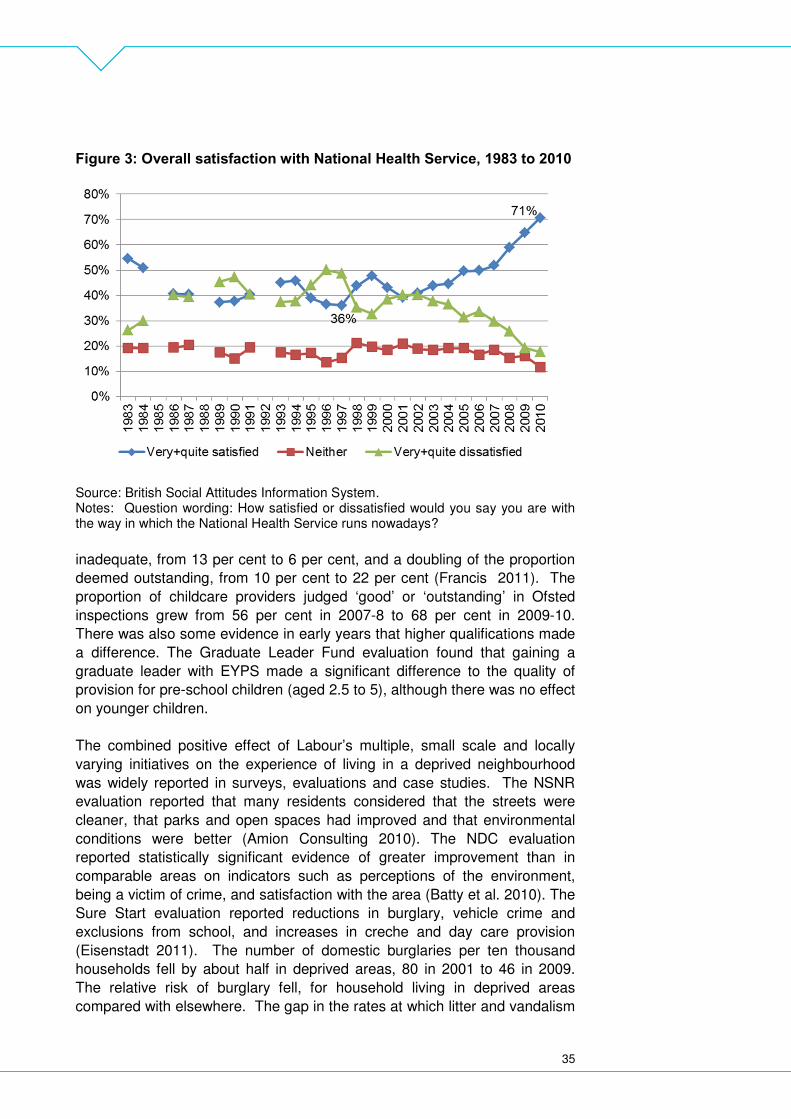
35
Figure 3: Overall satisfaction with National Health Service, 1983 to 2010
Source: British Social Attitudes Information System. Notes: Question wording: How satisfied or dissatisfied would you say you are with the way in which the National Health Service runs nowadays?
inadequate, from 13 per cent to 6 per cent, and a doubling of the proportion
deemed outstanding, from 10 per cent to 22 per cent (Francis 2011). The
proportion of childcare providers judged ‘good’ or ‘outstanding’ in Ofsted
inspections grew from 56 per cent in 2007-8 to 68 per cent in 2009-10.
There was also some evidence in early years that higher qualifications made
a difference. The Graduate Leader Fund evaluation found that gaining a
graduate leader with EYPS made a significant difference to the quality of
provision for pre-school children (aged 2.5 to 5), although there was no effect
on younger children.
The combined positive effect of Labour’s multiple, small scale and locally
varying initiatives on the experience of living in a deprived neighbourhood
was widely reported in surveys, evaluations and case studies. The NSNR
evaluation reported that many residents considered that the streets were
cleaner, that parks and open spaces had improved and that environmental
conditions were better (Amion Consulting 2010). The NDC evaluation
reported statistically significant evidence of greater improvement than in
comparable areas on indicators such as perceptions of the environment,
being a victim of crime, and satisfaction with the area (Batty et al. 2010). The
Sure Start evaluation reported reductions in burglary, vehicle crime and
exclusions from school, and increases in creche and day care provision
(Eisenstadt 2011). The number of domestic burglaries per ten thousand
households fell by about half in deprived areas, 80 in 2001 to 46 in 2009.
The relative risk of burglary fell, for household living in deprived areas
compared with elsewhere. The gap in the rates at which litter and vandalism

36
were reported, between people in the most deprived areas and others, also
fell.
However, although more services were provided and they were targeted
towards people in greatest need, gaps in access to services were not totally
erased. Richer people continued to be able to buy access to private
nurseries, schools and hospitals, something which Labour made no direct
attempt to curtail. Socio-economic gaps remained in access to state
services. For example, in 2010, 76 per cent of three-year olds from the
most disadvantaged households were accessing free early education.
compared with 92 per cent overall. The most disadvantaged families also
made relatively little use of formal care (15 per cent copared with 39 per cent
overall) . A 2009 report by Ofsted on twenty Children’s Centres concluded
that none felt they were truly successful in engaging the most vulnerable
families (ref). Women with higher pay continued to take longer maternity
leave than women in lower-paid jobs, even though the gap narrowed.
Children from better-off families continued to gain access to university in
disproportionate numbers.
Also quality differences remained. There were still fewer general practitioners
per head in poorer areas than richer ones. Nurseries and schools in poorer
areas were less likely to be graded outstanding than those in richer areas,
although on the other hand children in disadvantaged areas were much more
likely to access the free entitlement in a setting with a graduate.
Neighbourhood satisfaction improved for everyone, and the gap between
those in poor areas and others narrowed for a time during the early 2000s,
but there was no real difference again by the end of the period.
The effects of Labour’s management reforms on quality and access is mixed.
In the early years, the policy of expanding early education and childcare
through a demand-side subsidy rather than directly through state provision
meant that most of the new places were in the private and voluntary sector
where staff qualifications were lower than in the state sector. Evidence from
other countries and the ‘EPPE study’ in the UK demonstrates a positive
effect of more qualified staff on children’s learning (Sylva et al. 2004)
In health, research by Propper et al (2008) suggests that the English policy
of targets backed by publication of waiting time data and sanctions for poor
performance (characterised by the authors as “command and control”)
lowered the proportion of people waiting for elective treatment relative to
Scotland, which did not adopt the same approach. Burgess et al. (2010)
showed that league tables accounted for an extra 1.92 GCSE grades per
student per year for English pupils compared with those in Wales where
league tables were abolished in 2001. Since targets in education were about
raising the level of lower attainers, an equity effect can also be implied.
However, a large body of educational research suggests that gains in grades
from Labour’s performativity regime (and that of its Conservative

37
predecessors) were costly, leading to the disengagement of some of the
lowest attaining pupils, the prioritisation of pupils at grade boundaries, loss of
curriculum breath and ‘teaching to the test’ (see West 2010 for a useful
overview of the arguments and evidence). The English government
responded to these concerns to a very limited extent, for example a retreat
from testing at age 14 and the adoption of greater curriculum flexibility (see
Lupton and Obolenskaya for a fuller discussion).
There is also research evidence on markets and competition more broadly,
as distinct from the specific issue of performance management through
targets and performance tables discussed in the preceding paragraph.
Research on competition in health (e.g. Cooper et al. 2011, Gaynor et al
2011, Bloom et al. 2011) tends to suggest a positive effect of choice and
competition on patient outcomes, although other studies have suggested that
publication of data (a ‘reputation effect’) is more important than competition
(Bevan and Fasolo 2011), while others (Pollock et al. 2012) find that other
factors such as improvements in primary care and other treatments were the
key drivers of quality improvement. Vizard and Obolenskaya (2013) cover
these debates in more detail.
Allen and Burgess (2010) have reviewed the evidence on school competition
in England. They find no consistent positive effect of competition – that is
schools ‘raising their game’ in order to attract pupils from other neighbouring
schools – although studies in the US and Sweden have found such effects.
On the other hand, claims that school intakes have been socio-economically
polarised by increasing competition are not well supported by statistical
evidence either. A number of studies (eg Ball 2003b, Harris 2010) have
shown that middle class parents are more likely to exercise choice towards
high attaining schools, and that high-performing schools tend to become
more middle class (Bradley and Taylor). However, taken together, studies
looking at the period 1989-95 (Gorard et al 2003), 1994 -1999 (Goldstein and
Noden (2003) and 2006-9 (Chen and Gorard) seem to indicate mainly that
school segregation increased during times of economic growth rather than
showing any particular policy effect. Thus Labour’s commitment to choice
and diversity in education is not clearly demonstrated to be either beneficial
or harmful.
In summary, there was a big increase in service inputs and outputs under
Labour, leading to more services, easier access, higher staffing ratios and
less waiting. Buildings and equipment were modernised. Targeting towards
poorer areas improved equity in provision. The public were more satisfied.
There is some evidence that services were ‘better’ as a result of Labour’s
management and market reforms but this is also disputed.

38
Chapter 4: The Costs of Expansion and Reform
Overall Public Spending
Much has been made in recent political debate about Labour’s public
spending and its impact on the country’s finances, irrespective of the impact
on outcomes and quality. The cost of the policies and programmes
described here, and other government expenditure, was very substantial.
Total public spending rose from £449 billion in 1996/7 to £725 billion in
2009/1014, a rise of 60 per cent. During the same period, national income
(Gross Domestic Product or GDP) increased from 1,138 million to 1,530
million, a rise of 30 per cent. As a result, public spending as a proportion of
GDP rose, from 39.5 per cent to 47.4 per cent.
Trends before and after the financial crisis are important to understand.
Spending as a percentage of GDP fell during Labour’s first term as the
government stuck to its predecessor’s spending plans (Figure 4). It then
rose rapidly from 2001 to 2005 before flattening out to 2007/8. At this
point, total public spending looked unremarkable by historical UK standards.
A steady downward trend starting in the early 1980s had been reversed, but
spending was still only at the level of the late 1980s and lower than it had
been for most of the late 1960s, 1970s and 1980s.
In Labour’s last two years, spending increased dramatically as a percentage
of GDP, from 40.7 to 47.4 per cent of GDP. As Hills (2011), among others,
has pointed out, this was due to the sudden fall in GDP not to a sudden
increase in real terms spending. According to the plans drawn up in the
2007 Spending Review, GDP was predicted to grow by a further seven per
cent in real terms and spending to increase slightly more slowly than that.
What actually happened was that GDP fell in real terms. Spending on the
major service areas (health and education) continued, however, at levels
similar to what was planned, while the effect of the recession on
unemployment and household incomes was to push social security and tax
credit spending up by 13 per cent in real terms (to 2010/11). Thus spending
continued to rise while GDP fell. As a result spending as a proportion of
GDP rose very rapidly (Figure 4).
Looking over Labour’s whole term, including these last two remarkable
years, the overall increase in spending (as a percentage of GDP) was very
high by international standards. In order to enable international
comparisons, the OECD measure of ‘total general government outlay’ is
used here. This is a broader measure than total managed expenditure and a
much wider one than expenditure on services, so changes in the UK’s
international position are greater than those we report (later) for individual
services. These data are also reported on a calendar year not a financial
year basis.
14Source: IFS Public Spending Under Labour
spreadsheet. Shown in
2012/13 prices. For
comparability with the other
papers in this series, a
version of this spreadsheet
in 2009/10 prices
accompanies this report on
our website. The data relate
to Total Managed
Expenditure (TME), which
describes all forms of
expenditure made by
central government, local
authorities and public
enterprises, including debt
interest as well as services.

39
Figure 4: Trends in National Income (GDP) and Public Spending, 1970/71 to 2009/10
Source: IFS Public Spending Under Labour (2010). Public Spending is defined as
Total Managed Expenditure
On this basis, the increase in the UK’s spending was the highest of any
OECD country and the EU 15.15 It pushed the UK up the international
spending rankings, to 6th both of the EU 15 and the OECD 28 (Figure 5).
Again, as in 1997, the rankings tell only part of the story. There were two
general patterns between 1997 and 2010. One was for the lower spending
EU15 countries like the UK to move up the distribution, while other countries
like Hungary, Slovakia, Norway and Canada moved down. The other was a
reduction in the disparities between countries. By the end of the period, the
bottom spending of the EU15 was only 16 percentage points adrift of the top
(or 12.7 if an outlier, Luxembourg, is excluded) compared with 24 percentage
points at the start. Although the UK moved up the rankings, therefore, it was
moving up a more cramped distribution. Its spending, which had looked
exceptionally low in 1997 now looked high but unexceptionally so.
0
10
20
30
40
50
60
0
200
400
600
800
1000
1200
1400
1600
1800
% o
gf G
DP
£ bi
llion
(201
2/13
pric
es)
Public Spending As Percentage of GDP Public Spending GDP
15 Source: ibid

40
Figure 5: UK Public Spending by Comparison with other EU 15
Source: IFS Public Spending Under Labour (2010). From OECD Economic Outlook
86 (2009) Annex Table A
Public Spending is defined as Total General Government Outlay
Spending on Different Areas of the Welfare State The figure for overall public spending includes many items of public
expenditure that we do not cover in this report – defence, transport, the
justice system and so on. However, these areas of spending are small
relative to health, education and social security. To understand the
implications of Labour’s social policy programme in more detail, we now
focus specifically on these areas.
During Labour’s term in office, health was the main beneficiary of extra cash.
Spending on health more than doubled in real terms, with education up 78
per cent and social security 38 per cent. As a result, expenditure on health
and education as a percentage of GDP were substantially higher even before
the crash than in 1996/7. Social security spending, on the other hand, was
lower before the recession took effect (Table 5).
60.7
56.4 56.354.1 53.7
51.2 50.248.3 47.5
4543.2
41.6 40.7 40.6
36.7
59.2 58.456 55.4
54.1 53.4 52.7 51.6 51.2 51.149.9
48.447.2 46.5
43.2
0
10
20
30
40
50
60
70
Sw
eden
Denm
ark
Fin
lan
d
Fra
nce
Au
str
ia
Be
lgiu
m
Italy
Germ
any
Neth
erlands
Gre
ece
Po
rtuga
l
Sp
ain
Luxem
bourg
UK
Irela
nd
Denm
ark
Fin
lan
d
Sw
eden
Fra
nce
Be
lgiu
m
UK
Au
str
ia
Neth
erlands
Italy
Po
rtuga
l
Gre
ece
Germ
any
Sp
ain
Irela
nd
Luxem
bourg
1997 2010
Tota
l Gen
eral
Gov
ernm
ent O
utla
ys a
s %
of
GD
P

41
Table 5: Public Spending in Relation to GDP, 1997/8 to 2009/10
Spending as percentage of GDP
1996/7 2007/8 2009/10
Health 5.3 7.1 8.3
Education 4.7 5.5 6.2
Social Security 13.0 11.0 13.3
All Public Spending 39.5 40.7 47.4 Source: IFS Public Spending Under Labour spreadsheet. Note: Social Security spending in 1996/7 will include parts of social care funded at the time through Income Support but now paid for under other budgets.
Looking right to the end of the Labour period, health and education both
increased as a proportion of all public spending, and social security spending
declined (health from 14 to 18 per cent, and education from 12 to 13 per
cent). Social security, although increasing in absolute spend, actually
decreased as a proportion of overall expenditure, from 33 per cent in the last
year of Conservative government to 28 per cent in Labour’s last year,
because of the rise in spending on health and education. This emphasises
the point made earlier that, although Labour’s reforms to the social security
system were by no means insignificant, the main distinguishing feature of its
term in office was its extra spending on services.
Within the social security budget, half of the increase was accounted for by
benefits for pensioners. Nearly all of the rest went on spending aimed at
children, mainly Child Benefit, Child Tax Credit and Working Tax Credit for
families with children (and their earlier equivalents) – and other transfers for
the working age population (which includes items such as the adult parts of
Income Support or Jobseeker’s Allowance, including for parents). Other
working age benefits and tax credits rose much more slowly. As a result,
spending on children and on pensioners rose as a percentage of GDP, while
other working age benefits were a slightly smaller share of GDP in 2009/10 –
even in the wake of the economic crisis – than they had been in 1996/7.
Looking at these data in historical and international perspective helps to put
them in context. Figure 6 shows spending in the UK on social security, health
and education back to the 1970s, as a percentage of GDP. Labour’s
investment in health is clear here – health spending was higher than at any
point since a consistent time series of that data began in the late 1970s. The
rise in education spending took it back to the level of the early 1970s.
Spending in these areas reversed the decline of the 1980s and 1990s.
However, before the effect of the crash, social security spending was about
the same as it had been for most of the period since the early 1980s.

42
Table 6: Public Spending on Cash Benefits in Relation to GDP, 1996/7 to 2009/10 (Great Britain)
Spending as percentage of GDP
1996/7 2007/8 2009/10
Benefits aimed at Children 1.5 2.2 2.8
Benefits aimed at pensioners 5.4 5.7 6.7
Other working age benefits 3.9 2.7 3.4 Source: Hills (2013) based on DWP and HMRC figures giving consistent time series on current definitions. Figures exclude Income Support payments for residential care in 1997-8 and also exclude Council Tax Benefit.
Figure 6: Spending on Health, Education and Social Security in Historical Perspective
Source: IFS Public Spending Under Labour spreadsheet
The UK’s extra spending on these particular areas moved it up the
international league tables, but by no means made it look exceptional by
international comparison. We compare 1997 with 2009, for three sets of
countries: the OECD (for which the number of countries with comparable
data varies from 27 to 30), the EU15 and the four big Western European
nations (France, Germany, Italy and the UK), looking at spending as a
percentage of GDP.
• For social security, the UK initially ranked very low, 20th in the OECD,
bottom of the EU 15 and of the ‘big four’. In 2009 it had hardly moved
up, to 17th in the OECD, 14th of the EU15 and still bottom of the big
four.
0
2
4
6
8
10
12
14
16
1970-7
1
1972-7
3
1974-7
5
1976-7
7
1978-7
9
1980-8
1
1982-8
3
1984-8
5
1986-8
7
1988-8
9
1990-9
1
1992-9
3
1994-9
5
1996-9
7
1998-9
9
2000-0
1
2002-0
3
2004-0
5
2006-0
7
2008-0
9
Perc
enta
ge o
f nat
iona
l inc
ome
(% G
DP)
Social Security
Health*
Education

43
• For education, the UK was also a low spender at the start (19th of
OECD, 10th of EU15 and 3rd of the big four). Despite a big increase in
spending it moved up only to 14th in the OECD, remaining 10th in the
EU15, but 2nd of the big four.
• There was more movement in health. The big rises in health
spending in the UK moved it from a relatively low to a relatively high
position in the OECD rankings (21st to 9th) and from 13th to 8th in the
EU15, although only from 4th to 3rd of the big four.
• Family policy was the only area in which the UK seemed, by the end
of the period, to be a relatively high spender – 4th in the OECD (from
13th), 3rd in the EU15 (from 8th) and 1st among the big four.
Financing Public Spending
Labour’s overall management of the public finances is not the main subject
of this paper. However we offer a brief account in order to help the reader
put the discussion of social policy spending and its outcomes in the context
of current debates about whether levels of public spending were higher than
the country could afford and thus contributed to the high current budget
deficit and high public sector net debt that the Coalition inherited.
As we have noted, the main increases in social policy spending occurred
during Labour’s second term, so the country was running at its new higher
level of public spending when the crash came. At this stage, the deficit on
the UK’s current budget was 0.5 per cent of GDP, lower than when Labour
came to power (2.2 per cent). The public sector net debt, at 36.4 per cent of
GDP was also lower than when Labour came to power in 1997 (42.1 per
cent) (Figure 7).
These data showing slightly improved levels of deficit and debt despite high
spending need to be considered alongside the data presented in the
previous section which shows that spending levels before the crash were not
exceptional by historic UK standards nor by the standards of other countries.
There is no evidence that increases in spending on health, education and
other services caused a crisis in the public finances preceding the global
financial crisis and recession of 2007/8.

44
Figure 7: Levels of Public Sector Debt and Current Budget Deficit
Taxes are another important part of the pre-crash story. Chote et al. (2010b)
show that from 1997 to 2001 income from taxes exceeded spending as a
proportion of GDP, enabling the government to bring the current budget into
surplus and reduce public sector net debt. However, the fall in the stock
market in 2000 and 2001 led to an unexpected fall in tax payments by
financial sector firms and their employees, Significant tax raising measures
in the 2001 and 2005 spending reviews were also offset by other factors
such as the weak performance of the stock market.
Thus during the period from 2000/01 to 2007/08, government revenues
showed no increase as a proportion of GDP, while spending consistently
grew. Chote et al. argue that the government was excessively optimistic in
its fiscal projections, which led it to reject further tax raising measures. In
other words, it could have done more to match extra expenditure with extra
income during a period of economic growth, which would have put the
country in a stronger position when the crash came.
We then come to what happened after 2007. Between 2007/8 and 2009/10,
the current budget deficit went up from 0.5 per cent to 7 per cent of GDP.
Public sector net debt went up from 36.4 per cent of GDP to 52.4 per cent
(Figure 7) . This figure includes the cost of fiscal stimulus measures but it
does not include the cost of buying out the banks. We exclude this in order to
provide a more consistent time series (since the banks will eventually be
returned to private ownership). Including the cost of the bank bail-out, public
sector net debt was at 153.4 per cent in 2009/10.
At this stage both deficit and debt (even excluding banks) were exceptionally
high by historic standards – the deficit higher than at any point since the
1960s and the debt higher than at any point since 1975. Both typically rise in
a recession - it was the early 1990s recession that caused Labour to inherit

45
historically high debt and deficit. The 2008 recession was exceptionally bad
– some argue worse even than the 1930s.
Politicians and economists debate both the short-term contribution to deficit
and debt and the long term impact of Labour’s decision to continue with its
proposed spending on services after 2007, compared with what would have
happened under an alternative strategy of cutting spending as soon as
recession hit. They also debate the optimal balance between increased
taxes and decreased spending in order to balance the finances now and in
the future. These are debates beyond the scope of this paper. What the
evidence points to in respect of social policy is that the levels of spending
Labour engaged in to finance its social policy programme did not look
exceptional or unsustainable in normal times, although they increasingly
outstripped income from taxation. The financial crash and recession
changed that, shifting the ground upon which decisions on social policy
spending must now be made.

46
Chapter 6: Effects on Social and Economic Outcomes
Assessing the government’s record
We now turn to the question of what effect Labour’s spending and its
programmes of reform and renewal had on social and economic outcomes,
and in particular on the gaps between richer and poorer households. More
was spent and many extra services were delivered, but what effect did these
have? The approach we take to this question is as follows:
First, we look at trends in outcomes over the period, without trying to make a
link with any specific policies or interventions. Was life better, across a
number of indicators, and were social gaps smaller, in 2010 than in 1997?
What was the situation before and after the financial crash and recession?
We then subject these trends in outcomes to two more rigorous tests, as
follows:
• Were outcomes better than they would have been or was this just a
continuation of what went before? As part of this we consider the
evidence of any connections between the policies enacted and the
outcomes achieved, or not achieved.
• Do the outcomes achieved represent value for money?: a question
naturally being asked given current constraints on public spending.
As part of this we consider how outcomes look in international
perspective.
Were outcomes better at the end than the beginning?
The overall picture is that most outcomes were better in 2010 than 1997, and
that socio-economic gaps had closed, although there were important
exceptions.
Two sets of indicators provide an overview of the situation. One is the
Opportunity for All (OFA) indicators - a set of 59 measures adopted by the
government in 1999, to hold departments to account on their progress on
reducing poverty and social exclusion. They were last officially reported on
in 2007 – we have updated them to 2010 to give coverage of the whole
period. The other set is the “Monitoring Poverty and Social Exclusion”
(MOPSE) indicators independently designed and commissioned by the
Joseph Rowntree Foundation.16
Both sets of indicators show a positive picture but one much more than the
other. We show the full picture in Appendix 1 and summarise it in Table 7.
16On entering office, the
Coalition government
adopted another set of
indicators, of social
mobility. This is a smaller
set, concentrating mainly
on gaps in socio-economic
outcomes in the early years
and education, and in most
cases the data does not
permit us to analyse these
retrospectively over the
Labour period. These
can, however, be monitored
going forward

47
The OFA indicators show resounding progress over the Labour period as a
whole. 48 of the 59 indicators improved from the 1997/98 to 2010. Only
six declined: the overall employment rate; the employment rate among the
lowest qualified; the proportion of people contributing to a non-state pension,
the gap in life expectancy at birth between the poorest areas and others; the
gap between the educational attainments of looked-after children and others;
and child obesity. The MOPSE indicators show a more mixed picture.
More than half (26 out of 50) improved. Fourteen (less than a third)
deteriorated. Data on five others was not consistently available.
Both sets of indicators show the effects of the economic downturn. Looking
since 2007 (in the OFA case) or 2005 in the MOPSE case, there is a much
less positive picture. Twelve of the 59 OFA indicators and 20 of the MOPSE
indicators declined over that period.
Table 7: Indicators of Change in Poverty and Social Exclusion
“Opportunity for All” indicators
“Monitoring Poverty and Social Exclusion”
indicators
Trend from
baseline to 2010 1
Since last
Opportunity for All
(2007)2 to 2010
Long-term
trend
(10 years
or so)
Medium-term
trend
(5 years or so)
Improving 48 25 26 13
Steady 4 9 5 12
Mixed 1 4
Deteriorating 6 12 14 20
Not available 9 5 5
TOTAL 59 59 50 50
Sources: Authors’ update of Department for Work and Pensions Opportunity for All
2007 Update; New Policy Institute, Monitoring Poverty and Social Exclusion
Indicators.
Notes:
1. Baseline year is usually 1997 or 1998. For some indicators based on specific
Labour’s initiatives or data that were not collected before Labour came to
power, the baseline is later.
2. Labour published its last government’s annual report on poverty and social
exclusion in 2007 (Opportunity for All). Because data often become available
with a year or two time lag, indicators reported in 2007 often capture change
only up to 2005/06. The table refers to change occurring since the last year
data were reported for in Opportunity for All.

48
There are two reasons why these sets of indicators show different things.
One reason is that the OFA (government) indicators included a number of
measures of behavioural change (for example smoking) and of service
performance (for example the numbers of re-registrations on the child
protection register) that Labour was trying to influence in order to impact on
long term poverty and social exclusion, but which were not included in the
independent set (MOPSE). The other is that MOPSE includes measures of
in-work poverty and of living standards that are absent from the OFA set.
These include pay inequalities and low pay and self-reported material
deprivation.
The detailed papers upon which this report is based also show that
outcomes improved for the things that Labour was trying to influence:
population health and health inequalities, a better and more equal start in life
for children, education standards overall and smaller socio-economic gaps,
reductions in child and pensioner poverty and conditions and opportunities in
the poorest neighbourhoods. A large majority of outcomes in these areas
improved.
• In health, overall life expectancy rose, infant mortality fell and gaps
closed, and there were considerable reductions in mortality from
circulatory disease and cancer (Vizard and Obolenskaya 2013)
• For young children, employment rates among lone parents
improved, fewer women drank or smoked during pregnancy,
particularly among lower socio-economic groups and more mothers
breastfed for longer. Low birthweight fell and infant mortality fell,
results in the Foundation Stage Profile improved after 2008 and
socio-economic gaps in all these measures narrowed (Stewart 2013)
• For older children and young people, results in national tests at 11
and 16 showed substantial improvements and hardly anyone was
leaving school with no qualifications by 2010. Socio-economic gaps
closed on all indicators –gradually at age 11 and more dramatically at
age 16. Greater proportions stayed on at school after 16 and went to
higher education, and socio-economic gaps in HE access closed
slightly despite concerns to the contrary. (Lupton and Obolenskaya
2013)
• In the poorest neighbourhoods, rates on all major indicators of
problems – worklessness, burglary, neighbourhood environmental
problems, vacant housing – all fell and gaps closed between the
poorest neighbourhoods and others (Lupton, Fenton, and Fitzgerald
2013)

49
• Overall levels of poverty measured as the proportion of households
with incomes less than 60% of the national median, went down, even
before the crash17
. Children and pensioners were the main
beneficiaries. Child poverty fell from 27 per cent in 1996-7 to 17.5
per cent in 2010/11 (before housing costs) and pensioner poverty by
a quarter, from 24.6 to 17.5 per cent. The effect of this was that the
risks of poverty converged over the life cycle (Figure 8). In terms of
overall incomes, there was a modest redistribution to households at
the lower end of the income scale (Hills 2013).
Figure 8: Poverty Rates of Different Groups 1996/7 to 2010/11
Source: Hills (2013). 2010/11 is used as the end point for this indicator since thebenefit rates set by Labour in its last year in office would have been the main driver of changes in the following year
This is not to say that everything got better. For example, in health, there
were increases in the life expectancy gap between the areas with the worst
health and deprivation (‘spearhead’ areas) and the England average.
Obesity continued its medium term tendency to increase. At the higher
threshold of five higher grade GCSEs including English and maths, the gap
between pupils on Free School Meals and others closed only very slightly -
FSM pupils improved, but non FSM pupils improved just as fast. The gap in
educational outcomes between looked after children and their peers
0.0%
5.0%
10.0%
15.0%
20.0%
25.0%
30.0%
Children Pensioners
Working-age parents Working-age non-parents
17 The effect of the financial
crisis and recession was to
reduce relative poverty, as
median incomes fell and
the incomes of the poorest
continued to be supported
by benefits.

50
widened. However, the overall picture of progress on the kinds of outcomes
that Labour could influence by its policies on public services is very clear.
On the other hand, some economic indicators are not so positive. Relative
poverty rose for working age adults without children, from 12.0 to 14.6 per
cent (as Figure 8 shows).
Material deprivation may also have risen slightly, although the evidence on
this is not yet as full as one would hope. Data from the now discontinued
Families and Children Survey (FACS) suggested that material deprivation
may have reached a low point around 2005, but then risen. The survey
shows the proportions of people lacking items because they could not afford
them. For nearly all of the items, there were falls between 2001 and 2005 (at
the same time that income poverty was falling on both a relative and
absolute basis for children and their parents). However, for several of the
items, including a holiday away from home and a night out once a month,
deprivation began to rise again between 2005 and 2008 (when income
poverty was roughly constant on both bases). A new study of poverty and
social exclusion published in 2013 (Gordon et al. 2012), based on the ability
to afford the necessities of life during 2012, appeared to showed substantial
increases in material deprivation since previous surveys in 1983 and 1999,
although this does not tell us what changed in the Labour period, rather than
before or after.
There was also no real change in income inequality overall. While inequality
had increased at all points in the income distribution in the 1980s, and across
the Conservative period from 1979 to 1996-97 taken as a whole, what
happened under the Labour government depends on the measure used.
Comparing incomes near the top with those near the bottom, income
inequality fluctuated around a roughly constant level between 1996-97 and
2010-11, but with a fall in the final two years taking it below the inherited
level.
By contrast, the ‘Gini coefficient’ measure, affected by incomes right at the
top and bottom, was higher in 2009-10 than in 1996-97, although a sharp fall
in 2010-11 took it back to its starting point. Growing incomes at the very top
of the distribution were an important reason for the difference between these
two measures. The results also depend on the exact start and end years
chosen. The fairest summary is probably that income inequality was broadly
constant over the period as a whole (Figure 9).

51
Figure 9: Trends in Income Inequality 1961-2010/11
Source: Institute for Fiscal Studies: Inequality and Poverty spreadsheet, 2012
Gregg and Wadsworth (2011), among others, point to the continuing
importance of labour market structures in determining both inequality and
poverty. Employment rates rose until 2008, as a result both of economic
growth and labour market policies. The National Minimum Wage propped
up the incomes of those on the lowest wages from its inception, and
subsequently seems to have had an effect on increasing wages up to the
20th percentile of the earnings distribution, thus reducing inequalities in the
bottom half of the earnings distribution.
Tax Credits were also an important part of ensuring that work was a route
out of poverty. Dickens (2011) shows that there would be another million
children in poverty without Tax Credits. However, this in itself illustrates the
continuing problem of low wages, or small numbers of hours or both. Half of
poor children are now in ‘working poor’ households, with wages or hours
being insufficient to raise them over the poverty line.
Meanwhile, wage inequality continued to increase under Labour, especially
among men, as the top ten per cent of the distribution continued to pull away
from the rest (Machin 2013). And although the government had set a target
for the convergence of economic growth rates between English regions, the
Greater South East region continued to grow more quickly than other
regions, increasing its share of the country’s economic output.
Were Outcomes Better than they Would Otherwise Have Been?
One argument that could be made about these trends is that they merely
reflect what was happening anyway, driven by social, economic and
0.00
0.05
0.10
0.15
0.20
0.25
0.30
0.35
0.40
1.0
1.5
2.0
2.5
3.0
3.5
4.0
4.5
5.0
196
1
196
3
196
5
196
7
196
9
197
1
197
3
197
5
197
7
197
9
198
1
198
3
198
5
198
7
198
9
199
1
199
3-9
4
199
5-9
6
199
7-9
8
199
9-0
0
200
1-0
2
200
3-0
4
200
5-0
6
200
7-0
8
200
9-1
0
Gin
i Coe
ffici
ent
90:1
0 R
atio
90/10 ratio Gini coefficient

52
technological change and by previous government policies. Primary and
secondary school results, for example, were on an upward trend already.
Child obesity was already rising.
Anyone trying to address this question is hampered by a lack of long term
trend data. One of the legacies of the Labour government was a much
stronger evidence base, meaning that most trends can be monitored from
the late 1990s but not before. For most indicators, establishing these kinds of
patterns across the board is simply impossible. Those that are available
tend to show a break from the previous period. Poverty for pensioners, and
proportions of children in workless households, for example, were on the up
before 1997. Other indicators were improving in the 1990s, such as infant
mortality and smoking, although socio-economic gaps were not reducing.
In some cases, we see an interesting step change towards the end of the
Labour’s period in office and even through recession. For example, there
appeared to be a rapid fall in infant mortality among lower socio-economic
groups from 2008 to 2010 and a rapid improvement both in GCSE
performance and performance in the Early Years Foundation Stage, as well
as closing of socio-economic gaps on these indicators. “Continuing trend”
explanations in these cases do not seem plausible. It seems more likely that
these step changes were the cumulative effect of policy interventions and
capacity building in earlier years, or the effect of particular policies enacted in
these years.
This leads us to another way of looking at this question which is to consider
whether there was any evidence of a link between the policies enacted and
the trends in outcomes. The most robust evidence is for income poverty,
where there have been a number of attempts to model what might have
happened had different policies been pursued. These compare the
outcomes of Labour’s actual policies compared with the outcomes of the pre-
existing tax and benefits system uprated in various different ways, in line with
prices, in line with earnings or in line with per capita GDP.
One recent attempt to do this is was by Sefton, Hills and Sutherland (2009).
They looked at the effect of Labour’s reforms up to 2008/9, comparing the
position of each household in 2000/1, 2004/5 and 2008/9 under Labour’s
benefits and direct tax reforms, with what they would have been had the
1996/7 system remained in place but been updated in line with prices, or in
line with earnings. Compared with a price-indexed base, the bottom three
income groups made very big gains - 25 per cent for the poorest tenth of
households and more than 10 per cent for the next two groups, and the top
two groups were slightly worse off. Compared with an earnings-indexed
base, the gains for the bottom income groups were more modest – 8 per
cent for the bottom tenth and less than 5 per cent for the next two groups –
but still positive, while the rest of the distribution emerged as losers, by up to
3 per cent for the top income group.
53
Adam and Browne (2010) took a similar approach, updating the analysis to
include the whole of the Labour period. Their analysis also includes the
impact of indirect tax changes, such as in VAT rates, which offset some of
the progressive effects of the direct tax reforms. It is also based on the
income groups households were in under the 2005 system, that is, after the
bulk of the reforms, rather than before them. This places some of the large
gainers from the changes higher up the distribution than in the previous
analysis, while some of those who did not benefit – such as low-income
working age households without children – remain at the bottom. These
differences reduce the scale of the gains to lower-income groups, but the
overall result is similar. The 2009-10 tax-benefit system was considerably
more generous to low-income groups than a price-uprated version of the
inherited system, while the difference for higher income groups was small.
These are averages for each income band. Adams and Browne also show
that lone parents were 4-7 per cent and couples with children 1-5 per cent
better-off (depending on whether they were earning) and single pensioners
five per cent better off. By contrast single people without earnings were nine
per cent worse off and couples without children five per cent worse off than
in the unreformed system.
The overall conclusion is that compared with the Conservative policies that
were in place at the time, Labour’s cash transfer policies did have an effect
on reducing poverty for pensioners and families with children, and on making
overall incomes slightly more equal, although people of working age actually
lost out.
Service areas such as health, education, the early years and neighbourhood
renewal are not susceptible to modelling in the same way. Here we can look
at evaluations of delivery approaches, which have been considered in the
previous chapter and of individual policies.
The limitations of evaluation evidence need to be understood. Not all
policies were evaluated. Where they were, typically, government’s own
evaluations were carried out over short periods, and concentrated therefore
on short term outcomes, participant and professional assessments of the
value of the policies, and issues related to implementation. Independent
studies tended to be carried out after the event using secondary data and
looking at a limited range of measurable outcomes. All studies faced the
problem of identifying suitable comparison areas which was a particular
problem in this period. Given the very large amount of new activity in so
many areas of social policy and the fact that new approaches developed
through particularly initiatives tended to be picked up outside pilot areas, it
was always difficult, if not impossible, to find comparison areas where no
policy activity was occurring. Sure Start is a good example of this. The initial
policy established Sure Start local programmes in particular areas which,
among other things, introduced closer team working between health visitors,

54
social workers and early education professionals. In some local authorities,
these working practices were more widely established. Comparing children
in Sure Start programmes with others may indicate only the additionality of
Sure Start over and above other policies, such as maternity leave policies,
the New Deal for Lone Parents, cash benefits for families, neighbourhood
improvements and so on, but even this would fail to pick up one of the effects
of Sure Start – its effect on wider practices. For this reason, it is important to
read across whole policy areas, looking at overall trends and cumulative
effects, and not to put too much weight on evaluations of single interventions.
There are some policies that clearly had the desired effect. These were cash
benefits or benefits in kind, and it is no surprise that findings tend to be
clearer for these kinds of policies because it is straightforward to identify
people who were receiving the help and those who were not (either before or
concurrently) and compare their outcomes. For example increased
entitlement to paid maternity leave led to mothers spending longer at home.
The length of leave taken appears to correspond tightly to the length of the
paid entitlement: the median leave taken jumped from around 20 weeks in
2002 to 26 weeks in 2006 and 39 weeks in 2008. Government hopes that
more women would return to work once their leave ran out were not realised:
more than one in five mothers who worked before a child’s birth remain at
home 12-18 months later. However, the majority who resume work are now
much more likely to return to the same employer, which means a lower
likelihood of occupational downgrading (Stewart 2013).
Another example is the Education Maintenance Allowance. Researchers
estimated that just over half of those staying on in education and receiving
EMA would have been inactive (NEET) rather than in work (Dearden et al.
2005). Moreover, students with EMA were more likely to stay in their
courses than similar non-EMA students, and, among those from the most
deprived areas, had higher achievement rates than their peers without EMA
(Aitken et al. 2007).
Other policies were evaluated mainly in positive terms although not
delivering all the short term ‘hard outcomes’ that might have been desired.
For example no significant effects were found for children’s cognitive
development from Sure Start local programmes nor extended schools,
although in both cases professionals described the initiatives as having put
children on a footing from which such outcomes should be achieved in the
longer term (Belsky et al. 2007, Cummings et al 2007). The research served
to emphasise that the development of children and young people is a long
term process, and that those who have complex needs require complex and
ongoing interventions. Focusing only on the short term may be a counter-
productive strategy.
Some lessons were also learned about the kinds of professional practices
that would generate outcomes in the longer term. For example, evaluation of

55
the Neighbourhood Renewal Fund found that it had been effective in giving
local authorities and partners increased flexibility to spend and experiment
across thematic areas. It had increased the visibility of neighbourhood
renewal as a priority for service providers, and encouraging mainstream
agencies to focus on need in the poorest areas (Amion Consulting 2010).
Changes of this kind in working practices may come to be seen of one of
Labour’s main legacies, but it remains to see whether they became
sufficiently embedded to survive without some of the funding and
infrastructure that originally supported them.
A third set of evaluations seem to raise bigger questions about how money
was spent. Examples of these include:
• the policy of deploying teaching assistants (TAs), which appeared to
have detrimental effects on the learning of those pupils primarily
allocated to them, as qualified teacher time was exchanged for
unqualified TA time. However TAs were also found to improve
teacher productivity and classroom management (Blatchford et al.
2009)
• The policy of funding free universal early education for children who
were already attending a pre-school educational setting. Arguably
more could have been gained by targeted policies than universal
subsidies. On the other hand, the high take-up rates suggest that
the policy was more successful than means-tested childcare
subsidies in drawing children from disadvantaged backgrounds into
early education (Stewart 2013).
• Some specific aspects of the New Deal for Communities
programme, such as education funding, which was found by the
evaluation team not to have been spent in the most effective way.
Labour’s emphasis on the funding capital projects via the Private Finance
Initiative has also been criticised for its high long term cost and the high
burden of risk on the public sector, although evidently a more traditional
model of public finance would have involved greater short term public
spending, or a slower timetable of improvements.
Did the Outcomes Represent Value for Money?
There are both narrow and broad approaches to this question. One narrow
approach is to investigate whether specific policies were successful in
meeting their objectives and (in the case of preventative services) whether
the money spent on them was more or less than the money that would
otherwise have been spent.
The evidence on this is sparse and we have not attempted to cull every
government evaluation for value-for-money calculations. Some of these
were carried out in relation to neighbourhood renewal (see Lupton, Fenton
and Fitzgerald for a fuller account). The New Deal for Communities

56
evaluation estimated savings at between three and five times the original
amounts invested. Evaluators of the National Strategy for Neighbourhood
Renewal calculated that between 2001 and 2007 worklessness was reduced
by some 70,000 more in funded areas than would have been the case
without the intervention. The assessed savings from this of £1.6bn were five
times the estimated £312m spent through NRF directly on worklessness.
Another narrow approach is to look overall at productivity – what outputs
were generated for the inputs supplied. Analysis by ONS suggests no
overall change in public service productivity over the period, in other words
the relationship between inputs and outputs remained the same. As
described earlier, productivity in health and education was shown to rise
slightly, but not sufficiently for ONS to characterise it as being any more than
‘broadly constant’ (ONS 2013).
This might indicate that no more or less value was being obtained for the
money spent, but as ONS itself emphasises, ‘productivity’ is not a measure
of value for money because it captures nothing about the purpose of the
service or its quality. For example, a socially desired health service might
have longer GP consultations from better trained doctors – these factors
would not be picked up in a productivity measure.
Both VFM evaluations and productivity measures are prone to rather
fundamental problems if taken as indicators of the success of social policies.
First the estimates are likely to be affected by time lags. This might be
particularly true in child development and preventative health. As a result
the full impact of increases in expenditure may only be seen in the longer
term (Atkinson 2005). In addition ome current spending must be seen as
capacity building for future delivery. In Labour’s case, given the low levels of
spending in previous decades, some spending should also be seen as
restoring services to levels where they might start to generate future
outcomes.
Second, the conceptual scope of VFM and productivity measures focuses on
gains that are attributable to public service activity. They cannot capture the
influence of ‘social determinants’ such as income or housing (Marmot and
Wilkinson 2006). Third, quality adjustment in output calculations is only
partial (the point made above). Fourth, many people would also argue that
some spending was merited on social justice grounds regardless of whether
measurable outcomes improved. For example, tackling local crime to enable
elderly people to feel confident enough to leave their homes might be seen
as ‘value for money’ regardless of whether those people subsequently
reported being happier or living longer.
A broader approach is to ask whether changes in outcomes were as great as
we might expect, in a more general sense, given that spending increases
were large. This question is usually posed in one of two ways. One is to

57
ask whether extra public spending, in a general sense (for example total
spending on schools or hospitals, rather than specific activities in schools or
hospitals) generated extra outcomes. The implication, if it did not, would
be that spending was wasted and that different approaches involving no
extra spending might have been more fruitful.
Although Hanushek (2008) has characterised the international evidence as
tending to show no clear effect of extra school spending, recent studies that
have looked at Labour’s school spending in England do not support that
conclusion. Holmlund et al. (2010), found that school expenditure at primary
level had a consistent and positive effect on test results, especially for
disadvantaged pupils. Gibbons (2011) also found a large positive effect of
school spending, especially in schools with large proportions of
disadvantaged pupils.
Other specific evidence suggests that spending works, including some of the
evaluations we cited earlier. In another example, a survey by the National
Audit Office in 2009 found a clear link between the level of spending and the
number of families using a childrens’ centre (NAO 2009) . Costs per user
were highest in the original Sure Start Local Programme (SSLP) areas, but
these were providing more outreach services for high-need families. Later
Children’s Centres received considerably less in both capital and current
funding, and made greater use of spare capacity in health or community
centres, or even operated from mobile vans, but provided a service that was
very different in nature.
Another approach is to ask whether the gains in outcomes were sufficient
relative to the spend incurred. This is another very difficult question to
answer since it really depends on one’s view of the possibilities of social
policy vis-à-vis wider social and economic structures. Given no real change
in inequalities of income and wealth, one view is that any gain in the
outcomes of the poorest could be regarded as very good value for social
policy investments. Another is that more effective social policy should be
able to achieve change despite these wider structures.
International comparisons have been used as a key tool here- did the UK’s
extra spending push it up the international rankings compared with countries
that spent less? This is a crude approach, since it takes no account of the
starting point, or what the money was spent on. Countries spending money
on long term investments in training or infrastructure might see fewer short
term gains that countries spending money on short term strategies, like
expensive life-saving drugs or cramming for examinations. Nevertheless we
review the evidence here.

58
On social security, the UK remained avery low spender and the declines in
relative poverty overall reported earlier in the paper were not enough to
greatly shift its very poor ranking relative to other countries on this measure,
nor on inequality. By 2008/9, the UK remained behind only the US and
Portugal of the OECD countries on inequality. However, on child poverty
the UK’s ranking improved from bottom of 15 EU countries in 1997 to
seventh of fourteen in 2011 (with no data available for Ireland), which would
seem to suggest a direct impact of targeted spending.
International comparisons on education are inconclusive. As we have
shown, the UK’s spending increase had relatively little effect on its
international ranking on spending. For outcomes, comparison of the
influential OECD PISA scores are only reliable between 2006 and 2009.
These show no real change in the performance of English pupils over this
short period, in contrast to GCSE results, which show a big increase.
However, this was also not the main period of expansion in education
spending, which came earlier, so direct comparisons of spending and
outcomes cannot be made on the basis of these data. Performance in
another international survey, Trends in International Mathematics and
Science Study (TIMSS), seemed to show an improvement in scores and
rankings. However, Smithers (2012) shows that changes in rank in TIMSS
can largely be accounted for by changes in the sample of countries taking
part, and by non-significant changes in raw scores. He concludes that there
is no evidence either of improvement or decline relative to other countries
over Labour’s administration – a conclusion also reached by Jerrim (2012).
For health, a move up the international spending league table were not
matched by improvements in rankings on outcomes. By 2010, the UK can
be characterised as having a “mid” table position on international tables and
remained below the best performers, comparator countries (Vizard and
Obolenskaya 2013). Survival rates for stroke, heart disease and cancer
remained disappointing below that in the best performing OECD countries.
There was a negligible improvement in the UK’s international ranking for life
expectancy for men (with the UK moving from 14th to 13th position amongst
34 OECD countries) between 1997 and 2010, and a slight worsening for
women, with the UK dropping from 20th to 24th position. There was also a
decline in rank for infant mortality. The situation was slightly better for
children. Ranked against the EU15 and the US in 1998, only the US and
Greece had a higher prevalence of low birthweight than the UK; by 2009 it
was also doing better than Portugal, Spain and Belgium. In contrast,
however, the infant mortality rate ranking deteriorated as other countries
have made faster progress. Ranked against the same 15 countries, four had
a higher IMR than the UK in 1997, but by 2009 only the US was doing worse.
On the other hand, closing social class gaps in low birthweight and IMR was

59
a particularly important part of the story of the period and for this we do not
have comparisons.

60
Chapter 7: Conclusion
This report has looked broadly at Labour’s social policy efforts and their
outcomes, using data for its entire period in office. Our conclusions are as
follows.
First, Labour set out to deliver on ambitious social justice goals. The
direction taken in policy between 1997 and 2010 was a radical change from
what had gone before under the Conservative government. While seemingly
ambivalent about overall inequality and in particular the position of the very
rich, Labour made explicit commitments to tackling poverty and social
exclusion, to tackling inequalities in health and educational outcomes, and to
improving neighbourhood conditions and life chances for those in the poorest
areas. It particularly focused on reducing poverty in the earlier and later
years of life, smoothing the risks of poverty over the life cycle. The early
years was effectively invented as an area for public policy intervention. Just
as the Thatcher years shifted the political discourse for good on monopoly
state provision and the relationships between government, firms and the
trades unions, one of Labour’s key legacies may have been to move all
parties to a position of concern with the reduction of social inequalities,
particularly in childhood, albeit differentially expressed in terms of ‘fairness’
and ‘social mobility’.
Second, the policies it enacted to deliver this were not dominated by
increased cash benefits but by reinvestment in and ‘modernisation’ of public
services, and by an expansion of public spending on services that would
bring the UK more into line with other European countries, after a period of
low spending under the Conservatives. In health, education, the early years
and neighbourhood renewal, there were extra staff, more and newer and
better equipped buildings, wider access, and new policy programmes and
services. Socio-economic gaps in access to services decreased, although
were not eliminated, and the public became more satisfied with services.
Spending on cash benefits was also increased, particularly to support
poverty reduction for children and pensioners, goals that were achieved. The
benefits of the money spent were visible on the ground. There is specific
evidence of the positive effect of more spending, although also lessons about
where money could have been better spent. Evidence about whether
Labour’s model of market reforms and strong central performance
management drove up quality is currently mixed, perhaps with more positive
evidence for health than education at present.
Third, on the whole, economic and social outcomes got better, and
differences between social groups narrowed. Given that a good deal of the
increase in spending and the changes in working practices and delivery were
aimed at education and the early years, it is more than likely that the full
effects of some of these changes are yet to be seen, as children progress

61
through the system and into adulthood. Outcomes improved most for the
people who were explicitly targeted by policy – families with children and
pensioners. However, Labour’s reliance on the labour market to improve
poverty for working age people with no children did not pay off. Overall
income inequality also had a worsening trend until the recession, which
reduced inequality because median incomes fell while bottom incomes were
supported by benefits. Recent data has suggested that material deprivation
may have risen in the second half of the decade, while some outcomes did
not improve for certain very disadvantaged groups.
Fourth, this was an expensive agenda with total spending increasing by over
60 per cent in real terms. When Labour took over, levels of spending as a
proportion of national income were low by historic and international
standards. The increases over this period moved the UK up the
international spending league tables but its position was still, overall,
unexceptional. For family policy, the UK became a high spender, while for
social security it remained very low, contrary to some public perceptions
about the welfare bill. Taxes did not rise as much as spending, leading to an
increase in the budget deficit and national debt and causing some
commentators to argue that Labour left the UK in a weaker financial position
than it might have been before the crash. However, both deficit and debt
were lower in 2007/8 than when Labour took office, suggesting that Labour’s
spending has not caused a crisis in the country’s finances. The financial
crash and recession of 2008, which led to a dramatic fall in GDP and the
need for extra spending on social security, fiscal stimulus measures and the
bank bailout, left levels of public sector debt and current budget deficit that
were very high by historical comparison. Taxes must go up, or spending
come down, or both, in the future.
Fifth, there remained a long way still go towards a more equal society after
all the spending. Overall income inequality fell slightly as a result of the
crash but had not been falling before that and remained high by international
standards, as did overall relative poverty rates. Large socio-economic gaps
remained on most indicators. International data on the change in the UK’s
international position are disappointing for health and inconclusive for
education. One conclusion from this could be that “spending doesn’t work”.
However this is not supported either at the general or specific level. In
general terms, where Labour spent money, outcomes shifted, while on areas
on which no policy effort or extra money was expended, outcomes remained
unchanged. Specific research tended to show that more spending was
better than less spending, although there were questions about value for
money of certain policies. Another conclusion is that socio-economic
inequalities in outcomes are hard to shift, in the context of persistent high
inequality – that there are limits to what social policies can achieve in the
absence of economic change.

62
The net effect is that the Coalition had, on the one hand, a better inheritance
than Labour – less poverty (especially for children and pensioners) and
expanded public services - but on the other, a long way still to go in a much
tougher economic climate, with increasing demographic pressures. Even
more so than Labour coming into office, it started its period in government
faced with a large structural deficit and high public sector net debt to pay
down. Given the relatively modest progress towards greater social justice
that could be made over thirteen years of consistent policy effort at high
spending levels, making greater strides in the current financial situation must
be seen as a tough challenge. It remains to be seen whether any of
Labour’s progress will be sustained, built on, or (on the other hand) reversed
and to what extent such changes can be put down to the economic effects of
the recession, the need for public spending restraint, the longer term effects
of Labour policies, or the specific policies of the Coalition itself. Using this
report as our baseline, we will report on these questions in early 2015.

63
References Acheson, Donald. 1998. “The Independent Inquiry into Inequalities in
Health”. London: The Stationery Office.
Adam, Stuart, and James Browne. 2010. “Redistribution, Work Incentives
and Thirty Years of UK Tax and Benefit Reform”. IFS Working Paper
10/24. London: IFS.
Aitken, G., P. Bryam, G. Whalley, and Moore, D. 2007. “Evaluation of the
EMA National Roll-Out”. Preston: RCU.
Allen,R and Burgess,S. (2010) The Future of Competition and Accountability
in Education . London: 2020 Public Services Trust.
Amion Consulting. 2010. “Evaluation of the National Strategy for
Neighbourhood Renewal. Final Report: Summary”. Department for
Communities and Local Government.
Atkinson, Tony. 2005. “Atkinson Review: Final Report. Measurement of
Government Output and Productiv.” http://www.ons.gov.uk/ons/guide-
method/method-quality/specific/public-sector-methodology/atkinson-
review/final-report/index.html.
Ball, S. J. (2003A) 'The teacher's soul and the terrors of performativity'
Journal of Education Policy, 18 (2), 215-228
Ball, S.J. (2003b) Class Strategies and the Education Market: The Middle
Classes and Social Advantage . London: RoutledgeFalmer.
Batty, E. et al., (2010) The New Deal for Communities Experience: A Final
Assessment, Communities and Local Government.
Batty, Elaine, Christina Beatty, Mike Foden, Paul Lawless, Sarah Pearson,
and Ian Wilson. 2010. “The New Deal for Communities Experience: A
Final Assessment”. Volume 7. New Deal for Communities Evaluation
Final Report. Communities and Local Government.
Belsky, J., Barnes, J., Melhuish, E.C., 2007. The national evaluation of Sure
Start. Bristol: The Policy Press Bradley, S. and Taylor, J. (2002) ‘The
Effect of the Quasi-market on the Efficiency–Equity Trade-off in the
Secondary School Sector’, Bulletin of Economic Research 54, no. 3:
295–314.
Blatchford, P., Bassett, P., Brown, P. and Webster, R. (2009) 'The effect of
support staff on pupil engagement and individual attention.' British
Educational Research Journal, 35(5) pp. 661-686
Bromley, C. 2003. “Has Britain Become Immune to Inequality?” In British
Social Attitudes 20th Report: Continuity and Change Over Two
Decades, 71–92. London: Sage.
Burgess, S. Wilson, D. and Worth, J. (2010) A Natural Experiment in School
Accountability: The impact of school performance information on pupil
progress and sorting. Working Paper 10/246. Bristol: Centre for
Market and Public Organisation
Cabinet Office. 1999. “Modernising Government”. London: TSO.
Chen, S.C. and Gorard, S. (2010), ‘Segregation by Poverty in Secondary
Schools in England 2006–2009: A Research Note’, Journal of
Education Policy 25, no. 3 415–18.

64
Chote, Robert, Rowena Crawford, Carl Emmerson, and Gemma Tetlow.
2010a. “Public Spending Under Labour”. IFS BN92. IFS Election
Briefing Note. London: IFS.
———. 2010b. “The Public Finances 1997 to 2010”. IFS BN93. 2010
Election Briefing Notes. London: IFS.
Cummings, C., Dyson, A., Muijs, D., Papps, I., Pearson., D., Raffo, C.,
Tiplady, L., and Todd, L, with Crowther, D (2007) Evaluation of the
Full Service Extended Schools Initiative: Final Report . Research
Report 852. London: DCSF
Dearden, Lorraine, Carl Emmerson, C Frayne, and Costas Meghir. 2005.
“Education Subsidies and School Drop Out Rates.” London: Centre
for the Economics of Education.
Dickens, Richard. 2011. “Child Poverty in Britain, Did Work Work?” In The
Labour Market in Winter. Oxford: Oxford University Press.
Edwards, T. and Whitty, G. 1997, 'Specialisation and selection in secondary
education'. Oxford Review ofEducation, 23, (1), 5-15.
Eisenstadt, Naomi. 2011. Providing A Sure Start : How Government
Discovered Early Childhood. Bristol: The Policy Press.
Fothergill, Stephen. 2005. “A New Regional Policy for Britain.” Regional
Studies 39 (5): 659–667.
Francis, B. 2011. “(Un)satisfactory? Enhanching Life Chances by Improving
‘Satisfactory’ Schools.”
http://www.thersa.org/__data/assets/pdf_file/0007/563155/Unsatisfact
ory_schools_updated.pdf.
Gibbons, S. , McNally, S., Viarengo., M. (2011) Does Additional Spending
Help Urban Schools? An Evaluation Using Boundary Discontinuities . Centre for Economics of Education Discussion Paper 128. London:
CEE
Goldstein, H., and Noden, P. (2003), ‘Modelling Social Segregation’, Oxford
Review of Education 29, no. 2 ,225–37.
Gorard, S.,Taylor,C., and Fitz, J. (2003), Schools, Markets and Choice
Policies London: Routledge Falmer
Gordon, David, Joanna Mack, Stewart Lansley, Gill Main, Shailen Nandy,
Demi Patsios, and Marco Pomati. 2012. “The Impoverishment of the
UK.” Accessed May 30.
http://poverty.ac.uk/system/files/attachments/The_Impoverishment_of
_the_UK_PSE_UK_first_results_summary_report_March_28.pdf#ove
rlay-context=pse-research/pse-uk-reports.
Gregg, Paul, and Jonathan Wadsworth. 2011. The Labour Market in Winter.
Oxford: Oxford University Press.
Gregg, Paul, Jane Waldfogel, and Elizabeth Washbrook. 2006. “Family
Expenditures Post-welfare Reform in the UK: Are Low-income
Families Starting to Catch Up?” Labour Economics 13: 721–746.
Hanushek, E. A. (2008), Education Production Functions, in Steven N.
Durlauf and Lawrence E. Blume (eds.), The New Palgrave Dictionary
of Economics. Basingstoke: Palgrave Macmillan.

65
Harris,R (2010) Segregation by Choice? The Debate so Far. Working Paper
10/251. Bristol: Centre for Market and Public Organisation.
Hills, John. 2004. Inequality and the State /. Oxford University Press,.
———. 2005. “Counting the Family Silver: The Public Sector’s Balance
Sheet 1957-1987.” Fiscal Studies 10 (2): 66–85.
———. 2011. “The Changing Architecture of the UK Welfare State.” Oxford
Review of Economic Policy 27 (4): 589–607.
———. 2013. “Labour’s Record on Cash Transfers, Poverty, Inequality and
the Life Cycle”. Social Policy in a Cold Climate Working Paper WP05.
London: CASE.
Hills, John, Tom Sefton, and Kitty Stewart. 2009. A More Equal Society? :
Poverty, Inequality and Policy Since 1997. Bristol: Policy.
Holmlund, H., S. McNally, and M. Viarengo, (2010), ‘Does Money Matter for
Schools?’ Economics of Education Review. 29 (6): 1154-1164.
HM Treasury. 1999. “Analysising UK Fiscal Policy”. London: HM Treasury.
Jenkins, Stephen, A Brandolini, John Micklewright, and Brian Nolan. 2012.
The Great Recession and the Distribution of Household Incomes.
Oxford: Oxford University Press.
Jerrim, John. 2012. “The Socio-Economic Gradient in Teenagers’ Reading
Skills: How Does England Compare with Other Countries?” Fiscal
Studies 33 (2) (November): 159–184.
Lewis, J (2009) Work–family balance, gender and policy. Edward Elgar,
Cheltenham, UK.
Lindley, J and Machin, S. (2013) Wage Inequality in the Labour Years.
Oxford Review of Economic Policy 29:1, pp165-177
Lupton, Ruth, Alex Fenton, and Amanda Fitzgerald. 2013. “Labour’s Record
on Neighbourhood Renewal in England: Policy, Spending and
Outcomes 1997-2010”. Social Policy in a Cold Climate Working
Paper WP06. London: CASE.
Lupton, Ruth, and Polina Obolenskaya. 2013. “Labour’s Record on
Education: Policy, Spending and Outcomes 1997-2010”. Social Policy
in a Cold Climate Working Paper WP03. London: CASE.
Marmot, M. and Wilkinson, R. (2006) The Social Determinants of Health.
Oxford: Oxford: Oxford University Press
Massey, F. 2012a. “Public Service Productivity Estimates: Education 2010”.
Office for National Statistics.
http://www.ons.gov.uk/ons/dcp171766_261175.pdf.
———. 2012b. “Public Service Productivity Estimates - Healthcare 2010.”
http://www.ons.gov.uk/ons/dcp171766_289768.pdf.
NAO, 2009. Sure Start Children’s Centres – Memorandum for the Children,
Schools and Families Committee. National Audit Office, December
2009.
“New Labour : Because Britain Deserves Better.” 1997.
ONS. 2013. “Public Service Productivity Estimates: Total Public Services,
2010”. Titchfield: Office for National Statistics.
http://www.ons.gov.uk/ons/rel/psa/public-sector-productivity-

66
estimates--total-public-sector/2010/art-public-service-productivity-
estimates.html.
Rawnsley, Andrew. 2001. Servants of the People: The Inside Story of New
Labour. London: Penguin.
———. 2010. The End of the Party: The Rise and Fall of New Labour.
London: Penguin.
Sandel, M. (2012) The Moral Limits of Markets. London: Penguin
Sefton, Tom. 2009. “Moving in the Right Direction? Public Attitudes to
Poverty, Inequality and Redistribution.” In Towards a More Equal
Society? Policy, Inequality and Policy Since 1997, 223–244. Policy
Press.
Sefton, Tom, John Hills, and Holly Sutherland. 2009. “Poverty, Inequality and
Redistribution.” In Towards a More Equal Society? Policy, Inequality
and Policy Since 1997. Bristol: Policy Press.
SEU. 2001. “A New Commitment to Neighbourhood Renewal: National
Strategy Action Plan.”
Smithers, A. (2012) Confusion in the Ranks: How Good Are England's
Schools? London, Sutton Trust
Stewart, Kitty. 2013. “Labour’s Record on the Under-Fives: Policy Spending
and Outcomes 1997-2010”. Social Policy in a Cold Climate Working
Paper. London: CASE.
Sylva, K., Melhuish, E., Sammons, P., Siraj-Blatchford, I. and Taggart, B.,
2004. The
Effective Provision of Pre-School Education (EPPE) Project: Final Report. A
Longitudinal Study Funded by the DfES 1997-2004. Department for
Education and Skills.
Vizard, Polly, and Polina Obolenskaya. 2013. “Labour’s Record on Health:
Policy Spending and Outcomes 1997-2010”. Social Policy in a Cold
Climate Working Paper WP02. London: CASE
West, Anne (01/2010). "High stakes testing, accountability, incentives and
consequences in English schools". Policy and politics(0305-5736),
38(1), p.23
.

67
Appendix 1: Opportunity for All and Monitoring Poverty and Social Exclusion Indicators.
OFA Change in the last decade Change in last 5 years
Child
ren a
nd y
oung p
eople
Children in workless households n.a. Worse
Children in relative low income Better Mixed
Children in absolute low income Better Mixed
Children in persistent low income Better Mixed
Teenage pregnancy Better Better
Teenage parents in education, employment or training Better n.a.
Children from disadvantaged areas achieving good development Better Better
11 year olds attainment (KS2 maths and English) Better Better
16 year olds GCSEs attainment Better Better
Schools below floor target Better Better
19 year olds with at least a Lev 2 qualification Better Better
School attendance Better Better
Education gap for looked after children Worse Worse
NEET rate among looked after children No change No change
Stability in the lives of looked after children Better Better
16-18 year olds in education, training or employment Better Better
Infant mortality Better Better
Serious unintentional injury Better n.a.
Smoking among pregnant women Better Better
Smoking among children Better No change
Obesity among children Worse Better
Re-registration on child protection register No change No change
Housing below decency for children Better n.a.
Families with children in temporary accommodation Better Better
work
ing-a
ge p
eople
Employment rate Worse Worse
Employment of disabled people Better No change
Employment of lone parents Better No change
Employment of ethnic minority people Better Worse
Employment of people over 50 Better Better
Employment of the lowest qualified Worse Worse
Working-age people in workless households Better Worse
Working age people without a level 2 NVQ or higher Better Better
Proportion of people on long-period of income-related JSA Better Mixed
Working age people relative low income Better Worse
Working age people absolute low income Better No change
Working age people persistent low income Better No change
Adults smoking Better Better
Manual socio-economic group smoking Better Worse
Suicide rate Better No change
Rough sleepers Better No change
16-24 Using class A drugs No change Better
16-24 Using any illicit drug Better Better
Old
er
people
Older people: Relative Poverty Better Better
Older people: Absolute poverty Better Better
Older people: Continuous poverty Better Better
People contributing to non-state pension Worse Worse
People making continuous contributions to non-state pensions No change n.a.
Healthy life expectancy at age 65 Better Better
Receiving intensive home-based services Better n.a.
Receiving community based services Better n.a.
Housing below decency for elderly Better n.a.
Fear of crime among elderly Better n.a.
Com
munitie
s
Employment rates in deprived areas Better Worse
Crime rates in high-crime areas Better n.a.
Housing below decency Better Better
Households in fuel poverty Mixed Worse Life expectancy at birth between areas Worse Worse
Schools KS2 Attainment across areas Better Better
Road accident casualties in deprived areas Better Better

68
MOPSE Change in the last decade
Change in last 5 years
Lo
w inco
me
Child poverty (relative, AHC - supported by absolute) Better No change
Pensioner poverty Better Better
Working-age adults with children poverty rate No change Worse
Working-age adults without children poverty rate Worse Worse
Proportion of population in deep poverty (40% of median) Worse Worse
Income inequality Worse Worse
Children needing tax credits to escape low income Worse Worse
Number of people receiving out-of-work benefits Worse Worse
Material deprivation n.a. Worse
Ch
ildre
n
11-year-olds not attaining expected standards Better Better
16-year-olds not attaining five GCSEs at A*-C Better Better
Looked-after children not attaining five GCSEs Better Better
School exclusions Better Better
Infant mortality Better Better
Under-age pregnancy (under 16) Better n.a.
Low birth-weight babies Better Better
Yo
un
g
ad
ults Unemployment among young adults Worse Worse
Lacking qualification at 19 Better Better
Victims of crime (all ages) Better No change
With a crime record Better No change
Wo
rk
Unemployment and underemployment Worse Worse
Total JSA claimants Worse Worse
Rate of worklessness for lone parents Better No change
Rate of worklessness for disabled people Better No change
Number of children in workless households No change Worse
Households who have never worked Worse Worse
Proportion of employees who are low-paid Better No change
Pay inequalities between low-paid men and average No change No change
Pay inequalities between low-paid women and average Better No change Re-occurring unemployment (% starting new JSA claim within 6 months)
Worse Worse
Proportion of workless disabled people Better No change
Old
er
adu
lts
Poverty rates for ages 55-64 No change n.a.
Poverty rates for ages 65-74 Better n.a.
Poverty rates for ages 75+ Better n.a.
Non-take-up of benefits by pensioners Worse No change
Number of pensioners with no private income Better No change
Premature deaths in deprived areas Better Better
Disability-free life expectancy Better n.a.
Fear of crime (all ages) Better Better
Digital exclusion (all ages) n.a. Better
Lack of care by 'in deprived areas' Better n.a.
Ho
usin
g
Social housing poverty risk Better No change
Private rental poverty risk No change Worse
Housing costs as a proportion of income for low-income households Worse Worse
Number of loans in arrears n.a. Worse
Number of mortgage repossessions n.a. Worse
Number of households receiving HB or LHA Worse Worse
Risk of overcrowding in social or private rented accommodation Worse Worse
Rate of fuel poverty n.a. Worse
Number of households accepted as homeless Better Better
Sources: Authors’ update of Department for Work and Pensions Opportunity for All 2007 Update; New Policy Institute, Monitoring Poverty and Social Exclusion Indicators.