managing the family firm: evidence from ceos at … · managing the family firm: evidence from ceos...
TRANSCRIPT

Managing the Family Firm: Evidence from CEOs at Work⇤
Oriana Bandiera (LSE), Andrea Prat (Columbia), Ra↵aella Sadun (Harvard)
December 3, 2013
Abstract
CEOs a↵ect the performance of the firms they manage, and family CEOs seem to weaken it. Yet
little is known about what top executives actually do, and whether it di↵ers by firm ownership.
We study CEOs in the Indian manufacturing sector, where family ownership is widespread
and the productivity dispersion across firms is substantial. Time use analysis of 356 CEOs of
listed firms yields three sets of findings. First, there is substantial variation in the number of
hours CEOs devote to work activities, and longer working hours are associated with higher firm
productivity, growth, profitability and CEO pay. Second, family CEOs record 8% fewer working
hours relative to professional CEOs. The di↵erence in hours worked is more pronounced in low-
competition environments and does not seem to be explained by measurement error. Third,
di↵erence in di↵erences estimates with respect to the cost of e↵ort, due to weather shocks and
popular sport events, reveal that the observed di↵erence between family and professional CEOs
is consistent with heterogeneous preferences for work versus leisure. Evidence from six other
countries reveals similar findings in economies at di↵erent stages of development.
⇤Acknowledgements: We would like to thank Marianne Bertrand, Nick Bloom, Deepak Hegde, Luis Garicano,Lakshmi Iyer, Daniel Paravisini, Damon Phillips, Antoinette Schoar, Scott Stern, John Van Reenen, Daniel Wolfenzon,Chris Woodru↵, Julie Wulf, and participants at seminars in Bocconi, Columbia, Duke, Frankfurt, Harvard, LBS, LSE,Mannheim, Michigan, MIT, Munich, Northwestern, Queens Business School, EEA and NBER Summer Meetings foruseful comments. Our partnership with Renata Lemos and the support of Anjali Reina and Tanya Bijlani from theHBS India Research Center have been particularly important in the development of the project. Kashyap Shah hasprovided excellent research assistance. We would like to thank Columbia Business School, Harvard Business School,the International Growth Center, and the Kau↵man Foundation for their financial support. Corresponding author:Ra↵aella Sadun, Harvard Business School, Morgan 233, email: [email protected].
1

1 Introduction
The identity and characteristics of CEOs are known to matter for firm performance. In particular,
the comparison between CEOs who have a family a�liation with the owners of the firm they
manage and professional CEOs who do not, reveals that the former weaken firm performance.1
Given the ubiquity of family firms, understanding the root causes of this di↵erential has important
implications for aggregate income and growth (Caselli and Gennaioli 2013, La Porta et al 1999).
In this paper we provide evidence on a simple, yet critical, di↵erence between family and professional
CEOs: the time they devote to working for their firms. To do so, we develop a new survey
instrument to measure CEO time use in large samples. This allows us to provide quantitative
evidence on what CEOs do, whether it correlates with firm performance and whether it di↵ers by
ownership structure. We then combine the time use data with two natural experiments to test
whether di↵erences in time use are due to di↵erences in firm “technology” or organization, or to
di↵erences in motivation between family and professional CEOs.
We collect data on the time use of 356 CEOs of listed firms in the Indian manufacturing sector,
where family ownership is widespread (La Porta et al 1999) and the productivity dispersion across
firms is substantial (Hsieh and Klenow 2009). To measure time use we reconstruct the CEOs time
diary via daily phone interviews with their personal assistants over the course of one week. We
ask respondents to use their diaries to list sequentially all activities longer than fifteen minutes,
and for each activity we inquire about its type (meeting, phone call, etc.), the type and number
of people involved, the location, the start and end time, and scheduling horizon. This allows us
to build an accurate bottom-up estimate of how much time CEOs allocate to business activities
and how they allocate it to di↵erent activities. Our methodology is inspired by Mintzberg’s (1973)
celebrated analysis of a week of work of five CEOs, extended to a much larger and randomly drawn
sample.2 Compared to more commonly used recall methods, the time-diary method reduces the
impact of recollection biases that have been shown to be relevant in other surveys (Robinson et
al 2011). This notwithstanding, the time-diary method will also fail to capture some activities or
still allow respondents to overestimate the time they devote to other activities, so that the hours
of work recorded in our survey should be seen as a proxy of actual work hours.
We find that there is substantial variation in the number of recorded hours CEOs devote to work
activities: the average CEO in our sample spends 9 hours per day at work, while CEOs in the bottom
quartile work on average 6.9 hours per day and those in the top quartile work on average 10.7 hours
a day. To validate our measure of work hours, we match our time use data external measures of
1See survey by Bertrand 2009 and more detailed references below.2“Shadowing” exercises are common in the management literature but typically cover a handful of observations.
To the best of our knowledge, the most extensive CEO time use study is still Mintzberg’s (1973) seminal work, whichcomprises five CEOs. The largest observational dataset on top executives known to us – Kotter (1999) – includes 15general managers. The largest time use study of managerial personnel we are aware of is Luthans (1988), which covers44 mostly middle managers. None of them are CEOs. Some surveys ask large numbers of CEOs general questionsabout their aggregate time use (e.g. McKinsey 2013), but they are not based on an analysis of their agendas for aspecific time period. It is well known that time use perception and recollection can be very di↵erent from actual timeuse (Robinson et al 2011).
2

firm productivity, firm profitability, and CEO remuneration. We find a strong positive correlation
between the number of hours worked by the CEO, firm performance and CEO remuneration.
Controlling for other factors, a one standard deviation increase in hours worked is associated with
an increase in Total Factor Productivity of 17%, 0.027 percentage points in ROCE, and .137 higher
Tobin’s Q, and 26% in CEO total compensation.
We find a stark di↵erence between family and professional CEOs: family CEOs record 8% fewer
hours. In line with earlier work (Perez-Gonzalez 2006), family and professional CEOs di↵er on
observables, namely education, age and tenure. The di↵erence in hours, however, is not due to
observable di↵erences between family-run and professionally-run firms, or between family and pro-
fessional CEOs. Moreover, the external environment in which the firm operates, namely the specific
industry and state policies and infrastructure, does not explain much of the variation in time use
we observe in the data.
The rest of the paper explores the origin of the di↵erence in hours worked between family and
professional CEOs. One category of possible explanations for the di↵erence relates to measurement
error correlated with ownership. Family CEOs face less external pressure to be physically present in
the o�ce and might enjoy more flexibility in optimally organizing their time. This might generate
two types of measurement error. First, they might organize their time more e�ciently, for instance
by planning more activities in advance or meeting several people at once, so that the number of
recorded hours corresponds to more e↵ective hours. Second, family CEOs might be more likely to
work hours that our survey fails to capture. For instance, family CEOs might be more inclined
to work alone from home, or meet other family executives or external non business related events
outside the firm.
We present two tests to gauge whether measurement error can explain the observed di↵erences.
Our first test is based on the intuition that measurement error correlated with ownership, if any,
has precise implications for the hours we do record, and therefore we can exploit the granularity
of the data to test for these. For the first type of measurement error - i.e. di↵erential ability to
organize the time in the o�ce more e�ciently - we can test directly whether family CEOs plan more
activities in advance or meet several people at once. Our findings suggest the opposite: the share
of activities that are planned in advance, that involve several people or several distinct functions is
actually lower for family CEOs. For the second type of measurement error - i.e. di↵erential ability
to conduct working activities outside the firm - we can test whether the time allocation reveals that
the CEO does more in the o�ce of the activities he cannot do outside. For instance, if our concern
is that we record fewer hours of those actually worked because the CEO spends unrecorded time
working alone from home, we should observe him spending more time meeting people during the
time periods that are recorded in our survey. Likewise, if we record fewer hours because the CEO
spends unrecorded time out of the firm with third parties, we should observe him spending more
time with firm employees during the times recorded in our survey. Finally, if we record fewer hours
because the CEO spends unrecorded time meeting other top executives in the family home, we
should observe him spending more time with firm employees at lower rungs of the hierarchy, who
3

do not report directly to him, when he is in the o�ce. Again, the findings do not provide support
for any of these outcomes.
Our second test exploits cross industry di↵erences in the exposure to competition, which a↵ect
the marginal benefit of e↵ort but should be uncorrelated with di↵erence in measurement error
between the time use of family and of professional CEOs. The intuition behind the test is that if
the observed di↵erences in hours worked are driven entirely by di↵erences in measurement error,
they should not be a↵ected by factors that a↵ect incentives. In contrast, we find that the di↵erence
between family and professional CEOs is larger in firms that are not exposed to competition.
In light of these results, we analyze whether the observed di↵erence is due to di↵erences in tech-
nology or organization that make it optimal for family CEOs to work fewer hours, or to the fact
that family CEOs face a di↵erent tradeo↵ between leisure and work. A simple model illustrates
that, if CEOs’ work hours are an optimal response to technology or organization di↵erences corre-
lated with ownership, the di↵erence between family and professional CEOs should be una↵ected by
changes in the marginal return or the marginal cost of e↵ort common to both ownership types. In
contrast, if family CEOs choose to work less because they attribute a lower weight to the marginal
benefit of work (or, symmetrically, if their cost of e↵ort is higher), the di↵erence between family
and professional CEOs should increase as the marginal cost (benefit) of e↵ort increases (decreases).
We use natural experiments to study the work-leisure tradeo↵ between family and professional
CEOs. Our di↵erence in di↵erences estimator exploits changes in the marginal return or the
marginal cost of e↵ort a↵ecting all managers regardless of ownership structure. To measure variation
in the marginal cost of e↵ort, we use instances of extreme monsoon rainfall and the broadcasting of
popular sport events (International Premier League cricket games) across days of the sample week.
The two tests depict a consistent picture: the di↵erence between family and professional CEOs is
significantly larger on days when torrential rains or cricket matches increase the marginal cost of
e↵ort.
In fact, all the patterns we observe are consistent with a simple preference story. Compared to
their professional counterpart, family CEOs have on average more wealth and job security, and
therefore place higher weight on personal leisure than firm performance. This would explain why
they spend less time at work, especially when going to work is costlier. Market pressure reduces
family CEOs’ job security and future rents, which explains why they take less time o↵ when they
operate in a competitive environment. Of course other factors may be at work too, but the patterns
we observe – di↵erences in hours worked and allocation of time across activities, the relationship
with competition, the e↵ect of monsoon rains and cricket matches – are di�cult to explain unless
the leisure-performance tradeo↵ di↵ers between family and professional CEOs. Our wealth/security
e↵ect is consistent with Malmendier and Tate’s (2009) finding that award winning CEOs, who earn
more, devote more time to leisure at the expense of managing their firms.
The question that follows naturally from this is why family CEOs do not delegate to professionals
who are willing to work longer hours and generate higher profits for the firm owners. Delegation
might be prohibitively costly in countries with poor contract enforcement like India, but if delegation
4

costs entirely explain why family CEOs stay at the helm of their firms, we should observe no
di↵erence in the time use of family and professional CEOs in richer countries. Intuitively, when
delegation is feasible all family CEOs who have a higher marginal utility of leisure should delegate,
and the only family CEOs who do not should work as hard as professional CEOs. To investigate
this issue and to provide evidence on the external validity of our results, we analyze the di↵erences
in time use data between family and professional CEOs for a large sample of firms in Brazil,
Britain, France, Germany and the United States. While we do find that the share of family CEOs
is much larger in countries with worse governance (as in Burkart et al. 2003), the di↵erence in
hours worked by professional and family CEOs has the same sign and is of the same order of
magnitude as in India. Some CEOs may prefer to lead their firms even when delegation to hard
working professionals would be feasible, which is in line with them enjoying non-monetary benefits
of control (Demsetz and Lehn 1985, Bandiera et al 2013). Our international comparison indicates
that, while the share and, possibly, the raison d’etre of family-run firms vary across countries, there
is a systematic di↵erence in the work patterns of family and professional CEOs even beyond India.
The time use patterns we observe - taken together with the association between time use and firm
performance - provide a possible explanation for the fact that firms led by family CEOs generally
underperform (Morck et al 2000, Villalonga and Amit 2006, Perez-Gonzalez 2006, Bennedsen et al.
2007, Bertrand et al 2008, Bertrand 2009). Our findings complement the observation that family
CEOs adopt worse managerial practices (Bloom and Van Reenen 2007) and adopt a management
style that is less conducive to shareholder value maximization (Mullins and Schoar 2013). In line
with these literatures, our time use analysis shows that the incentives arising from having a higher
stake in the firm are o↵set by other factors that induce less e↵ort from the part of family CEOs.
More broadly, our research illustrates one channel through which CEOs impact firm performance
(Bertrand and Schoar 2003, Kaplan et al 2012, Malmendier and Tate 2005, 2008, Schoar and Zuo
2012). Finally, the paper is related to the strand of work emphasizing the importance of preferences
in explaining di↵erences in managerial e↵ort (Bertrand and Mullainathan, 2003, Malmendier and
Tate 2009).
Our analysis underscores the importance of managerial attention. As in Geanakoplos and Milgrom
(1991), firm performance depends on what activities managers devote their limited attention to.
As time is a proxy of attention, our approach provides direct evidence on CEO attention patterns.3
The paper is organized as follows. Section 2 describes our sampling and data collection methodology,
together with the characteristics of CEOs and their firms. Section 3 provides evidence on the
relationship between time use, firm performance and CEO compensation. Section 4 tests whether
family and professional CEOs use their time di↵erently. Section 5 implements the di↵erence in
di↵erence estimator to interpret the observed di↵erences between family and professional CEOs.
Section 6 compares the di↵erence between family and professional CEOs in a cross-section of seven
3Ocasio (1997) presents an attention-based view of the firm. Attention constraints can be generated by di↵erentcognitive limits. For instance, attention relates to information acquisition in Geanakoplos and Milgrom (1991),information processing in Radner and Van Zandt (1992), communication in Bolton and Dewatripont (1994), andproblem solving in Garicano (2000). See Garicano and Prat (2013) for a survey.
5

countries. Section 7 concludes.
2 Sample Selection and Survey Methodology
2.1 Sampling Frame
Our sampling frame consists of all listed manufacturing firms based in India and is drawn from
ORBIS, an extensive commercial data set that contains company accounts for the population of
listed Indian firms. Starting from the universe of manufacturing firms, in the Appendix we explain
how we select those with su�cient accounting data and for which we could find contact details. Out
of a sample of 1,429 companies, we were able to collect detailed time diaries for 356 CEOs, with a
response rate of 25%. This figure is higher than standard CEO surveys, which range between 9%
and 16% (Graham et al 2011).4
The selection analysis in Table A1 shows that firms in the final sample have on average slightly
lower log sales (a di↵erence of 1.8%, significant at the 1% level). However, we do not find any
significant selection e↵ect on performance variables, such as return on capital employed (ROCE)
return on assets (ROA) and profits over sales.5
The interview was conducted with the highest-ranking authority in charge of the organization that
has executive powers and reports to the board of directors. This position is commonly titled chief
executive o�cer (CEO) in the US, and managing director (MD) in Canada and in the UK. As both
titles are used in India, and the same title can mean di↵erent things in di↵erent firms, to maintain
comparability we selected individuals based on their job description rather than their o�cial title.
For brevity we refer to them as CEOs in what follows.
2.2 The CEO Time Use Survey
The time use survey took place between May 1st and July 31st 2011. For each CEO we collected
time use data over one randomly selected week during that period. This avoids biases arising from
endogenous week choice, for instance due to the fact that CEOs might prefer to report time use
during atypical weeks.
To measure time use we asked respondents to enumerate all the activities in the order they happened
during the day, and to report detailed information about each. Project analysts collected this
information through daily phone calls with the Personal Assistant (PA) of the CEO. On the first day
of the week, the analyst would call the PA in the morning, in order to gather detailed information
on all the activities planned in the CEO diary for the day. The analyst would call again in the
evening, to gather information on the actual activities undertaken by the CEO (hence checking
o↵ activities that were planned but did not happen), and the activities planned for the following
4The criteria for inclusion in the sampling frame and the survey methodology are detailed in the Data Appendix.5We cannot compare firm size since this is typically not reported in the Indian accounting data.
6

day. The second day, the analyst would call the PA only in the evening, again to collect data on
the actual activities undertaken during the day, and the planned agenda for the next day. This
pattern would continue until the end of the week. Compared to the alternative recall method
where individuals are asked to estimate their time at work and its allocation across activities, the
time-diary approach reduces the impact of recollection biases that have been shown to be relevant
in other surveys (Robinson et al 2011).6 On the last day of the data collection, the analysts were
instructed to talk directly with the CEO for about 30 minutes to make sure that the activity data
collected through the PA was accurate.
For each activity longer than 15 minutes we collect information on starting and ending time, type
of activity (e.g. meeting, work alone, attending a public event, traveling etc.), location, number
and type of participants involved. The participants are classified according to their employment
relationship to the firm (insiders or outsiders), their function (e.g. production or finance for insiders,
suppliers or banks for outsiders). For activities involving insiders, we also know whether the activity
included only people reporting directly to the CEO, or if it included employees across lower levels
of the firm’s hierarchy. Finally, we also inquire about the planning horizon of the activity: whether
it was planned in advance and, if so, how long in advance, and if it was undertaken due to an
emergency. Figure A1 shows a screenshot of the survey tool.7
Two concerns are of note. First, a week of detailed activity data might not be enough to capture
typical CEO behavior. The allocation of time across activities might just be a reflection of high
frequency shocks to the marginal cost or marginal product of time across CEOs. If so, the time use
data would capture the relevance of these shocks, rather than explicit managerial choices. If this
were true, however, we would expect little similarity in the way the time is allocated within the
week by the same CEO (no within week autocorrelation in CEO time use). In fact, as we report
below, we find a high degree of autocorrelation in CEO choices over the week of observation, and
CEO fixed e↵ects explain 24% of the variance observed in the daily time use data. Furthermore,
at the end of the survey week, we also ask the CEOs to rank whether the week could be considered
“representative” of their usual work activity on a scale 1-10. Reassuringly, we observe substantial
heterogeneity in time use even if we restrict the sample to the 60% of CEOs who score the survey
week as highly representative (9 or 10 out of 10). This is at odds with the hypothesis that all
observed variation is due to shocks rather than actual di↵erences in behavior.
Second, we are able to measure only the activities that the PA knows about or the CEO is willing to
report. The sign of the bias this creates is ambiguous. CEOs might indeed be prone to overestimate
the hours they work, e.g. by coding time spent in personal activities as work. At the same time,
we will not pick up activities that take place out of business hours unless they are recorded in the
CEO diary.
Our working assumption throughout is that the time use we measure is a valid proxy of the actual
6Robinson et al (2011) compare the time use estimates obtained by ex-post time-use survey questions in theCPS with time diaries from the American Time Use Survey, and conclude that ex-post recollection methods tend togenerate over-estimates of the time at work, especially in subjects who tend to work longer hours.
7The survey tool can also be found online on www.executivetimeuse.org.
7

time use and captures meaningful di↵erences across CEOs. To validate this assumption, in Section
3 we present evidence that our time use measure is correlated with external measures of firm
performance and CEOs’ compensation.
2.3 Descriptive Statistics: Firms and CEOs
Table 1 reports means and standard deviations on key characteristics of sample firms and their
CEOs. Most firms (58%) are owned by a family (i.e. the owners are a�liated to the original founder
of the firm, second generation onwards), followed by founders (20%) and disperse shareholders
(14%).8 Two thirds of CEOs in our sample belong to the family who owns the firm (16% are
founders, 51% are 2nd generation onwards, overall 90% of founder and family firms). The managers
of these firms are labeled as family CEOs. One third are CEOs not related to the owners, and
these are labeled as professional CEOs.
We matched our survey data with ORBIS, which contain information on employees, inputs, sales,
ROCE, Tobin’s q, and growth, and with PROWESS, which contains information on CEO pay. Table
1, Panel B shows that the average firm in our sample has 1,225 employees, but the distribution is
skewed to the left, as the median firm has 450, and the firm at the 75th percentile has 1000. 81%
of the firms in sample export their products and 16% are subsidiaries of foreign multinationals.
The sample firms are located in fifteen di↵erent states. Among these, Maharashtra has the highest
concentration (36%) followed by Gujarat (15%). Figure 1 illustrates the distribution of firms by
state.
Table 1, Panel C shows that the average CEO is 51 years old and has been holding the same position
for 13 years, and working for the same firm for 19. This is partly determined by the fact that, as we
saw in Panel A, 67% of CEOs belong to the family who owns the firm, and most firms are family
owned, and these have longer tenures as CEOs (15 years). The average tenure of professional CEOs
is however also long - the professional CEOs in our sample have an average tenure of 8 years and
have been with the firm for 15.9 96% of the CEOs hold at least a college degree, and 41% also
hold an MBA and about a third have experience working or studying abroad. A sizable minority
also holds positions in other firms (29%) or sits on other firms’ boards (42%). Finally, our sample
includes only five women and two non-Indian CEOs.
2.4 Descriptive Statistics: Time Use
Table 2, Panel A, illustrates that the average CEO reports activities for 5.26 days and spends 8.8
hours per day at work on average. As discussed above, some work activities may inevitably not
be recorded by the CEO or the PA on our survey tool (e.g. extemporaneous after dinner work),
8Smaller ownership groups are government (2.2%), private equity/ venture capital (1.4%) and private individualswho are not founders or heirs to the founders of the company (4.4%).
9As a comparison, in a random sample of 122 CEOs based in the UK and the US for which we were able to collecttime use data, the average tenure in the company for professional CEOs is 6.5 years and on average they have beenin the firm for 12.
8

so that our time measure should be seen as a lower bound of the total hours worked by the CEO.
Of these, 8.3 hours a day are spent in activities that last longer than 15 minutes each and are
thus recorded by our analysts. Seventeen percent of these activities are classified as “personal”, i.e.
non-business related, and travel.
Figure 2 illustrates that there is considerable variation in hours worked. Executives in the bottom
quartile of the distribution work on average 6.9 hours per day while executives in the top quartile
work on average 10.7 hours a day. The data also reveals that the distribution of work hours is
balanced across business days.10
There is a high degree of autocorrelation in the average number of hours worked during the week
by the CEOs. A simple regression of the number of log(hours worked) on day t on the same
variable measured on day t-1 delivers a coe�cient of .30, statistically significant at the 1% level.11
Therefore, while there is day-by-day variation in the number of hours worked by the CEO (which
we will exploit in Section 5), the data also shows a high degree of consistency in the level of e↵ort
chosen by the CEO within the survey week.
The granularity of the time use data allows us to look at di↵erences in the allocation of time across
di↵erent activities and function, conditional on the total number of hours worked by the CEO
during the week. Given that daily hours are naturally bounded, these shares are informative of
the di↵erences in the attention dedicated by the CEO to di↵erent types of activities. The data is
summarized in Table 2, Panel B.
In line with earlier studies of managerial behavior (Mintzberg, 1973), the majority of CEO time
(67%) is spent in structured business interactions that include face to face meetings, phone calls,
and teleconferences; working alone and informal work interactions (such as public events, busi-
ness meals) account for 26% and 7% of CEO time respectively. These averages, however, mask
substantial heterogeneity as illustrated in Figure A2.
To measure the ability of the CEO to organize his time via advance planning, and to engage in
“complex” interactions, Table 2, Panel B reports the share of time devoted to pre-planned activities
and activities involving several participants and/or functions at a time. We find that the average
CEO spends one in three hours in activities that were not planned in advance. The percentage is
the same for activities that involve the CEO alone or with other people, suggesting that a sizable
share of meetings is not pre-planned.12 CEOs are also very di↵erent in their propensity to involve
multiple functions and participants in their interactions. On average, 67% of the meetings involves
just another participant, and 75% just another function, but similarly to other aspect of CEO time
10CEOs work on average fewer hours as the week progresses. The average number of hours on Mondays is 7.25 vs.6.74 on Fridays.
11Another way to evaluate the autocorrelation of CEO choices during the week is to look at the fraction of thevariation in the daily CEO averages of the time use data accounted for by CEO fixed e↵ects. We find that CEOfixed e↵ects account for about 24% of the variation in the data vs. 4% when only state and industry fixed e↵ects areincluded.
12Neither the mean nor the variation is due to CEOs whom we interview in an “unusual” week. The 60% of CEOswho score the survey week as highly representative spend a sizable 30% of their time in unplanned activities and theshare increases to 36% those who score the week as not perfectly representative.
9

use, we report significant variation across CEOs along these dimensions (Figure A3).
Finally, Table 2, Panel B shows that the average CEOs spends 58% of his time with employees
of the company. 13% of the time is spent alone and 29% just with outsiders, but time allocation
along this dimension also varies substantially across CEOs. 34% of CEO time involves exclusively
people reporting directly to him, and again we find significant heterogeneity across CEOs (Figure
A4). Not surprisingly for manufacturing firms, the largest share of CEOs time, 19% on average, is
dedicated to production followed by sales and finance and the share of time that CEOs dedicate to
these di↵erent functions exhibits considerable variation (Figure A5).
3 Time Use, Firm Performance and CEO Pay
To validate our measure of hours worked, we test whether this is correlated with external measures
of firm performance derived from public accounts data. While in the absence of exogenous variation
in time use we cannot identify its causal impact on performance, establishing whether the two are
correlated is a powerful mean to validate whether our time use data capture meaningful di↵erences
(as opposed to noise) across CEOs.
We use panel data at the firm-year level to estimate a basic production function of the form:
yit = ↵llit + ↵kkit + ↵mmit + ↵hhi + �0Zit + uit (1)
Where yit are sales, lit is labor, kit capital, mit materials of firm i at time t and lower case letters
denote natural logarithms. We estimate the correlation between firm i performance and its CEO
average daily hours worked, denoted by hi. To the extent that our measures reflect time use shocks
that hit in that particular week or biases in reporting time use that are orthogonal to yearly firm
outcomes, the estimated coe�cients will be biased towards zero.
The accounting data are extracted from accounts published on ORBIS. We restrict the analysis to
the years in which the manager we interviewed actually had the role of CEO, and for each firm we
keep the three most recent years in the data to avoid selection on CEOs with longer tenure. In
our basic specification we also control a full set of industry, state and year dummies and a vector
of noise controls.13 In what follows we report OLS estimates of equation (1) with standard errors
clustered at the firm level to account for correlated shocks within the same firm through time.
3.1 CEO Time Use and Firm Performance
The results of the analysis are presented in Table 3. Column 1 regresses log sales at the firm level
on log of average daily hours worked in the week including only log employees, year dummies and
noise controls as additional covariates. Hours worked are significantly and positively associated
13These are a dummy to denote cases in which the data was collected by the PA (rather than the CEO himself),15 interviewer dummies, a dummy to denote CEOs who formally report to an Executive Chairman, 6 dummies tocontrol for the week in which the interview was collected, and a score given by the CEO to rank the representativenessof the work week.
10

with firm level labor productivity. A 1% increase in the number of weekly hours worked by the
CEO is associated with a 1.04% increase in productivity. In column 2 we augment the specification
with capital, materials, and a full set of dummies to control for di↵erences in the states in which
the firms is headquartered and the industry of activity (three digits SIC dummies) to evaluate
the correlation between CEO hours worked and Total Factor Productivity (TFP). The association
between the time use variables and productivity is large and precisely estimated: a 1% change in
weekly hours worked is associated with a 0.75% increase in productivity. A standard deviation
increase in CEO log hours worked (0.23, or 1.25 hours per week) is associated with an increase in
productivity of 0.75*0.23=17%, which amounts to 8% of a standard deviation in the distribution
of log sales observed in our data. For comparison, a standard deviation increase of log capital is
associated with a 60% increase in productivity, and 30% of a standard deviation of log sales.
A concern is that the correlation between hours worked and productivity is driven by measure-
ment error in the time use data. For instance, more productive firms might hire more talented
PAs who keep a more complete record of the CEOs’ activities, thus creating a spurious correlation
between hours recorded and productivity, while the underlying correlation between hours worked
and productivity is zero. To test the practical relevance of this concern, in Column 3 we regress
productivity on hours devoted to travel. Intuitively, if the correlation due to PAs in more pro-
ductive firms recording more hours, non-work activities should also be positively correlated with
productivity. The findings in Column 3 allay this concern: the correlation between productivity
and time spent traveling is zero.
Finally, column 4 shows that hours worked are also associated with faster sales growth: a 1%
increase in hours worked is associated with 0.1% faster sales growth over a 5 years window.
3.2 CEO Time Use and Profits
A question of interest is whether the advantages of having a hard working CEO are competed away,
namely if CEOs capture the entire surplus they generate by working longer hours. To shed light
on this, we test whether time use is correlated to firm profitability and, in the next subsection, to
CEO remuneration.
Columns 5 and 6 estimate equation 1 using two measures of firm profitability: the return on capital
employed (ROCE) and Tobin’s q. Our measure of hours worked is positively correlated with both.
The magnitude of the estimates implies that a standard deviation increase in CEO log hours worked
is associated with an increase in ROCE (Tobin’s q) of .027 (.137) which amounts to 14% (15%) of
a standard deviation in the distribution of ROCE (Tobin’s q) observed in our data.
3.3 CEO Time Use and Pay
For the final validation test, we match our data on time use with data on CEO remuneration
published in the company accounts, which is available for two thirds of our sample firms. Table 4
11

shows that the time use variables are both strongly and positively correlated with CEO remuner-
ation. These results are largely robust to the inclusion of observable measures of firm and CEO
characteristics, such as age, cognitive skills (as proxied by a dummy capturing whether the CEO
holds an MBA degree) and tenure in the firm (column 2). Column 2 shows that a 1% change
in CEO hours worked is associated with 0.96% change in total CEO remuneration. This implies
that a standard deviation increase in hours worked increases pay by .22 log points, that is 15%
of the standard deviation of log pay in our sample. The association between time use and CEO
remuneration generally holds for both the fixed and the variable component of pay (columns 3 and
4), although the correlation between hours worked and variable pay is not precisely estimated.
Taken together, the positive correlations between our time use measure and productivity, prof-
itability and pay provide reassuring evidence that, while we cannot possibly record all the work
activities CEOs engage in, our measure of hours worked captures meaningful di↵erences in working
activities across CEOs. We now turn to using this data to assess whether family and professional
CEOs devote di↵erent hours to work for their firms.
4 Family vs. Professional CEOs: Cross-Sectional Di↵erences in
Hours Worked
In this section we analyze the di↵erence in hours worked across family and professional CEOs. We
note that a priori the di↵erences are ambiguous. On the one hand, family CEOs can appropriate
a larger share of the surplus they generate, as they co-own the firm, hence have a stronger interest
in generating large profits through their e↵ort. On the other hand, family CEOs are likely to
have more job security and more wealth (as they co-own the firm), both factors leading to valuing
personal leisure relatively more than firm performance. Moreover, being selected from a narrower
pool, family CEOs might have fewer of the skills that are complementary to e↵ort (Burkart et
al 2003, Perez-Gonzalez 2006). The existing evidence indicates that family CEOs have generally
been found to underperform compared to professional managers, both in terms of firm performance
(Bennedsen et al. 2007, Bertrand et al 2008, Bertrand 2009, Morck et al 2000, Perez-Gonzalez
2006, Villalonga and Amit 2006) and managerial capabilities (Bloom and Van Reenen, 2007). We
contribute to this debate by showing whether they choose to work fewer hours.
To this end, we estimate a simple regression model of the form:
hi = ↵Fami + Ci� + Fi� + Si� + Ii⌘ + "i (2)
Where hi is the log of total weekly hours worked by CEO i, Fami = 1 if firm i is owned by a family
and the CEO belongs to the family, while Fami = 0 if firm i is led by a professional CEO regardless
of ownership status 14 and, C,F, S, I are vectors of CEO, firm, state and industry characteristics.
We include CEOs characteristics that might be correlated with the income vs. leisure trade-o↵
14While ideally we would want to also look separately at family firms run by professional managers, in practice weare limited by the fact that we have only 23 of them in our sample.
12

that determines labor supply, namely the age and tenure of the CEO, and a dummy to distinguish
CEOs with an MBA. We use these to capture di↵erences in hours worked due to demographics
and cognitive skills. We also include a dummy to capture CEOs who have managerial roles in
other organizations, since this could crowd out time at work. To absorb di↵erences driven by firm
characteristics that are correlated with ownership, we control for size (log of employees, collected
during the interview process) and firm age (since older firms in general tend to be larger), whether
the firm operates in global markets (either through exports or by being part of a multinational)
and a full set of two digits SIC industry dummies. State and industry characteristics are included
to proxy for di↵erences in the external environment that shapes the objectives and constraints of
the CEOs.
4.1 Main Result: Family CEOs Work Fewer Hours
We analyze the di↵erence in hours worked between family and professional CEOs in Table 5. We
start by looking at unconditional di↵erences in column 1. We first look separately at founder CEOs
and 2nd+ generations CEOs. We find that, unconditionally, founder CEOs and 2nd+ generations
CEO record 11% and 6.6% fewer hours than professional CEOs, respectively.
One possible explanation for this result is simply ownership-related di↵erences in CEO demograph-
ics and skills and other observable firm characteristics (Burkart et al 2003, Perez-Gonzalez 2006).
Indeed, Table A2 shows that, in line with earlier findings, family CEOs have lower formal qual-
ifications: the share of CEOs with an MBA degree is 36% among family CEOs and 51% among
professional CEOs (p-value=.01). Family CEOs are also slightly younger (50 vs 52), have longer
tenure (15 vs 8 years) and are more likely to hold managerial positions in other firms (32% vs 23%).
Table 5, column 2, however, shows that the di↵erence between family and professional CEOs is
robust to the inclusion of these additional firm and CEO controls. While CEO hours are higher
in larger and older firms and in multinational organizations, this does not explain the di↵erence
between family CEOs and others. Similarly, CEO hours are strongly correlated with CEO age -
although not with CEO skills and tenure - but this does not explain the di↵erence between family
CEOs and others. Controlling for firm and CEO characteristics column 2 shows that founder CEOs
and 2nd+ generations CEO record 8% and 6.6% fewer hours than professional CEOs, respectively.
That 2nd generations and founder CEOs make similar choices, which di↵er from those made by
professional CEOs, is consistent with recent findings that both adopt worse managerial practices
(Bloom et al 2012) and that they share a similar business philosophy and firm governance (Mullins
and Schoar 2013). Given that the di↵erence between founders and 2nd generation CEOs is small
and not precisely estimated (p-value=.57), for the sake of parsimony we combine both in a single
indicator in what follows.15
Column 3 analyses whether the di↵erence between family and professional CEOs is driven by
di↵erences in the external environment in which their firms operate. As Indian states exhibit
15All results are robust to including Family and Founder CEOs separately. These results are shown in tables A3-A7.
13

considerable variation in infrastructure and policies that might a↵ect time use, we first analyzed
a set of key variables measuring the level of development (log GDP per capita, log average wages,
log length of surfaced roads measured in Km), variables related to the rigidity of labor market
regulation (as measured by OECD, 2007) and the level of financial development (measured by the
log of the number of o�ces of commercial banks in the state), but found them to be all individually
and jointly uncorrelated with the number of hours worked by the CEO, and with the di↵erence
between family and professional CEOs. To test the relevance of state level characteristics on CEO
hours more generally, in column 3 we include state level fixed e↵ects, which turn out to be jointly
insignificant at conventional levels (pvalue=0.72). In line with this, the majority (80%) of the
heterogeneity in CEO hours is within states, rather than between them. Column 3 also includes
a full set of 2 SIC digits industry dummies - which are jointly significant at the 10% level - and
noise controls (jointly significant at the 1% level). None of these controls (even when included
individually) altered the main result.
In summary, we find that family CEOs devote fewer hours to working for their firms relative to
professional managers, both unconditionally and conditionally on a host of firm, CEO, industry,
state and measurement variables. This di↵erence is statistically significant and large in magnitude:
family CEOs work 8.6% fewer hours than professional managers.
Given the results shown in Table 3 and 4 (namely the positive association between hours worked,
firm performance and CEO compensation), the di↵erences in hours worked between family and
professional CEOs are consistent with di↵erences in the work-leisure trade o↵ governing labor sup-
ply between the two types of managers. However, the observed cross-sectional di↵erences might
also be generated by measurement error correlated with ownership, or be an optimal response to
unobservable di↵erences in business environments or organizational structures. We use two strate-
gies to evaluate the relative importance of these alternative explanations. In the next subsection
we exploit the granularity of the data to test the implications of measurement error; in the follow-
ing section we exploit natural experiments that create exogenous variation in the cost of e↵ort to
separate optimal responses from di↵erences in preferences.
4.2 Measurement Error and Time Allocation
The e↵ective hours CEO i devotes to managing the firm he is in charge of, hEi , is linked to our
measure of hours recorded, hRi , as follows
hEi = hRi + ⌫i (3)
where ⌫i is measurement error. The findings in 4.1 indicate that the average di↵erence of hours
recorded between family f and professional p CEOs is negative (hRf � hRp < 0); equation 3 makes
clear that this might occur even when e↵ective hours are the same or larger (hEf � hEp > 0) as long
as ⌫f > ⌫p, that is, when measurement error is larger for family CEOs.
14

This could be due to the fact that since family CEOs face less external pressure to be physically
present in the o�ce and that other executives belong to the same family, they might organize their
time di↵erently both in the o�ce and outside. First, as they do not have to be in the o�ce “nine
to five” family CEOs might organize their time there more e�ciently, for instance by planning
more activities in advance or meeting several people at once, so that the number of recorded hours
corresponds to more e↵ective hours. Second, family CEOs might work more hours alone from
home, or meet other family executives or external non business related events outside the firm. To
the extent that these activities are not recorded in their diaries and otherwise not known by the
PA (e.g. an extemporaneous meeting with their CFO brother over breakfast), family CEOs might
work hours that our survey fails to capture.
Our strategy to tackle these issues has two prongs. Our first test is based on the intuition that
measurement error correlated with ownership, if any, has precise implications for the hours we do
record, and therefore we can exploit the granularity of the data to test for these. For the first type
of measurement error - i.e. di↵erential ability to organize the time in the o�ce more e�ciently -
we can test directly whether family CEOs plan more activities in advance or meet several people
at once. Columns 1-3 in Table 6 suggest the opposite: the share of activities that are planned in
advance, that involve several people or several distinct functions is actually lower for family CEOs
relative to professional managers. For the second type of measurement error - i.e. di↵erential ability
to conduct working activities outside the firm - we can test whether the time allocation reveals that
the CEO does more of the activities that cannot be done outside the o�ce. For instance, if our
concern is that we record fewer hours of those actually worked because the CEO spends unrecorded
time working alone from home, we should observe him spending more time meeting people when his
time use is observed. Likewise, if we record fewer hours because the CEO spends unrecorded time
out of the firm with third parties, we should observe him spending more time with firm employees
when his time use is observed. Finally, if we record fewer hours because the CEO spends unrecorded
time meeting other top executives in the family home we should observe him spending more time
with firm employees at lower rungs of the hierarchy, who do not report directly to him, when his
time use is observed. Columns 4-6 in Table 6 do not support these predictions either. We find that
family CEOs devote the same share of time to meetings, the same share to direct reports and a
smaller share to firm employees.
Our second strategy is to test whether the di↵erence between family and professional CEOs is
sensitive to factors that a↵ect managerial incentives to exert e↵ort, but that are uncorrelated
with measurement error. In particular, we exploit cross industry di↵erences in the exposure to
competition as a factor a↵ecting the marginal benefit of work. Intuitively, ine�cient firms are more
likely to survive if they are shielded by competition, thus CEOs incentives to work are reduced in
these settings. Di↵erences in competition, however, should not a↵ect the di↵erence in measurement
error between the time use of family and of professional CEOs. Thus, if the observed di↵erences
in Table 5 are driven entirely by di↵erences in measurement error, they should not be a↵ected by
factors that a↵ect incentives.
15

In contrast, we find that the di↵erence between family and professional CEOs is larger in firms that
are not exposed to competition. This is shown in Table 5, columns 4 and 5, in which we use as a
proxy for competition a dummy denoting industries which are characterized by high levels of the
inverse of the Lerner Index.16 Higher competition is associated with a 6% increase in CEO hours
worked (column 4), and the variable is significant at the 5% level, which is consistent with the
idea that exposure to competition increases managerial e↵ort (Bertrand and Mullainathan, 2003).
However, the e↵ect of competition is particularly strong for family CEOs: column 5 shows that
the interaction between the high competition dummy and the dummy denoting family CEOs is
positive and significant (coe�cient 0.106, standard error 0.056). This result is at odds with the
hypothesis that the di↵erence between family and professional CEOs is solely due to di↵erences in
measurement error, unless these di↵erences decrease with competition.
Taken together, the findings in Table 6 and Table 5, columns 4 and 5, cast doubt on the hypothesis
that the observed di↵erences between family and professional CEOs are solely driven by measure-
ment error and are supportive, instead, of the existence of a real di↵erence in terms of hours worked.
The next section attempts to establish whether this is due to di↵erent preferences, or to optimal
responses to unobservable organizational/ technological di↵erences.
5 Family vs. Professional CEOs: Di↵erence in Di↵erences Esti-
mates
To provide evidence on whether observed di↵erences between family and professional CEOs are
optimal responses to unobservable organizational or technological di↵erences or symptomatic of a
di↵erent preference for leisure, we employ a di↵erence in di↵erences estimator that exploits variation
in the cost of e↵ort. Our empirical strategy is best illustrated by a simple model where the work
time of the CEO is endogenously determined.
5.1 A Simple Model of CEO Time Use
The goal of the model is not to do justice to the literature on managerial incentives in corporate
governance (Tirole 2006), but to supply a parsimonious set-up to discuss the identification problem
we face when interpreting the di↵erence in hours worked by family and professional CEOs.
The model contains two main elements: a production function that depends on CEO work time in
ways that depend on the characteristics of the CEO and the firm and a specification of the CEO
preferences. Time is taken as a proxy for CEO attention, which as in Milgrom and Geanakoplos
(1991) can be seen as a factor of production. Starting with technology, the productivity of a firm
is given by:
16The Lerner Index is the industry level average of the ratio between profits and sales, and its inverse is frequentlyused as a proxy for industry level exposure to competition (Bloom and Van Reenen, 2007, Bloom et al, 2012). In thissetting we use as a proxy for competition a dummy denoting industries which are in the upper third of the distribution.See the Data Appendix for additional details on the construction of this variable and summary statistics.
16

ygs = ygs + (ag + bs)hts �1
2h2ts,
where g 2 {F,N} indicate the governance structure – family or non-family – and s 2 {L,H}denotes a binary state of the world, to be discussed later. The firm’s performance ygs depends on
the number of hours that the CEO spends on business activities, hgs. The marginal productivity
of a CEO hour depends on governance and the state through ag and bs. The negative quadratic
term captures the idea that the marginal return of CEO time is decreasing.
The firm’s performance may also depend directly on the governance and on the state through ygs.
The only restriction that our formulation imposes, by having additive ag and bs rather than a
generic ags, is that the identity of the CEO does not interact directly with the marginal e↵ect of
CEO time on performance given external and transitory shocks, such as rain or cricket.17 Instead,
we do not take a stand on whether family firms are intrinsically more or less productive than non-
family firms: yFs can be greater or smaller than yNs. We also remain agnostic as to whether CEO
time is more useful in family or non-family firms, or alternatively whether family CEOs are more
productive: aF can be greater or smaller than aN .
The CEO’s utility depends on the performance of the firm and on the cost of spending time at
work:
ugs = cgy � dshgs,
where cg represents the relative weight of firm performance and labor time in the preference of a
CEO in governance g and ds captures the possibility that the cost of work depends on the state of
the world.
Do family CEOs put more or less weight on performance or time, namely is cF greater than cN?
A priori, the answer is ambiguous. On one hand, family CEOs have more direct interest in the
performance of the firm and they may also care about its success for non-monetary reasons. On the
other hand, wealth e↵ects may make the marginal utility of leisure higher for family CEOs than
for professional CEOs. Also, lazy professional CEOs are more likely to lose their job. The goal of
this short theoretical section is to describe a set of conditions under which time use data identifies
the sign of the di↵erence between cF and cN .
Given his technology and preferences, the CEO maximizes his payo↵ by selecting the following
number of hours:
h⇤gs = ag + bs �dscg
,
This illustrates that the cross-sectional di↵erence between the hours worked by family and pro-
fessional CEOs does not identify the di↵erence between cF and cN . For example, the marginal
productivity of a professional CEO is di↵erent from that of a family CEO, perhaps because a
17In the empirical analysis we include a battery of robustness checks to test directly whether the elasticity toexternal shocks displayed by family CEOs is driven by di↵erences in firm characteristics (e.g. industry, state, sizeetc.) or CEO demographical di↵erences, and find no evidence to support this hypothesis. We also include a tripledi↵erences specification that exploits di↵erences in the elasticity to the shocks within family CEOs.
17

family CEO can delegate more to other family members.
However, things change if we have labor supply shock. Suppose that the cost of labor in one state
of the world is higher than in the other: dH>dL. Note that a change in the state of the world may
a↵ect the marginal productivity of CEO work, though bs. On average, CEOs may work more or
less in state H. For instance, bad weather may make it more important that the CEO comes to
work to deal with emergencies. However, we can show that the sign of the di↵erence-in-di↵erences
coe�cient depends on the preference parameter cg only:
Proposition 1. The di↵erence in di↵erences in hours worked over governance and state has
the same sign as the di↵erence in the relative preference of family CEOs and professional CEOs.
Formally, h⇤FL � h⇤FH > h⇤NL � h⇤NH if and only if cN>cF .18
Empirically, we exploit two natural experiments that a↵ect the cost of e↵ort: monsoon rain and
popular cricket matches. The underlying assumption is that the cost of working during severe
monsoon rain (state H) is larger than on other days (state L) and that the value of leisure is larger
(and hence the cost of e↵ort larger) when there are important televised cricket matches (state H)
rather than not (state L). In all cases, Proposition 1 predicts that the di↵erence-in-di↵erences over
governance and state will have the same sign as the di↵erence in preference weights between family
and professional CEOs.
5.2 Monsoons
Informed by Proposition 1, we collect information on shocks to the cost of e↵ort during our sample
week. To do so we take advantage of the fact that approximately 70% of the time use data was
collected during the monsoon season, measured as the o�cial date in which the monsoon rainfall
started in the state where the headquarters of the firm are located.19 Extreme monsoon rainfall
is notoriously unpredictable and it disrupts local transportation in urban areas (where most of
the CEOs in our sample are located), adding delays and inconveniences. Assuming that all CEOs
would commute from home to the o�ce on a normal working day, we see rainfall as a factor that
exogenously a↵ects their cost of e↵ort by making travel uncomfortable and creating delays on the
way to and from work.
We proceed in four steps. First, we obtain rainfall data for all the major weather stations in India
starting in May through the end of July 2011. Second, we use this data to compute the average
station level rainfall in the pre-monsoon period in May, and for each station level observation in
June and July we compute the percentage di↵erence in rainfall with respect to the pre-monsoon
18Proof. Given the optimal h and the assumption that dH>dL,
sign [h⇤FL � h⇤
FH � (h⇤NL � h⇤
NH)] = signhdHcF
� dLcF
� dHcN
+ dLcN
i
= signh�⇣
1cN
� 1cF
⌘(dH � dL)
i= sign [cN � cF ]
19The expected arrival of the monsoon is around June 1st, starting from the southwestern coast of Kerala, andgradually covering the entirety of India by July 15th.
18
period. Third, we define a given day to have extreme rain if its deviation from the May benchmark
falls in the upper third of the station level distribution of the same variable. Fourth, we match the
CEO time use information with the rainfall data of the closest weather station by using the modal
(manually collected) zip code of the activities undertaken by the CEO during the week. Further
details on the constructions of these variable is provided in the Data Appendix.
As expected, the stations included in our dataset experienced a significant increase in rainfall in
the weeks following the onset of the monsoon in their respective state. Average weekly rainfall
increased on average by 15% in the two weeks following the onset of the monsoon, and this trend
tapered down in subsequent weeks. Most importantly, we observe variation in extreme rainfall
within the week of observation. Although weeks closer to the onset of the monsoon experienced a
higher fraction of extreme rainfall days during the week, this fraction is close to only 40% at peak
monsoon levels, so that in a given week extreme rain only occurred on some days.
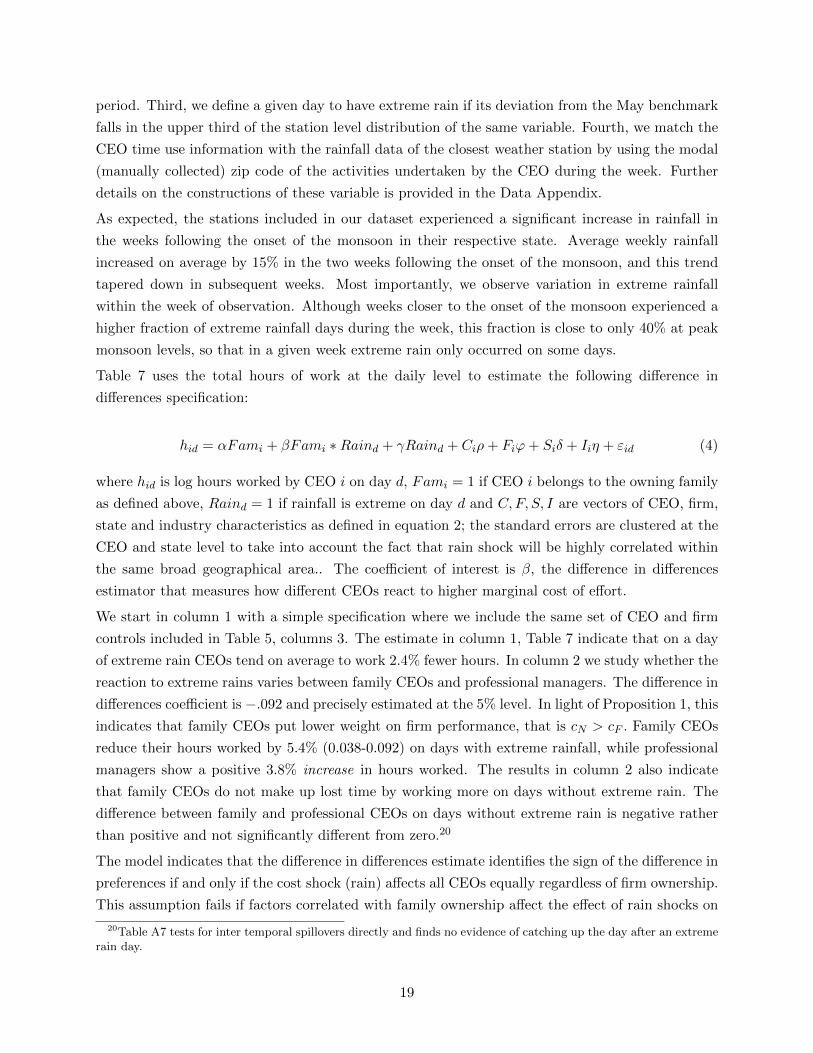
Table 7 uses the total hours of work at the daily level to estimate the following di↵erence in
di↵erences specification:
hid = ↵Fami + �Fami ⇤Raind + �Raind + Ci⇢+ Fi'+ Si� + Ii⌘ + "id (4)
where hid is log hours worked by CEO i on day d, Fami = 1 if CEO i belongs to the owning family
as defined above, Raind = 1 if rainfall is extreme on day d and C,F, S, I are vectors of CEO, firm,
state and industry characteristics as defined in equation 2; the standard errors are clustered at the
CEO and state level to take into account the fact that rain shock will be highly correlated within
the same broad geographical area.. The coe�cient of interest is �, the di↵erence in di↵erences
estimator that measures how di↵erent CEOs react to higher marginal cost of e↵ort.
We start in column 1 with a simple specification where we include the same set of CEO and firm
controls included in Table 5, columns 3. The estimate in column 1, Table 7 indicate that on a day
of extreme rain CEOs tend on average to work 2.4% fewer hours. In column 2 we study whether the
reaction to extreme rains varies between family CEOs and professional managers. The di↵erence in
di↵erences coe�cient is �.092 and precisely estimated at the 5% level. In light of Proposition 1, this
indicates that family CEOs put lower weight on firm performance, that is cN > cF . Family CEOs
reduce their hours worked by 5.4% (0.038-0.092) on days with extreme rainfall, while professional
managers show a positive 3.8% increase in hours worked. The results in column 2 also indicate
that family CEOs do not make up lost time by working more on days without extreme rain. The
di↵erence between family and professional CEOs on days without extreme rain is negative rather
than positive and not significantly di↵erent from zero.20
The model indicates that the di↵erence in di↵erences estimate identifies the sign of the di↵erence in
preferences if and only if the cost shock (rain) a↵ects all CEOs equally regardless of firm ownership.
This assumption fails if factors correlated with family ownership a↵ect the e↵ect of rain shocks on
20Table A7 tests for inter temporal spillovers directly and finds no evidence of catching up the day after an extremerain day.
19

the marginal cost or the marginal product of CEO time, namely cov("id,Fami ⇤ Raind) 6= 0. For
example, firms run by family CEOs might be more prevalent in industries or states that are more
susceptible to the disruption caused by the monsoons, or they might have characteristics that
make them more prone to be disrupted by rain (for example, due to the presence of old machinery
or bad maintenance processes), or the CEOs themselves might have characteristics that might
disproportionately increase their cost of e↵ort with extreme rain.
To test robustness to these factors, columns 3 to 6 augment the specification with additional CEO
and firms controls and interactions between rain and state, industry CEO and firm characteristics,
respectively. We find that the e↵ect of rain shocks does vary by state and industry - in columns 3
and 4, the industryXrain and stateXrain interactions are jointly significant, p=.00), but this does
not alter the magnitude and the significance of the Family CEOXrain interaction. Furthermore,
we find no evidence that rains interacts with firm and CEO characteristics (column 5) or firm
characteristics (column 6), with the exception of the dummy denoting exporting firms, which is
positive and significant when interacted with the rain dummy. Reassuringly, the inclusion of these
interactions does not a↵ect the magnitude and precision of the di↵erence in di↵erence estimate
allaying the concern that this captured unobservables at the id level.
Finally, to account for unobservables correlated with ownership, we once more exploit the hetero-
geneity observed within family CEOs according to the exposure to competition in their industry.
The triple di↵erence specification allows us to evaluate the e↵ect of the rain shock within family
CEO firms (high or low competition). The result of this analysis is shown in columns 7 and 8.
Column 7 shows that the rain shock is reaction to the rain shock is much lower for CEOs working in
more competitive industries (measured with the high competition dummy used in Table 5, columns
4 and 5). Column 8 shows that - while on average family CEOs are still much more reactive to
rain shocks - this e↵ect is much weaker for family CEOs exposed to competition.
5.3 Cricket Matches
The second natural experiment we exploit to implement the test in Proposition 1 is daily variation
in the broadcasting of cricket games. Cricket is the most popular sport in India, drawing large
audiences across the country. For this test we take advantage of the fact that our data collection
partially overlapped with the playo↵s, semifinals and finals of a major cricket tournament, the
Indian Premier League (IPL). Table 8 reports the estimates of
hid = ↵Fami + �Fami ⇤ Cricketd + �Cricketd + Ci⇢+ Fi'+ Si� + Ii⌘ + "id
where Cricketd = 1 if a match is played on day d and all other variables are as defined in equation 4.
Given the importance of rain shocks, we also include as an addtional control the dummy capturing
days of intense rain. Furthermore, we cluster standard errors at the CEO, day level.
Column 1 shows that the presence of a cricket match is associated with a 7% decline in hours
worked by the CEOs. In line with the earlier estimates, the di↵erence in di↵erences � in column
2 is negative (�.088) and significant at the 10% level. In light of Proposition 1, this indicates
20

that family CEOs put lower weight on firm performance, that is, cN > cF . Family CEOs reduce
their hours worked by 10% (-0.015-.088) on days with cricket matches, while professional CEOs are
una↵ected by these. The results in column 1 also indicate that family CEOs do not make up lost
time by working more on days without cricket matches, indeed the di↵erence between family and
professional CEOs on days with no matches is negative and precisely estimated. Table A8 tests
for inter temporal spillovers directly and finds no evidence of catching up the day after a cricket
match.
Since IPL games are generally held in the evenings, we can use the exact timings of activities to
investigate the adjustment in hours worked and the di↵erentials between family and professional
CEOs in response to the game. To do so, we divide the work day in two intervals, before and
after 3PM. This analysis (shown in columns 3 and 4) shows that professional CEOs increase their
hours worked in advance of cricket games, while they tend to work significantly less in the hours
immediately preceding the game (from 3PM onwards). In contrast, family CEOs work fewer hours
throughout the day. So while all CEOs reduce hours to watch the match in the afternoon, pro-
fessional CEOs compensate by working harder before, while family CEOs do not. Finally, in line
with the robustness checks of Table 7, Table 9 allows for a rich set of interactions between cricket
matches and CEO, firm, industry and state characteristics. The conclusions are robust to these
more flexible specifications - in all cases the interaction between the dummy denoting important
cricket games and family CEOs is negative and significant.
Taken together, the results in this section cast doubt on the explanation that di↵erences in hours
worked are optimal responses to di↵erences in technology, and rather point to the fact that the
leisure-performance tradeo↵ di↵ers between family and professional CEOs. While family CEOs
generally have a larger stake in the firms they manage, compared to their professional counterparts,
they also have on average more wealth and job security, and therefore place higher weight on
personal leisure than firm performance.
6 Cross-country Comparisons
The results in sections 4 and 5 naturally beg the question why family CEOs do not delegate to
professionals who are willing to work longer hours and generate higher profits for the firm owners,
including the CEO. One possibility is that delegation is prohibitively costly in countries with poor
contract enforcement like India (Bloom et al 2013). If delegation costs entirely explain why family
CEOs stay at the helm of their firms, we should observe no di↵erence in the time use of family and
professional CEOs in richer countries. Intuitively, when delegation is feasible all family CEOs who
have a higher marginal utility of leisure should delegate to hard working professionals and enjoy the
extra profits these generate, while the only family CEOs who choose not to delegate should work
as hard as professional CEOs. To investigate this issue and to provide evidence on the external
validity of our results, we analyze the di↵erences in time use data between family and professional
CEOs for a large sample of manufacturing firms in Brazil, Britain, France, Germany, Italy, and the
21

United States.
The total number of CEOs is 759, of which 281 are in Brazil and the remaining 478 are evenly
distributed between the other four countries. The sampling methodology and the data collection
protocol are identical to the one used in India and were collected in the Spring of 2013. The Indian
analysis cannot be fully replicated because most of those firms are not listed and there are no
obvious labor-supply related natural experiments. However, the data allows us to report the raw
di↵erence in hours worked between family and professional CEOs, which we report in Table 10,
both pooled and divided by country level income.
In line with the idea that family management helps overcome weak legal institutions (Burkart et al
2003) we find that the prevalence of family firms in our sample drops with the level of development:
from 67% in India to 41% in Brazil and 21% in the high-income countries. The di↵erence between
family and professional CEOs in terms of hours worked during the sample week, however, remains
stable: .086 in India, .118 in Brazil and .087 in the high-income countries, precisely estimated in
all cases.
This reassures us that the pattern in hours worked and the di↵erentials between family and pro-
fessional CEOs documented in this paper are generalizable to a larger sample of firms in both high
and low-income economies. Moreover, the fact that some CEOs prefer to lead their firms even
when delegation to hard working professionals would be feasible suggests that they must enjoy
non-monetary benefits of control (Demsetz and Lehn 1985, Bandiera et al 2013).
7 Discussion
This paper investigates di↵erences in hours worked by family CEOs and professional (i.e. non
family a�liated) CEOs. The main finding is that family CEOs work fewer hours. The di↵erence is
unlikely to be due to measurement error, because recorded hours of family CEOs include a greater
shares of the activities that would be more likely to be underreported (unplanned meetings, one-
on-one meetings, activities with outsiders) and because the di↵erence in hours worked decreases
when the firm is subject to competitive pressure. Natural experiments - exposure to monsoon rain
and cricket games - indicate that family CEOs are more responsive to shocks that increase the cost
of providing e↵ort. All these patterns can be accounted for by a di↵erence in the preferences of
family and professional CEOs, with the former placing a higher relative weight on leisure, which
could be due to either a wealth e↵ect or job security.
The data also reveals a strong correlation between CEO hours and firm performance. While no
causal inference can be made, combining this correlation with the e↵ect of ownership on hours
translates into a 5.8% productivity di↵erence between family and professional CEOs. The behav-
ioral di↵erence is hence a potential candidate to account for the performance di↵erential between
family and non-family firms documented in the literature (Morck et al 2000, Villalonga and Amit
2006, Perez-Gonzalez 2006, Bennedsen et al. 2007, Bertrand et al 2008, Bertrand 2009).
22

More generally, the evidence presented here highlights the importance of how corporate leaders
allocate their limited managerial attention (Milgrom and Geanakoplos 1991, Garicano and Prat
2013). Attention is a scarce resource and particularly so at the top of the organization. The
allocation of time reflects the allocation of attention, which in turns depends on the strategic
priorities of the CEO. The importance for e↵ective corporate leaders of aligning their own time
management to their goals has been a cornerstone of leadership theories for many years (Drucker
1966). According to Simon (1976), “attention is the chief bottleneck in organizational activity,
and the bottleneck becomes narrower and narrower as we move to the tops of organizations.” The
present paper provides evidence on the causes, features, and correlates of CEO attention allocation.
We see this paper as a first step in a growing research agenda based on detailed information on the
activities of CEOs. More research is necessary to understand the determinants and e↵ects of the
behavior of corporate leaders across low- and high-income economies.
23

References
[1] Bandiera, Oriana, Luigi Guiso, Andrea Prat, and Ra↵aella Sadun, “Matching Man-
agers, Firms and Incentives,” (2013) forthcoming, Journal of Labor Economics.
[2] Bennedsen, Morten, Kasper Meisner Nielsen, Francisco Perez-Gonzalez and Daniel
Wolfenzon, “Inside the Family Firm: The Role of Families in Succession Decisions
and Performance,” Quarterly Journal of Economics, 122 (2007), 647-691.
[3] Bertrand, Marianne. “CEOs.” Annual Review of Economics, 1, no. 1 (2009), 121-50.
[4] Bertrand, Marianne and Sendil Mullainathan, “Enjoying the Quiet Life? Corporate
Governance and Managerial Preferences,” Journal of Political Economy, 111 no. 5
(2003), 1043-1075.
[5] Bertrand, Marianne and Antoinette Schoar, “Managing with Style: The E↵ect of
Managers on Firm Policies,” Quarterly Journal of Economics, 118 (2003), 1169-1208.
[6] Bertrand Marianne, Simon Johnson, Krislert Samphantarak and Antoinette Schoar,
“Mixing Family with Business: A Study of Thai Business Groups and the Families
Behind Them,” Journal of Financial Economics, 88 (2008), 466–498.
[7] Bloom, Nicholas and John Van Reenen, “Measuring and Explaining Management
Practices across Firms and Countries,” Quarterly Journal of Economics, 122, no. 4
(2007) 1351-1408.
[8] Bloom, Nicholas and John Van Reenen, “Why Do Management Practices Di↵er across
Firms and Countries?,” Journal of Economic Perspectives, 24 no. 1 (2010), 203-24.
[9] Bloom, Nicholas, Benn Eifert, Aprajit Mahajan, David McKenzie and John Roberts,
“Does Management Matter? Evidence from India,” Quarterly Journal of Economics,
128, no. 1 (2013), 1-51.
[10] Bloom, Nicholas, Christos Genakos, Ra↵aella Sadun, and John Van Reenen, “Manage-
ment Practices Across Firms and Countries,” Academy of Management Perspectives,
26 no. 1 (2012), 12-33.
[11] Bolton, Patrick and Mathias Dewatripont, “The Firm as a Communication Network,”
The Quarterly Journal of Economics, 109, no. 4, (1994), 809-839.
[12] Burkart, Mike C., Fausto Panunzi, and Andrei Shleifer, “Family Firms,” Journal of
Finance, 58, no. 5, (2003), 2167-2202.
[13] Caselli, Francesco and Nicola Gennaioli, “Dynastic Management”. Economic Inquiry,
51, no. 1, (2013), 971-996.
24

[14] Demsetz, Harold, and Kenneth Lehn, “The Structure of Corporate Ownership: Causes
and Consequences,” Journal of Political Economy, 93, no. 6 (1985), 1155-1177.
[15] Drucker, Peter F., The E↵ective Executive, (1966), New York:Harper & Row.
[16] Garicano, Luis, “Hierarchies and the Organization of Knowledge in Production,” Jour-
nal of Political Economy, 108, no. 5 (2000), 874-904.
[17] Garicano, Luis and Andrea Prat, “Organizational Economics with Cognitive
Costs,”Advances in Economic Theory, Econometric Society 10th World Congress, D.
Acemoglu, M. Arellano, E. Dekkel, (2013) Cambridge: University Press,
[18] Geanakoplos, John and Milgrom, Paul, “A Theory of Hierarchies based on Limited
Managerial Attention,” Journal of the Japanese and International Economies, 5, no.
3 (1991), 205-225.
[19] Graham, John R., Cam Harvey, and Manju Puri, Capital Allocation and Delegation
of Decision-Making Authority within Firms, NBER Workin Paper 17370, (2011).
[20] Hsieh, Chang-Tai and Peter J. Klenow, “Misallocation and Manufacturing TFP in
China and India,” The Quarterly Journal of Economics, 124, no. 4, 2009, 1403-48.
[21] Kaplan, Steven N., Mark M. Klebanov and Morten Sorensen, “Which CEO Charac-
teristics and Abilities Matter?” Journal of Finance, 67, no. 3 (2012), 973-1007.
[22] Kotter, John P. What E↵ective General Managers Really Do. Harvard Business Re-
view, March-April (1999), 145-159.
[23] La Porta, Rafael, Florencio Lopez-De-Silanes and Andrei Shleifer, ”Corporate Own-
ership Around the World,” Journal of Finance, 54, no. 2 (1999), 471-517.
[24] Luthans, Fred, “Successful vs. E↵ective Real Managers,” Academy of Management
Executive, 2, no. 2 (1988), pp. 127-132
[25] Malmendier, Ulrike and Geo↵rey Tate, “CEO Overconfidence and Corporate Invest-
ment,” Journal of Finance, 60 (2005), 2660-2700.
[26] Malmendier, Ulrike and Geo↵rey Tate,“Who Makes Acquisitions? CEO Overconfi-
dence and the Market’s Reaction,” Journal of Financial Economics, 89 (2008), 20-43.
[27] Malmendier, Ulrike and Geo↵rey Tate, “Superstar CEOs,” Quarterly Journal of Eco-
nomics, 124, no. 4 (2009), 1593-1638.
[28] Mintzberg, Henry, The Nature of Managerial Work, (1973), New York: Harper &
Row.
25

[29] McKinsey, “Making Time Management the Organization’s Priority,” McKinsey Quar-
terly, January 2013.
[30] Morck Randall K., David A. Stangeland, and Bernard Yeung, “”InheritedWealth, Cor-
porate Control and Economic Growth: The Canadian Disease,” InConcentrated Cor-
porate Ownership, ed. Randall K. Morck, (2000), 319–69, Chicago:University Chicago
Press.
[31] Mullins, William and Antoinette Schoar, “How do CEOs see their Role? Management
Philosophy and Styles in Family and Non-Family Firms,”NBERWorking Paper 19395,
2013.
[32] Ocasio, William., “Towards an Attention-based View of the Firm,” Strategic Manage-
ment Journal. 18, (1997), 187-206.
[33] OECD, “Economic Surveys of India,” (2007).
[34] Perez-Gonzalez, Francisco, “Inherited Control and Firm Performance,” American Eco-
nomic Review, 96, no. 5 (2006), 1559-1588.
[35] Radner, Roy and Timothy Van Zandt, “Information Processing in Firms and Returns
to Scale.” Annales d’Economie et Statistique, 25/26 (1992), 265-298.
[36] Robinson, John, Steven Martin, Ignace Glorieux and Joeri Minnen, “The Overesti-
mated Workweek Revisited,”Monthly Labor Review, June (2011).
[37] Schoar, Antoinette and Luo Zuo, “Shaped by Boom and Busts: How the Economy
Impacts CEO Careers and Management Style,” NBER Working Paper 17590, 2012.
[38] Simon, Herbert, “Adminsitrative Behavior,” New York, NY, The Free Press (1976).
[39] Tirole, Jean, “The Theory of Corporate Finance,” Princeton University Press, January
(2006).
[40] Villalonga Belen and Raphael Amit, “”How do Family Ownership, Control and Man-
agement A↵ect Firm Value?” Journal of Financial Economics, 80, (2006), 385–417.
26
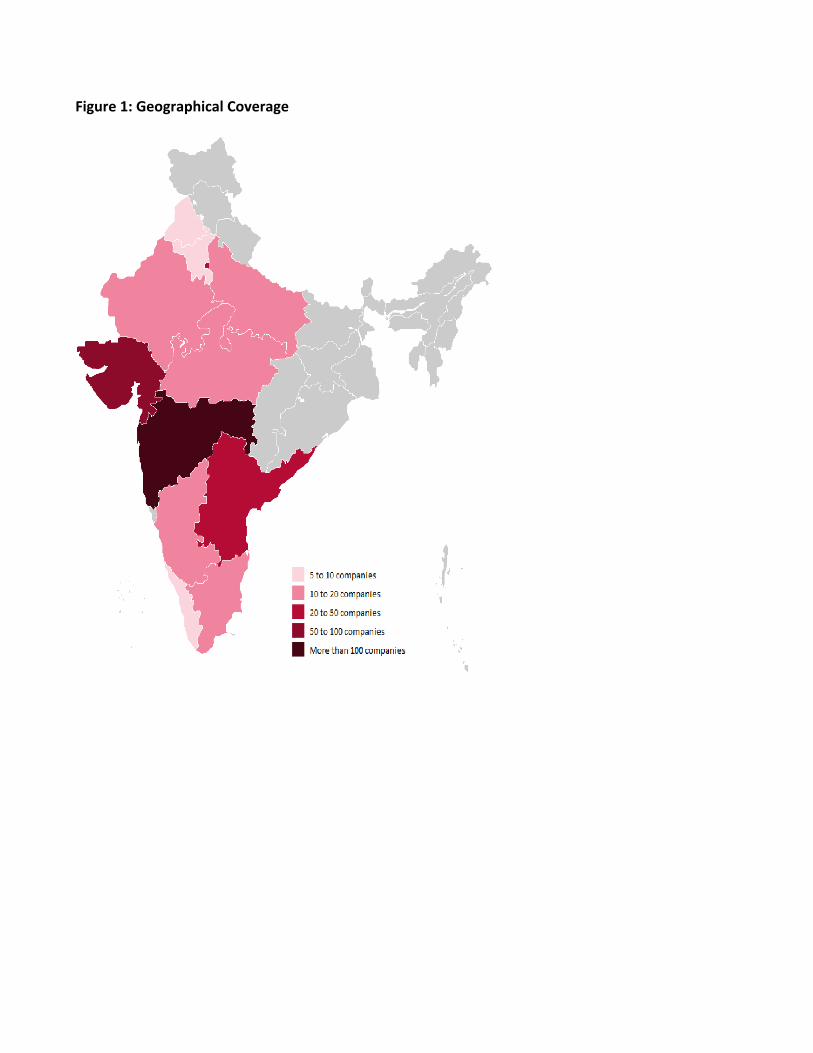
Figure'1:'Geographical'Coverage

Figure'2:'Average'daily'hours'at'work0
.05
.1.1
5.2
Frac
tion
4 6 8 10 12 14Average daily hours at work

Table&1:&Firm&and&CEO&characteristics
Panel&A:&Ownership
Mean Median Standard&deviation
P25 P75
Number&of&firms&with&available&
informationFounder's*Successor*CEO 0.51 1 0.50 0 1 356Founder*CEO 0.16 0 0.37 0 0 356
Panel&B:&Firm&CharacteristicsExport 0.81 1 0.39 1 1 356Domestic*or*Foreign*Multinational 0.17 0 0.37 0 0 356Number*of*employees 1225.57 450 4231.13 200 1000 355Sales*per*Employee 118.94 47.78 306.20 17.41 123.84 319Capital*per*Employee 43.91 12.34 114.44 5.07 40.10 295Materials*per*Employee 63.10 26.29 90.63 10.22 71.56 282Sales*Growth*(5*years) 0.13 0.12 0.21 0.05 0.22 291ROCE 0.14 0.13 0.17 0.06 0.21 302Tobin's*q 0.99 0.64 1.02 0.49 0.95 259
Panel&C:&CEOAge 50.61 52 9.64 42 57 356Male 0.99 1 0.12 1 1 356College*degree 0.96 1 0.19 1 1 356MBA 0.41 0 0.49 0 1 356Tenure*as*CEO* 12.76 11 9.72 4 20 356Tenure*in*firm 19.05 19 10.59 11 26 356Experience*abroad 0.33 0 0.47 0 1 356Holds*position*in*other*firms 0.29 0 0.45 0 1 355Sits*on*other*boards 0.42 0 0.50 0 1 353

Table&2:&Time&Use&&Descriptives
A.&Hours&at&work
Mean MedianStandard&Deviation P25 P75
Number&of&days&at&work 5.26 5.00 0.51 5.00 5.00Mean&daily&hours&at&work 8.79 8.73 1.51 7.75 9.67Mean&daily&hours&at&work&minus&activities&<&15&mins 8.27 8.17 1.47 7.27 9.25Mean&daily&hours&at&work&minus&activities&<&15&mins,&personal&&&travel 6.85 6.82 1.44 5.85 7.75
B.&Time&Allocation
Mean MedianStandard&Deviation P25 P75
Share&of&time&spent&in&business&interactions 0.67 0.68 0.15 0.58 0.78Share&of&time&spent&in&planned&activities 0.73 0.76 0.19 0.62 0.88Share&of&time&spent&with&multiple&functions 0.27 0.25 0.18 0.13 0.38Share&of&time&spent&with&many&participants 0.35 0.34 0.19 0.21 0.48Share&of&time&spent&with&firm&employees 0.58 0.57 0.18 0.47 0.72Share&of&time&spent&with&production 0.19 0.17 0.13 0.09 0.27Share&of&time&spent&with&direct&reports 0.34 0.33 0.18 0.20 0.46

Table&3:&CEO&Hours&Worked&and&Firm&Performance(1) (2) (3) (4) (5) (6)
Dependent&Variable Growth&(Sales,&5&years,&%)
Profitability&(ROCE,&%)
Tobin's&q
ln(CEO&Hours&Worked) 1.043** 0.747** 0.105* 0.121** 0.596**(0.472) (0.359) (0.055) (0.047) (0.299)
ln(1+CEO&Hours&Travel) .0.004(0.072)
Ln(Employment) 0.898*** 0.367*** 0.379*** 0.002 .0.015* 0.266***(0.089) (0.092) (0.093) (0.012) (0.008) (0.070)
Ln(Capital) 0.303*** 0.306*** .0.009 .0.021** .0.103*(0.048) (0.049) (0.012) (0.010) (0.055)
ln(Materials) 0.448*** 0.452*** 0.041*** 0.033*** .0.054(0.054) (0.055) (0.011) (0.008) (0.051)
Ln(Firm&age) .0.031 .0.059 .0.033 0.014 0.319**(0.144) (0.142) (0.025) (0.018) (0.140)
MNE .0.104 .0.028 0.023 .0.019 0.348*(0.197) (0.198) (0.031) (0.026) (0.186)
Export 0.047 0.075 .0.025 0.063*** .0.084(0.206) (0.214) (0.036) (0.024) (0.186)
CEO&works&for&other&firms .0.245* .0.264* .0.046** .0.017 0.022(0.132) (0.136) (0.023) (0.018) (0.111)
Ln(CEO&age) 0.099 0.008 .0.106 .0.032 0.771**(0.477) (0.466) (0.072) (0.049) (0.372)
Ln(1+CEO&tenure&in&firm) .0.040 .0.058 0.039* 0.020 .0.291*(0.115) (0.113) (0.023) (0.021) (0.151)
Dummy&CEO&MBA 0.052 0.079 .0.042 0.030 0.133(0.145) (0.145) (0.028) (0.019) (0.115)
Constant 0.223 .2.438 0.579 .0.010 .2.579** .5.159***(1.683) (2.217) (1.688) (0.348) (1.127) (1.605)
RYsquared 0.445 0.786 0.783 0.239 0.159 0.498Observations 1287 1287 1287 807 790 685Number&of&firms 317 317 317 291 300 259Noise&controls y y y y y yYear&dummies y y y y y yIndustry&dummies y y y y yState&dummies y y y y yNotes: *significant at 10%; ** significant at 5%; *** significant at 1%. All columns estimated by OLS. In all columns standard errorsunder coefficient are clustered by firm. The variable "CEO Hours Worked" is the log of the total hours the CEO devoted to workactivities during the survey week. The dependent variable in columns 1 and 2 is the log of sales; in column 3, growth of sales over thepast 5 year; in column 4, Return on Capital Employed (ROCE); in column 5, Tobin's qs. Accounting data run between 2007 and 2011.Eeach column includes a full set of year dummies. We include only years in which the CEO was in office, and allow for a maximum ofthree years of accounts for each firm (3 most recent years with non missing data in ORBIS). Noise controls include: a dummy forconsolidated accounts, a dummy to denote if the time use data was recorded through the PA or by the CEO himself; 15 interviewerdummies; a dummy to denote CEOs who formally report to an executive Chairman; 7 dummies to control for the week in which thedata was collected; a self reported score given by the CEO to rank the representativeness of the week. CEO controls include: a dummydenoting CEOs who report being employed as managers also in other firms, log of CEO age, log of CEO tenure in the company, adummy denoting that the CEO holds an MBA. Firm controls include: a dummy to denote multinational and/or exporting firms and thelog of firm age. Industry dummies are 71 three digits SIC codes. State dummies are 15 indicators denoting the state in which the firm isheadquartered.
ln(Sales)
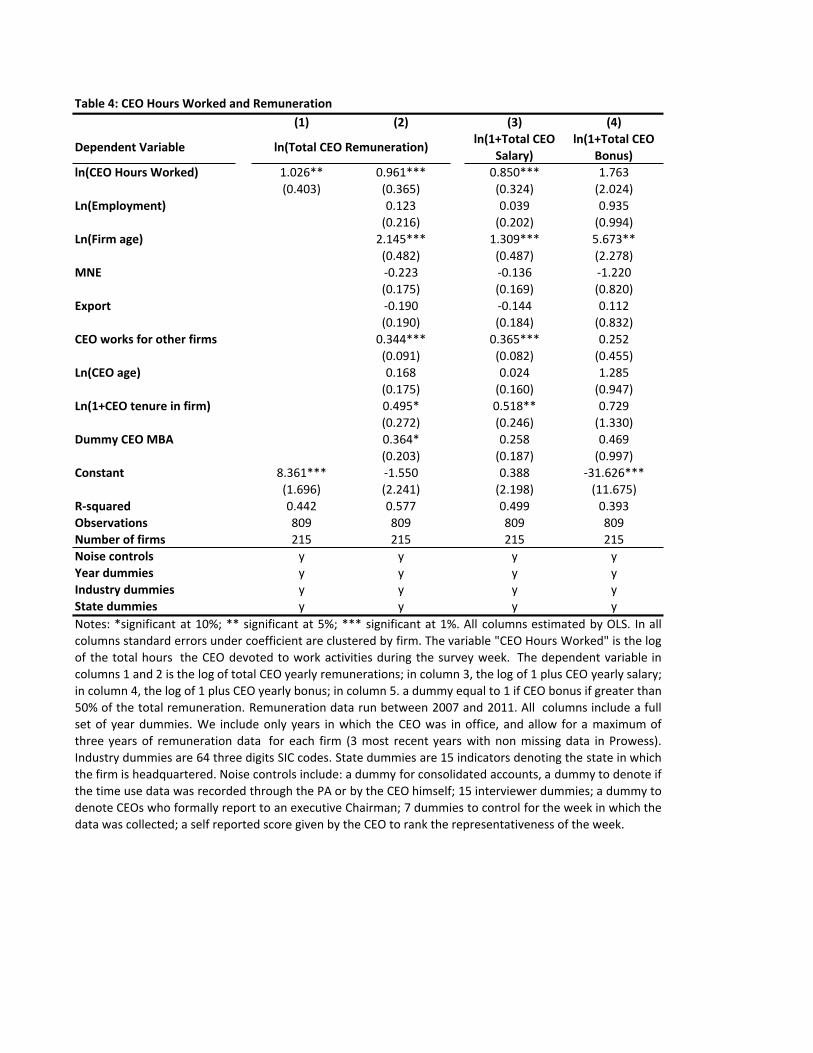
Table&4:&CEO&Hours&Worked&and&Remuneration
(1) (2) (3) (4)
Dependent&Variableln(1+Total&CEO&
Salary)
ln(1+Total&CEO&
Bonus)
ln(CEO&Hours&Worked) 1.026** 0.961*** 0.850*** 1.763(0.403) (0.365) (0.324) (2.024)
Ln(Employment) 0.123 0.039 0.935(0.216) (0.202) (0.994)
Ln(Firm&age) 2.145*** 1.309*** 5.673**(0.482) (0.487) (2.278)
MNE /0.223 /0.136 /1.220(0.175) (0.169) (0.820)
Export /0.190 /0.144 0.112(0.190) (0.184) (0.832)
CEO&works&for&other&firms 0.344*** 0.365*** 0.252(0.091) (0.082) (0.455)
Ln(CEO&age) 0.168 0.024 1.285(0.175) (0.160) (0.947)
Ln(1+CEO&tenure&in&firm) 0.495* 0.518** 0.729(0.272) (0.246) (1.330)
Dummy&CEO&MBA 0.364* 0.258 0.469(0.203) (0.187) (0.997)
Constant 8.361*** /1.550 0.388 /31.626***(1.696) (2.241) (2.198) (11.675)
ROsquared 0.442 0.577 0.499 0.393Observations 809 809 809 809Number&of&firms 215 215 215 215Noise&controls y y y yYear&dummies y y y yIndustry&dummies y y y yState&dummies y y y yNotes: *significant at 10%; ** significant at 5%; *** significant at 1%. All columns estimated by OLS. In allcolumns standard errors under coefficient are clustered by firm. The variable "CEO Hours Worked" is the logof the total hours the CEO devoted to work activities during the survey week. The dependent variable incolumns 1 and 2 is the log of total CEO yearly remunerations; in column 3, the log of 1 plus CEO yearly salary;inVcolumnV4,VtheVlogVofV1VplusVCEOVyearlyVbonus;VinVcolumnV5.VaVdummyVequalVtoV1VifVCEOVbonusVifVgreaterVthanV50% of the total remuneration. Remuneration data run between 2007 and 2011. All columns include a fullset of year dummies. We include only years in which the CEO was in office, and allow for a maximum ofthree years of remuneration data for each firm (3 most recent years with non missing data in Prowess).Industry dummies are 64 three digits SIC codes. State dummies are 15 indicators denoting the state in whichthe firm is headquartered. Noise controls include: a dummy for consolidated accounts, a dummy to denote ifthe time use data was recorded through the PA or by the CEO himself; 15 interviewer dummies; a dummy todenote CEOs who formally report to an executive Chairman; 7 dummies to control for the week in which thedataVwasVcollected;VaVselfVreportedVscoreVgivenVbyVtheVCEOVtoVrankVtheVrepresentativenessVofVtheVweek.
ln(Total&CEO&Remuneration)

Table&5:&Family&vs.&Professional&CEOs&8&Cross§ional&differences&in&Hours&Worked(1) (2) (3) (4) (5)
Dependent&Variable
Founder's&Successor&CEO !0.066** !0.066**
(0.026) (0.031)
Founder&CEO !0.111*** !0.082*
(0.038) (0.043)
Family&CEO&(Founder&&&Founder's&Successor&CEO) !0.086*** !0.088*** !0.164***
(0.030) (0.028) (0.055)
Ln(Employment) 0.033*** 0.031*** 0.022** 0.021**
(0.011) (0.011) (0.010) (0.010)
Ln(Firm&age) !0.038* !0.022 !0.027 !0.030
(0.022) (0.024) (0.027) (0.026)
MNE 0.070** 0.096*** 0.120*** 0.126***
(0.032) (0.037) (0.034) (0.034)
Export 0.041 0.040 0.040 0.045
(0.031) (0.032) (0.036) (0.036)
CEO&works&for&other&firms 0.005 !0.000 0.012 0.018
(0.028) (0.028) (0.034) (0.033)
Ln(CEO&age) !0.167** !0.206*** !0.201*** !0.205***
(0.066) (0.065) (0.069) (0.069)
Ln(1+CEO&tenure&in&firm) !0.012 !0.003 !0.007 !0.007
(0.020) (0.020) (0.022) (0.023)
Dummy&CEO&MBA 0.013 0.012 0.016 0.014
(0.024) (0.026) (0.024) (0.023)
Dummy&High&Competition 0.059** !0.010
(0.029) (0.047)
Family&CEO&*&High&Competition 0.106*
(0.056)
Constant 3.608*** 4.158*** 4.359*** 4.210*** 4.257***
(0.020) (0.247) (0.274) (0.273) (0.268)
R8squared 0.023 0.084 0.183 0.354 0.362
Number&of&firms 356 356 356 322 322
Noise&controls y y y
Industry&dummies y y y
State&dummies y y y
Test&Family&CEO=Founder&CEO&(p8value) 0.22 0.67
Test&Family&CEO+Family&CEO*High&Competition=0&(p8value) 0.04
Notes: *significant at 10%; ** significant at 5%; *** significant at 1%. All columns estimated by OLS. In all columns standard errors under
coefficient are clustered by firm in all columns except columns 5 and 6 (clustered by firm and three digits sic codes). The variable "CEO
Hours Worked" is the log of the total hours the CEO devoted to work activities during the survey week. Founder CEO and Founder's
successor CEO are dummies denoting, respectively, firms owned and led by the founder or a founder's successor (2nd generation
onwards). Family CEO is a dummy combining Founders and Founder's successors in a single category. Industry dummies are 21 two digits
SIC codes. State dummies are 15 indicators denoting the state in which the firm is headquartered. Noise controls include: a dummy to
denote if the time use data was recorded through the PA or by the CEO himself; 15 interviewer dummies; a dummy to denote CEOs who
formally report to an executive Chairman; 7 dummies to control for the week in which the data was collected; a self reported score given
by[the[CEO[to[rank[the[representativeness[of[the[week.
ln(CEO&Hours&Worked)&8&Week&Level

Table&6:&Allocation&of&Time&and&Ownership(1) (2) (3) (4) (5) (6)
Dependent&variableShare&
PlannedShare&Many&Functions
Share&Many&Participants
Share&Meeting
Share&Insiders
Share&Direct&Reports
Family&CEO !0.025 !0.016 !0.052** 0.005 !0.042* 0.027(0.023) (0.026) (0.026) (0.020) (0.024) (0.024)
Ln(Employment) !0.009 0.007 0.016* 0.011 0.010 !0.008(0.007) (0.009) (0.010) (0.008) (0.009) (0.009)
Ln(Firm&age) !0.032* 0.014 !0.001 !0.004 0.011 !0.001(0.018) (0.022) (0.021) (0.016) (0.018) (0.019)
MNE 0.039 0.035 0.055* 0.048** 0.009 !0.018(0.026) (0.033) (0.033) (0.024) (0.030) (0.030)
Export !0.000 0.000 0.015 !0.006 0.030 !0.013(0.029) (0.027) (0.027) (0.023) (0.027) (0.028)
CEO&works&for&other&firms 0.048** !0.003 !0.004 !0.014 !0.031 !0.052**(0.020) (0.023) (0.024) (0.020) (0.023) (0.023)
Ln(CEO&age) 0.099* !0.015 !0.063 0.024 0.044 0.097*(0.052) (0.052) (0.059) (0.048) (0.050) (0.056)
Ln(1+CEO&tenure&in&firm) 0.002 0.007 0.030* !0.013 0.003 !0.016(0.017) (0.016) (0.018) (0.014) (0.016) (0.015)
CEO&MBA !0.025 !0.011 !0.003 0.013 !0.001 !0.009(0.019) (0.020) (0.021) (0.016) (0.019) (0.021)
Constant 0.522** 0.215 0.554** 0.651*** 0.467** !0.030(0.220) (0.224) (0.259) (0.186) (0.229) (0.247)
RRsquared 0.251 0.120 0.149 0.181 0.184 0.141Number&of&firms 356 356 356 356 356 356Noise&controls y y y y y yIndustry&dummies y y y y y yState&dummies y y y y y yNotes: *significant at 10%; ** significant at 5%; *** significant at 1%. All columns estimated by OLS. In all columnsstandard errors under coefficient are clustered by firm. Family CEO is a dummy denoting firms owned by a family(founder or 2nd generation onwards) and where the CEO is also a member of the family. Industry dummies are 21two digits SIC codes. State dummies are 15 indicators denoting the state in which the firm is headquartered. Noisecontrols include: a dummy to denote if the time use data was recorded through the PA or by the CEO himself; 15interviewer dummies; a dummy to denote CEOs who formally report to an executive Chairman; 7 dummies to controlfor the week in which the data was collected; a self reported score given by the CEO to rank the representativeness oftheUweek.

Table&7:&Response&to&Rain&Shocks&by&Ownership&
Dependent&Variable
(1) (2) (3) (4) (5) (6) (7) (8)
Experiment Baseline Add&
interaction
Include&
industry*rain&
interactions
Include&
state*rain&
interactions
Include&
CEO*rain&
interactions
Include&
firm*rain&
interactions
Include&
competition&
interactions
Include&
competition&
interactions
Family&CEO !0.083*** !0.040 !0.038 !0.041 !0.035 !0.040 !0.046 !0.072*(0.019) (0.035) (0.039) (0.036) (0.029) (0.036) (0.044) (0.039)
Dummy=1&if&extreme&rain !0.024* 0.038* 0.130 0.012 0.106 0.092 !0.024 0.024(0.014) (0.020) (0.141) (0.030) (0.376) (0.100) (0.045) (0.039)
Dummy=1&if&extreme&rain&*&Family&CEO !0.092** !0.085** !0.088** !0.103*** !0.091** !0.089* !0.163***(0.038) (0.037) (0.042) (0.030) (0.040) (0.050) (0.053)
Dummy=1&if&extreme&rain&*&CEO&works&for&other&firms !0.047(0.033)
Dummy=1&if&extreme&rain&*&Ln(CEO&age) !0.028(0.095)
Dummy=1&if&extreme&rain&*&Ln(1+CEO&tenure&in&firm) 0.022(0.018)
Dummy=1&if&extreme&rain&*&CEO&MBA !0.002(0.055)
Dummy=1&if&extreme&rain&*&Ln(Employment) !0.011(0.018)
Dummy=1&if&extreme&rain&*&Ln(Firm&age) !0.013(0.025)
Dummy=1&if&extreme&rain&*&MNE 0.010(0.035)
Dummy=1&if&extreme&rain&*&Export 0.071***(0.020)
Dummy=1&if&extreme&rain&*&High&Competition 0.078** 0.006(0.036) (0.032)
Dummy=1&if&extreme&rain&*&Family&CEO&*&High&Competition 0.111**(0.051)
Family&CEO&*&High&Competition 0.034(0.044)
Ln(Employment) 0.032*** 0.033*** 0.033*** 0.033*** 0.033*** 0.039*** 0.029*** 0.028***(0.006) (0.006) (0.006) (0.006) (0.006) (0.010) (0.008) (0.008)
Ln(Firm&age) !0.038* !0.040* !0.042* !0.039* !0.040* !0.035 !0.046* !0.046*(0.022) (0.022) (0.021) (0.022) (0.024) (0.026) (0.027) (0.026)
MNE 0.073*** 0.078*** 0.081*** 0.079*** 0.078*** 0.074** 0.104*** 0.110***(0.026) (0.025) (0.027) (0.025) (0.026) (0.033) (0.027) (0.026)
Export 0.062*** 0.063*** 0.067*** 0.062*** 0.062*** 0.030 0.055** 0.059**(0.020) (0.020) (0.019) (0.020) (0.020) (0.023) (0.028) (0.026)
CEO&works&for&other&firms !0.012 !0.016 !0.020 !0.018 0.003 !0.014 !0.019 !0.015(0.027) (0.027) (0.025) (0.027) (0.034) (0.026) (0.030) (0.029)
Ln(CEO&age) !0.184*** !0.180*** !0.177*** !0.178*** !0.167*** !0.182*** !0.184*** !0.189***(0.045) (0.042) (0.037) (0.041) (0.055) (0.040) (0.034) (0.034)
Ln(1+CEO&tenure&in&firm) 0.004 0.004 0.003 0.004 !0.006 0.004 0.005 0.006(0.012) (0.012) (0.010) (0.012) (0.019) (0.012) (0.015) (0.016)
Dummy&CEO&MBA 0.020* 0.022** 0.025** 0.022** 0.023 0.020** 0.028 0.025(0.011) (0.010) (0.012) (0.010) (0.030) (0.010) (0.018) (0.020)
High&Competition !0.000 !0.022(0.027) (0.031)
Constant 2.031*** 2.796*** 2.795*** 2.799*** 2.756*** 2.768*** 2.812*** 2.846***(0.078) (0.112) (0.103) (0.105) (0.186) (0.092) (0.109) (0.106)
RVsquared 0.056 0.185 0.199 0.189 0.186 0.187 0.196 0.200Observations 1603 1603 1603 1603 1603 1603 1442 1442Number&of&firms 349 349 349 349 349 349 349 349State&dummies y y y y y y y yIndustry&dummies y y y y y y y yNoise&controls y y y y y y y yTest&Rain+Family&CEO*Rain=0&(pVvalue) 0.02 0.78 0.00 0.97 0.99 0.00 0.00Test&Rain+Family&CEO*Rain+Family&CEO*Rain*High&Competition=0&(pVvalue) 0.55Test&joint&significance&of&Rain*Industry&interactions&(pVvalue) 0.00Test&joint&significance&of&Rain*State&interactions&(pVvalue) 0.00Test&joint&significance&of&Rain*CEO&characteristics&(pVvalue) 0.48Test&joint&significance&of&Rain*other&firm&characteristics&(pVvalue) 0.00
ln(1+CEO&Hours&Worked)&V&Day&Level&
Notes: *significant at 10%; ** significant at 5%; *** significant at 1%. All columns estimated by OLS. In all columns standard errors under coefficient are clustered by firm and state,except for columns 8 and 9 (clustered by firm, state and three digits sic code). The variable "CEO Hours" is the log of 1 plus the number of hours worked by the CEO during the day.Family CEO is a dummy denoting firms owned by a family (founder or 2nd generation onwards) and where the CEO is also a member of the family. "Extreme Rain" is a dummydenoting intense rainfall (relative to the non Monsoon period) in the area and day where the CEO is located (data measured by the closest weather station, matched to the zipcode ofthe CEO activities for the day). Column 4 includes a full set of industry dummiesXExtreme rain interactions. Column 5 includes a full set of state dummiesXExtreme rain interactions.Industry dummies are 21 two digits SIC codes. State dummies are 15 indicators denoting the state in which the firm is headquartered. Noise controls include: a dummy to denote ifthe time use data was recorded through the PA or by the CEO himself; 15 interviewer dummies; a dummy to denote CEOs who formally report to an executive Chairman; 7 dummiesto]control]for]the]week]in]which]the]data]was]collected;]a]self]reported]score]given]by]the]CEO]to]rank]the]representativeness]of]the]week,]and]a]control]for]the]day]of]the]week.

Table&8:&Response&to&Cricket&Games(1) (2) (3) ;4
Dependent&Variable ln(1+CEO&Hours&Until&3PM)
ln(1+CEO&Hours&After&3PM)
Family&CEO !0.067** !0.063** !0.074** !0.017(0.028) (0.029) (0.032) (0.038)
Cricket&game !0.071*** !0.015 0.155** !0.130***(0.019) (0.032) (0.076) (0.048)
Cricket&game&*Family&CEO !0.088* !0.247*** 0.008(0.053) (0.071) (0.103)
Ln(Employment) 0.014* 0.014* !0.003 0.023*(0.008) (0.008) (0.009) (0.014)
Ln(Firm&age) 0.015 0.017 0.048** !0.000(0.023) (0.023) (0.023) (0.026)
MNE 0.071** 0.068** 0.046 0.040(0.029) (0.028) (0.035) (0.035)
Export 0.051* 0.051* 0.019 0.042(0.029) (0.030) (0.031) (0.040)
CEO&works&for&other&firms !0.033 !0.032 !0.018 !0.041(0.024) (0.024) (0.026) (0.029)
Ln(CEO&age) !0.079 !0.079 !0.088 !0.029(0.065) (0.065) (0.069) (0.078)
Ln(1+CEO&tenure&in&firm) !0.003 !0.003 0.002 !0.017(0.017) (0.017) (0.019) (0.022)
Dummy&CEO&MBA 0.010 0.009 0.014 !0.001(0.019) (0.019) (0.028) (0.029)
Constant 2.371*** 2.371*** 1.743*** 1.479***(0.256) (0.255) (0.280) (0.332)
R;squared 0.133 0.133 0.103 0.089Observations 1832 1832 1832 1832Number&of&firms 353 353 353 353State&dummies y y y yIndustry&dummies y y y yNoise&controls y y y yTest&Cricket+Family&CEO*Cricket=0&(p;value) 0.00 0.00 0.13
ln(1+CEO&Hours&Worked)&;&Day&Level&
Notes: *significant at 10%; ** significant at 5%; *** significant at 1%. All columns estimated by OLS. In all columns standard errorsunder coefficient are clustered by firm and date. The variable "CEO Hours" is the log of 1 plus the number of hours worked by theCEO during the day. Family CEO is a dummy denoting firms owned by a family (founder or 2nd generation onwards) and where theCEO is also a member of the family. "Cricket game" is a dummy denoting that an IPL playoff, semifinal or final game was played andbroadcasted on television on the day. Industry dummies are 21 two digits SIC codes. State dummies are 15 indicators denoting thestate in which the firm is headquartered. Noise controls include: a dummy to denote if the time use data was recorded through thePA or by the CEO himself; 15 interviewer dummies; a dummy to denote CEOs who formally report to an executive Chairman; 7dummies to control for the week in which the data was collected; a self reported score given by the CEO to rank therepresentativenessYofYtheYweek,YandYaYcontrolYforYtheYdayYofYtheYweek.

Table&9:&Response&to&Cricket&Shocks&by&Ownership&&9&RobustnessDependent&Variable
(1) (2) (3) (4) (5) (6) (7)Experiment Baseline Include&
industry*Cricket&interactions
Include&state*Cricket&interactions
Include&CEO*Cricket&interactions
Include&firm*Cricket&interactions
Include&competition&*Cricket&
interactions
Include&competition&*Cricket&
interactions
Family&CEO !0.074** !0.074** !0.077** !0.077** !0.077** !0.078* !0.152**(0.032) (0.033) (0.032) (0.032) (0.031) (0.041) (0.073)
Cricket&game 0.155** 0.038 0.163 !0.769 0.339* 0.344*** 0.214**(0.076) (0.167) (0.132) (0.572) (0.182) (0.104) (0.089)
Cricket&game&*&Family&CEO !0.247*** !0.288*** !0.336*** !0.182*** !0.144** !0.323*** !0.154(0.071) (0.088) (0.081) (0.070) (0.063) (0.086) (0.112)
Cricket&game&*&CEO&works&for&other&firms 0.003(0.003)
Cricket&game&*&Ln(CEO&age) 0.263**(0.122)
Cricket&game&*&Ln(1+CEO&tenure&in&firm) !0.063(0.057)
Cricket&game&*&CEO&MBA !0.002(0.075)
Cricket&game&*&Ln(Employment) !0.012(0.052)
Cricket&game&*&Ln(Firm&age) !0.090(0.084)
Cricket&game&*&MNE 0.234**(0.107)
Cricket&game&*&Export 0.021(0.080)
Cricket&game&*&High&Competition !0.233** !0.070(0.108) (0.121)
Family&CEO&*&High&Competition 0.101(0.075)
Cricket&game&*&Family&CEO&*&High&Competition !0.236(0.152)
Ln(Employment) !0.003 !0.003 !0.003 !0.002 !0.003 !0.006 !0.007(0.009) (0.009) (0.009) (0.009) (0.009) (0.012) (0.012)
Ln(Firm&age) 0.048** 0.053** 0.051** 0.050** 0.063*** 0.045 0.044(0.023) (0.023) (0.023) (0.023) (0.022) (0.029) (0.028)
MNE 0.046 0.043 0.041 0.043 0.027 0.051 0.055(0.035) (0.037) (0.035) (0.035) (0.036) (0.038) (0.040)
Export 0.019 0.021 0.019 0.019 0.021 0.033 0.037(0.031) (0.032) (0.033) (0.031) (0.032) (0.042) (0.043)
CEO&works&for&other&firms !0.018 !0.022 !0.018 !0.020 !0.013 !0.017 !0.013(0.026) (0.027) (0.028) (0.027) (0.027) (0.032) (0.033)
Ln(CEO&age) !0.088 !0.090 !0.093 !0.104 !0.096 !0.102 !0.112(0.069) (0.071) (0.071) (0.070) (0.068) (0.075) (0.079)
Ln(1+CEO&tenure&in&firm) 0.002 0.001 0.003 0.007 0.006 !0.005 !0.004(0.019) (0.022) (0.020) (0.020) (0.019) (0.020) (0.021)
Dummy&CEO&MBA 0.014 0.015 0.014 0.012 0.009 0.017 0.015(0.028) (0.029) (0.028) (0.029) (0.029) (0.035) (0.035)
High&Competition !0.004 !0.070(0.033) (0.059)
Constant 1.743*** 1.741*** 1.763*** 1.784*** 1.739*** 1.843*** 1.925***(0.280) (0.274) (0.275) (0.274) (0.269) (0.323) (0.344)
R9squared 0.103 0.108 0.108 0.103 0.106 0.115 0.117Observations 1832 1832 1832 1832 1832 1652 1652Number&of&firms 353 353 353 353 353 353 353State&dummies y y y y y y yIndustry&dummies y y y y y y yNoise&controls y y y y y y yTest&Cricket+Family&CEO*Cricket=0&(p9value) 0.01 0.10 0.05 0.08 0.21 0.76 0.45Test&joint&significance&of&Cricket*CEO&characteristics&(p9value) 0.00Test&joint&significance&of&Cricket*other&firm&characteristics&(p9value) 0.00Test&joint&significance&of&Cricket*Industry&interactions&(p9value) 0.00Test&joint&significance&of&Cricket*State&interactions&(p9value) 0.00
ln(1+CEO&Hours&until&3PM)
Notes: *significant at 10%; ** significant at 5%; *** significant at 1%. All columns estimated by OLS. In all columns standard errors under coefficient are clustered by firm and date,excpet for columns 6 and 7 (clustered by firm, date a three digits industry). The variable "CEO Hours" is the log of 1 plus the number of hours worked by the CEO during the day.Family CEO is a dummy denoting firms owned by a family (founder or 2nd generation onwards) and where the CEO is also a member of the family. "Cricket game" is a dummydenoting the broadcasting of an IPL playoff, semifinal or final. Column 2 includes a full set of industry dummiesXCricket interactions. Column 3 includes a full set of statedummiesXCricket interactions. Industry dummies are 21 two digits SIC codes. State dummies are 15 indicators denoting the state in which the firm is headquartered. Noise controlsinclude: a dummy to denote if the time use data was recorded through the PA or by the CEO himself; 15 interviewer dummies; a dummy to denote CEOs who formally report to anexecutive Chairman; 7 dummies to control for the week in which the data was collected; a self reported score given by the CEO to rank the representativeness of the week, and acontrolZforZtheZdayZofZtheZweek.

Table&10:&Family&vs.&Professional&CEOs&9&Cross§ional&differences&in&Hours&Worked&Across&Countries(1) (2) (3) (4)
Dependent&Variable
Sample IndiaBrazil,&France,&
Germany,&UK,&US BrazilFrance,&
Germany,&UK,&US
Family&CEO !0.086*** !0.110*** !0.118*** !0.087**(0.030) (0.025) (0.036) (0.035)
Ln(Employment) 0.031*** 0.029*** 0.046*** 0.016(0.011) (0.009) (0.016) (0.010)
Ln(Firm&age) !0.022 0.010 0.040* 0.001(0.024) (0.011) (0.023) (0.012)
MNE 0.096*** 0.007 0.020 0.031(0.037) (0.022) (0.037) (0.027)
Export 0.040 0.011 0.013 0.032(0.032) (0.026) (0.041) (0.037)
CEO&works&for&other&firms !0.000 !0.006 !0.017 0.007(0.028) (0.025) (0.036) (0.031)
Ln(CEO&age) !0.206*** !0.166*** !0.207** !0.166**(0.065) (0.054) (0.093) (0.070)
Ln(1+CEO&tenure&in&firm) !0.003 !0.009 0.002 !0.018(0.020) (0.012) (0.018) (0.015)
Dummy&CEO&MBA 0.012 0.036* !0.013 0.033(0.026) (0.021) (0.036) (0.025)
Constant 4.245*** 4.349*** 4.140*** 4.028***(0.298) (0.281) (0.326) (0.284)
R9squared 0.183 0.183 0.303 0.118Number&of&firms 356 759 281 478Noise&controls y y y yIndustry&dummies y y y yState&or&Country&dummies y y y y%&Family&CEOs 0.67 0.28 0.41 0.21
ln(CEO&Hours&Worked)&9&Week&Level
Notes: *significant at 10%; ** significant at 5%; *** significant at 1%. All columns estimated by OLS. In all columnsstandard errors under coefficient are clustered by firm. The variable "CEO Hours Worked" is the log of the totalhours the CEO devoted to work activities during the survey week. Family CEO is a dummy denoting firms owned bya family (founder or 2nd generation onwards) and where the CEO is also a member of the family. India: Industrydummies are 21 two digits SIC codes. State dummies are 15 indicators denoting the state in which the firm isheadquartered. Noise controls include: a dummy to denote if the time use data was recorded through the PA or bythe CEO himself; 15 interviewer dummies; a dummy to denote CEOs who formally report to an executive Chairman;7 dummies to control for the week in which the data was collected; a self reported score given by the CEO to rankthe representativeness of the week. Other countries: Industry dummies are 21 two digits SIC codes. Countrydummies included in all regressions. Noise controls include: a dummy to denote if the time use data was recordedthrough the PA or by the CEO himself; 56 interviewer dummies; 22 dummies to control for the week in which thedataYwasYcollected;YaYselfYreportedYscoreYgivenYbyYtheYCEOYtoYrankYtheYrepresentativenessYofYtheYweek.Y

A Data Appendix
A.1 The Time Use Survey
A.1.1 Survey Management
The data was collected by a team of fifteen MBA students recruited specifically for this project from
leading business schools in Mumbai. To ensure comparability across analysts, all interviews were
conducted from a single location (an o�ce in the Mumbai suburb of Andheri), and all analysts
were subject to a common intensive training on the survey methodology for three days at the
beginning of the project, plus weekly team progress reviews and one to one conversations with
their supervisors to discuss possible uncertainties with respect to the classification of the time use
data. Each interview was checked o↵ at the end of the week by one supervisor, who would make
sure that the data was complete in every field, and that the analysts had codified all the activities
according to the survey protocol. Each analyst ran on average 24 interviews across 9 states, which
allows us to include analysts fixed e↵ects to control for potential unobserved di↵erences in the
compilation of the time diaries across interviewers together with state dummies.
Each analyst was allocated a random list of about 70 companies, and was in charge of calling up
the numbers of his or her list to convince the CEO to participate in the survey, and to collect the
time use data in the week allocated to the CEO. One project manager, two full time supervisors
(one hired from a local consultancy, IPSOS) and one additional manager working on a part time
basis led the survey team.
We actively monitored and coached the interviewers throughout the project, which intensified their
persistence in chasing the CEOs and getting them to participate. We also o↵ered the CEOs a
personalized analysis of their use of time (which was sent to them in January 2012) to give them
the ability to monitor their time allocation, and compare it with peers in the industry.
A.1.2 Sampling Frame
The sampling frame was drawn from ORBIS, an extensive commercial data set that contains
company accounts for the population of listed Indian firms. The construction of the sampling
frame followed several criteria. First, we restricted the sample to firms headquartered in the fifteen
main Indian states. This excluded firms located in Assam, Bihar, Chandigarh, Chhattisgarh,
Dadra, Daman and Diu, Goa, Himachal Pradesh, Jammu and Kashmir, Jharkhand, Orissa and
Uttarakhand, each of which accounts for less than 3% of Indian GDP. Second, we kept firms active
in 2010 and reported accounting data up until at least 2006. These conditions restricted our sample
from 8,000 to 3,500 firms. Third, we kept companies for which we could find CEOs contact details.
To gather contact information we hired a team of research assistants based in Mumbai who verified
the CEOs names, found their phone numbers and emails, and established a first contact with their
PAs. This restricted the sample to 1,955 firms. Of these, 368 later resulted not to be eligible
27
for the interviews upon the first telephonic contact (the reasons for non eligibility included recent
bankruptcy, the company not being in manufacturing or being listed anymore), and 158 were never
contacted because the project ended before this was possible.
The final number of eligible companies was thus 1,429, with median yearly sales of 24,000,000
Rupees.21 Of these, we were able to secure an interview with 364 CEOs, although 8 CEOs dropped
out before the end of the data collection week for personal reasons and were thus removed from the
sample before the analysis was conducted. The selection analysis in Table A1 shows that firms in
the final sample have on average slightly lower log sales relative to the sampling frame (a di↵erence
of 1.8%, significant at the 1% level). However, we do not find any significant selection e↵ect on
performance variables, such as return on capital employed (ROCE) return on assets (ROA) and
profits over sales.
A.2 Firm Data
A.2.1 Accounts
The data on sales, capital, materials, profits, return on capital employed, market values came from
ORBIS. Employment figures are typically not published in the Indian accounts, so this information
was part of the survey questionnaire. For each company, we restrict the sample to the three most
recent years in the interval running from 2007 to 2011, and we only keep years in which the CEO
was in o�ce.
A.2.2 Ownership
Ownership data is collected in interviews with the CEOs and independently checked using several
Internet sources (e.g. The Economic Times of India, Bloomberg), information provided on the
company website and supplemental phone interviews. We define a firm to be owned by an entity
if this controls more than 25.01% of the shares; if no single entity owns at least 25.01% of the
share the firm is labeled as “Dispersed shareholder”. Family firms are defined as those where
a family (combined across all family members, all second generation relative to the founder or
beyond) are the largest shareholders. Founder firms are defined as those where the original founder
of the company is the largest shareholder. For both family 2nd generation and founder firms, we
distinguish between cases in which a family firm or the founder are also CEOs of the company, in
contrast to cases in which a professional manager (i.e. a person not a�liated with the founder or
the family) has been nominated CEO. In the analysis we combine founder CEO and family, 2nd
generation CEOs in a single category, and show in Appendix results that all the results hold when
we consider these two categories separately. The omitted category in all regressions includes family
or founder owned firms with professional CEOs (10%), dispersed shareholders (14%), government
21As a comparison, median sales for the entire population of manufacturing firms in Orbis between 2008 and 2011was 13,000,000 Rupees)
28

(2.2%), private equity/venture capital (1.4%) and private individuals who are not founders or heirs
to the founders of the company (4.4%).
A.2.3 CEO Pay
We collected data on CEO pay from PROWESS, an extensive commercial dataset focused on Indian
public firms. Similar to the accounts, we restrict the sample to the three most recent years in the
interval running from 2007 to 2011, and we only keep years in which the CEO was in o�ce.
A.3 Industry Data
Our industry classification is the US SIC (1987). Each firm is allocated to each main two digits
sector based on sales. We have 19 distinct two digits industries, and at least two companies for
each of these industries. The Lerner index of competition is constructed following Aghion et al.
(2005) as the mean of (1-profit/sales) in the entire database excluding the firm itself for every three
digit SIC industry (73 distinct industries in total with at least 5 firms in the cell, data averaged
between 2006 and 2010). In the regressions we use as a proxy for competition a dummy indicating
the upper third of the distribution of the Lerner Index. The measure can be constructed for 322
firms (mean 0.66, standard deviation 0.47).
We obtain similar results as the one shon in th emain Tables when we use the continuous version
of the Lerner index. The coe�cient (standard error) of the Lerner index in Table 5, column 4
is -0.0003 (0.002). The coe�cient (standard error) of the Lerner index in Table 5, column 5 is
-0.005 (0.003). The coe�cient (standard error) of the Lerner index interacted with the Family
CEO dummy in Table 5, column 5 is 0.008 (0.003).
A.4 Shocks
A.4.1 Monsoons
The climate data was extracted on 12/08/2011 from http://www7.ncdc.noaa.gov/CDO/cdodata.cmd.
The data was merged with station coordinates (latitude and longitude), and these were in turn used
to merge the data with the time use dataset using the date and zipcode of each of the activities
recorded in the data (data matched with the closest station, distance computed by generating the
vertical and horizontal distance using the latitude and longitude points and applying Pythagoras).
The definition of days of intense rain is based on the comparison of the daily rainfall precipita-
tion with the average precipitation in the pre-Monsoon month of May for the same station. We
first compute a variable measuring for each day between June 1st and July 31st the change in
precipitation relative to the average May values for the same station. We then define a variable
”Extreme Rain” which takes value one if the change in rainfall lies in the third tercile of the overall
distribution computed using data across all stations in the sample.
29

The measure can be contrsucted for 350 CEOs in the sample. About 45% of the sample includes
days of extreme rain (standard deviation is .49). 253 CEOs in the sample (159 Family CEOs and
94 professional CEOs) have at least one day of extreme rain during the sample week. 289 CEOs in
the sample (194 Family CEOs and 95 professional CEOs) have at least one day of non-extreme rain
during the sample week. 192 CEOs in the sample (118 Family CEOs and 74 professional CEOs)
have at least one day of extreme rain and one day of non-extreme rain during the sample week.
A.4.2 Cricket Games
We use data on the 2011 Indian Premier League (IPL) Cricket tournament. We focus on four
games: two playo↵s (Royal Challengers vs. Chennai Super Kings, played on 5/25/2011) and
Mumbai Indians vs. Kolkata Knight Riders, played on 5/25/2011), one semi-final for the 3rd and
4th place (Royal Challengers vs. Mumbai Indians, played on 5/27/2011) and the final (Chennai
Super Kings vs. Royal Challengers, played on 5/28/2011).
Since we surveyed multiple CEOs within the same day, the sample includes 88 CEO-days with a
cricket game (the mean of the cricket dummy is 0.048, standard deviation is 0.21). Overall, we
have 28 CEOs which were exposed to the cricket game during the survey week. Of these, 18 are
family CEOs and the rest are professional CEOs.
A.5 Additional Results
Table A1 shows the results of the selection analysis.
Table A2 to Table A5, and Table A7 report the main results of the paper keeping the distinction
between Founder CEOs and second generation Family CEOs.
Table A6 analyses inter temporal spillovers in the reaction to rain and cricket shocks.
30

Figure'A1:'Survey'screenshot

Figure'A2:'Share'of'time'by'type'of'activity0
12
34
0 .2 .4 .6 .8 1x
mee#ngs'
work'alon
e'
share'of'working'#me'

Figure'A3:'Share'of'time'by'type'of'activity
share&of&working&.me&
0.5
11.5
2
0 .2 .4 .6 .8 1x
pre1planned&
many&par.cipants&
many&func.o
ns&

Figure'A4:'Share'of'time''across'insiders'and'direct'reports0
12
3
0 .2 .4 .6 .8 1x
01
23
0 .2 .4 .6 .8 1x
insiders'
outsiders'
direct're
ports'
share'of'working'3me'

Figure'A5:'Share'of'time''across'functions0
12
34
5
0 .2 .4 .6 .8x
capital'
share'of'working'2me'

Table&A1:&&Selection(1) (2) (3) (4)
Dependent&VariableLn(Sales) !0.019***
(0.005)ROCE 0.000
(0.000)ROA !0.000
(0.001)Profits/Sales !0.022
(0.076)state_AndhraPradesh !0.056 !0.067 !0.048 !0.026
(0.047) (0.049) (0.049) (0.051)state_Gujarat 0.081* 0.069 0.084* 0.125**
(0.043) (0.047) (0.045) (0.051)state_Haryana !0.054 !0.033 !0.030 !0.013
(0.081) (0.090) (0.090) (0.095)state_Karnataka 0.075 0.072 0.067 0.100
(0.060) (0.067) (0.063) (0.072)state_Kerala 0.069 0.042 0.045 0.159
(0.099) (0.104) (0.100) (0.120)state_MadhyaPradesh 0.092 0.103 0.120 0.155
(0.089) (0.098) (0.089) (0.112)state_Delhi 0.027 !0.022 0.030 0.006
(0.048) (0.051) (0.049) (0.052)state_Puducherry !0.109** !0.111** !0.107** !0.081
(0.047) (0.051) (0.048) (0.052)state_Punjab !0.070 !0.042 !0.046 !0.009
(0.075) (0.084) (0.079) (0.088)state_Rajasthan 0.101 0.090 0.099 0.081
(0.084) (0.089) (0.086) (0.091)state_TamilNadu !0.087 !0.051 !0.073 !0.070
(0.057) (0.067) (0.059) (0.072)state_UttarPradesh 0.146* 0.142 0.166** 0.224**
(0.082) (0.088) (0.083) (0.095)state_WestBengal !0.032 !0.024 !0.037 0.013
(0.046) (0.050) (0.047) (0.054)Constant 0.422*** 0.204 0.197 0.206
(0.153) (0.149) (0.146) (0.167)RSsquared 0.011 !0.006 !0.001 0.000Number&of&firms 1425 1231 1361 1109
Dummy=1&if&CEO&participated
Notes: *significant at 10%; ** significant at 5%; *** significant at 1%. All columns estimated by OLS.In all columns standard errors under coefficient are clustered by firm. The dependent variable in allcolumns is a dummy=1 if the CEO participated in the survey. The selection regression is run on thelatestQavailabeQyearQofQaccountingQdata.QAllQcolumnsQincludeQ102QthreeQdigitsQSICQindustryQdummies.

Table&A2:&Firm&and&CEO&characteristics:&Differences&between&Family&and&Professional&CEOsProfessional&CEOs Family&CEOs P=value
Export 0.85 0.79 0.21Domestic5or5Foreign5Multinational 0.18 0.16 0.63Number5of5Employees 1352.46 1163.19 0.69CEO5Age 52.26 49.80 0.02CEO5Gender5(male=1) 0.97 0.99 0.19CEO5holds5a5College5degree 0.98 0.95 0.17CEO5holds5an5MBA 0.51 0.36 0.01Tenure5as5CEO5(years) 7.79 15.19 0.00Tenure5in5firm5(years) 14.46 21.29 0.00Experience5abroad 0.34 0.33 0.83Holds5position5in5other5firms 0.23 0.32 0.10Sits5on5other5boards 0.42 0.43 0.95

Table&A3:&Family&vs.&Professional&CEOs&9&Cross§ional&differences&in&Hours&Worked(1) (2) (3) (4) (5)
Dependent&Variable
Founder's&Successor&CEO !0.066** !0.066** !0.082*** !0.086*** !0.161**
(0.026) (0.031) (0.031) (0.030) (0.065)
Founder&CEO !0.111*** !0.082* !0.102** !0.095** !0.171***
(0.038) (0.043) (0.041) (0.037) (0.059)
Ln(Employment) 0.033*** 0.031*** 0.022** 0.021**
(0.011) (0.011) (0.010) (0.010)
Ln(Firm&age) !0.038* !0.024 !0.028 !0.031
(0.022) (0.024) (0.027) (0.026)
MNE 0.070** 0.095** 0.120*** 0.126***
(0.032) (0.037) (0.034) (0.034)
Export 0.041 0.039 0.039 0.044
(0.031) (0.032) (0.037) (0.037)
CEO&works&for&other&firms 0.005 !0.000 0.012 0.018
(0.028) (0.028) (0.034) (0.034)
Ln(CEO&age) !0.167** !0.197*** !0.197*** !0.202***
(0.066) (0.069) (0.074) (0.075)
Ln(1+CEO&tenure&in&firm) !0.012 !0.003 !0.007 !0.007
(0.020) (0.020) (0.022) (0.023)
Dummy&CEO&MBA 0.013 0.011 0.015 0.013
(0.024) (0.027) (0.024) (0.023)
Dummy&High&Competition 0.059** !0.010
(0.029) (0.048)
Founder's&Successor&CEO&*&High&Competition 0.104
(0.065)
Founder&CEO&*&High&Competition 0.108
(0.068)
Constant 3.608*** 4.158*** 4.331*** 4.201*** 4.251***
(0.020) (0.247) (0.281) (0.280) (0.281)
R9squared 0.023 0.084 0.181 0.355 0.362
Number&of&firms 356 356 356 322 322
Noise&controls y y y
Industry&dummies y y y
State&dummies y y y
Test&Family&CEO=Founder&CEO&(p9value) 0.22 0.67 0.58 0.79 0.89
Test&Founder's&Successor&CEO*High&Competition=Founder&CEO*High&Competition&(p9value) 0.87
ln(CEO&Hours&Worked)&9&Week&Level
Notes: *significant at 10%; ** significant at 5%; *** significant at 1%. All columns estimated by OLS. In all columns
standard errors under coefficient are clustered by firm in all columns except column 4 (clustered by state) and
columns 5 and 6 (clustered by three digits sic codes). The variable "CEO Hours Worked" is the log of the total hours
the CEO devoted to work activities during the survey week. Founder CEO and Founder's successor CEO are
dummies denoting, respectively, firms owned and led by the founder or a founder's successor (2nd generation
onwards).Industry dummies are 21 two digits SIC codes. State dummies are 15 indicators denoting the state in
which the firm is headquartered. Noise controls include: a dummy to denote if the time use data was recorded
through the PA or by the CEO himself; 15 interviewer dummies; a dummy to denote CEOs who formally report to an
executive Chairman; 7 dummies to control for the week in which the data was collected; a self reported score given
by[the[CEO[to[rank[the[representativeness[of[the[week.

Table&A4:&Allocation&of&Time&and&Ownership&8&detail
Dependent&variableShare&
PlannedShare&Many&Functions
Share&Many&Participants
Share&Meeting
Share&Insiders
Share&Direct&Reports
(1) (2) (3) (4) (5) (6)Founder's&Successor&CEO !0.018 !0.022 !0.056** 0.000 !0.044* 0.024
(0.023) (0.026) (0.027) (0.021) (0.025) (0.025)Founder&CEO !0.050 0.006 !0.036 0.024 !0.034 0.035
(0.034) (0.037) (0.034) (0.030) (0.033) (0.035)Ln(Employment) !0.009 0.008 0.016* 0.011 0.010 !0.007
(0.007) (0.009) (0.010) (0.008) (0.009) (0.009)Ln(Firm&age) !0.035* 0.017 0.001 !0.001 0.012 !0.000
(0.018) (0.022) (0.022) (0.016) (0.018) (0.019)MNE 0.038 0.036 0.056* 0.049** 0.009 !0.017
(0.026) (0.033) (0.033) (0.024) (0.030) (0.030)Export !0.002 0.001 0.016 !0.005 0.031 !0.013
(0.029) (0.027) (0.027) (0.023) (0.027) (0.028)CEO&works&for&other&firms 0.048** !0.004 !0.004 !0.014 !0.031 !0.052**
(0.020) (0.022) (0.024) (0.020) (0.023) (0.023)Ln(CEO&age) 0.114** !0.028 !0.073 0.013 0.039 0.092
(0.052) (0.054) (0.060) (0.049) (0.052) (0.058)Ln(1+CEO&tenure&in&firm) 0.001 0.007 0.030* !0.013 0.003 !0.016
(0.017) (0.016) (0.018) (0.014) (0.016) (0.015)Dummy&CEO&MBA !0.027 !0.010 !0.002 0.014 !0.001 !0.009
(0.019) (0.020) (0.021) (0.016) (0.020) (0.021)Constant 0.150 0.011 0.104 0.793*** 0.544** 0.501**
(0.264) (0.249) (0.263) (0.201) (0.223) (0.248)R8squared 0.252 0.119 0.147 0.181 0.182 0.139Number&of&firms 356 356 356 356 356 356Test&Family&CEO=Founder&CEO&(p8value) 0.3 0.38 0.5 0.38 0.74 0.74Noise&controls y y y y y yIndustry&dummies y y y y y yState&dummies y y y y y yNotes: *significant at 10%; ** significant at 5%; *** significant at 1%. All columns estimated by OLS. In all columns standarderrors under coefficient are clustered by firm. Founder CEO and Founder's successor CEO are dummies denoting, respectively,firms owned and led by the founder or a founder's successor (2nd generation onwards). Industry dummies are 21 two digitsSIC codes. State dummies are 15 indicators denoting the state in which the firm is headquartered. Noise controls include: adummy to denote if the time use data was recorded through the PA or by the CEO himself; 15 interviewer dummies; a dummyto denote CEOs who formally report to an executive Chairman; 7 dummies to control for the week in which the data wascollected;WaWselfWreportedWscoreWgivenWbyWtheWCEOWtoWrankWtheWrepresentativenessWofWtheWweek.

Table&A5:&Reaction&to&shocks&3&detail
(1) (2) (3) (4)
Dependent&Variable
Founder's&Successor&CEO !0.076*** !0.030 !0.084** !0.071**(0.025) (0.030) (0.034) (0.034)
Founder&CEO !0.092*** !0.056 !0.054 !0.043(0.031) (0.036) (0.041) (0.041)
Dummy=1&if&extreme&rain !0.024 0.037(0.020) (0.027)
Dummy=1&if&extreme&rain&*&Founder's&Successor&CEO !0.095**(0.037)
Dummy=1&if&extreme&rain&*&Founder&CEO !0.076(0.054)
Cricket&game !0.005 0.159**(0.027) (0.071)
Cricket&game&*Founder's&Successor&CEO !0.257***(0.066)
Cricket&game&*Founder&&CEO !0.274***(0.079)
Ln(Employment) 0.032*** 0.032*** !0.002 !0.002(0.008) (0.008) (0.010) (0.010)
Ln(Firm&age) !0.045*** !0.047*** 0.044* 0.048**(0.017) (0.017) (0.025) (0.024)
MNE 0.073** 0.078*** 0.030 0.022(0.028) (0.028) (0.036) (0.037)
Export 0.057** 0.059** 0.018 0.018(0.024) (0.024) (0.031) (0.031)
CEO&works&for&other&firms !0.013 !0.016 !0.020 !0.019(0.023) (0.023) (0.027) (0.027)
Ln(CEO&age) !0.186*** !0.181*** !0.106 !0.108(0.055) (0.055) (0.069) (0.069)
Ln(1+CEO&tenure&in&firm) 0.005 0.005 0.004 0.004(0.014) (0.014) (0.020) (0.020)
Dummy&CEO&MBA 0.025 0.026 0.023 0.021(0.021) (0.021) (0.028) (0.028)
Constant 2.723*** 2.672*** 1.737*** 1.736***(0.213) (0.215) (0.304) (0.302)
R3squared 0.144 0.147 0.098 0.102Observations 1603 1603 1832 1832Number&of&firms 349 349 353 353Test&Family&CEO=Founder&CEO&(p3value) 0.58 0.41 0.44 0.47Test&shock*Family&CEO=shock*Founder&CEO&(p3value) 0.73 0.82State&dummies y y y yIndustry&dummies y y y yNoise&controls y y y y
ln(1+CEO&Hours&until&
3PM)
ln(1+CEO&Hours)&3&Day&
Level
Notes: *significant at 10%; ** significant at 5%; *** significant at 1%. All columns estimated by OLS. In columns1 and 2 standard errors under coefficient are clustered by firm and state. In columns 3 and 4 standard errorsunder coefficient are clustered by firm and date. The variable "CEO Hours" is the log of 1 plus the number ofhours worked by the CEO during the day. Family CEO is a dummy denoting firms owned by a family (founder or2nd generation onwards) and where the CEO is also a member of the family. "Extreme Rain" is a dummydenoting intense rainfall (relative to the non Monsoon period) in the area and day where the CEO is located(data measured by the closest weather station, matched to the zipcode of the CEO activities for the day)."Cricket game" is a dummy denoting that an IPL playoff, semifinal or final game was played and broadcasted ontelevision on the day. Noise controls include: a dummy to denote if the time use data was recorded through thePA or by the CEO himself; 15 interviewer dummies; a dummy to denote CEOs who formally report to anexecutive Chairman; 7 dummies to control for the week in which the data was collected; a self reported scoregiven[by[the[CEO[to[rank[the[representativeness[of[the[week,[and[a[control[for[the[day[of[the[week.

Table&A6:&Intertemporal&Spillovers
(1) (2) (3) (4)
Dependent&Variable
Family&CEO !0.072*** !0.012 !0.068* !0.051(0.027) (0.039) (0.037) (0.039)
Dummy=1&if&extreme&rain&(T) !0.043* 0.007(0.026) (0.030)
Dummy=1&if&extreme&rain&(TG1) 0.022 0.059*(0.022) (0.034)
Dummy=1&if&extreme&rain&*&Family&CEO !0.072*(0.038)
Dummy=1&if&extreme&rain&(TG1)*&Family&CEO !0.050(0.041)
Cricket&game&(T) !0.001 0.190**(0.046) (0.090)
Cricket&game&(TG1) !0.010 !0.052(0.042) (0.083)
Cricket&game&(T)&*&Family&CEO !0.307***(0.081)
Cricket&game&(TG1)&*&Family&CEO 0.056(0.076)
Constant 2.328*** 2.275*** 1.392*** 1.396***(0.295) (0.295) (0.358) (0.356)
RGsquared 0.147 0.151 0.099 0.104Observations 1190 1190 1461 1461Number&of&firms 340 340 353 353Firm&controls y y y yCEO&controls y y y yState&dummies y y y yIndustry&dummies y y y yNoise&controls y y y yTest&Rain+Family&CEO*Rain=0&(pGvalue) 0.04Test&Lagged&Rain+Family&CEO*Lagged&Rain=0&(pGvalue) 0.74Test&Cricket+Family&CEO*Cricket=0&(pGvalue) 0.02Test&Lagged&Cricket+Family&CEO*Lagged&Cricket=0&(pGvalue) 0.94Notes: *significant at 10%; ** significant at 5%; *** significant at 1%. All columns estimated by OLS. In columns 1!3standard errors under coefficient are clustered by firm. In columns 4!6 standard errors under coefficient are clusteredby firm and date. The variable "CEO Hours" is the log of 1 plus the number of hours worked by the CEO during theday. Family CEO is a dummy denoting firms owned and led by the founder or a founder's successor (founder or 2ndgeneration onwards). "Extreme Rain" is a dummy denoting intense rainfall (relative to the non Monsoon period) inthe area and day where the CEO is located (data measured by the closest weather station, matched to the zipcode ofthe CEO activities for the day). "Cricket game" is a dummy denoting that an IPL playoff, semifinal or final game wasplayed and broadcasted on television on the day. Industry dummies are 21 two digits SIC codes. State dummies are15 indicators denoting the state in which the firm is headquartered. Noise controls include: a dummy to denote if thetime use data was recorded through the PA or by the CEO himself; 15 interviewer dummies; a dummy to denote CEOswho formally report to an executive Chairman; 7 dummies to control for the week in which the data was collected; aself reported score given by the CEO to rank the representativeness of the week, and a control for the day of theweek.
ln(1+CEO&Hours)&G&Day&
Level
ln(1+CEO&Hours&until&
3PM)

Table&A7:&Family&vs.&Professional&CEOs&9&Cross§ional&differences&in&Hours&Worked&Across&Countries(1) (2) (3) (4)
Dependent&Variable
Sample IndiaBrazil,&France,&Germany,&UK,&
USBrazil
France,&Germany,&UK,&
US
Founder's&Successor&CEO !0.078** !0.107*** !0.101** !0.100**(0.032) (0.029) (0.042) (0.039)
Founder&CEO !0.101** !0.115*** !0.146*** !0.045(0.042) (0.039) (0.051) (0.070)
Ln(Employment) 0.036*** 0.016 0.011 0.054(0.011) (0.027) (0.040) (0.034)
Ln(Firm&age) !0.026 0.030*** 0.046*** 0.019*(0.024) (0.009) (0.015) (0.010)
MNE/Export 0.057* 0.010 0.036 0.003(0.034) (0.011) (0.025) (0.012)
CEO&works&for&other&firms 0.005 !0.006 !0.014 0.006(0.029) (0.025) (0.035) (0.031)
Ln(CEO&age) !0.186*** !0.164*** !0.194** !0.174**(0.068) (0.055) (0.094) (0.072)
Ln(1+CEO&tenure&in&firm) !0.000 !0.009 0.001 !0.018(0.020) (0.012) (0.018) (0.015)
Dummy&CEO&MBA 0.003 0.035* !0.017 0.034(0.027) (0.021) (0.037) (0.025)
Constant 4.351*** 4.333*** 4.107*** 4.027***(0.296) (0.279) (0.328) (0.286)
R9squared 0.163 0.184 0.304 0.120Number&of&firms 356 759 281 478Noise&controls y y y yIndustry&dummies y y y yState&or&Country&dummies y y y yTest&Family&CEO=Founder&CEO&(p9value) 0.54 0.87 0.44 0.47%&Family&CEOs 0.51 0.19 0.24 0.17%&Founder&CEOs 0.16 0.09 0.17 0.04
ln(CEO&Hours&Worked)&9&Week&Level
Notes: *significant at 10%; ** significant at 5%; *** significant at 1%. All columns estimated by OLS. In allcolumns standard errors under coefficient are clustered by firm. The variable "CEO Hours Worked" is thelog of the total hours the CEO devoted to work activities during the survey week. Founder CEO andFounder's successor CEO are dummies denoting, respectively, firms owned and led by the founder or afounder's successor (2nd generation onwards). India: Industry dummies are 21 two digits SIC codes. Statedummies are 15 indicators denoting the state in which the firm is headquartered. Noise controls include: adummy to denote if the time use data was recorded through the PA or by the CEO himself; 15 interviewerdummies; a dummy to denote CEOs who formally report to an executive Chairman; 7 dummies to controlfor the week in which the data was collected; a self reported score given by the CEO to rank therepresentativeness of the week. Other countries: Industry dummies are 21 two digits SIC codes. Countrydummies included in all regressions. Noise controls include: a dummy to denote if the time use data wasrecorded through the PA or by the CEO himself; 22 dummies to control for the week in which the data wascollected interacted with country dummies; a self reported score given by the CEO to rank therepresentativeness[of[the[week.[
