news date : 26.4.2016 compiled by dr. alvarinho j. luis ... news_2.pdf · the fate of melting...
TRANSCRIPT

News date: 26.4.2016 compiled by Dr. Alvarinho J. Luis
The fate of melting glacial ice in GreenlandOver the past several decades, scientists have observed a significant increase in the melting of glacial land ice on the island of Greenland, spurring concerns about global sea level rise and the long-term effects of atmospheric warming. However, what has been less clear is what happens to this melt water once it enters the ocean.
Now, a team of researchers at the Univ of Georgia has discovered the fate of much of the freshwater that pours into the surrounding oceans as the Greenland ice sheet melts every summer. They published their findings in the journal Nature Geoscience
Understanding the fate of meltwater is important, because research has shown that it can carry a variety of nutrients, which may impact biological production in the ocean, said study co-author R. Castelao. There is also evidence that large freshwater inputs could alter ocean currents and affect the normal formation of sea ice.
The researchers created a simulation that tracks melt water runoff under a variety of atmospheric conditions, and they were surprised to discover that most of the meltwater found off the west coast of Greenland actually originated from ice on the east coast.
Melt water from Greenland is directed by the surrounding ocean currents, but its fate depends on when and where the runoff occurs and the wind fields driving ocean currents, said study co-author Thomas Mote.
According to the model, wind and ocean currents often transport melt water around the southern tip of Greenland on a westward journey that can take upward of 60 days. After rounding the tip, the melt water is largely deposited into the Labrador Sea, an arm of the Atlantic between Canada's Labrador Peninsula and the east coast of Greenland.
Melt water originating from the west coast of Greenland, on the other hand, is often kept pinned to the coastline by strong winds, which push it northward toward Baffin Bay.
This isn't always how melt water from the Greenland ice sheet disperses, as shifts in the prevailing winds can produce very different effects. But scientists must be aware of these shifts in order to fully understand how melt water will affect the environment, Castelao said.
The melt water that comes from the east coast could have different qualities from the meltwater on the west coast, including different nutrient compositions. We need to take the origins of this melt water
into account when we study the effects of ice sheet melt, as it could impact the oceans differently depending on where it comes from, Castelao said
And this is a problem that is only going to get worse, citing scientific models that suggest the amount of melt water runoff from Greenland could more than double before the end of this century.
Journal Reference: H. Luo, R.M. Castelao, A. K. Rennermalm, M. Tedesco, A. Bracco, P. L. Yager, T. L. Mote. Oceanic transport of surface meltwater from the southern Greenland ice sheet. Nature Geoscience, 2016; DOI: 10.1038/ngeo2708
Pdf reprint follows
compiled by Dr. Alvarinho J. Luis
ate of melting glacial ice in Greenland Over the past several decades, scientists have observed a significant increase in the
global hat has
fate of much of the freshwater that pours into the surrounding oceans as the Greenland ice sheet
Nature Geoscience.
own that ogical production in the
large freshwater
water runoff under a variety of he melt
water found off the west coast of Greenland actually originated from ice on the east
water from Greenland is directed by the surrounding ocean currents, but its ocean
water around ard of 60
water is largely deposited into the Labrador Sea, an arm of the Atlantic between Canada's Labrador Peninsula and the east coast
er hand, is often kept pinned to the coastline by strong winds, which push it northward toward Baffin
water from the Greenland ice sheet disperses, as shifts in the prevailing winds can produce
entists must be aware of these shifts in order to fully
water will
water that comes from
different qualities from the melt
ent nutrient We need to take
water
citing scientific models that water runoff from Greenland could more than double
Bracco, Oceanic transport of surface meltwater from the southern
reprint follows…….

LETTERSPUBLISHED ONLINE: 25 APRIL 2016 | DOI: 10.1038/NGEO2708
Oceanic transport of surface meltwater from thesouthern Greenland ice sheetHao Luo1, Renato M. Castelao1*, Asa K. Rennermalm2, Marco Tedesco3,4, Annalisa Bracco5,Patricia L. Yager1 and Thomas L. Mote6
The Greenland ice sheet has undergone accelerating masslosses during recent decades. Freshwater runo� from icemelt can influence fjord circulation and dynamics1 and thedelivery of bioavailable micronutrients to the ocean2. It canalso have climate implications, because stratification in theadjacent Labrador Sea may influence deep convection and thestrength of the Atlantic meridional overturning circulation3.Yet, the fate of the meltwater in the ocean remains unclear.Here, we use a high-resolution ocean model to show thatonly 1–15% of the surface meltwater runo� originating fromsouthwestGreenland is transportedwestwards. In contrast, upto 50–60% of themeltwater runo� originating from southeastGreenland is transportedwestwards into thenorthernLabradorSea, leading to significant salinity and stratification anomaliesfar from the coast. Doubling meltwater runo�, as predictedin future climate scenarios, results in a more-than-doubleincrease in anomalies o�shore that persists further into thewinter. Interannual variability in o�shore export of meltwateris tightly related to variability in wind forcing. The new insightthatmeltwaters originating from thewest and east coasts havedi�erent fates indicates that future changes in mass loss ratesand surface runo� will probably impact the ocean di�erently,depending on their Greenland origins.
Greenland ice sheet (GrIS) mass losses have accelerated duringrecent decades4, having nearly tripled since the 1950s5. GrISmeltingreached its highest extent inmore than a century during the summerof 20126, setting new records in many of the years of the pastdecade7. GrIS runoff from surface melting, accounting for at leasthalf of the total mass loss (the remainder being ice discharge)8,has increased substantially over recent decades in association withatmospheric warming9.
Understanding the fate of GrIS meltwater runoff is importantbecause freshwater input can strongly influence ocean circulation,vertical stability and sea ice formation10, and biogeochemicalprocesses2. Recent modelling studies have reconstructed meltwaterfluxes from Greenland11. Identifying the transport pathways ofmeltwater in the ocean and understanding their controls are crucialin light of predictions that meltwater fluxes will increase evenfurther as a result of warming trends. At the present rate, meltwaterrunoff from Greenland is predicted to more than double by the endof this century12.
Here, we use a decade-long ocean model13 simulation toinvestigate the fate of surface meltwater runoff from the GrIS in theLabrador Sea (Fig. 1). Tracer releases are used to track West and
East Greenlandmeltwater runoff (WGMRand EGMR, respectively)in 2008–2012, revealing that the fate of surface meltwater runoffdepends on where it is delivered to the ocean from Greenland(Fig. 2). Most notably, EGMR extends substantially farther into thenorthern Labrador Sea than WGMR. This results in the volume offreshwater from EGMR (Fig. 3b) transported towards the northernLabrador Sea being 3–25 times larger than the volume fromWGMR(Fig. 3a). This is surprising, considering that the volume of surfacemeltwater runoff introduced along West Greenland was eithercomparable (2008–2010) or larger (2011–2012) than along EastGreenland (Fig. 4a). The differences become even clearer whenthe volume of meltwater transported offshore is normalized by thevolume of meltwater introduced along the east or west coasts. Only15–20% or less of the WGMR reaches section 3 in the northernLabrador Sea (see Fig. 2c for location), and percentages decreasefurther with offshore distance to less than half of the values near thecoast (Fig. 3c). By contrast,∼50% of the EGMR reaches section 12,midway between Greenland and Canada, in three of the five yearsconsidered (Fig. 3d), and percentages in those years decrease veryslowlywith distance from shore, revealing that EGMR is transportedinto the northern Labrador Sea very efficiently.
Large interannual variability in offshore transport of EGMRand WGMR is observed, but it does not correspond to runoffvariability. Two years with low runoff in the 2008–2012 period,2008 and 2009 (Fig. 4a), were characterized by high transport ofmeltwater towards the northern Labrador Sea (Fig. 3), whereasthe two years with the largest runoff, 2010 and 2012, werecharacterized by weak offshore transport. Interannual variability ineddy kinetic energy off West Greenland14 (Supplementary Fig. 1)does not correspond to interannual variability in offshore transportof EGMR andWGMR either, suggesting that interannual variabilityin mesoscale activity by itself cannot account for the observedinterannual variability in offshore export of meltwater. Winds canplay a crucial role in controlling cross-shelf transport of low-salinitywaters in coastal systems15. Whereas upwelling-favourable winds(that is, southeastward along West Greenland) induce offshoretransport in the surface layer, downwelling-favourable winds (thatis, northwestward) induce onshore transport. Increases or decreasesin cumulative alongshelf wind stresses16 along West Greenlandindicate predominant downwelling- or upwelling-favourable winds,respectively (Fig. 4b). During summer, when meltwater runoff ishigh,winds are downwelling favourable on average. This contributesto constraining the meltwater near the West Greenland coast whereit can be transported northwards into BaffinBay by coastal currents.
1Department of Marine Sciences, University of Georgia, Athens, Georgia 30602, USA. 2Department of Geography, Rutgers University, Piscataway,New Jersey 08854, USA. 3Lamont Doherty Earth Observatory, Columbia University, Palisades, New York 10964, USA. 4NASA Goddard Institute for SpaceStudies, New York, New York 10025, USA. 5School of Earth and Atmospheric Sciences, Georgia Institute of Technology, Atlanta, Georgia 30332, USA.6Department of Geography, University of Georgia, Athens, Georgia 30602, USA. *e-mail: [email protected]
NATURE GEOSCIENCE | ADVANCE ONLINE PUBLICATION | www.nature.com/naturegeoscience 1
© 2016 Macmillan Publishers Limited. All rights reserved
© 2016 Macmillan Publishers Limited. All rights reserved.
LETTERS NATURE GEOSCIENCE DOI: 10.1038/NGEO2708
500
500
500
500
500
500
1,0002,000
3,00
0
3,0003,000
3,000
3,00050050
0
500
500
500
1,0002,000
3,00
0
3,0003,000
3,000
3,000
500
65 60 55Longitude (° W) Longitude (° W)
50 45 40
55
60
Latit
ude
(° N
)
Latit
ude
(° N
)
65
50 cm s−1
a
32.0
32.5
33.0
33.5
34.0
34.5
35.0
65 60 55 50 45 40
55
60
65Surface EKE (cm
s −1)
Sea surface salinity
b
5
10
15
20
25
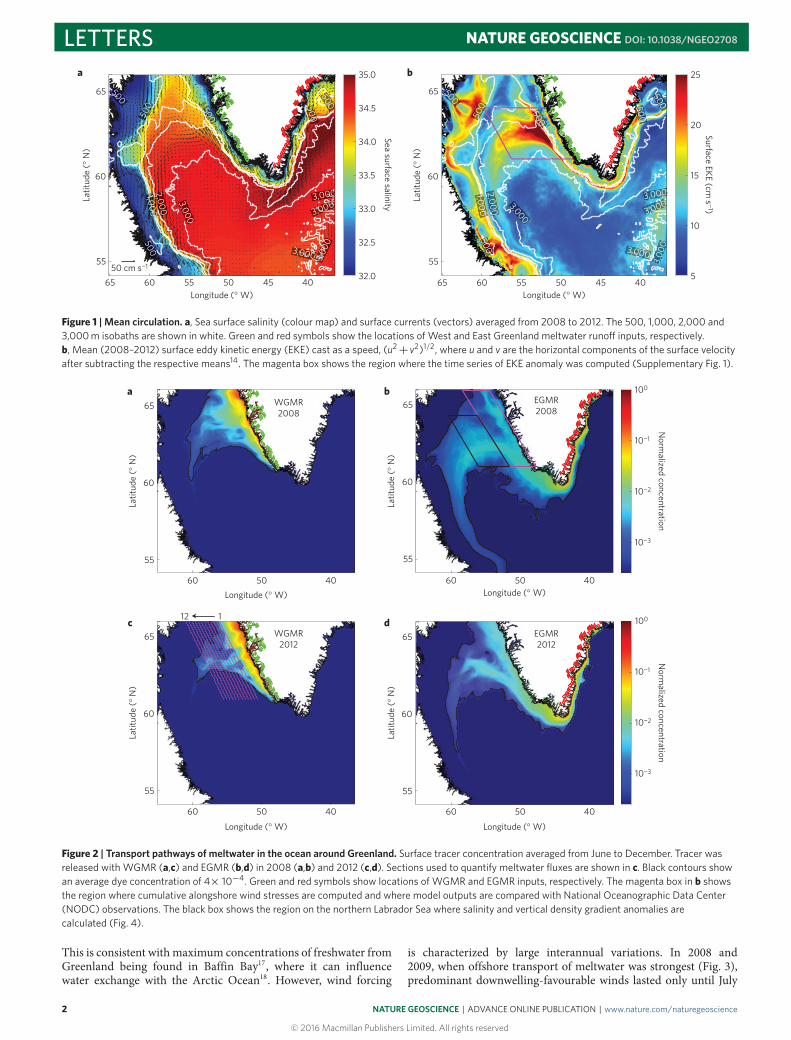
Figure 1 | Mean circulation. a, Sea surface salinity (colour map) and surface currents (vectors) averaged from 2008 to 2012. The 500, 1,000, 2,000 and3,000 m isobaths are shown in white. Green and red symbols show the locations of West and East Greenland meltwater runo� inputs, respectively.b, Mean (2008–2012) surface eddy kinetic energy (EKE) cast as a speed, (u2
+v2)1/2, where u and v are the horizontal components of the surface velocityafter subtracting the respective means14. The magenta box shows the region where the time series of EKE anomaly was computed (Supplementary Fig. 1).
60 4050Longitude (° W) Longitude (° W)
Longitude (° W)Longitude (° W)
55
60
Latit
ude
(° N
)La
titud
e (°
N)
Latit
ude
(° N
)La
titud
e (°
N)
Norm
alized concentrationN
ormalized concentration
65a
WGMR2008
60 50 40
55
60
65b
EGMR2008
10−3
10−2
10−1
100
10−3
10−2
10−1
100
60 50 40
55
60
65c
WGMR2012
12 1
60 50 40
55
60
65d
EGMR2012
Figure 2 | Transport pathways of meltwater in the ocean around Greenland. Surface tracer concentration averaged from June to December. Tracer wasreleased with WGMR (a,c) and EGMR (b,d) in 2008 (a,b) and 2012 (c,d). Sections used to quantify meltwater fluxes are shown in c. Black contours showan average dye concentration of 4× 10⁻⁴. Green and red symbols show locations of WGMR and EGMR inputs, respectively. The magenta box in b showsthe region where cumulative alongshore wind stresses are computed and where model outputs are compared with National Oceanographic Data Center(NODC) observations. The black box shows the region on the northern Labrador Sea where salinity and vertical density gradient anomalies arecalculated (Fig. 4).
This is consistent with maximum concentrations of freshwater fromGreenland being found in Baffin Bay17, where it can influencewater exchange with the Arctic Ocean18. However, wind forcing
is characterized by large interannual variations. In 2008 and2009, when offshore transport of meltwater was strongest (Fig. 3),predominant downwelling-favourable winds lasted only until July
2
© 2016 Macmillan Publishers Limited. All rights reserved
NATURE GEOSCIENCE | ADVANCE ONLINE PUBLICATION | www.nature.com/naturegeoscience
© 2016 Macmillan Publishers Limited. All rights reserved.

NATURE GEOSCIENCE DOI: 10.1038/NGEO2708 LETTERS
Volu
me
(km
3 )Pe
rcen
tage
(%)
Distance (km)160260360
Distance (km)160260360
Section
dc
a b
9 7 5 3 111Section
9 7 5 3 1110
10
30
40
50
30
20
10
0
20082009201020112012
20
60
50
Volu
me
(km
3 )
0
10
30
40
20
50
40
Perc
enta
ge (%
)
50
30
20
10
0
60
40
Figure 3 | O�shore export of meltwater in the Labrador Sea. Cumulative transport of meltwater into the northern Labrador Sea by 31 December of2008–2012 across the 12 sections shown in Fig. 2c. a,b, Volumes of freshwater from WGMR (a) and EGMR (b). c,d, Percentage of freshwater fromWGMR (c) and EGMR (d) (that is, normalized by the amount of meltwater introduced into the ocean along the West and East Greenland coasts)transported o�shore across the sections.
(Fig. 4b). From August to October, coastal winds were upwellingfavourable (Fig. 4b), which facilitated the offshore transport ofmeltwater. In 2010 and 2012, winds were downwelling favourableduring the entire melting season, explaining why those two yearswere characterized by small offshore transport of meltwater (Fig. 3)despite the large runoff (Fig. 4a).
Analysis of tracers in 2011, when offshore transport waslarge for EGMR (as large as in 2008/2009; Fig. 3d), but lowfor WGMR (almost as low as in 2010/2012; Fig. 3c) furthersupports this interpretation. Winds off West Greenland werestrongly downwelling favourable until mid-September, but stronglyupwelling favourable after that (Fig. 4b). As most of the WGMRentered the ocean in July–August (Fig. 4a), it experienceddownwelling-favourable winds, which is consistent with weakoffshore transport (Fig. 3a,c). The situation is different for EGMR,however. Even though freshwater from EGMR is also introducedinto the ocean at approximately the same time (Fig. 4a), it takesabout 2–2.5 months for it to be transported around the southerntip of Greenland into the West Greenland Current (SupplementaryFig. 2). By that time, winds in 2011 had reversed, becomingpredominantly upwelling favourable (Fig. 4b), which is consistentwith strong offshore transport of EGMR (Fig. 3b,d). The reversal inpredominant wind direction in mid-September resulted in a strongdifference in the fate of the freshwater from WGMR and EGMR in2011. Similar wind reversals have occurred 20–25%of the time since1979 (Supplementary Fig. 3).
The westward transport of meltwater results in a decrease insalinity offshore compared to a scenario in which no meltwaterrunoff is considered (Fig. 4c), particularly in 2008–2009 whenenhanced export occurred. The salinity decrease offshore due tomeltwater input is about 20% of the seasonal decrease detected inobservations near the coast due to all sources of freshwater (for
example, meltwater, freshwater from the Arctic transported by theEast and West Greenland Currents; Supplementary Fig. 4c). Thevertical density gradient in the top 100m also increases significantlyoffshore in those years (Fig. 4d), by 40% in 2008 and by as muchas 100% during a short pulse in 2009. Because glacial runoff ispredicted to increase substantially in the coming decades12, weexplore an idealized scenario in which meltwater runoff is doubledcompared to present conditions. In that case, the decrease in salinityand the increase in vertical density gradients offshore are alsolargely enhanced, more than doubling in 2008–2009 compared tothe anomalies produced under present conditions (Fig. 4c,d). Theadditional meltwater leads to a reduction in mixed layer depth nearthe West Greenland coast (Supplementary Fig. 5), which results inthe wind energy being trapped in a thinner surface Ekman layer15and in stronger offshore velocities, leading to enhanced offshoretransport. As such, doubling meltwater input results in more-than-double increases in salinity and stratification anomalies away fromthe coast. The period with large anomalies in the northern LabradorSea also increases, persisting further into winter, especially in 2008(Fig. 4c,d).
Our analysis reveals that coastal winds play a crucial role inthe fate of GrIS meltwater runoff. Other factors are also likelyto be important, including mean circulation patterns and eddyactivity. Eddies can efficiently transport coastal water offshore19. Ifmeltwater reaches the area of high mesoscale activity observed inthe region14 (Fig. 1b), then eddies can contribute to exporting thelow-salinity waters farther offshore into the northern and centralLabrador Sea19,20. Themean currents at 100–150 km from shore turnwestwards around 62◦–63◦N21 (Fig. 1a), indicating that if meltwaterreaches that region, it can be further transported offshore. Thesemay explain the large differences in offshore transport observedbetween WGMR and EGMR (Figs 2 and 3). WGMR is typically
NATURE GEOSCIENCE | ADVANCE ONLINE PUBLICATION | www.nature.com/naturegeoscience
© 2016 Macmillan Publishers Limited. All rights reserved
3
© 2016 Macmillan Publishers Limited. All rights reserved.

LETTERS NATURE GEOSCIENCE DOI: 10.1038/NGEO2708
10
20
0
30
40a
Mel
twat
er ru
noff
(×10
3 m3 s
−1)
2008 2009 2010 2011 2012
2008 2009 2010 2011 2012
Year
−0.8
−5
−4
−3
−2
−1
0
−0.6
−0.4
−0.2
0.0
Cum
ulat
ive
win
d st
ress
(N
m−2
d)
1.7
1.5
1.3
1.1
0.9
Runoff ratio
Salin
ity a
nom
aly
Ver
tical
den
sity
gra
dien
tan
omal
y (×
10−3
kg
m−4
)
Year
2008 2009 2010 2011 2012Year
b
c
d
0
−2
−4
−6
2
4
6
J J A S O N DMonth
WGMR
EGMR
20082009201020112012
Figure 4 | Interannual variability in the Labrador Sea. a, GrIS meltwater runo�. b, Cumulative alongshore wind stress averaged along West Greenland(magenta box in Fig. 2b) for the months June to December. Black line and shaded grey show mean±1 s.d. for 2003–2012. c, Salinity anomaly in thenorthern Labrador Sea (black box in Fig. 2b) due to meltwater, defined as the di�erence between simulations with and without meltwater input (blue), andbetween simulations with double meltwater input and without meltwater input (red). d, Same as c, but for the vertical density gradient in the top 100 m.
delivered to the ocean from inside fjords, and therefore would needto be transported offshore by somemechanism (for example, winds)before it can reach the region where eddies and/or mean circulationcan transport the low-salinity water farther away from the coast.However, coastal winds are downwelling favourable on average(Fig. 4b), acting against that transport. EGMR is also introduced intothe ocean via fjords, but it is then transported for several hundredkilometres in the East Greenland Current before reaching WestGreenland, allowing the band of low-salinity water to widen (forexample, owing to mixing, flow–topography interactions; compareWGMR and EGMR distribution at 61◦N along West Greenland,Fig. 2). That widening allows low-salinity water to reach the regionof increased mesoscale activity where the mean circulation isdeflected offshore (Fig. 1), which would lead to further offshoretransport.
Model results reveal surprisingly large differences in the fateof freshwater from EGMR and WGMR in the ocean surroundingGreenland. This discrepancy can have important biogeochemicalimplications, especially if EGMR and WGMR have differentchemical compositions or seasonal timing. Most of the freshwaterfrom WGMR is transported northwards into Baffin Bay. Givenenough time, a fraction of suchmeltwater runoffmay be transported
by the mean ocean circulation around Baffin Bay and eventuallyback into the western Labrador Sea22. Most of the meltwater beingtransported directly into the Labrador Sea is introduced into theocean along East Greenland, however, implying a much shortertransit time of a few months. This indicates that up to 60% ofthe EGMR reaches the northern Labrador Sea by fall/early winter,where it can affect surface stratification. Our idealized simulationsrepresenting future conditions reveals that further increases inmeltwater runoff, especially along East Greenland, will probablylead to enhanced freshwater fluxes towards the northern LabradorSea, so that doubling meltwater input results in more-than-doubleincreases in salinity and stratification anomalies offshore. Theincreased anomalies may extend further into winter, with possibleimplications for hydrography and vertical stability. Whereas manystudies have quantified chemical fluxes (for example, iron2, organiccarbon23, phosphorus24) in meltwater runoff fromWest Greenland,long-term studies along East Greenland are less common. Ourresults suggest that nutrients introduced into the oceanwithWGMRwill probably be transported northwards into Baffin Bay, whereasthe northern Labrador Sea will be more influenced by chemicalconstituents introduced with EGMR. Because nutrient inputassociated with glacial runoff can affect primary productivity25,
4
© 2016 Macmillan Publishers Limited. All rights reserved
NATURE GEOSCIENCE | ADVANCE ONLINE PUBLICATION | www.nature.com/naturegeoscience
© 2016 Macmillan Publishers Limited. All rights reserved.

NATURE GEOSCIENCE DOI: 10.1038/NGEO2708 LETTERSand nutrient yields can vary substantially between Greenlandglaciers24, constraining fluxes from East Greenland glaciers will beimportant to quantify the potential impacts of increased runoff onbiogeochemical processes in the Labrador Sea.
Although GrIS meltwater runoff has been increasing inboth West and East Greenland (Supplementary Fig. 6), thelargest increase in recent years occurred mostly along the westcoast6,9. EGMR, which was shown here to have a more directimpact on the northern Labrador Sea, was characterized bycomparatively smaller interannual variability recently (Fig. 4a).Knowing whether this pattern will continue, or if runoff alongEast Greenland will also accelerate in the future, will be crucial tounderstand the potential impacts of Greenland ice sheet melting onocean processes.
MethodsMethods, including statements of data availability and anyassociated accession codes and references, are available in theonline version of this paper.
Received 17 February 2016; accepted 31 March 2016;published online 25 April 2016
References1. Straneo, F. et al . Impact of fjord dynamics and glacial runoff on the circulation
near Helheim Glacier. Nature Geosci. 4, 322–327 (2011).2. Bhatia, M. P. et al . Greenland meltwater as a significant and potentially
bioavailable source of iron to the ocean. Nature Geosci. 6, 274–278 (2013).3. Fichefet, T. et al . Implications of changes in freshwater flux from the Greenland
ice sheet for the climate of the 21st century. Geophys. Res. Lett. 30,1911 (2003).
4. Shepherd, A. et al . A reconciled estimate of ice-sheet mass balance. Science 338,1183–1189 (2012).
5. Rignot, E., Box, J. E., Burgess, E. & Hanna, E. Mass balance of the Greenland icesheet from 1958 to 2007. Geophys. Res. Lett. 35, L20502 (2008).
6. Nghiem, S. V. et al . The extreme melt across the Greenland ice sheet in 2012.Geophys. Res. Lett. 39, L20502 (2012).
7. Tedesco, M. et al . in State of the Climate in 2013 Vol. 95 (eds Blunden, J.& Arndt, D. S.) S136–S138 (American Meteorological Society, 2014).
8. Enderlin, E. M. et al . An improved mass budget for the Greenland ice sheet.Geophys. Res. Lett. 41, 866–872 (2014).
9. Hanna, E. et al . Increased runoff from melt from the Greenland ice sheet:a response to global warming. J. Clim. 21, 331–341 (2008).
10. Ogi, M., Tachibana, Y., Nishio, F. & Danchenkov, M. A. Does the fresh watersupply from the Amur River flowing into the sea of Okhotsk affect sea iceformation? J. Meteorol. Soc. Jpn 79, 123–124 (2001).
11. Mernild, S. H. & Liston, G. E. Greenland freshwater runoff. Part II: distributionand trends, 1960–2010. J. Clim. 25, 6015–6035 (2012).
12. Fettweis, X. et al . Estimating the Greenland ice sheet surface mass balancecontribution to future sea level rise using the regional atmospheric climatemodel MAR. Cryosphere 7, 469–489 (2013).
13. Haidvogel, D. B. et al . Ocean forecasting in terrain-following coordinates:formulation and skill assessment of the Regional Ocean Modelling System.J. Comput. Phys. 227, 3595–3624 (2008).
14. Luo, H., Bracco, A. & Di Lorenzo, E. The interannual variability of the surfaceeddy kinetic energy in the Labrador Sea. Prog. Oceanogr. 91, 295–311 (2011).
15. Fong, D. A. & Geyer, W. R. Response of a river plume during an upwellingfavorable wind event. J. Geophys. Res. 106, 1067–1084 (2001).
16. Barth, J. A. et al . Delayed upwelling alters nearshore coastal ocean ecosystemsin the northern California current. Proc. Natl Acad. Sci. USA 104,3719–3724 (2007).
17. Dukhovskoy, D. S. et al . Greenland freshwater pathways in the sub-Arctic Seasfrom model experiments with passive tracers. J. Geophys. Res. 121,877–907 (2016).
18. Rudels, B. Volume and freshwater transports through the Canadian ArcticArchipelago-Baffin Bay system. J. Geophys. Res. 116, C00D10 (2011).
19. Katsman, C. A., Spall, M. A. & Pickart, R. S. Boundary current eddies and theirrole in the restratification of the Labrador Sea. J. Phys. Oceanogr. 34,1967–1983 (2004).
20. Khatiwala, S., Schlosser, P. & Visbeck, M. Rates and mechanisms of water masstransformation in the Labrador Sea as inferred from tracer observations.J. Phys. Oceanogr. 32, 666–686 (2002).
21. Myers, P. G. Impact of freshwater from the Canadian Arctic Archipelago onLabrador Sea Water formation. Geophys. Res. Lett. 32, L06605 (2005).
22. Cuny, J., Rhines, P. & Kwok, R. Davis Strait volume, freshwater and heat fluxes.Deep-Sea Res. I 52, 519–542 (2005).
23. Lawson, E. C., Bathia, M. P., Wadham, J. L. & Kujawinski, E. B. Continoussummer export of nitrogen-rich organic matter from the Greenland ice sheetinferred by ultrahigh resolution mass spectrometry. Environ. Sci. Technol. 48,14248–14257 (2014).
24. Hawkings, J. et al . The Greenland ice sheet as a hot spot of phosphorusweathering and export in the Arctic. Glob. Biogeochem. Cycles 30,191–210 (2016).
25. Bamber, J., van den Broeke, M., Ettema, J., Lenaerts, J. & Rignot, E. Recent largeincreases in freshwater fluxes from Greenland into the North Atlantic. Geophys.Res. Lett. 39, L19510 (2012).
AcknowledgementsWe thank J. T. Hollibaugh for valuable comments and suggestions, which led to a greatlyimproved manuscript. We gratefully acknowledge support by NASA (NNX14AD98G,NNX14AM70G and NNX13AD80G). Additional support was provided by NSF(PLR-01304807 and OCE-1357373).
Author contributionsH.L. and R.M.C. conceived and designed the research; H.L. ran the model; A.K.R.,M.T., A.B., P.L.Y. and T.L.M. contributed materials/analysis tools; H.L. and R.M.C.analysed the data/model outputs and wrote the paper; all authors commented on themanuscript.
Additional informationSupplementary information is available in the online version of the paper. Reprints andpermissions information is available online at www.nature.com/reprints.Correspondence and requests for materials should be addressed to R.M.C.
Competing financial interestsThe authors declare no competing financial interests.
NATURE GEOSCIENCE | ADVANCE ONLINE PUBLICATION | www.nature.com/naturegeoscience
© 2016 Macmillan Publishers Limited. All rights reserved
5
© 2016 Macmillan Publishers Limited. All rights reserved.

LETTERS NATURE GEOSCIENCE DOI: 10.1038/NGEO2708
MethodsThe ocean modelling effort builds on a previous implementation of the RegionalOcean Modeling System (ROMS)13 to the Labrador Sea and southernGreenland14,26. The model has a horizontal resolution of 2.5 km with 30 verticalterrain-following layers. Vertical mixing is parameterized according to theLarge/McWilliams/Doney scheme. Initial and boundary conditions are obtainedfrom the Simple Ocean Data Assimilation (SODA 2.2.4) reanalysis27, which hasbeen shown to produce improved results in this implementation compared to otherreanalyses26. A modified radiation condition coupled with nudging to thereanalysis is prescribed along the boundaries14,26. ROMS is additionally forced bydaily surface wind stresses and heat fluxes from the European Centre forMedium-Range Weather Forecasts (ECMWF) ERA-interim reanalysis28. Surfaceheat fluxes are employed with nudging towards NOAA extended sea surfacetemperatures to avoid model drifts26.
The regional climate model Modèle Atmosphérique Régional (MAR) coupledto the 1-D Surface Vegetation Atmosphere Transfer scheme Soil Ice SnowVegetation Transfer (SISVAT)29 is used to estimate ice sheet surface meltwaterrunoff. To calculate time series of meltwater fluxes into the ocean at the majorinput locations, MAR runoff is integrated for 108 ice sheet catchments upstream ofeach input loci. Catchment areas and their output locations are determined byusing a high-resolution ice sheet surface elevation model30. Average MAR runoff(266±66 GT yr−1) over the entire ice sheet is comparable to runoff from theRegional Atmospheric Climate Model with ECMWF forcing (282±62 GT yr−1)12.Idealized simulations with no meltwater input or with double input are alsopursued. Although ice discharge from marine terminating glaciers of the GrIS alsoprovides freshwater input to the ocean, those fluxes are most substantial outside orat the edges of our study area8, and were not included here. Two different passivetracers with unit concentration are released with meltwater runoff along the West(west of 47.6◦W and south of 66◦ N) and East (east of 44.2◦W and south of 66◦ N)Greenland coasts (WGMR and EGMR, respectively; see Fig. 2), so that the amountof the tracers released is proportional to the local freshwater fluxes. The totalvolume of meltwater passing through 12 alongshore sections shown in Fig. 2c isquantified for each year.
Although it would have been consistent to force ROMS with MAR winds, theMAR domain covers only a small fraction of the ocean model domain. Detailedanalysis reveals that ERA-Interim and MAR winds are highly correlated andconsistent to each other in the study region. ROMS was run from 1999 to 2012, andthe first four years were discarded from analyses (model spin-up). Here, we focusedonly on 2008 to 2012, which included anomalous events of meltwater runoff andwind forcing. Because SODA 2.2.4 reanalysis is available only until 2010, weextended the model run to 2012 by repeating the 2010 boundary conditions for thefollowing two years.
The model implementation builds on a previous investigation in which thecirculation and surface eddy kinetic energy were validated with observed altimetrydata14,26. Additional model–data comparisons are shown in Supplementary Fig. 4.
Because few in situ observations are available, model results are compared withhistorical observations from the National Oceanographic Data Center (NODC).Observed sea surface salinity (SSS) from 1950 to 2013 is shown in SupplementaryFig. 4a and the modelled SSS from 2003 to 2012 is shown in Supplementary Fig. 4b.We use data since 1950 because of the relatively small number of observationsavailable for 2003–2012. A band of low SSS broadening to the northwest isobserved along the West Greenland coast, associated with freshwater input duringsummer. Surface water farther from the coast is much saltier, both in theobservations and in the model. Time series of monthly averaged salinity along thecoast (inside the magenta box in Fig. 2b) reveal that the model is able to capture thefreshening observed during summer (Supplementary Fig. 4c). Modelled salinitybefore July and after October is overestimated by 0.1–0.4, possibly because theSODA reanalysis used as the boundary condition is characterized by slightlywarmer and saltier conditions compared to the observed mean state26. Modelresults also agree well with time series of potential temperature at depth(1,000–1,500m) at the central Labrador Sea obtained by Argo profiles(Supplementary Fig. 4d), capturing the observed warming trend during the pastdecade and the rapid drops in temperature during the winters of 2008 and 2012.This suggests that the model can capture the processes characterizing not only theinput of meltwater near the coast, but also those related to large-scale circulationpatterns in the study region14,26. The model–data discrepancy increases slightly (by0.05 ◦C) after 2011 (Supplementary Fig. 4d), presumably because SODA reanalysisdata are not available after 2010 (that is, boundary conditions were repeatedafter that).
Code availability.Model codes are available at www.myroms.org andwww.cryocity.org/mar-explorer.
Data availability. The data/reanalysis that support the findings of this study arepublicly available online at www.nodc.noaa.gov, www.argo.ucsd.edu andwww.ecmwf.int/en/research/climate-reanalysis/era-interim.
References26. Luo, H., Bracco, A., Yashayaev, I. & DiLorenzo, E. The interannual variability of
potential temperature in the central Labrador Sea. J. Geophys. Res. 117,C10016 (2012).
27. Carton, J. A. & Giese, B. S. A reanalysis of ocean climate using Simple OceanData Assimilation (SODA).Mon. Weath. Rev. 136, 2999–3017 (2008).
28. Dee, D. P. et al . The ERA-Interim reanalysis: configuration and performance ofthe data assimilation system. Q. J. R. Meteorol. Soc. 137, 553–597 (2011).
29. Gallée, H. & Schayes, G. Development of a three-dimensional meso-γ primitiveequations model.Mon. Weath. Rev. 122, 671–685 (1994).
30. Rennermalm, A. K. et al . Evidence of meltwater retention within the Greenlandice sheet. Cryosphere 7, 1433–1445 (2013).
© 2016 Macmillan Publishers Limited. All rights reserved
NATURE GEOSCIENCE | www.nature.com/naturegeoscience
© 2016 Macmillan Publishers Limited. All rights reserved.