northern ireland quarterly house price index
TRANSCRIPT
Northern Ireland Quarterly House Price Index
For Q3 2020 Report Number 144 ISSN 1462-2351
IntroductionThis survey analyses the performance of the Northern Ireland housing market during the third quarter of 2020 (July, August and September). The report details the key trends and spatial patterns in the housing market, drawing comparisons with the third quarter of 2019 as a measure of annual change and with the second quarter of 2020 as an indicator of quarterly change. The report is produced by Ulster University in partnership with the Northern Ireland Housing Executive and Progressive Building Society.
The price statistics are based upon market evidence as the housing market and economy have emerged from the initial ‘lockdown’ period1. It would seem that there has been a psychological impact for both prospective buyers and those wanting to trade up within the market, with pronounced activity levels particularly for mid-to-high priced semi-detached and detached properties. Indeed, whilst the pandemic had a profound effect on halting market momentum, there has clearly been a rebound effect – and whether this buoyancy continues or there is a ‘dead cat bounce’ remains to be seen. As wider economic instabilities, the implications of Brexit and the general uncertainty relating to the pandemic continue to inhibit ‘normal’ market operations, the market has nonetheless continued to exhibit high levels of resilience this quarter. Looking ahead, the outlook continues to be characterised by many ‘unknowns’, but the ‘stamp-duty effect’, further extension of the furlough scheme and adaptation of remote working practices and patterns will arguably cushion any dampening in what is traditionally a period of quieter market activity, as purchaser sentiment and demand for housing remain resolute.
With the second quarter of the year revealing limited transactional evidence as a result of the national lockdown, there were signs of pent-up market demand, and the re-opening of the market in the final month of that quarter showed levels of activity consistent with normal market trends. This report is premised upon 2,273 transactions, which is in line with the 2,339 transactions reported in Q3, 2019 and the highest since then, serving to highlight that more ‘normal’ levels of market activity have resumed.
Information is presented on the residential property market for Northern Ireland and the report includes analysis of average sale price by different property types across Northern Ireland (where applicable and available). The overall performance of the housing market is measured by a weighted index and reflects the market share of each property type. The index captures various movements within a single statistic and allows for the analysis of changes over time. At sub-regional level, the analysis in this report considers market pricing within each Local Government District (LGD) throughout Northern Ireland. In addition, to reflect the localities within which households tend to make decisions about house purchase, the regional analysis also presents price trends based on functional housing market areas (HMAs) defined by the Housing Executive in 2018.
2
Northern Ireland Quarterly House Price Index
1 The full ‘lockdown’ period commenced on March 23rd with the housing market reopening on the 15th June 2020 in NI.
Northern Ireland Quarterly House Price Index
ContentsBusiness as usual? 4
Foreword from Progressive Building Society 5
General Market Trends 6Performance by Property Type 8Performance by Region 9The House Price Index 12Contributors 13
3
Northern Ireland Quarterly House Price Index
Business as usual?With three of the four quarters in this calendar year now past, reviewing the analysis on a three-month period of 2020 during which the housing market was fully open for business brings a sense of returning – albeit perhaps temporarily – to some semblance of the normality we so long took for granted. The findings set out by the team at Ulster University support the previously-reported views of estate agents and surveyors, which had indicated that a strong level of pent-up demand accumulated while the housing market was closed earlier in the year. The result has been that, despite a prevailing climate of uncertainty, the number of transactions captured in the quarterly sample was back in line with longer term trends and, at £179,951, the average price of the properties sold was 3.5% higher, on a weighted basis, than in Q3 2019.
The analysis in this report points to a significant level of ‘trading up’ activity in the local housing market between July and September, suggesting that some households reviewed their living arrangements – and possibly the feasibility of long term remote working from their current home – during lockdown. However, the feedback from estate agents highlights that for those households not already on the housing ladder, the consequences of the pandemic response have been much more challenging. A general reduction in the loan-to-value ratio on offer to first time buyers has seen deposit requirements increase sharply, with implications for the immediate prospects of those wishing to purchase their first home, many of whom are living in private rented accommodation.
Among a number of research reports recently published by the Housing Executive, two in particular provide some useful insights on the current situation of both private tenants and landlords. Our review on COVID-19, Housing and the Housing Market i noted that:
• Across the UK, issues that had already been challenging for private renters – affordability, security of tenure and property conditions – were exacerbated by the response to the pandemic. Private tenants were generally paying a higher proportion of their income towards housing costs than those living in other tenures and some were facing job losses and reduced income, putting them at risk of rental debt.
• In Northern Ireland, commentators noted that many of the young workers particularly impacted by the lockdown were likely to be private tenants. Local research by Renters’ Voiceii indicated that some tenants were experiencing stress and challenges in relation to household finances, paying rent and potential eviction; of 94 people surveyed, one third had lost employment as a result of the lockdown.
A second report, summarising the results of an online survey that received just over 1,700 responses, provided a timely picture of the circumstances and views of private landlords with properties in Northern Irelandiii. The findings in relation to landlords’ financial circumstances in particular – albeit in the pre-COVID landscape – are helpful in getting some sense of the overall stability of the sector. Some of the key points were that:
• The majority (67%) were ‘intentional’, rather than ‘accidental’ landlords, and having a long term investment to supplement pension income was the most commonly-cited reason for being a landlord.
• More than half of the landlords who took part in the survey had at least one property that was owned outright.
• More than one third (37%) said they depended on rental income to cover the mortgage payments on their rental property, or some of their rental properties.
• 15% of respondents had a property or properties in negative equity, compared with an overall estimated rate for Northern Ireland of around 6%.
• Almost half (45%) intended to remain a landlord for five years or more and 19% for less than five years, but more than one third were unsure about how long they would continue to rent properties to private tenants.
• Asked what might make them leave the rental market, the main issues cited were personal reasons (approaching retirement, other commitments etc; 46%), poor return from rent (44%) and antisocial behaviour by tenants (also 44%; respondents were able to select more than one reason).
Overall, the survey findings point to a relatively stable and mature private rented sector, but in combination with the evidence on tenants’ circumstances they also indicate that some private landlords and tenants may be vulnerable to the impacts of changes in income or other circumstances. The recent extension of the furlough scheme, along with other support measures already in place, has eased immediate pressures for many households. However, in the face of a variety of significant challenges including the contraction in the local economy and the uncertainty around both the ongoing Brexit negotiations and the trajectory of the response to the pandemic, while the strong level of activity during the third quarter was encouraging, it is perhaps a little too early to assume that the local housing market has returned to business as usual.
Ailbhe Hickey Assistant Director, Land & Regeneration (A) Northern Ireland Housing Executive
4
i COVID-19, housing and the housing market: synopsis of events and evidence to date, with a focus on Northern Ireland available at: www.nihe.gov.uk/Documents/Research/Housing-Market-Analysis/COVID-19-housing-and-the-housing-market.aspx?ext=
ii Covid-19 Private Renters Survey, available at: www.housingrights.org.uk/sites/default/files/field/image/RentersVoice_Covid-19_survey_report%20.pdf
iii Survey of Private Landlords 2019: Key Findings available at www.nihe.gov.uk/Documents/Research/Private-Landlords-Survey/survey-of-private-landlords-2019-key-findings-repo.aspx
5
Northern Ireland Quarterly House Price Index
Foreword Michael Boyd, Progressive Building Society The positive performance within the Northern Ireland housing market towards the end of Q2 2020 following lockdown and the market re-opening has continued in Q3, with a quarterly price increase of 3.4% and an annual rise of 3.5%. There has been pronounced activity levels within the mid to high value range particularly semi-detached and detached houses, seeing increasing numbers of people trading up.
There are a number of factors that have contributed to this positive performance at a time of considerable economic challenge. Notably, pent up demand from market closure has been a factor with the vast majority of agents seeing an increase in the level of viewings and, pertinently, 97% seeing this translate into higher completion rates. Other factors that have had an influence include the introduction of the government’s stamp duty holiday, and importantly, an affordable and resilient Northern Ireland housing market.
Regional OutlookAnalysis at the regional level, based upon the eleven Local Government Districts (LGD’s), indicates that once again the regional market remains varied with some LGD’s showing significant growth and others seeing lesser declines. Unlike last quarters sample, which was reduced due to the Coronavirus Pandemic, this quarter shows that on a regional level the market is showing resilience in a time of disruption.
For Q3 of 2020 Antrim & Newtownabbey saw the greatest quarterly increase of 24.54%, with the average price going from £128,457 in Q2 of 2020 to £159,986 in Q3. This is a significant increase considering that the Antrim & Newtownabbey LGD saw the greatest quarterly decrease in Q2. On the other hand, the largest quarterly decrease for Q3 came from the Mid & East Antrim LGD which saw a decline of 9.66% having gone from £167,285 in Q2 to £151,121 in Q3 of 2020. Contrary to Q2 of 2020 Ards & North Down LGD is now the highest priced region with the average house price increasing from £179,814 in Q2 to £210,189 in Q3 of 2020. Another significant increase in Q3 is for the Newry, Mourne & Down LGD which saw a quarterly increase of 12.10% going from £167,976 in Q2 to £188,308 in Q3.
SummaryWith 69% expecting prices to remain relatively constant, confidence amongst agents within the market remains high, despite the considerable uncertainty of the economic impact of COVID and the imminent Brexit date at the end of the year.
The Northern Ireland housing market’s realignment over 10 years ago resulting in consistent and sustainable growth, is undoubtedly a factor in its ability to absorb economic shocks with resilience and affordability determining characteristics. The extension of the UK government’s furlough scheme through to March 2021 and the positive announcements regarding a vaccine cannot be underestimated.
However, we are entering a period of unprecedented uncertainty when thriving sectors within our economy will be further adversely impacted by the pandemic. The Northern Ireland Executive’s investment, its agility in supporting business in an extremely fluid environment and its influence on public sentiment on both COVID and Brexit, will have an important bearing on how the market performs in Q4 and in 2021.
At Progressive we remain committed to playing an important role within the economy, through continued investment, and in helping our members achieve their home ownership goals. We will continually review the market enabling us to provide the support and guidance that home buyers are looking for. Michael BoydDeputy Chief Executive & Finance DirectorProgressive Building Society
General Market TrendsThe main findings of this survey indicate a market which, while continuing to be disrupted by the global pandemic, remains resilient and has witnessed nominal price growth relative to the first two quarters of the year. The House Price Index shows both annual and quarterly price increases of circa 3.5%. Initial post-‘lockdown’ signals indicated pent-up demand driven by subtle differentiated demand tastes. This appears to have continued, with transaction levels returning to normal and increasing in the mid value range of the market. This latest survey indicates a residential property market that continues to exhibit resilience in terms of price signals and characterised by strong levels of underpinning market demand and appetite.
In contrast with the previous three quarterly surveys, which showed a shift in transaction levels in the upper end of the market, this survey shows heightened market activity above the traditional market average – symptomatic of ‘trading up’ market filtering processes in the middle range of the pricing levels. The overall average price of residential property in Northern Ireland for the third quarter of 2020 is £179,951, which represents a weighted annual level of growth of 3.5% between Q3 2019 and Q3 20202. When considering quarterly movements, the Index displays an increase of 3.4% relative to Q3 2019. This growth appears to be driven by the increased activity in the semi-detached and new build sectors across the province.
Agents’ commentary and COVID-19 housing market surveyFor this reporting period, a questionnaire survey was distributed to contributing agents in order to ascertain more in-depth assessment of activity levels and market sentiment. This builds upon our COVID-19 survey from the previous quarter and is an important tool to capture stakeholder insight and opinion which supplement and enhance the richness of the transaction-based evidence.
Our previous survey on the implications of COVID for the housing market had highlighted how the enforced closure had initially curtailed the strong levels of momentum that had been apparent in the early months of 2020. Whilst the emergence from economic hibernation remains tentative, with the full implications of the pandemic and Brexit yet to fully play out, it is nonetheless clear that pent up demand continued to be the dominant driver of the increase in housing transaction volumes and viewing levels over the course of Q3 2020. In terms of current market activity, our survey this quarter highlights that the vast majority of agents have experienced an increase in the number of viewings. Perhaps more pertinently, the increased footfall has fuelled heightened levels of transactions, with 97% of agents surveyed reporting higher completion rates in the three months to the end of September relative to the previous quarter. Moreover, a little over half the agents surveyed (52%) expect transaction levels to be sustained over the remainder of the year, with 11% of agents actually anticipating further growth despite what is traditionally a more ‘subdued’ period of the year.
In terms of the pricing structure, the majority of agents (69%) expect prices to remain relatively constant over the remainder of the year. A small number of agents (17%) project an increase in house prices over the next three months, premised mainly on the levels of pent-up demand and the lack of suitable product in some key sub-markets. By way of contrast, 14% of the agents participating in the survey felt that prices may fall slightly if the economic implications of the pandemic persist and unemployment levels were to increase dramatically. Overall, the survey results nonetheless indicate that market sentiment amongst both sellers and prospective purchasers remains buoyant, with 59% of respondents of the opinion that confidence in the market was more positive than in the previous quarter. The second English national lockdown, and the prospect of rolling lockdowns and ‘circuit breaks’ in the other UK regions may alter these opinions moving forward, although one agent did comment that there is a ‘clambering’ aspect to the market, as people try to complete on purchases in case, or before, further restrictions are brought into force.
Maintaining that confidence and sustaining the momentum that has been built up since the market reopened will be critical to the demand for new housing and to ensuring that the construction and house building sectors can play an integral role in the economic recovery strategy. With this in mind agents were asked to share their thoughts on mortgage market accessibility and the potential implications of the contractions in LTV ratios in the wake of the pandemic. The majority of agents (62%) felt that the implications of many lenders now applying 85% LTV ratios had a negative impact on the market and has certainly been a key factor inhibiting First Time Buyers (FTBs). For many FTBs the deposit increase of 5% has effectively scuppered their immediate capacity to get onto the property ladder and a number of agents were in a position to detail evidence of how changes in lending criteria had impacted upon completions.
Considering the longer term outlook for the housing market moving into 2021 it is clear that, should the financial and economic implications of the pandemic persist, agents anticipate an impact on the pricing structure. The majority of respondents (61%) anticipated a small negative impact but believed that even if price drops were to occur, these would be relatively small. A further 14% felt that the pandemic would not impact the prevailing pricing structure but ultimately the nature and extent of any impact on the pricing structure would depend upon the extent of continued government intervention to support jobs and to stimulate economic recovery. At the time of writing Northern Ireland is operating in a ‘circuit breaker’ environment and some commentators have called for a second ‘lock-down’ period. In addition, with Brexit less than three months away, even the short-term economic landscape remains characterised by uncertainty. Whilst prevailing demand for housing continues to outstrip supply, the extent to which the momentum ‘bounce’ witnessed since the reopening of the market can be sustained into 2021 remains an open question.
6
2 The HPI weights the sample mix by property type which compares price and quantity statistics from the current period in relation to the base period.
Northern Ireland Quarterly House Price Index

7
Northern Ireland Quarterly House Price Index
Sample distributionThe data collected in quarter three displayed some rather notable movements across the price distribution. The proportion of lower priced properties (below £100,000) equated to 16%, a decrease of 4 percentage points from Q2 2020. Properties sold at or below £150,000 accounted for 46% of transactions compared to 54% in the previous survey showing a noticeable eight percentage point decrease. In the mid-to-higher price brackets, 71% of transactions were at or below £200,000, representing a six percentage point decrease from the previous quarter. In the upper pricing levels of the market, 83% of properties sold at or below £250,000 compared with 87% in Q2, while 90% of sales were below the £300,000 price band, a decrease of two percentage points by comparison with the previous quarter. Overall, the analysis by price band shows an increase in the proportion of transactions accounted for by properties selling within the mid value ranges and decreases in transaction volumes in the lower end of the pricing structure across Northern Ireland, symptomatic of trading up occurring within the market.
The sample representation by property type this quarter is indicative of the wider housing market stock profile3 and in line with previous quarters, with small changes notable. Semi-detached houses continued to be the most common house type in the sample, representing 37% of all transactions (n=846). There was a slight reduction in the percentage share of terraced/townhouses by one percentage point, from 22% in quarter two to 21% this quarter (n=483). Detached houses comprised 32% of all sales (n=738). Apartments displayed the largest increase of market share by comparison with the previous quarter, up two percentage points to 9% (n=206), but continuing to account for the smallest share of the market. The proportion of new build properties within the sample was up on the previous quarter and more in line with sample levels from the previous six quarters, comprising 28% of sales (n=631).
Terrace/townhouse 21.25%
Semi-detached house 37.22%
Detached house 32.47%
Apartment 9.06%
Marketshare by type of property
3 Statistics gathered from the latest register of recorded households reflecting the market compilation of property types across Northern Ireland.
8
Northern Ireland Quarterly House Price Index
8
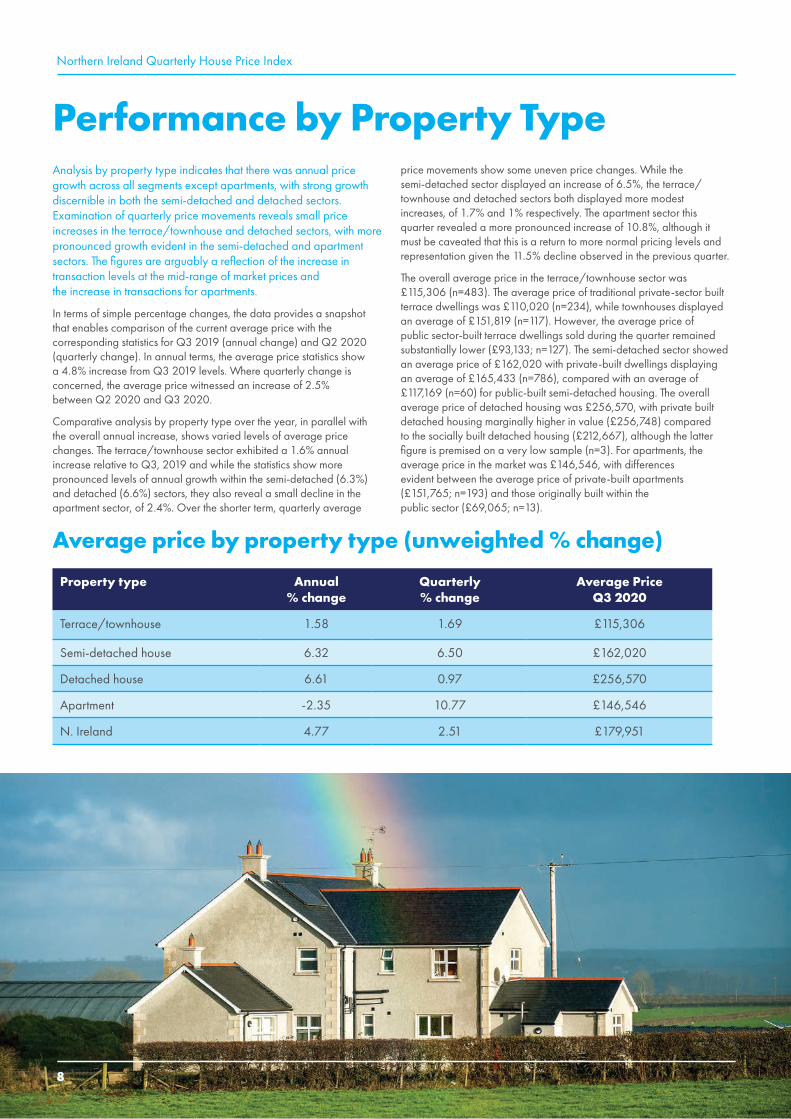
Performance by Property TypeAnalysis by property type indicates that there was annual price growth across all segments except apartments, with strong growth discernible in both the semi-detached and detached sectors. Examination of quarterly price movements reveals small price increases in the terrace/townhouse and detached sectors, with more pronounced growth evident in the semi-detached and apartment sectors. The figures are arguably a reflection of the increase in transaction levels at the mid-range of market prices and the increase in transactions for apartments.
In terms of simple percentage changes, the data provides a snapshot that enables comparison of the current average price with the corresponding statistics for Q3 2019 (annual change) and Q2 2020 (quarterly change). In annual terms, the average price statistics show a 4.8% increase from Q3 2019 levels. Where quarterly change is concerned, the average price witnessed an increase of 2.5% between Q2 2020 and Q3 2020.
Comparative analysis by property type over the year, in parallel with the overall annual increase, shows varied levels of average price changes. The terrace/townhouse sector exhibited a 1.6% annual increase relative to Q3, 2019 and while the statistics show more pronounced levels of annual growth within the semi-detached (6.3%) and detached (6.6%) sectors, they also reveal a small decline in the apartment sector, of 2.4%. Over the shorter term, quarterly average
price movements show some uneven price changes. While the semi-detached sector displayed an increase of 6.5%, the terrace/townhouse and detached sectors both displayed more modest increases, of 1.7% and 1% respectively. The apartment sector this quarter revealed a more pronounced increase of 10.8%, although it must be caveated that this is a return to more normal pricing levels and representation given the 11.5% decline observed in the previous quarter.
The overall average price in the terrace/townhouse sector was £115,306 (n=483). The average price of traditional private-sector built terrace dwellings was £110,020 (n=234), while townhouses displayed an average of £151,819 (n=117). However, the average price of public sector-built terrace dwellings sold during the quarter remained substantially lower (£93,133; n=127). The semi-detached sector showed an average price of £162,020 with private-built dwellings displaying an average of £165,433 (n=786), compared with an average of £117,169 (n=60) for public-built semi-detached housing. The overall average price of detached housing was £256,570, with private built detached housing marginally higher in value (£256,748) compared to the socially built detached housing (£212,667), although the latter figure is premised on a very low sample (n=3). For apartments, the average price in the market was £146,546, with differences evident between the average price of private-built apartments (£151,765; n=193) and those originally built within the public sector (£69,065; n=13).
Average price by property type (unweighted % change)
Property type Annual % change
Quarterly % change
Average Price Q3 2020
Terrace/townhouse 1.58 1.69 £115,306
Semi-detached house 6.32 6.50 £162,020
Detached house 6.61 0.97 £256,570
Apartment -2.35 10.77 £146,546
N. Ireland 4.77 2.51 £179,951
Northern Ireland Quarterly House Price Index
9
Northern Ireland Quarterly House Price IndexNorthern Ireland Quarterly House Price Index
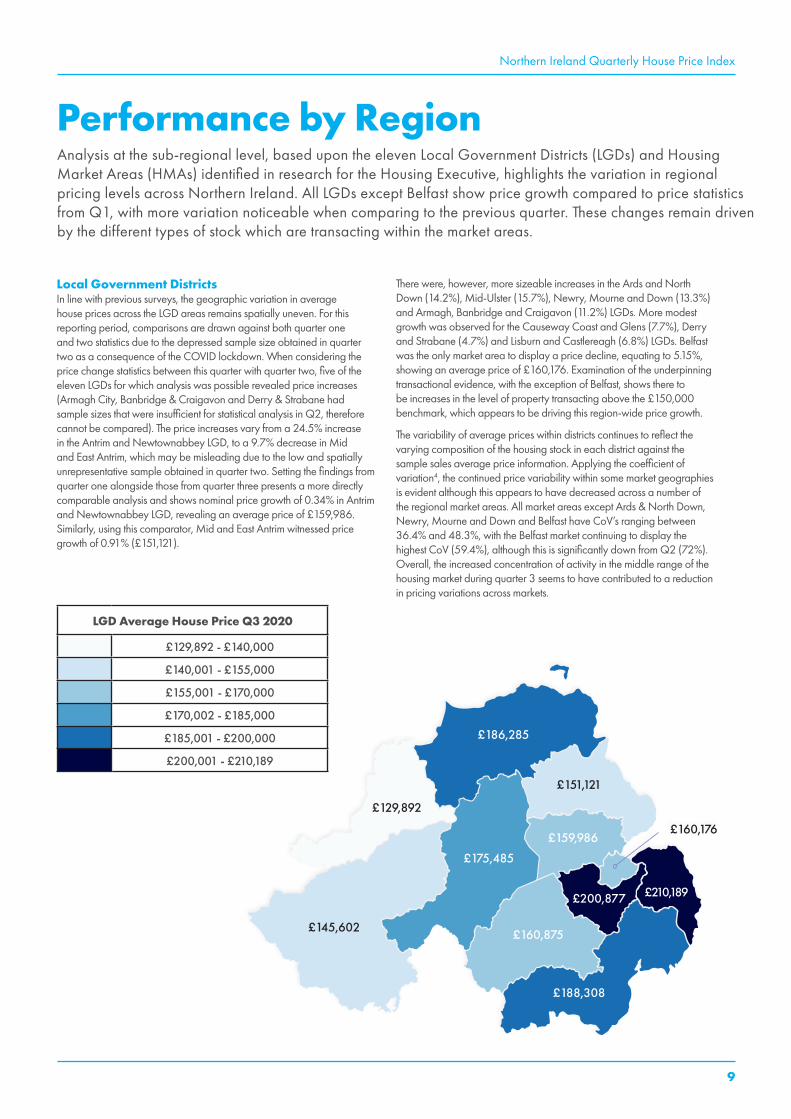
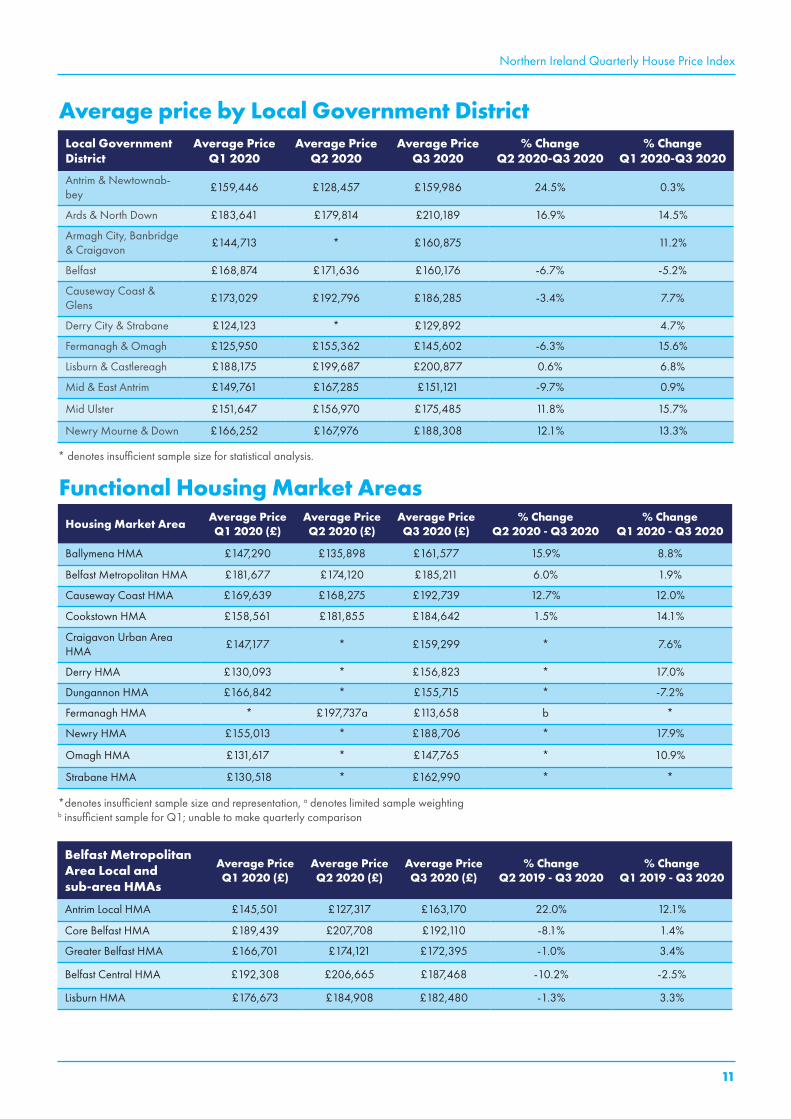
Performance by RegionAnalysis at the sub-regional level, based upon the eleven Local Government Districts (LGDs) and Housing Market Areas (HMAs) identified in research for the Housing Executive, highlights the variation in regional pricing levels across Northern Ireland. All LGDs except Belfast show price growth compared to price statistics from Q1, with more variation noticeable when comparing to the previous quarter. These changes remain driven by the different types of stock which are transacting within the market areas.
Local Government DistrictsIn line with previous surveys, the geographic variation in average house prices across the LGD areas remains spatially uneven. For this reporting period, comparisons are drawn against both quarter one and two statistics due to the depressed sample size obtained in quarter two as a consequence of the COVID lockdown. When considering the price change statistics between this quarter with quarter two, five of the eleven LGDs for which analysis was possible revealed price increases (Armagh City, Banbridge & Craigavon and Derry & Strabane had sample sizes that were insufficient for statistical analysis in Q2, therefore cannot be compared). The price increases vary from a 24.5% increase in the Antrim and Newtownabbey LGD, to a 9.7% decrease in Mid and East Antrim, which may be misleading due to the low and spatially unrepresentative sample obtained in quarter two. Setting the findings from quarter one alongside those from quarter three presents a more directly comparable analysis and shows nominal price growth of 0.34% in Antrim and Newtownabbey LGD, revealing an average price of £159,986. Similarly, using this comparator, Mid and East Antrim witnessed price growth of 0.91% (£151,121).
There were, however, more sizeable increases in the Ards and North Down (14.2%), Mid-Ulster (15.7%), Newry, Mourne and Down (13.3%) and Armagh, Banbridge and Craigavon (11.2%) LGDs. More modest growth was observed for the Causeway Coast and Glens (7.7%), Derry and Strabane (4.7%) and Lisburn and Castlereagh (6.8%) LGDs. Belfast was the only market area to display a price decline, equating to 5.15%, showing an average price of £160,176. Examination of the underpinning transactional evidence, with the exception of Belfast, shows there to be increases in the level of property transacting above the £150,000 benchmark, which appears to be driving this region-wide price growth.
The variability of average prices within districts continues to reflect the varying composition of the housing stock in each district against the sample sales average price information. Applying the coefficient of variation4, the continued price variability within some market geographies is evident although this appears to have decreased across a number of the regional market areas. All market areas except Ards & North Down, Newry, Mourne and Down and Belfast have CoV’s ranging between 36.4% and 48.3%, with the Belfast market continuing to display the highest CoV (59.4%), although this is significantly down from Q2 (72%). Overall, the increased concentration of activity in the middle range of the housing market during quarter 3 seems to have contributed to a reduction in pricing variations across markets.
£186,285
£129,892
£145,602
£175,485
£151,121
£159,986
£160,875
£188,308
£200,877 £210,189
£160,176
LGD Average House Price Q3 2020
£129,892 - £140,000
£140,001 - £155,000
£155,001 - £170,000
£170,002 - £185,000
£185,001 - £200,000
£200,001 - £210,189
Northern Ireland Quarterly House Price IndexNorthern Ireland Quarterly House Price Index
10
4 The Coefficient of Variation (CoV) is a measure of relative variability. It is the ratio of the standard deviation to the mean (average). The CoV is particularly useful when comparing results from surveys or samples that have different measures or values. In this case, for example, if the sample for District A has a CoV of 10% and the sample for District B has a CoV of 20%, we can say that District B has more variation in house prices, relative to its mean house price, than District A.
5 The research identified eleven broad housing market areas within Northern Ireland. See: www.nihe.gov.uk/getmedia/4ae016fe-6702-4080-983e-dac39738b342/Mapping-Northern-Irelands-Housing-Market-Areas.pdf.aspx?ext=.pdf
6 These are as follows: Antrim Local HMA (made up of the sub areas of East Antrim and South Antrim); Ards and Down Local HMA (made up of the sub-areas of Ards and Down); and Core Belfast Local HMA (made up of Central or Core Belfast area and Lisburn).
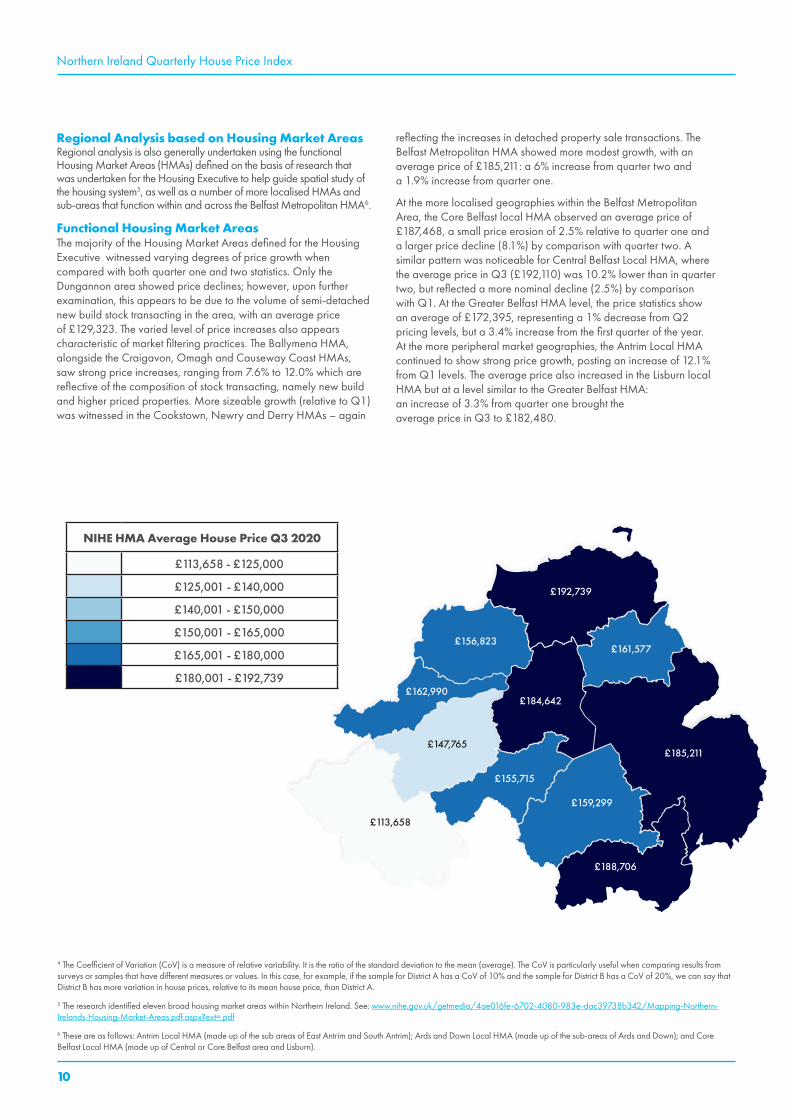
Regional Analysis based on Housing Market Areas Regional analysis is also generally undertaken using the functional Housing Market Areas (HMAs) defined on the basis of research that was undertaken for the Housing Executive to help guide spatial study of the housing system5, as well as a number of more localised HMAs and sub-areas that function within and across the Belfast Metropolitan HMA6.
Functional Housing Market AreasThe majority of the Housing Market Areas defined for the Housing Executive witnessed varying degrees of price growth when compared with both quarter one and two statistics. Only the Dungannon area showed price declines; however, upon further examination, this appears to be due to the volume of semi-detached new build stock transacting in the area, with an average price of £129,323. The varied level of price increases also appears characteristic of market filtering practices. The Ballymena HMA, alongside the Craigavon, Omagh and Causeway Coast HMAs, saw strong price increases, ranging from 7.6% to 12.0% which are reflective of the composition of stock transacting, namely new build and higher priced properties. More sizeable growth (relative to Q1) was witnessed in the Cookstown, Newry and Derry HMAs – again
reflecting the increases in detached property sale transactions. The Belfast Metropolitan HMA showed more modest growth, with an average price of £185,211: a 6% increase from quarter two and a 1.9% increase from quarter one.
At the more localised geographies within the Belfast Metropolitan Area, the Core Belfast local HMA observed an average price of £187,468, a small price erosion of 2.5% relative to quarter one and a larger price decline (8.1%) by comparison with quarter two. A similar pattern was noticeable for Central Belfast Local HMA, where the average price in Q3 (£192,110) was 10.2% lower than in quarter two, but reflected a more nominal decline (2.5%) by comparison with Q1. At the Greater Belfast HMA level, the price statistics show an average of £172,395, representing a 1% decrease from Q2 pricing levels, but a 3.4% increase from the first quarter of the year. At the more peripheral market geographies, the Antrim Local HMA continued to show strong price growth, posting an increase of 12.1% from Q1 levels. The average price also increased in the Lisburn local HMA but at a level similar to the Greater Belfast HMA: an increase of 3.3% from quarter one brought the average price in Q3 to £182,480.
NIHE HMA Average House Price Q3 2020
£113,658 - £125,000
£125,001 - £140,000
£140,001 - £150,000
£150,001 - £165,000
£165,001 - £180,000
£180,001 - £192,739
£192,739
£156,823£161,577
£184,642
£185,211
£159,299
£155,715
£147,765
£113,658
£188,706
£162,990
11
Northern Ireland Quarterly House Price IndexNorthern Ireland Quarterly House Price Index
Functional Housing Market AreasHousing Market Area Average Price
Q1 2020 (£)Average PriceQ2 2020 (£)
Average PriceQ3 2020 (£)
% ChangeQ2 2020 - Q3 2020
% ChangeQ1 2020 - Q3 2020
Ballymena HMA £147,290 £135,898 £161,577 15.9% 8.8%
Belfast Metropolitan HMA £181,677 £174,120 £185,211 6.0% 1.9%
Causeway Coast HMA £169,639 £168,275 £192,739 12.7% 12.0%
Cookstown HMA £158,561 £181,855 £184,642 1.5% 14.1%
Craigavon Urban Area HMA
£147,177 * £159,299 * 7.6%
Derry HMA £130,093 * £156,823 * 17.0%
Dungannon HMA £166,842 * £155,715 * -7.2%
Fermanagh HMA * £197,737a £113,658 b *
Newry HMA £155,013 * £188,706 * 17.9%
Omagh HMA £131,617 * £147,765 * 10.9%
Strabane HMA £130,518 * £162,990 * *
Belfast Metropolitan Area Local and sub-area HMAs
Average Price Q1 2020 (£)
Average Price Q2 2020 (£)
Average Price Q3 2020 (£)
% Change Q2 2019 - Q3 2020
% Change Q1 2019 - Q3 2020
Antrim Local HMA £145,501 £127,317 £163,170 22.0% 12.1%
Core Belfast HMA £189,439 £207,708 £192,110 -8.1% 1.4%
Greater Belfast HMA £166,701 £174,121 £172,395 -1.0% 3.4%
Belfast Central HMA £192,308 £206,665 £187,468 -10.2% -2.5%
Lisburn HMA £176,673 £184,908 £182,480 -1.3% 3.3%
Average price by Local Government DistrictLocal Government District
Average Price Q1 2020
Average Price Q2 2020
Average Price Q3 2020
% Change Q2 2020-Q3 2020
% Change Q1 2020-Q3 2020
Antrim & Newtownab-bey
£159,446 £128,457 £159,986 24.5% 0.3%
Ards & North Down £183,641 £179,814 £210,189 16.9% 14.5%
Armagh City, Banbridge & Craigavon
£144,713 * £160,875 11.2%
Belfast £168,874 £171,636 £160,176 -6.7% -5.2%
Causeway Coast & Glens
£173,029 £192,796 £186,285 -3.4% 7.7%
Derry City & Strabane £124,123 * £129,892 4.7%
Fermanagh & Omagh £125,950 £155,362 £145,602 -6.3% 15.6%
Lisburn & Castlereagh £188,175 £199,687 £200,877 0.6% 6.8%
Mid & East Antrim £149,761 £167,285 £151,121 -9.7% 0.9%
Mid Ulster £151,647 £156,970 £175,485 11.8% 15.7%
Newry Mourne & Down £166,252 £167,976 £188,308 12.1% 13.3%
* denotes insufficient sample size for statistical analysis.
*denotes insufficient sample size and representation, a denotes limited sample weighting b insufficient sample for Q1; unable to make quarterly comparison
Northern Ireland Quarterly House Price IndexNorthern Ireland Quarterly House Price Index
12
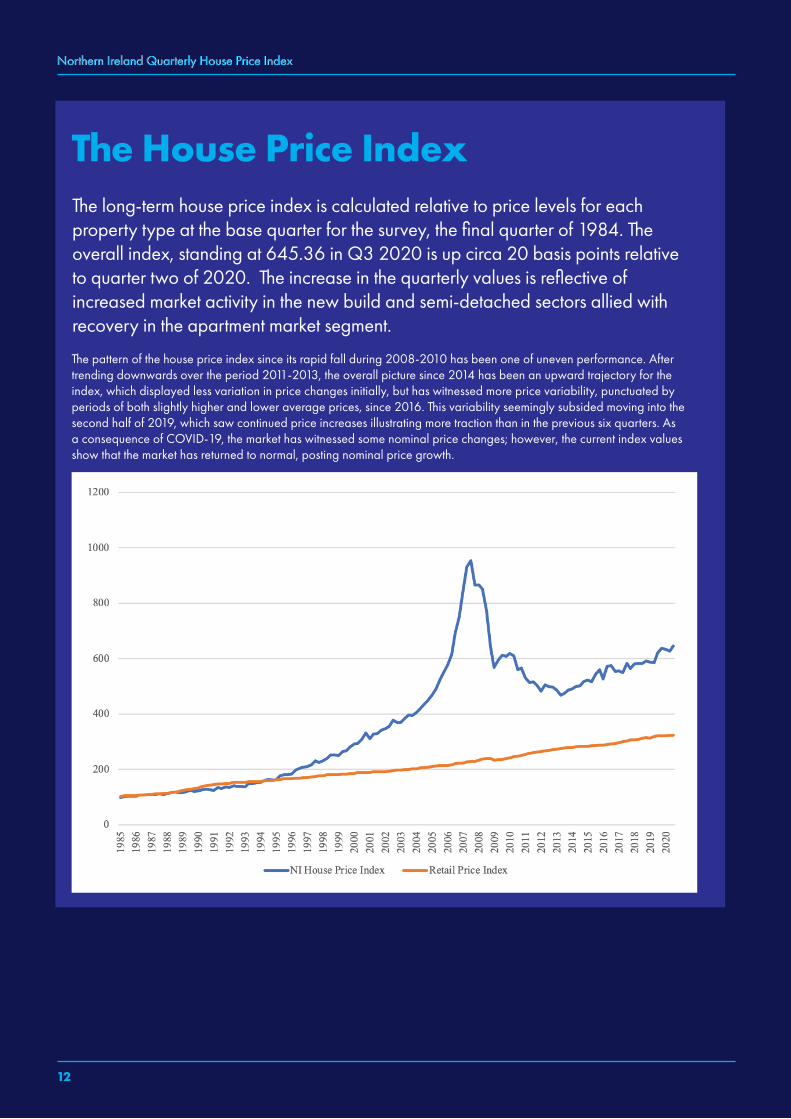
The House Price IndexThe long-term house price index is calculated relative to price levels for each property type at the base quarter for the survey, the final quarter of 1984. The overall index, standing at 645.36 in Q3 2020 is up circa 20 basis points relative to quarter two of 2020. The increase in the quarterly values is reflective of increased market activity in the new build and semi-detached sectors allied with recovery in the apartment market segment.
The pattern of the house price index since its rapid fall during 2008-2010 has been one of uneven performance. After trending downwards over the period 2011-2013, the overall picture since 2014 has been an upward trajectory for the index, which displayed less variation in price changes initially, but has witnessed more price variability, punctuated by periods of both slightly higher and lower average prices, since 2016. This variability seemingly subsided moving into the second half of 2019, which saw continued price increases illustrating more traction than in the previous six quarters. As a consequence of COVID-19, the market has witnessed some nominal price changes; however, the current index values show that the market has returned to normal, posting nominal price growth.
NI House Price Index
Retail Price Index
Northern Ireland Quarterly House Price Index
ContributorsAlexander, Reid & FrazerAMPM PropertiesArmoy Homes Property ServicesArmstrong GordonBest Property ServicesBill McCann Estate AgencyBill McKelvey Estate AgentsBlair & BoydBrian A. Todd & Co.Brian O’Hare Estate AgentsBrian Wilson Estate AgentsBrice & Co. Estate AgentsBurns & Co.Cookstown Property ServicesCorry & Stewart LtdCountry EstatesCowley PropertyCPS PropertyCurran AssociatesDallas Real EstateD A McLernon Estate AgentsDaniel McGeown Estate AgentsDonnybrook Estate AgentsDougan PropertyEadie McFarland & Co.Eddie O’Connor Estate AgentsEoin Lawless Estate AgentFalloon Estate AgentsFrank A McCaughan & SonFred Dalzell & PartnersGerry O’Connor Estate AgentHA McIlwrath & Sons LtdHampton EstatesHanna Hillen EstatesHarry Clarke & Co.Harte & McGarrigle LtdHomes IndependentHR Douglas & SonsHunter CampbellJ. A. McClelland & SonsJames Wilson & SonJG FlemingJohn Grant LimitedJohn McQuoid & SonsJohn Minnis Estate Agents & Property ConsultantsJohn V Arthur Estate AgentsJones Estate AgentsJoyce Clarke Estate AgentsKieran Taggart Estate AgencyLindsay Fyfe & Co.Lindsay Shanks Kerr Group Estate AgentsMannelly & Co. Ltd
Mark McAlpine & Co.Martin & DunlopMcAfee Properties & MortgagesMcCleary’sMcClelland SalterMcDonagh Property Consultants & Chartered SurveyorsMacFarlane & SmythMcGlone McCabeMcMillan Estate AgentsMichael Chandler Estate AgentsMichael Hannath Property Consultancy & Estates AgentsMid Ulster PropertiesMontgomery Finlay & Co.Morris Estate AgentsMortgage/Property Sales & Rentals LtdNeill Estate AgentsNorman Devlin Property Consultants & SurveyorsNorman Morrow & Co.Oakland Estate AgentsO’Reilly Property ServicesPaul O’Keefe Estate AgentsPeter Rogers Estate AgentsPhilip Tweedie And CompanyPinkertonsPinpoint PropertyPJ Bradley Property ServicesPJ McIlroy & SonPollock Estate AgentsPremier PropertiesQuinn & CompanyRA Noble & Co. Auctioneers & Estate AgentsRainey & Gregg Property & Mortgage CentreR Benson & SonReeds RainsRobert Ferris Estate AgentsRobert Wilson Estate Agency GroupRobert Quigley Estate AgentsRodgers & BrowneSawyer & Co.Shanks & Company Estate AgentsSimon Brien ResidentialSmyth Leslie & CoStanley Best Estate AgentsStephen CarsonStevenson & CummingTaylor & Co.Templeton RobinsonTim Martin & Co.Ulster Property SalesVision Property AgentsWylie Estate Agents
Northern Ireland Quarterly House Price Index
13
Real Estate PgDip/MSc
RICS Accreditation • Asset Management • Investment • Property AcquisitionsFinancial Analysis • Economics • Strategic Decision Making • SustainabilityValuation • International Real Estate
For further information please contact: Dr Jasmine LC Lim Programme DirectorE: [email protected] T: +44 (0)28 9036 8562ulster.ac.uk/courses

Real Estate PgDip/MSc