overcoming barriers to electric vehicle charging in...
TRANSCRIPT

Overcoming Barriers to Electric Vehicle Charging in Multi-unit Dwellings: A Westside Cities Case Study
DISCLAIMER
This work was prepared for the Southern California Association of Governments (SCAG) as part of Agreement M-004-16 and sponsored by the California Energy Commission (CEC). The contents of this report reflect the views of the author, who is responsible for the facts and accuracy of the data presented herein. The contents do not necessarily reflect the official views or policies of SCAG, CEC or its employees, or the State of California. This report does not constitute a standard, specification or regulation. The CEC, the State of California, their employees, contractors, and subcontractors make no warranty, express or implied, and assume no legal liability for the information in this document; nor does any party represent that the use of this information will not infringe upon privately owned rights.
Prepared by: Principal Investigator: J.R. DeShazo, Ph.D. Spatial Analysis and Cartography: Norman Wong Project Manager: Jason Karpman UCLA Luskin Center for Innovation 3323 Public Affairs Building Los Angeles, CA 90095 310-267-5435 Prepared for: The Southern California Association of Governments Agreement Number: M-004-16 November 2017

i
ACKNOWLEDGEMENTS
We thank the Southern California Association of Governments and the California Energy Commission for support of this project. In particular, we thank Marco Anderson of the Southern California Association of Governments for his guidance and assistance.
We would also like to express appreciation to: Alex Turek, Multifamily Development Manager at Grid Alternatives and former UCLA
Luskin Center project manager, for sharing lessons learned during the development of a parallel study, Overcoming Barriers to Electric Vehicle Charging in Multi-unit Dwellings: A South Bay Case Study.
Britta McOmber and Julie Wedig, graduate students at the UCLA Luskin School of Public Affairs, for lending their talents as writers and editors.
Ariana Javidi, an undergraduate intern from Amherst College, for her assistance with data analysis and presentation of findings.

ii
ABSTRACT
The transportation sector is a major source of greenhouse gas emissions in California. To address this issue, Governor Edmund G. Brown Jr. signed an executive order calling for 1.5 million zero-emission vehicles (ZEV) on California’s roads by 2025. To achieve this ambitious goal, significant barriers must be overcome to expand and accelerate plug-in electric vehicle (PEV) adoption, including the need to build the necessary refueling infrastructure. Currently, residents of multi-unit dwellings (MUDs) such as apartments and condominiums are unlikely to have access to home charging (electric vehicle supply equipment or EVSE).
The purpose of this report is to explore barriers to PEV adoption for residents of MUDs within the Westside Cities subregion of Los Angeles County and then identify MUDs within the study region that may exhibit high latent PEV demand and subsequent demand for low-cost EVSE installation. These MUDs should be a priority for targeted outreach for programs that assist with EVSE installation, since they are most likely to host PEV drivers in the near future. We find that the MUDs with greatest demand for PEVs and charging infrastructure within the study region are located in West Los Angeles, followed in descending order by Beverly Hills, Santa Monica, West Hollywood, Culver City, and unincorporated portions of Los Angeles County.
This report also reviews the costs associated with EVSE installation at MUD sites, which are highly variable across properties. To keep charging installation costs as low as possible, property owners should consider Level 1 charging opportunities and group investments for EVSE installations. The report closes with a discussion of policy tools for scaling up charging infrastructure at MUD sites across the Westside cities subregion, concluding that targeted outreach to promote the PEV, PEV rebates, and PEV-ready new construction codes are likely required to ease the MUD-related barriers to PEV adoption.
Keywords: Plug-in electric vehicle, PEV, multi-unit dwelling, MUD, PEV charging, EVSE, Westside Cities, California Energy Commission, demand, installation costs
iii
TABLE OF CONTENTS
ACKNOWLEDGEMENTS ............................................................................................................. i
ABSTRACT .................................................................................................................................. ii
CHAPTER 1: Introduction .......................................................................................................... 1
1.1. Purpose of the Report ........................................................................................................ 1
1.2 Intended Audience .............................................................................................................. 3
1.3 Methodology ........................................................................................................................ 4
CHAPTER 2: MUDs of the Westside Cities Subregion ............................................................ 5
2.1 Density ................................................................................................................................ 6
2.2 Building Size ........................................................................................................................ 8
2.3 Unit Values ........................................................................................................................ 10
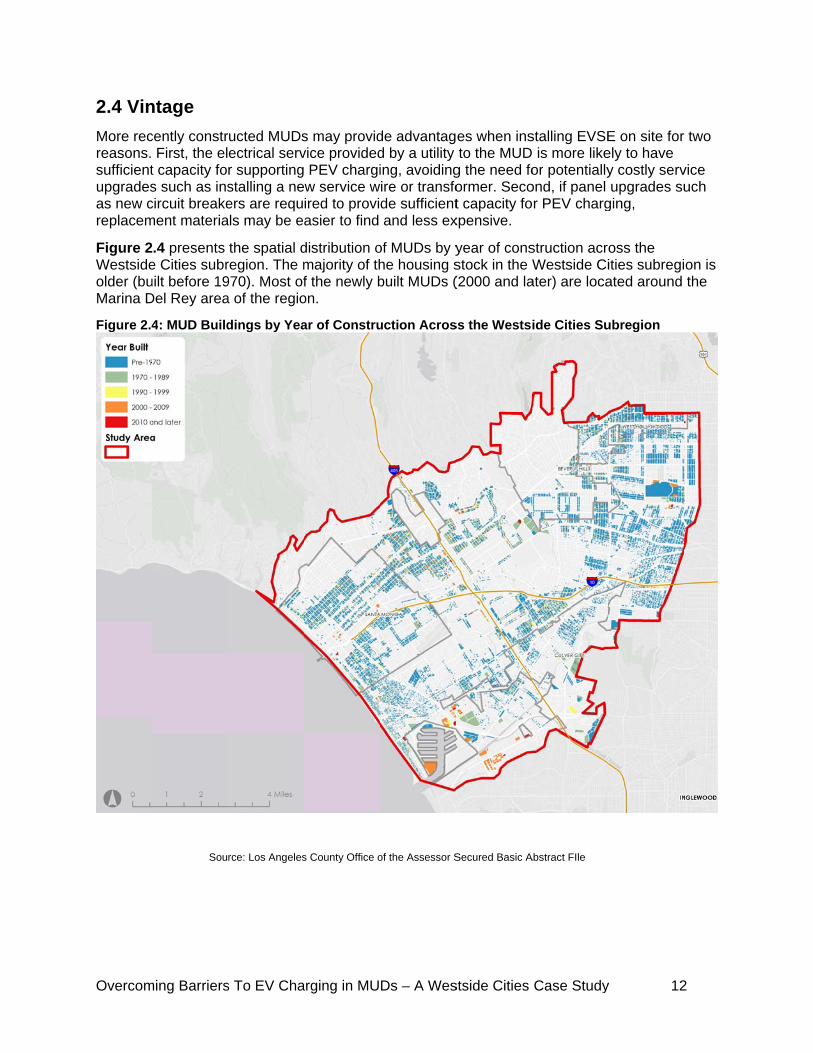
2.4 Vintage .............................................................................................................................. 12
2.5 Ownership Types .............................................................................................................. 14
2.6 MUD Presence in Disadvantaged Communities ............................................................... 17
CHAPTER 3: PEV Demand in the Westside Cities ................................................................. 20
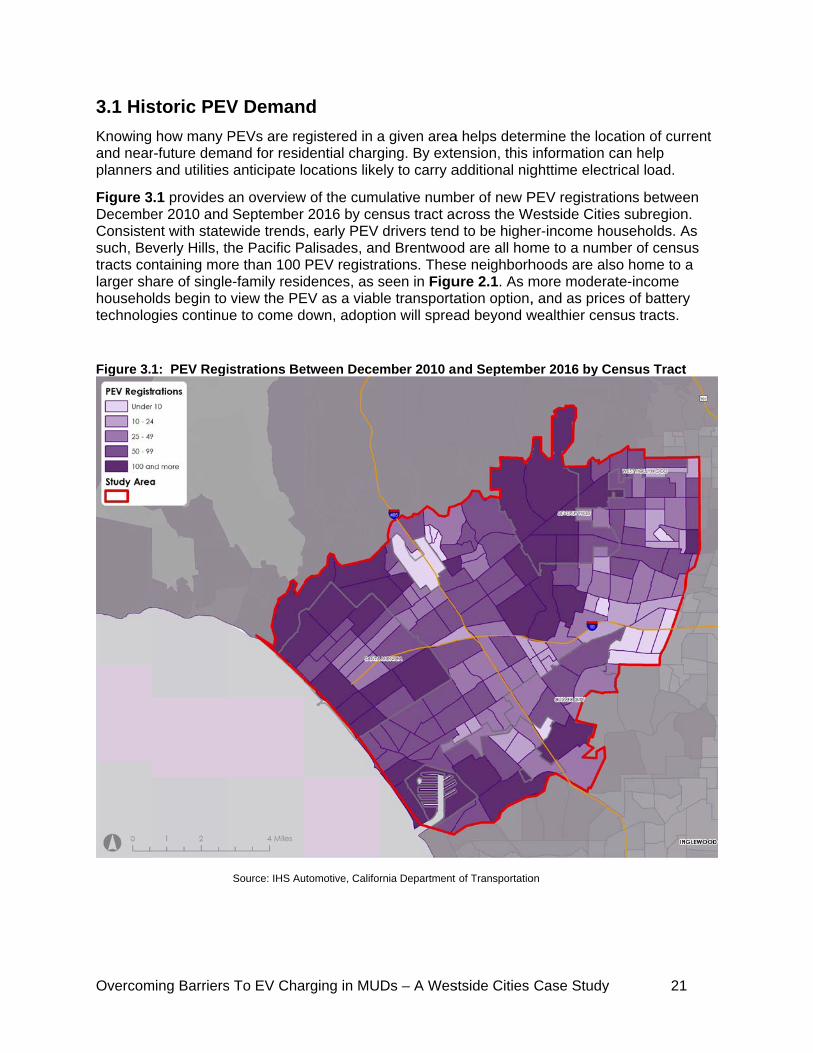
3.1 Historic PEV Demand ........................................................................................................ 21
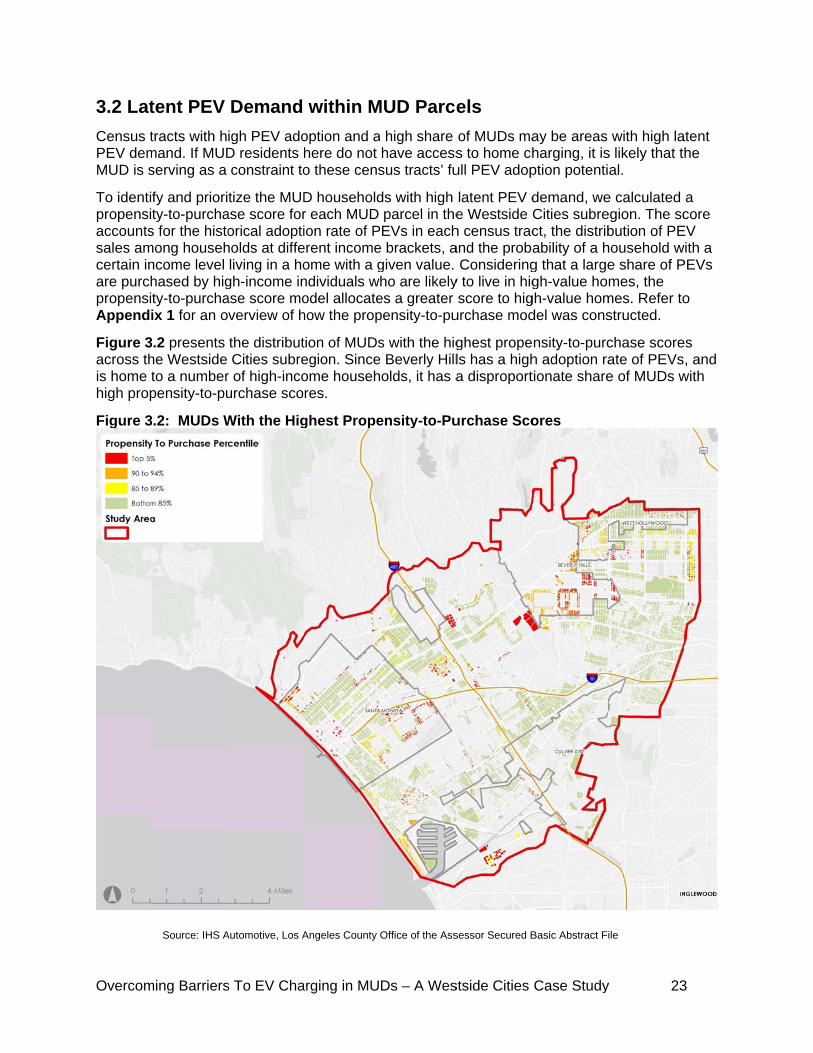
3.2 Latent PEV Demand within MUD Parcels ......................................................................... 23
3.2.1 Latent PEV Demand for Large MUDs ......................................................................... 25
CHAPTER 4: The Cost of Installing Charging Infrastructure in MUDs ................................ 27
4.1. Electric Vehicle Supply Equipment ................................................................................... 31
4.2 Running Wires and Conduit to Charge Point .................................................................... 32
4.3 Upgrading Electrical Panel and Utility Service .................................................................. 33
4.4 Cost-Saving Opportunities to Reduce Charging Fees ...................................................... 36
4.5 Charging Potential in the Westside Cities by Parking Layout ........................................... 38
CHAPTER 5: Policy Tools to Overcome Barriers to PEV Adoption in MUDs ...................... 42
5.1 Design Incentives to Reduce the Cost of EVSE Installation ............................................. 43
5.2 Implement PEV-Ready New Construction Codes ............................................................. 43
5.3 Expand Public Charging Opportunities for MUD Residents .............................................. 44
5.4 Conduct Outreach to Encourage PEV / EVSE Investments at MUDs ............................... 44
APPENDIX .................................................................................................................................. 47
Appendix 1. Propensity to Purchase Model Methodology ....................................................... 47
Overcoming Barriers To EV Charging in MUDs – A Westside Cities Case Study 1
CHAPTER 1: Introduction
The transportation sector represents the largest source of California’s greenhouse gas (GHG) emissions, comprising 39% of all GHG emissions in 2015.1 To reduce emissions from the transportation sector, the state is making a concerted effort to promote the adoption of advanced clean vehicles. The transition to more fuel-efficient and zero-emission vehicles (ZEVs) is critical to achieving the state’s ambitious climate goals and air quality requirements. In 2012, Governor Edmund G. Brown Jr. signed an executive order setting a target of 1.5 million ZEVs on California’s roads by 2025.2
To achieve the goals laid out by the Governor’s executive order, a number of adoption barriers must be overcome. A key challenge addressed in the Governor’s 2016 ZEV Action Plan is the need to build the necessary refueling infrastructure in apartment buildings and condominiums, also known as multi-family housing, or as the California Energy Commission (CEC) refers to them, multi-unit dwellings (MUDs).3 ZEVs, and specifically plug-in electric vehicles (PEVs), require an entirely new set of refueling behavior and equipment. In place of a 15-minute detour to a gas station, most PEV owners refuel overnight when they are at home. While this is generally a straightforward proposition for single-family homeowners, MUD residents face a number of obstacles to installing electric vehicle service equipment (EVSE). Foremost is the variable and often high cost of EVSE installation at a MUD site. Additionally, the renter or owner exhibits a low to nonexistent investment motivation: renters are unlikely to invest in a piece of immobile equipment that they may move away from in the future, and owners do not yet see home PEV charging as an amenity by which to increase property value and attract tenants. Overcoming these financial and motivational challenges is critical to charting the path toward a low-carbon future.
1.1. Purpose of the Report
The goal of this report is to explore MUD-related barriers to greater PEV adoption within the Westside Cities subregion, as well as to prioritize policy tools and targeted outreach for MUD sites that exhibit relatively high latent PEV demand and a low cost of EVSE installation. This report represents the final report for Task 2 of Agreement Number Agreement M-004-16 with the South California Association of Governments (SCAG).
The formal boundary of the Westside Cities subregion encompasses the cities of Beverly Hills, Culver City, Santa Monica, West Hollywood, and parts of unincorporated Los Angeles County. For the purposes of this study, the western portions of the City of Los Angeles are also included in the boundary of analysis, and are referred to as West Los Angeles. All aggregated numbers that are reported for the Westside Cities subregion throughout this study reflect results from the jurisdictions within the formal boundary of the Westside Cities subregion, and results from West Los Angeles. See Figure 1.1 for an overlay of the formal Westside Cities boundary and the boundary of analysis adopted for this study.
1 California Air Resources Board. 2017. “California Greenhouse Gas Emission Inventory - 2017 Edition“ Accessed August 2017 from https://www.arb.ca.gov/cc/inventory/data/data.htm 2 California Office of the Governor. 2012. “Governor Brown Announces $120 Million Settlement to Fund Electric Car Charging Stations Across California” Accessed August 2017 from https://www.gov.ca.gov/news.php?id=17463 3 Governor’s Interagency Working Group on Zero-Emission Vehicles. 2016. ZEV Action Plan. Accessed August 2017 from https://www.gov.ca.gov/docs/2016_ZEV_Action_Plan.pdf

Overcom
Figure 1
The Wesbetween the subrenumber ohousing provides implemefollows: Chapter ResearchAbstract value, vin16,495 Mtargets fo
4 IHS Auto
5 Los Ang
ming Barriers
.1: Study A
stside Cities December 2
egion is consof MUDs. Thunits, compra quality stu
nt policies o
2 provides ahers analyzeto identify M
ntage, and oMUD units loor investmen
omotive New
geles County O
s To EV Cha
Area Versus
subregion is2010 and Sestrained by ihere are 30,5rising 30.1%udy area to er programs a
an overviewed the Los A
MUD charactownership tycated within
nts from Gre
Vehicle Regi
Office of the A
arging in MU
Formal We
s a leader ineptember 20its mix of res590 MUDs a
% of the residevaluate MUaimed at ove
w of the MUDAngeles Couteristics that
ype. This chan disadvantaeenhouse Ga
istration Data
Assessor Sec
Ds – A Wes
estside Citie
the adoptio016.4 Yet it issidential landacross the stdential land uUD-related bercoming thi
D portfolio in nty Office ofmay influen
apter concluged commuas Reduction
.
cured Basic F
stside Cities
es Subregio
on of PEVs ws likely that td uses, spectudy area, wuse mix.5 As
barriers to PEis barrier. Th
the Westsidf the Assess
nce PEV demdes with a renities. Thesn Fund reve
File Abstract. A
Case Study
on Boundar
with 10,419 tthe full adopcifically the s
which are homs such, the sEV adoptionhe report is o
de Cities subsor’s Securemand such aeview of thee may be apnues.
Accessed Oc
y 2
ry
total registraption potentiasignificant me to 253,8
subregion , as well as organized as
bregion. ed Basic Fileas size, per ue subregion’sppropriate
ctober, 2015.
ations al of
76
to s
e unit s
Overcoming Barriers To EV Charging in MUDs – A Westside Cities Case Study 3
Chapter 3 identifies MUDs in the Westside Cities subregion that may exhibit high latent PEV demand. Our PEV demand analysis provides parcel level information: We calculated a propensity-to-purchase score using the historical adoption rate of PEVs in each census tract, as well as the PEV adoption rate of individuals living in households of a certain value. Those MUD parcels that result in a higher propensity-to-purchase score should be targets for outreach efforts or other policy interventions.
Chapter 4 presents the costs associated with Level 1 and Level 2 EVSE installation at MUD sites. Using empirical evidence from visiting MUD sites and obtaining installation cost estimates from a qualified electrician, this chapter investigates how installation costs vary based on the electrical, structural, and parking configuration of the MUD building, and highlights potential low-cost installation solutions.
Chapter 5 offers policy tools that help alleviate the MUD-related barriers to PEV adoption. Potential policy solutions include designing rebates to reduce the cost of EVSE installation, implementing PEV-ready new construction codes, siting public charge programs to benefit MUD residents, and prioritizing outreach and education to increase PEV adoption.
1.2 Intended Audience
This report is intended for a wide audience of decision makers and advocates seeking to advance PEV adoption in MUDs, with emphasis on those in the Westside Cities subregion. Those who may find the report most useful include regional, subregional, and municipal planners; state agencies; utility representatives; MUD property owners; members of homeowner associations; as well as current and potential PEV drivers.
Regional, subregional, and municipal planners should use this report to facilitate PEV adoption where latent demand is greatest and installation solutions are needed. By outlining the subregion’s MUD portfolio, this report empowers planners to strategically conduct targeted outreach and prioritize MUD sites for policy interventions.
State agencies should use this report to understand the MUD-related barriers to PEV adoption and consider policy tools, such as rebates, that reduce the cost of installing EVSE at MUD sites.
Utility representatives should use this report to identify and plan for where PEV demand and related electrical load may grow most rapidly in the subregion. Southern California Edison (SCE), the predominant electric utility in the Westside Cities subregion, recently received approval for Phase 1 of its Charge Ready program to install charging infrastructure at long dwell-time sites, including MUDs, where PEV drivers will be parked for at least four hours. SCE should use this report to help identify census tracts and specific parcels to prioritize outreach for this and other PEV programs.
Property managers and members of homeowner associations (HOAs) should use this report to understand the elements of their building’s electrical systems and to better predict the cost of installing PEV home charging options.
PEV and prospective PEV drivers should use this report to better understand the challenges and costs of installing PEV charging infrastructure at home.

Overcoming Barriers To EV Charging in MUDs – A Westside Cities Case Study 4
1.3 Methodology
The guiding objective of UCLA Luskin Center researchers was to prioritize outreach by 1) understanding the MUD portfolio of the Westside Cities subregion, 2) identifying high latent demand for residents of MUDs in the Westside Cities subregion, and 3) identifying MUD types with a low cost of EVSE installation. The MUD parcels that exhibited high latent demand and low-cost installation opportunities represent the low-hanging fruit for outreach or other policy interventions. The following presents the methodology conducted to achieve the goals of the research.
1) Understanding the multi-unit dwelling portfolio of the Westside Cities subregion
Researchers analyzed Los Angeles County Office of Assessor Secured Basic File Abstract data across a number of parcel specific variables. Most importantly, the data provided researchers with the assessor identification number, number of units, land and improvement value (“total value”), year built (“vintage”), and ownership type (i.e., rental or condominium). Researchers assessed the spatial distribution of MUDs in the Westside Cities subregion using geographic information systems (GIS).
2) Estimating plug-in electric vehicle demand for multi-unit dwelling residents
To identify high latent PEV demand at the parcel level in the Westside Cities subregion, researchers constructed a propensity-to-purchase model. The model works by assigning a score to an MUD unit based on the likelihood that the unit will be occupied by a PEV driver, if there are no barriers to charging. The score is based on three key variables: the forecasted number of PEV purchases per census tract, the PEV adoption rate among different income groups, and the percentage of income groups living in homes of certain values. From these three variables, the model builds a relationship between the value of an MUD unit and the occupants’ propensity-to-purchase a PEV. That relationship can then be spatialized at the parcel level based on the MUD’s per unit value. See Appendix 1 for more for information on how the propensity-to-purchase model was constructed, including a summary of the data sources that underpin the model.
3) Identifying multi-unit dwelling types with low-cost EVSE installation
This chapter reviews findings from the report Overcoming Barriers to Electric Vehicle Charging in Multi-unit Dwellings: A South Bay Case Study, in which cost estimates were developed for the installation of charging infrastructure at sample sites within the South Bay Cities Subregion.6 With the South Bay Cities Council of Governments, researchers released a Request for Information for qualified electricians in Los Angeles County with experience installing EVSE in MUDs. Researchers requested 30 MUD site visits to assess Level 1 and Level 2 charge readiness and to estimate the cost of installing a single Level 2 EVSE unit. From those site visits, 15 complete cost estimates were obtained, the results of which are discussed in this chapter.
6 UCLA Luskin Center for Innovation. 2016. Overcoming Barriers to Electric Vehicle Charging in Multi-unit Dwellings: A South Bay Case Study.

Overcom
CHAP
The Wessubregioadoption potential infrastrucchoice fo
This chacharactesuch as blocationaplanners compositPEV ado
7 Reflectsboundary
Apartment
ming Barriers
PTER 2
stside Cities n’s residentifor Southerof the area’
cture (electrior early adop
pter provideristics that cbuilding size
al attributes sand other in
tion of the suoption.
modified stuand the boun
t buildings in do
s To EV Cha
2: MUDs
is home to aial land use.rn California,s PEV uptakic vehicle supters of PEV
s an overviecan influencee (i.e., numbsuch as MUDnterested paubregion at l
dy area for thndary of analy
owntown Santa
arging in MU
s of the
approximate7 Although t, this land uske. The MUDupply equipmVs — includin
ew of the Wee the cost of er of units), Ds located i
arties can revlarge and wh
his report. Seeysis adopted
a Monica (Phot
Ds – A Wes
e Wests
ely 250,000 Mhe Westsidese mix may vDs present ament or EVSng the variab
estside CitiesEVSE instaper unit valun disadvantaview this chahere the MU
e Figure 1.1 ffor this study
to Credit: iStoc
stside Cities
side Cit
MUD househe Cities subrvery well bea series of h
SE) at home ble and often
s’ MUD portallation and tue, vintage, aged commuapter to und
UD might be
for an overlay.
ck by Getty Ima
Case Study
ties Sub
holds, makinregion is driv constrainingurdles to ins— the prefen high costs
tfolio, includithe investmeownership tyunities. Suberstand the significantly
y of the forma
ages).
y 5
bregion
ng up 30% oving PEV g the full stalling chargerred refuelin of installatio
ing MUD ent motivatioype, and regional andMUD
y constrainin
al Westside C
n
of the
ging ng on.
on
d city
g
Cities

Overcom
2.1 De
The densMUD shaAngeles,which monot have Similarlydedicatedwith 50%
Figure 2
ming Barriers
nsity
sity of MUDsare of reside and portionore than 75%a single cen
, most of Bed to MUDs,
% to 75% of t
2.1: MUD S
Sou
s To EV Cha
s ranges greential land usns of unincor% of the resinsus tract in
everly Hills iswith the excthe residenti
Share of Res
rce: Los Angeles
arging in MU
eatly across se per censurporated Losdential land which more
s occupied bception of onal land dedic
sidential La
s County Office o
Ds – A Wes
the Westsidus tract. Sans Angeles Co
is occupiede than 50% oy census tra
ne census tracated to MU
and Use by C
of the Assessor S
stside Cities
e Cities reginta Monica, Wounty are ea by MUDs. Iof the land aacts with lessact in the so
UDs.
Census Tra
Secured Basic A
Case Study
ion. Figure 2West Hollywach home ton contrast, C
area is occups than 50%
outhern boun
act Across W
Abstract File
y 6
2.1 shows thwood, West L census tracCulver City dpied by MUDof the land
ndary of the
Westside C
he Los cts in does Ds.
city
ities

Overcoming Barriers To EV Charging in MUDs – A Westside Cities Case Study 7
Table 2.1 summarizes the number of MUDs and the number of MUD units in each city within the study area. The table also summarizes the percentage of residential land occupied by MUDs for each city. West Hollywood has the greatest density of MUDs on residential land, followed in descending order by unincorporated portions of Los Angeles County (explained by MUDs in Marina Del Rey), Santa Monica, Culver City, and Beverly Hills. In contrast, West Los Angeles has the greatest number of MUDs and MUD units, followed in descending order by Santa Monica, West Hollywood, Culver City, Beverly Hills, and unincorporated portions of Los Angeles County.
Table 2.1: MUD Unit Count and Share of Residential Land Use for Westside Cities
City Number of
MUDs Number of MUD Units
MUD % of Residential Land Use
Beverly Hills 1,273 10,451 10.2%
Culver City 1,763 10,774 32.0%
Santa Monica 5,016 41,165 37.9%
West Hollywood 2,264 23,366 73.1%
West Los Angeles 20,267 167,698 30.3%
Unincorporated Los Angeles County 7 422 69.7%
Total 30,590 253,876 30.7%
Source: Los Angeles County Office of the Assessor Secured Basic Abstract File

Overcom
2.2 Bu
Mapping utility platransformbecome unit-plus
MUDs wiFigure 2subregioand triple
Figure 2
ming Barriers
ilding Siz
the precise nning. Utiliti
mers and disincreasinglybuildings) w
ithin the We.2 presents n. Each city
exes can be
.2: MUD Bu
So
s To EV Cha
ze
location of Mes can use s
stribution stay adopted bywill likely nee
stside CitiesMUD sizes within the sfound within
uilding Sizes
ource: Los Angele
arging in MU
MUDs and ksuch maps ttions to acco
y residents, ted to be upg
s subregion and their sptudy region
n each jurisd
s Across th
es County Office
Ds – A Wes
knowing the to anticipateommodate Pthe electricityraded.
range in sizeatial distribuis home to a
diction, as we
he Westside
e of the Assessor
stside Cities
density of ue where upgrPEV charginy load capac
e from dupleution across a wide rangeell as buildin
e Cities Sub
r Secured Basic
Case Study
nits on a siterades may b
ng at MUDs. city at large
exes to 770-the Westsid
e of MUD sizngs with mor
bregion
Abstract FIle
y 8
e are helpfube needed fo
As PEVs MUDs (e.g.
unit buildingde Cities zes. Duplexere than 50 u
l for or
, 50-
gs.
es nits.

Overcoming Barriers To EV Charging in MUDs – A Westside Cities Case Study 9
Table 2.2 provides a count of MUDs by building size for each city in the Westside Cities subregion. Most of the region’s MUDs are four- to nine-unit buildings, followed by duplexes and triplexes (i.e., two- and three-unit buildings, respectively), 10- to 19-unit buildings, 20- to 49-unit buildings, and 50+-unit buildings. This distribution is fairly consistent from city to city, except in Culver City (where duplexes and triplexes comprise most of the MUD housing stock), and in unincorporated portions of Los Angeles County (where there are only seven MUDs in total).
Table 2.2: MUDs by Building Size for the Westside Cities
City Duplex/ Triplex
4 to 9 units
10 to 19 units
20 to 49 units
50+ units Total
Beverly Hills 298 686 181 103 5 1,273
Culver City 1,159 489 39 44 32 1,763
Santa Monica 1,128 2,725 831 293 39 5,016
West Hollywood 741 744 513 215 51 2,264
West Los Angeles 8,775 7,784 2,309 1,055 344 20,267
Unincorporated 1 3 0 0 3 7
Total 12,102 12,431 3,873 1,710 474 30,590
% of Total 39.6% 40.6% 12.7% 5.6% 1.5% 100%
Source: Los Angeles County Office of the Assessor Secured Basic Abstract File

Overcom
2.3 Un
Early PEmiddle- aat faster such as PMUD valpropensi
Figure 2the WestcalculateEach cityaverage value les
Figure 2.3
8 SheldonPlug-in Elhttp://inno
ming Barriers
it Values
V sales indicand low-incorates in genPEVs. High-ue per unit aty-to-purcha
.3 presents tside Cities sed by dividingy within the sunit value ov
ss than $50,0
3: MUDs by
, Tamara L., Jlectric Vehicleovation.luskin
Sourc
s To EV Cha
cate that higome househoeral and als
-income earnan indicator ase measure
the spatial dsubregion. Tg the total prstudy regionver $1 millio000.
Average Un
J.R. DeShazoe Sales in Cal.ucla.edu/con
e: Los Angeles C
arging in MU
gh-income hoolds.8 High-io have moreners can alsof latent PEV
e discussed
distribution oThe average roperty value is home to
on can be fou
it Value acro
o, Richard T. lifornia. Acces
ntent/factors-a
County Office of
Ds – A Wes
ouseholds ancome house disposableo afford to liV demand. Tin Chapter 3
of MUDs accunit value a
e of an MUDa wide rangeund in each
oss the West
Carson, and ssed August affecting-plug
the Assessor Se
stside Cities
are purchasinseholds tende income to sive in higherThis provide3.
cording to theassociated wD by the nume of MUD uncity, as can
tside Cities
Samuel Krum2017 from -electric-vehi
ecured Basic Abs
Case Study
ng PEVs at d to purchasspend on ner-value homees the basis
e average uwith each MUmber of unitsnit values. MMUDs with
mholz. 2016.
cle-sales-cali
stract File
y 10
higher ratese new vehicew technologes, making tfor the
nit value acrUD was s at that MUDMUDs with an
an average
Factors Affec
ifornia
0
s than cles gies the
ross
D. n unit
cting

Overcoming Barriers To EV Charging in MUDs – A Westside Cities Case Study 11
Table 2.3 provides the total number of MUDs according to the average unit for each city in the Westside Cities subregion. The most common average unit value for an MUD is between $50,000 and $249,999, with around 49% of the MUDs falling into this category. This is true among all cities within the region, except in unincorporated portions of Los Angeles County, where this is a very small sample of MUDs.
Table 2.3: MUDs by Average Unit Value across the Westside Cities Subregion
City Less Than
$50,000
$50,000–$249,999
$250,000–$499,999
$500,000–$999,999
$1 million and more
Total
Beverly Hills 173 488 322 232 58 1,273
Culver City 285 808 525 141 4 1,763
Santa Monica 767 2,354 1,150 602 143 5,016
West Hollywood 471 1,064 467 228 34 2,264
West Los Angeles 3,698 10,161 4,052 1,998 358 20,267
Unincorporated 4 2 1 0 0 7
Total 5,398 14,877 6,517 3,201 597 30,590
% of Total 17.6% 48.6% 21.3% 10.5% 2.0% 100%
Source: Los Angeles County Office of the Assessor Secured Basic Abstract File
Overcom
2.4 Vin
More recreasons. sufficientupgradesas new creplacem
Figure 2Westsideolder (buMarina D
Figure 2.4
ming Barriers
ntage
cently constrFirst, the el
t capacity fos such as inscircuit breakement materia
.4 presents e Cities subruilt before 19Del Rey area
4: MUD Build
Sou
s To EV Cha
ructed MUDsectrical servr supportingstalling a neers are requ
als may be e
the spatial dregion. The m970). Most ofa of the regio
dings by Yea
rce: Los Angeles
arging in MU
s may providvice provided PEV chargiw service wired to proviasier to find
distribution omajority of thf the newly b
on.
ar of Constru
s County Office o
Ds – A Wes
de advantagd by a utility ing, avoidingire or transfode sufficientand less ex
of MUDs by yhe housing sbuilt MUDs (
uction Acros
of the Assessor S
stside Cities
es when insto the MUD
g the need foormer. Secot capacity fo
xpensive.
year of consstock in the W(2000 and la
ss the Westsi
Secured Basic A
Case Study
stalling EVSE is more likeor potentially
ond, if panel r PEV charg
struction acroWestside Ci
ater) are loca
ide Cities Su
Abstract FIle
y 12
E on site for ely to have y costly servupgrades su
ging,
oss the ities subregiated around
ubregion
2
r two
vice uch
on is the

Overcoming Barriers To EV Charging in MUDs – A Westside Cities Case Study 13
Table 2.4: provides the total number of MUDs by building vintage across the Westside Cities subregion. MUDs built before 1970 comprise the far majority of housing stock in each city within the subregion. Very few MUDs in the region were built after 2000 (approximately 3% of the housing stock). These newer properties may be the most cost-effective locations for installing charging infrastructure, since they likely are designed to handle higher electrical loads.
Table 2.4: MUD Households by Building Vintage Across the Westside Cities Subregion
City Pre-1970 1970
to 1989 1990
to 1999 2000
to 2009 2010
and later
Total
Beverly Hills 1,122 107 18 21 5 1,273
Culver City 1,430 297 13 18 5 1,763
Santa Monica 3,905 793 173 121 24 5,016
West Hollywood 1,998 167 31 60 8 2,264
West Los Angeles 16,670 2,390 501 570 136 20,267
Unincorporated 4 1 0 1 1 7
Total 25,129 3,755 736 791 179 30,590
% of Total 82.1% 12.3% 2.4% 2.6% 0.6% 100%
,
Source: Los Angeles County Office of the Assessor Secured Basic Abstract File
Overcoming Barriers To EV Charging in MUDs – A Westside Cities Case Study 14
2.5 Ownership Types
MUD ownership influences a resident’s motivation to invest in home charging. MUDs include both apartment buildings and condominiums. Apartment buildings are generally owned by an individual or company that rents the units to tenants. The building owner is responsible for amenities in common spaces, such as lighting for the building’s lobby. Any structural changes to the building are paid for by the owner, who makes investment decisions based on increasing the value of the units and charging higher rents. Condominiums are MUDs in which the units are individually owned and non-unit decisions, such as managing common areas, are often made by a homeowner’s association (HOA) governing board. Sometimes the owner of a condominium unit may choose to live elsewhere and rent out their unit.
For renters, the investment motivation is weak or nonexistent because they are unlikely to invest a significant sum of money in immobile equipment that they would leave behind upon moving. Moreover, apartment owners and management groups may not view EVSE as an amenity by which to attract tenants. Alternatively, condominium owners are likely to view the EVSE as a property improvement positively affecting the potential resale value of their unit, although a significant installation may require approval by the HOA.
MUD ownership also determines who is responsible for managing common-area amenities, including any 110/120-volt outlets in the parking area. In an apartment building, such outlets, which can provide Level 1 charging if there is sufficient electrical capacity, are often connected to the house panel. The house panel controls the electrical supply for all shared appliances (such as laundry machines and pool pumps) and common-area amenities. Renters should seek approval from the property owner to consume electricity when the parking area electrical outlets are connected to the house panel (see Chapter 4 for more information about the electrical configuration of MUDs).

Overcom
Figure 2Cities suof condoArea, the
Figure 2
Apart
Cond
ming Barriers
.5 presents bregion. Mominium build
e western po
.5: MUD Bu
S
tment
ominium
s To EV Cha
the spatial dost of the MUdings can beortion of Wes
uildings by O
Source: Los Ange
arging in MU
distribution oUDs in the ree found acrost Hollywood
Ownership
eles County Offic
Ds – A Wes
of MUDs by oegion are apaoss the subred, and the no
Type Acros
ce of the Assess
stside Cities
ownership tyartment builegion, particorthern porti
ss the West
sor Secured Basi
Case Study
ype across tdings. Howe
cularly in theon of Santa
tside Cities
ic Abstract File
y 15
the Westsideever, a numb Westwood Monica.
s Subregion
5
e ber
n

Overcoming Barriers To EV Charging in MUDs – A Westside Cities Case Study 16
Table 2.5 shows the number of MUD units in apartment buildings and condominiums across the Westside Cities Subregion. Apartment units comprise about 79% of the MUD housing stock. Of all the cities in the study region, Culver City has the greatest percentage of condominium units (approximately 41% of total units).
Table 2.5: MUD Units by Ownership Type across the Westside Cities Subregion
City Apartment
Units Condominium
Units Total Units
Beverly Hills 8,236 2,215 10,451
Culver City 6,335 4,439
10,774
Santa Monica 32,031 9,134
41,165
West Hollywood 17,990 5,376 23,366
West Los Angeles 135,798 31,900 167,698
Unincorporated 421 1 422
Total 200,811 53,065 253,876
% of Total 79.1% 20.9% 100%
Source: Los Angeles County Office of the Assessor Secured Basic Abstract File

Overcoming Barriers To EV Charging in MUDs – A Westside Cities Case Study 17
2.6 MUD Presence in Disadvantaged Communities
The Westside Cities subregion includes 15 census tracts that are classified as disadvantaged communities by the California Office of Environmental Health Hazard Assessment’s CalEnviroScreen 2.0 screening tool. Disadvantaged communities are defined using a series of environmental, health and socioeconomic criterion, with the purpose of identifying areas disproportionately burdened by, and vulnerable to, multiple sources of pollution.9
Understanding the presence of disadvantaged communities within Westside Cities Subregion is important for PEV planning efforts. These communities tend to face significant financial barriers to transitioning from conventional gasoline vehicles to PEVs. To address this challenge, the California Air Resources Board (CARB) has launched a number of initiatives under its Low Carbon Transportation Program aimed at expanding PEV adoption among low- and moderate-income households. An example is the Enhanced Fleet Modernization (EFMP) Plus-Up Pilot Program, which provides significant financial assistance to low-income households in the Greater Los Angeles area and the San Joaquin Valley who scrap their old high-polluting car and replace it with a more fuel-efficient vehicle. When purchasing a PEV, low-income participants can receive $9,500 to buy or lease a new plug-in hybrid electric vehicle (PHEV) plus a $1,500 Clean Vehicle Rebate Program (CVRP) rebate, for a total of $11,000 in assistance. For a new battery electric vehicle (BEV), the rebate is $9,500 plus the $2,500 CVRP rebate, for a total of $12,000. In addition, individuals who purchase a BEV are eligible for up to $2,000 for a charging unit. To qualify, the resident must live in a zip code that includes a disadvantaged community census tract.10
Additionally, Southern California Edison’s Charge Ready program, which aims to install up to 1,500 charging stations at parking sites where dwell times exceed four hours or longer-term parking sites including MUDs, will target at least 10% of its deployment within disadvantaged communities.11
9 California Office of Environmental Health Hazard Assessment. 2014. CalEnviroScreen Version 2.0. Accessed August 2017 from http://oehha.ca.gov/ej/ces2.html 10 California Air Resources Board. 2015. “Making the Cleanest Cars Affordable.” http://www.arb.ca.gov/newsrel/efmp_plus_up.pdf 11 Southern California Edison. “Charge Ready: A Plan for California.” Accessed August 2017 from http://www.edison.com/home/our-perspective/charge-ready-a-plan-for-california.html

Overcom
Figure 2across thMUDs loAngeles duplexes
Figure 2.
ming Barriers
.6 provides he Westside cated in disaalong Inters
s and triplexe
.6: MUD Siz
s To EV Cha
an overviewCities subre
advantaged state 10. Thees).
zes in Disadv
Source: Los A
arging in MU
w of the MUDegion. Only Scommunitie
e majority of
vantaged Co
Angeles County O
Ds – A Wes
D building stoSanta Monics, with a muthese MUDs
ommunities
Office of the Asse
stside Cities
ock in disadvca and Westuch larger shs are also sm
s Across the
essor Secured B
Case Study
vantaged cot Los Angelehare locatedmaller in sca
e Westside C
Basic Abstract Fil
y 18
ommunities es are home in West Losale (i.e.,
Cities Subre
le
8
e to s
gion

Overcoming Barriers To EV Charging in MUDs – A Westside Cities Case Study 19
Table 2.6.1 provides the number of MUD units in disadvantaged communities across the Westside Cities subregion. Only Santa Monica and West Los Angeles have MUDs in disadvantaged communities, totaling 16,500 MUD units, or about 6.5% of the total MUD units in the region (i.e., 253,876 total housing units).
Table 2.6.1: Total MUD Units in Disadvantaged Communities for Westside Cities
City Number of Units % of Total Units
Beverly Hills 0 0%
Culver City 0 0%
Santa Monica 2,482 6.0%
West Hollywood 0 0%
West Los Angeles 14,013 8.4%
Unincorporated 0 0%
Total 16,495 6.5%
Table 2.6.2 shows the number of MUDs in disadvantaged communities across the Westside Cities subregion according to building size. Most are on the smaller end of the spectrum, with about 90% of them containing fewer than 10 units.
Table 2.6.2: MUDs by Size in Disadvantaged Communities for Westside Cities
City Duplex/ Triplex
4 to 9 units
10 to 19 units
20 to 49 units
50+ units
Total
Beverly Hills 0 0 0 0 0 0
Culver City 0 0 0 0 0 0
Santa Monica 74 158 29 16 6 283
West Hollywood 0 0 0 0 0 0
West Los Angeles 1,555 1,043 177 64 10 2,849
Unincorporated 0 0 0 0 0 0
Total 1,629 1,201 206 80 16 3,132
% of Total 52.0% 38.3% 6.6% 2.6% 0.5% 100%
Source: Los Angeles County Office of the Assessor Secured Basic Abstract File
Source: Los Angeles County Office of the Assessor Secured Basic Abstract File

Overcom
CHAP
This chahistoricalunit dwelthat estimlevel andmunicipaneighboroutreach
Photo Cred
ming Barriers
PTER 3
pter providelly been the llings (MUD)mates PEV dd MUD per ual governmenrhood outrea strategies).
dit: City of Sant
s To EV Cha
3: PEV D
s an overviegreatest and) residents. Tdemand as anit value (sents and otheach or organ
ta Monica
arging in MU
Deman
ew of where d where demThe latter is a function ofee Chapter er interested ize other pla
Ds – A Wes
d in the
PEV demanmand is expecalculated u
f historical P1.3 for a sumstakeholder
anning effort
stside Cities
e Wests
nd in the Weected to be tusing a propEV adoptionmmary of mers should usts (see Chap
Case Study
side Cit
estside Citiesthe greatest
pensity-to-pun trends as wethods). Subse this chaptpter 5 for mo
y 20
ties
s subregion among mul
urchase scorwell as incombregional anter to prioritizore detail on
0
has ti-re me nd ze n
Overcom
3.1 His
Knowing and nearplanners
Figure 3DecembeConsistesuch, Betracts colarger shhousehotechnolog
Figure 3.
ming Barriers
storic PEV
how many Pr-future demand utilities
.1 provides er 2010 and
ent with stateeverly Hills, tntaining morare of singlelds begin to gies continu
1: PEV Regi
s To EV Cha
V Deman
PEVs are reand for resid
s anticipate lo
an overview September
ewide trendshe Pacific Pre than 100 e-family residview the PEe to come d
istrations Be
Source: IHS Au
arging in MU
nd
egistered in adential chargocations like
w of the cumu2016 by ce
s, early PEV alisades, anPEV registradences, as s
EV as a viabdown, adopti
etween Decem
utomotive, Califor
Ds – A Wes
a given areaging. By exteely to carry a
ulative numbnsus tract acdrivers tend
nd Brentwooations. Thesseen in Figule transportaon will sprea
mber 2010 a
rnia Department
stside Cities
a helps deterension, this additional nig
ber of new Pcross the W
d to be higheod are all homse neighborhure 2.1. As mation option,ad beyond w
nd Septemb
of Transportatio
Case Study
rmine the locinformation ghttime elec
PEV registraWestside Citie
er-income home to a numhoods are almore modera, and as pricwealthier cen
ber 2016 by C
on
y 21
cation of curcan help
ctrical load.
tions betweees subregionouseholds. A
mber of censso home to ate-income
ces of batterynsus tracts.
Census Tract
1
rrent
en n. As us a
y
t

Overcoming Barriers To EV Charging in MUDs – A Westside Cities Case Study 22
Table 3.1 shows the number of PEV registrations across the Westside Cities subregion. West Los Angeles has the greatest number of PEVs, while Beverly Hill has the highest PEV purchase rate per 100 residents over the study period. BEVs are slightly more popular than PHEVs across the region, except for portions of unincorporated Los Angeles County.
Table 3.1 PEV Adoption for the Westside Cities Subregion
City PEV Registrations (December 2010– September 2016)
% BEV % PHEV Population PEVs per 100
Residents
Beverly Hills 932 64.9% 35.1% 30,89 3.0
Culver City 481 47.8% 52.2% 33,902 1.4
Santa Monica 1,929 57.8% 42.2% 92,169 2.1
West Hollywood 504 55.2% 44.8% 35,332 1.4
West Los Angeles 6,368 55.3% 44.7% 465,409 1.4
Unincorporated 205 45.9% 54.1% 10,277 2.0
Total 10,419 56.1% 43.9% 667,891 1.6
Source: IHS Automotive; Los Angeles County Office of the Assessor Secured Basic Abstract File; U.S. Census Bureau, 2011–2015 American Community Survey 5-Year Estimates
Overcom
3.2 Lat
Census tPEV demMUD is s
To identipropensiaccountssales amcertain inare purchpropensiAppendi
Figure 3across this home thigh prop
Figure 3
ming Barriers
tent PEV
tracts with hmand. If MUDserving as a
fy and priority-to-purcha
s for the histomong househncome level hased by higty-to-purchaix 1 for an o
.2 presents he Westside to a numberpensity-to-pu
.2: MUDs W
Source: IHS A
s To EV Cha
Demand
igh PEV adoD residents hconstraint to
tize the MUDase score fororical adopti
holds at diffeliving in a ho
gh-income inase score moverview of h
the distributCities subre
r of high-incourchase sco
With the Hig
Automotive, Los A
arging in MU
within M
option and ahere do not o these cens
D householdr each MUD ion rate of P
erent incomeome with a gndividuals wodel allocatehow the prop
tion of MUDsegion. Sinceome househres.
ghest Prope
Angeles County
Ds – A Wes
MUD Parce
high share have accesssus tracts’ fu
ds with high parcel in theEVs in each
e brackets, agiven value.ho are likelyes a greater pensity-to-pu
s with the hige Beverly Hill
olds, it has a
ensity-to-Pu
Office of the Ass
stside Cities
els
of MUDs mas to home chull PEV adop
latent PEV de Westside
h census tracand the proba
Consideringy to live in higscore to hig
urchase mod
ghest propels has a higha disproport
urchase Sco
sessor Secured B
Case Study
ay be areas harging, it isption potenti
demand, weCities subrect, the distribability of a hg that a largegh-value ho
gh-value homdel was cons
nsity-to-purch adoption rationate share
ores
Basic Abstract Fi
y 23
with high las likely that thal.
e calculated egion. The scbution of PE
household we share of Pmes, the
mes. Refer tostructed.
chase scoreate of PEVse of MUDs w
ile
3
atent he
a core
EV ith a
PEVs
o
es , and
with
Overcoming Barriers To EV Charging in MUDs – A Westside Cities Case Study 24
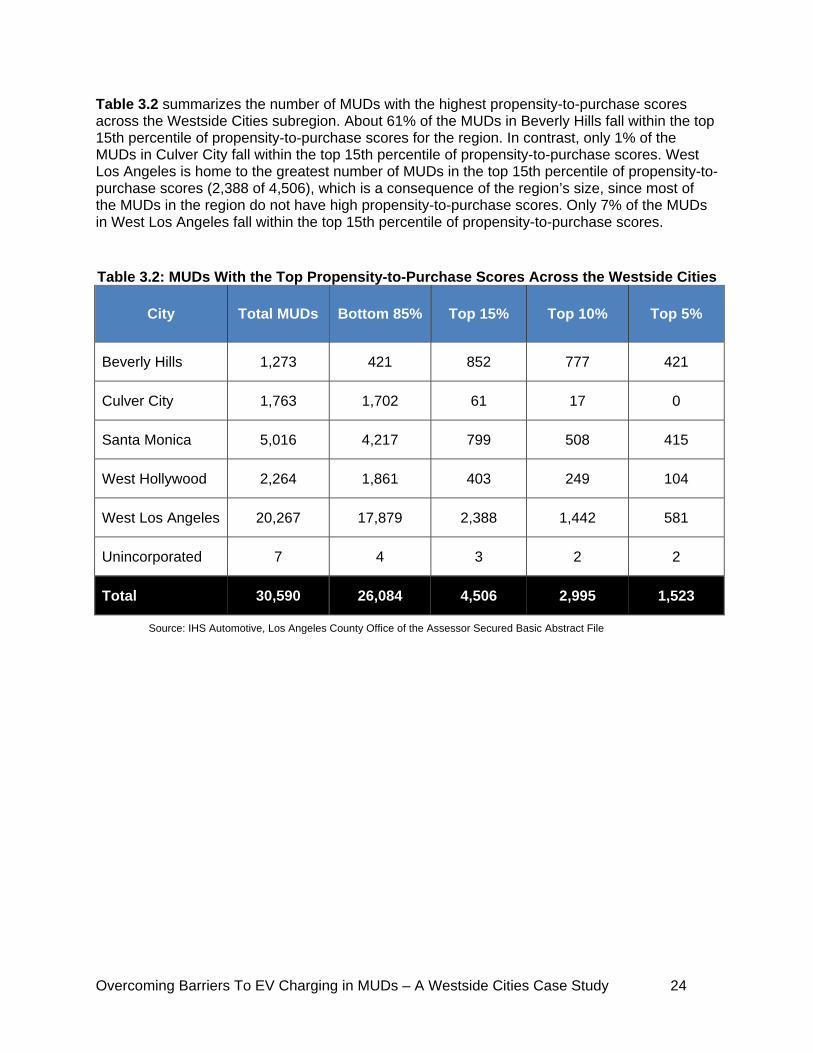
Table 3.2 summarizes the number of MUDs with the highest propensity-to-purchase scores across the Westside Cities subregion. About 61% of the MUDs in Beverly Hills fall within the top 15th percentile of propensity-to-purchase scores for the region. In contrast, only 1% of the MUDs in Culver City fall within the top 15th percentile of propensity-to-purchase scores. West Los Angeles is home to the greatest number of MUDs in the top 15th percentile of propensity-to-purchase scores (2,388 of 4,506), which is a consequence of the region’s size, since most of the MUDs in the region do not have high propensity-to-purchase scores. Only 7% of the MUDs in West Los Angeles fall within the top 15th percentile of propensity-to-purchase scores.
Table 3.2: MUDs With the Top Propensity-to-Purchase Scores Across the Westside Cities
City Total MUDs Bottom 85% Top 15% Top 10% Top 5%
Beverly Hills 1,273 421 852 777 421
Culver City 1,763 1,702 61 17 0
Santa Monica 5,016 4,217 799 508 415
West Hollywood 2,264 1,861 403 249 104
West Los Angeles 20,267 17,879 2,388 1,442 581
Unincorporated 7 4 3 2 2
Total 30,590 26,084 4,506 2,995 1,523
Source: IHS Automotive, Los Angeles County Office of the Assessor Secured Basic Abstract File

Overcom
3.2.1 LaThere maamong Prequires communincreasininstallatio
Figure 3propensidispropobecause
Figure
ming Barriers
atent PEV Day be signific
PEV drivers. a minimum ities). Thus,
ng PEV adopon.
.2.1 presentty-to-purchartionate shaof its high a
e 3.2.1 Larg
Source: IHS A
s To EV Cha
Demand focant advantaAdditionallyof 10 EVSEslarge MUDs
ption and pro
ts the distribase scores are of large M
adoption rate
ge MUDs (10
Automotive, Los
arging in MU
or Large MUages to insta
y, Southern Cs per site (os serve as pomoting the
ution of largcross the W
MUDs (10+ ue of PEVs an
0+ units) Wi
Angeles County
Ds – A Wes
UDs alling multiplCalifornia Edr five EVSEsrime candidapotential co
e MUDs (i.eWestside Citie
units) with hind its popula
ith the High
y Office of the As
stside Cities
le EVSE anddison’s (SCEs for sites inates for outr
ost savings to
e., more thanes subregionigh propensation of high-
hest Propen
ssessor Secured
Case Study
d sharing insE) Charge Rn disadvantareach prograo group inve
n 10 units) wn. Again, Beity-to-purcha-income hou
nsity-to-purc
Basic Abstract F
y 25
stallation coseady prograged
ams aimed aestment in EV
with the higheeverly Hills hase scores useholds.
chase Scor
File
5
sts am
at VSE
est as a
res

Overcoming Barriers To EV Charging in MUDs – A Westside Cities Case Study 26
Table 3.2.1 summarizes the number of large MUDs (i.e., more than 10 units) with the highest propensity-to-purchase scores across the Westside Cities subregion. About 70% of the large MUDs in Beverly Hills fall within the top 15th percentile of propensity-to-purchase scores for the region. In contrast, 0% of the large MUDs in Culver City fall within the top 15th percentile of propensity-to-purchase scores. West Los Angeles is home to the greatest number of large MUDs in the top 15th percentile of propensity-to-purchase scores (357 of 788), which again, is a consequence of the region’s size, since most of the large MUDs in the region do not have high propensity-to-purchase scores. Only 10% of the MUDs in West Los Angeles fall within the top 15th percentile of propensity-to-purchase scores.
Table 3.2.1: Large MUDs (10+ units) with the Highest Propensity-to-Purchase Scores
City Total MUDs (10+ Units)
Bottom 85% Top 15% Top 10% Top 5%
Beverly Hills 289 87 202 177 98
Culver City 115 115 0 0 0
Santa Monica 1,163 994 169 111 90
West Hollywood 779 720 59 39 20
West Los Angeles 3,708 3,351 357 221 125
Unincorporated 3 2 1 0 0
Total 6,057 5,269 788 548 333
Source: IHS Automotive, Los Angeles County Office of the Assessor Secured Basic Abstract File

Overcom
CHAPInfras
In place oand theirchoose aof installaalready amiles perwhich caPEVs at
For singlfamily hoinstallatiohas a preinstallingbecome an electrwiring an(coveredservice iswill be ne
See Figufor a singstages mestimatesespeciallin chargi
Figure 4
12 Center
Image Sour
($
ming Barriers
PTER 4structu
of a 15-minur PEVs are pa Level 1 or 2ation. Level available in mr hour. Seven be satisfiea much fast
e-family homomes tend toon of the necedictable cos EVSE in a a barrier. To
rical outlet (cnd conduit is in Section s not providiecessary (co
ure 4.1 for agle charging
may be relevas and do noty considerinng preferenc
4.1: Potentia
for Sustainab
rce: Noun Projec
$300 to $6,500)
s To EV Cha
4: The Cre in M
ute detour toplugged-in th2 charger, d1 charging rmany parkinenty-eight peed with 3 to 8er rate of 8–
meowners, ho have sufficcessary elecst. The sameMUD parkin
o begin, all Pcovered in S needed to c4.2). If the png enough e
overed in Se
n overview ounit. Depen
ant. It’s wortt reflect the
ng the variatices among P
al Costs at
ble Energy. C
ct; car by Tracy T
($180 to $4
arging in MU
Cost of UDs
o a gas statiohroughout thdepending onrequires a 11g layouts. It
ercent of PEV8 hours of Le–24 miles pe
home chargicient electricactric vehicle e cannot be g environme
PEV drivers ection 4.1). connect the panel cannotelectricity to
ection 4.3).
of the variounding on the th emphasizabsolute lowion in electriPEV drivers
the Differen
alifornia Plug
Tam; electric equ
($60 to $2,600)
Ds – A Wes
Installi
on, most PEe night. To cn charging p10/120-volt orequires 15
V drivers aveevel 1 charg
er hour, but t
ng is generaal capacity tosupply equipsaid for PEV
ent varies grneed EVSE Once the decharging out produce adthe property
us costs at thelectrical coing that the
wer or uppercal configur(i.e., Level 1
nt Stages o
g-in Electric Ve
uipment by Prosy
,000)
stside Cities
ing Cha
V owners recharge PEVpreference, routlet, the st
5 amps of coerage 15 to
ging.12 Level they require
ally an easilyo support ovpment (EVSV home chareatly from sequipment fesired EVSE
utlet to the eldequate elecy, then pane
he different sonfiguration ranges prov
r limit of instarations amon1 or Level 2
of EVSE Inst
Vehicle Driver
ymbols; building
Case Study
arging
efuel when thVs at home, drecharging ntandard 3-pr
ontinuous loa45 miles of 2 charging a 208/240-v
y available avernight cha
SE) is straigharging at MUsite to site anfor pluggingE unit is obtalectric panelctricity and/oel and/or serv
stages of EVof a given M
vided below allation costsng MUDs, ancharging).
tallation at
Survey Resu
by Nicholas Men
($274 to $3
y 27
hey are at hodrivers geneneeds, and crong plug thaad to chargedriving per dunits chargevolt outlet.
amenity. Singarging, and thhtforward anDs. The cos
nd can quick their vehicleained, prope at the MUD
or the utility vice upgrade
VSE installatMUD, not all are ballparks at each stand the variat
MUD Locat
ults – May 201
nghini; pylon by A
3,500)
7
ome erally cost at is
e 4–6 day, e
gle-he d st of kly e into er D
es
tion
k age, tion
ions
13.
Arthur Shlain.

Overcom
Backgro
The elecelectric mAn overhmeter seor pull boutility feeundergroresurface
Inside theas well aand mainthe unit meter(s) electricitymachineselectric b
Figure 4
Two examMUD’s el
ming Barriers
ound on the
trical configumeter throughead drop ofction or to th
ox — an unded. The connound serviceed at the pro
e electric bos the main b
n breaker. Popanel, wherand main br
y to commons, pool pump
box or in ano
4.2: Photos
mples of overhlectric box (Pho
s To EV Cha
e Electrical C
uration of anh either an o
ften comes fhe electric bderground conection is thee connection operty’s elec
ox is the propbreakers (picower is distrre circuit brereaker(s) disn areas and ps, electric wother commo
of Overhea
ead service drooto credit: UCL
arging in MU
Configurati
n MUD is comoverhead sefrom a utility ox. Undergrompartment en run up to can run dow
ctric box.
perty’s metectured in Figributed from akers safely
stribute powegeneral elec
water heateron space.
ad Service D
ops providing eLA Luskin Cent
Ds – A Wes
on of Multi-
mplex. Utilitiervice drop opole to the round servicethat serves the MUD’s e
wn a utility p
er section, whgure 4.2). Eathe meter se
y manage eaer to a housctrical loads rs, and more
Drops and M
electricity to theer).
stside Cities
-Unit Dwelli
ies distributeor an undergroof of the pe connectionas the mainelectric box.
pole, be tunn
hich includeach residentection to a pach unit’s elese panel(s),
such as pare. The house
Meters at M
e A clumeteinsidLusk
Case Study
ings
e power to eground servicproperty and ns come from
n termination. Alternativelneled underg
es the housetial unit has panel locatedectric load. T which then rking outletse panel can
MUDs
uster of house er section) andde an electric bkin Center).
y 28
each propertyce connectiodown to the
m a pull secn point for thly, an ground, and
and unit meits own meted in each unThe house provides
s, laundry be located i
and unit meter their main bre
box (Photo cred
8
y’s on. e ction e
then
eters er nit, or
n the
rs (i.e. ,the eakers dit: UCLA

Overcom
Case StuThis chaChargingdevelopeestimatesconfiguraResearchto estimaof 27 siteBased onranging fof any paLevel 2 in
The moson averagreatest assumedaverage.
Figure 4
13 UCLA Lunit Dwell14 Compleunable to to determthe MUD 15 ElectricAccessed
ming Barriers
udy Findingpter reviews
g in Multi-unied for installis were deveation of MUDhers requestate the cost oes were actun these 15 cfrom $1,800 anel upgradenstallation co
t significant ge was 45%cost, compr
d for EVSE a See Figure
4.3: Installa
Luskin Centerlings: A South
ete cost estimbe found, weine the electrreceives eno
c Power Resed August 2017
s To EV Cha
gs s findings froit Dwellings:ng charging
eloped by a qDs, necessarted 30 MUDof installing
ually visited, cost estimate
to $17,800 es, but not inosts for sing
component % of the totalrising 40% ofacross all ese 4.3 for inst
tion Costs f
r for Innovatioh Bay Case S
mates were noere not interesical service bugh power to
arch Institute7 from https://
arging in MU
om the 2016 : A South Bag infrastructuqualified elecry panel and
D site visits toa single Levand a total o
es, the electrper site, withncluding the gle-family res
of installatio project costf total projectimates, comallation cost
for Level 2
on. 2016. OveStudy.
ot obtained forsted in partici
being providedprovide Leve
. 2013. Electr/www.epri.com
Ds – A Wes
report Overay Case Studure at samplectrician who
d service upgo assess Levvel 2 EVSE uof 15 complerician estimah an averagecost of serv
sidences ave
on costs acrot. Materials (ct costs on amprising abots across the
EVSE Unit
ercoming Barr
r all 30 propepating in the sd to the MUDel 2 charging
ric Vehicle Sum/#/pages/pro
stside Cities
rcoming Barrdy, in which e MUD sites
o consideredgrades, and vel 1 and Leunit. From thete cost estiated Level 2e of $5,400 vice capacityerage $1,50
oss the 15 e(other than E
average. A cout 15% of the15 sample e
Across 15 M
rriers to Electr
rties becausestudy, or wer, which is necfor one or mo
upply Equipmoduct/000000
Case Study
rriers to Eleccost estima
s in the Sout the followinopportunitie
evel 2 chargehe 30 selectemates were EVSE instaper site (inc
y upgrades).00.15
estimates waEVSE) were
constant priche total projeestimates.
MUDs
ric Vehicle Ch
e some propere unable to pcessary for deore vehicles.
ment Installed 00030020005
y 29
ctric Vehicle ates were th Bay.13 Theng: electrical es for savinge readiness,ed sites, a toobtained.14
allation costscluding the co
In contrast,
as labor, whie the secondce of $480 wect cost on
harging in Mu
erty owners wprovide permisetermining wh
Cost Analysis577/
9
e
gs. , and otal
s ost ,
ich d-as
ulti-
were ssion hether
s.

Overcom
Savings
Althoughreductionbelow:
U
S
Idcoe
Figure 4of Electr
Photo credit:
ming Barriers
Opportunit
h the estimatn strategies e
Using Level 1
Sharing EVS
dentifying paost Level 2 clectrical outl
4.4: Dingbatrical Outlet
UCLA Luskin Ce
s To EV Cha
ties
ted installatioemerged. Th
1 charging, p
E installation
arking layoutcharging infrets).
t Parking LaAccess
enter
arging in MU
on costs wehese costs s
particularly in
n costs acro
ts and electrrastructure in
ayouts With
Ds – A Wes
re high in thsavings are d
n dingbat pa
ss multiple P
rical configurnstallation (e
h Medium to
Photo cre
stside Cities
is exercise, detailed in S
arking lots (s
PEV drivers
rations that le.g., parking
o High Prob
edit: UCLA Luski
Case Study
some potenSection 4.4 a
see Figure 4
.
lend themseg spots close
bability
in Center
y 30
ntial cost-and summa
4.4).
elves to lowee to existing
0
rized
er-

Overcom
4.1. Ele
Level 1 apower —charging 1 EVSE csupply upany comEVSE typcan rangon the inSee Figu
Figure 4
16 U.S. DeEquipmenhttps://ww
Level 1 C
($
ming Barriers
ectric Ve
and Level 2 E— the typical
equipment,can supply up 240 volts, mon outlet apically comee from $300cluded featu
ure 4.5 for sa
4.5: Exampl
epartment of Ent. Accessed Aww.afdc.energ
Charging Ex
Source: V
$300 to $6,500)
s To EV Cha
hicle Sup
Electric Vehpower supp which then up to 120 voor 60 miles
as long as thes at the poin0 to $1,500, wures and wheample photo
les of Level
Energy. 2015August 2017
gy.gov/upload
xample
Voltrek
arging in MU
pply Equi
icle Supply lied to resideconverts it i
olts of powerper hour. Le
here is enougnt of PEV puwhile Level ether the unos of EVSE a
l 1 and Leve
5. Costs Assofrom
ds/publication/
Ds – A Wes
ipment
Equipment (ences and bnto direct cu
r, or six milesevel 1 EVSEgh availableurchase and2 EVSE canit is mountedat each char
el 2 Chargin
ciated with N
/evse_cost_re
Leve
stside Cities
(EVSE) provbusiness — turrent powers per hour, w
E can typicalle power supp is the chea
n range fromd on a wall orging level.
ng EVSE
Non-Residentia
eport_2015.p
el 2 Charging
Source: Clip
Case Study
vides alternato the PEV’sr for battery while Level 2ly be directlyply at the papest option.
m $400 to $6or a freestan
al Electric Ve
g Example
per Creek
y 31
ating current s onboard charging. Le2 EVSE can y plugged innel level. LeLevel 1 EVS
,500, depennding pedes
ehicle Supply
1
evel to
evel 1 SE ding tal.16

Overcom
4.2 Ru
To providelectricalinstallatioextends trenchingstructuralike x-ray
Soft costactivitiessignificanexperienbe relateTaxes on
Permits, installatiodrawingsand Safestudies o
Once theconduit abarriers telectricalbetween
EVSE inswiring buactivitieselectrical$4,600 in
17 UCLA LUnit Dwel
ming Barriers
nning Wi
de electricityl panel to theon process chowever, adg through col feature (e.g
ying concrete
ts include pe, taxes on thnt cost compce, trade un
ed to the matn materials v
inspection ron of EVSE s that must bety. Requiremof the proper
ere is sufficieand wire fromthat might arl system varthe panel w
stallations thut also increa. For MUD sl panel, thesn material an
Luskin Centerllings: A South
(
s To EV Cha
ires and C
y to EVSE eqe PEV chargcan be straigdditional costoncrete or asg., subterrane to ensure s
ermitting andhe materials ponent of proion memberterials and tyvary by state
requirementsand any cor
be reviewed ments for enrty.
ent electricalm the relevarise. The cosries from sitewith the EVSE
hat traverse ase the likelisites where tse additional nd labor, com
r for Innovatioh Bay Case S
($180 to $4,600+
arging in MU
Conduit t
quipment, ange point. If thghtforward. Ats can arise
sphalt. In MUnean garagestructural int
d inspection purchased,
oject installarship, and thype of labor e and profits
s, and assocrresponding by the respo
ngineering dr
l capacity to nt panel to tst of connece to site. TheE-dedicated
long distancihood of requthe PEV parconstruction
mprising 5%
on. 2016. OveStudy.
+)
Ds – A Wes
to Charge
n electrician he panel is cAs the lengthfrom materi
UDs where pes), EVSE integrity.
fees, tool reand contrac
ation and canhe complexity
required andvary by the
ciated fees velectrical uponsible agenrawings can
perform PEhe PEV park
cting chargine strongest p circuit and t
ces not only uiring signifiking spot wan and engine to 48% of to
ercoming Barr
stside Cities
e Point
may need tclose to the Eh between thals, labor, a
parking areanstallation ma
entals for conctor fees. Lan vary depeny of the job. d will vary gcompany co
vary by city apgrade will lincy, such as vary and m
EV charging,king spot, ovg infrastruct
predictor of cthe PEV par
require greacant construas 100 feet oeering activiotal materia
rriers to Electr
Case Study
to run wires EVSE locatiohe panel andnd construcs represent ay require e
nstruction orabor is often nding on theThe cost ofreatly from pontracted for
and by counkely require
s a Departmemay require e
a contractovercoming ature to the bcosts is the drking spot.
ater lengths uction and eor greater froities accountl and labor c
ric Vehicle Ch
y 32
from the on, the d the EVSE
ction activitiea significant
engineering t
r engineeringthe most
e contractor’sf tool rentals project to pror labor.
ty. The engineering
ent of Buildielectrical loa
or needs to ruany physical uilding’s distance
of conduit angineeringom the relevted for $180costs.17
harging in Mu
2
site es like t tests
g
s will oject.
g ng d
un
and
vant 0 to
ulti-

Overcom
4.3 Up
Sometimcapacity.
A. Ad
B. Up
These upengineeroverall ebuilding’sexisting e
The folloservice. IService R27 differe A. Addin
Level 1 cinstances15- or 20the otherloads on service to
To asseselectriciadeterminelectric u
Level 2 cspace onnecessar
When themust cre
ming Barriers
grading E
mes the insta. Electrical u
dding capaci
pgrading ele
pgrades shor. An electricnergy supplys electrical loelectricity su
wing sectionIt provides uRequiremenent MUDs ac
ng Electrica
charging res, 110/120-v
0-amp breakr loads tied tthe same ho
o all loads s
ss the feasiban or electrice if there is
utility at the r
charging ren the panel, try dedicated
ere is insuffiate additiona
s To EV Cha
Electrical
llation of a Lpgrades can
ity to the uni
ctric service
ould be madecal engineer y and demanoad. Load re
upply to acce
n reviews coutility-specificts and othercross the So
al Capacity t
quires a dedvolt outlets aer on the hoo that panelouse panel mharing the p
bility of Levelcal engineer available ca
request of th
quires a dedthen an elec
d circuits.
cient capacial capacity i
($
arging in MU
l Panel an
Level 1 and Ln occur in tw
t or house p
e capacity to
e in consultacan providend of a buildeduction effoess Level 1 c
osts associatc informationr SCE Guideouth Bay with
to the Unit o
dicated 20-aare available ouse panel. T, such as elemay trip the anel.
l 1 charging,should revie
apacity. This he person na
dicated 40-actrician can s
ity or space n one of the
$60 to $2,000)
Ds – A Wes
nd Utility
Level 2 EVSwo ways with
panel, and/or
the MUD fro
ation with ane an installatiding, and maorts may allocharging (se
ted with upgn from Southelines, plus oh a qualified
or House P
amp breaker in the parki
The amount ectricity neemain break
, the residenew the annuainformation
amed on the
amp circuit. Ifsimply add b
on the panee following w
stside Cities
y Service
SE will requirhin an MUD’s
r
om the utility
n electrician, ion quote th
ake recommeow residentsee Section 4
rading MUDhern Californobservationsd electrician.
anel
rated for cong area andof available
eded for comer — a safet
nt, property mal peak loadis often avabill.
f there is sufbreakers to t
el for a dedicways:
($274 to
Case Study
re additionals electrical c
y.
or ideally, aat looks holiendations fo
s to use the b4.4 for more
D panel capania Edison (Ss made durin
ontinuous usd receive elee capacity ofmmon areas.
ty response
manager, ord of the housailable from a
fficient capathe panel to
cated circuit,
$33,500)
y 33
l electrical configuration
an electrical istically at thor reducing tbuilding’s information)
acity and utilSCE) Electring site visits
e. In many ectricity from ften dependsA confluencthat shuts d
r owner, andse panel to an individua
acity and brecreate the
an electricia
3
n:
he the
).
ity ic at
a s on ce of down
an
l’s
eaker
an

Overcoming Barriers To EV Charging in MUDs – A Westside Cities Case Study 34
a. Upgrade to a new panel. A panel upgrade replaces the existing panel (e.g., 50-amp) with one that has additional breaker space or greater capacity (e.g., 100-amp). Cost estimate: $1,000 or more for a panel upgrade with new breakers
b. Reconfigure the current panel to provide more breaker space. Electricians can reconfigure the breakers on the existing panel to free up space for additional breakers. For example, a tandem circuit breaker allows for two circuits to be installed in one circuit breaker space. Cost estimate: $60 to $500, depending on panel breaker’s type, size and age
c. Add a subpanel for the EVSE unit. Electricians may also install a subpanel. Electricians can, for example, replace multiple breakers with a tandem circuit breaker and run a wire from it to the new subpanel. The result is a subpanel with space for multiple breakers, including a dedicated one for Level 2 charging. Cost estimate: $500 to $2,000, depending on distance between panel and subpanel, and the number and type of breakers
d. Add a separate panel from the existing service. An electrician can add a separate panel with a dedicated service for PEV charging. This requires a newly installed panel to connect to the current service drop or connection (sometimes called “tapping into” or “tapping off”). The resident and property manager or owner and an electrician should work with their local utility to ensure they follow all electrical service guidelines. Cost estimate: $1,000 or more to install a new dedicated panel and to connect to existing service, depending on the space available for the panel and the distance between the new panel and the service connection.
For Level 1 charging, 78% of the sites we visited had access to 110/120-volt outlets in the parking environment. Depending on the parking layout, outlets were either scattered randomly throughout the parking environment or were available at each individual parking spot. Of these sites, 96% of the 110/120-volt outlets were connected to a 15- or 20-amp circuit on the house panel. Without permission to review the annual peak load, it was unclear whether there was sufficient capacity on the house panels for Level 1 charging.
For Level 2 charging, 93% of the sites visited did not have sufficient panel capacity or breaker space and would require upgrades. At these sites, additional capacity would need to be added through the one of the four options described above (i.e., a panel upgrade, a reconfiguration of panel breakers, the installation of a subpanel, or the installation of a new dedicated panel that is connected to the existing service).
Before an electrician can make any panel adjustments, a utility representative must visit the site to review the installation plan and provide electrical code instructions. Any electrical upgrade that requires utility approval will also require bringing the property up to Electrical Service Requirement code. For example, SCE requires flat ground below meters have three feet of clear working space in front of them so that staff can easily and safely access and read meters. If the current panel is not up to the utility’s standards or there is no space for an additional panel, the electrician may be required to move the entire meter section, which would increase costs.

Overcoming Barriers To EV Charging in MUDs – A Westside Cities Case Study 35
B. Upgrading Electric Service Capacity to the MUD from the Utility
To add capacity at the panel level for EVSE, the property must receive enough power from the utility to support the added load. If there is insufficient power, tenants or owners must apply for a utility service upgrade to replace service wires fed to the MUD and/or upgrade distribution lines (e.g. replacing or upgrading the transformer).
Adding capacity at the panel level may require upgrading the MUD’s utility service. Service upgrades may be more likely when the MUD is located at the end of the utility’s electrical lines served by a substation or in urban areas where building density has already maximized the electric service capacity.18 To accommodate additional capacity, the utility may need to perform service line and/or distribution line upgrades.
For these types of upgrades, SCE is “responsible for the cost of the service connector, connectors, support poles, and metering.”19 These costs are covered by a residential allowance and any amount over the allowance is billed to the customer. The customer is “responsible for any trenching, conduit, substructures, or protective structures required for the upgrade. These costs are not covered by the allowance.”20
Within SCE territory, if the service capacity from an overhead drop increases to over 200 amps, the customer is responsible for burying the overhead feed underground.21 This likely will require costly construction activities, including trenching and the demolition of concrete. Medium-sized MUDs (10–19 units) receiving electricity from an overhead drop may be at or above the 200-amp threshold and thus subject to this rule and associated costs.
Out of 9,300 on-site residential service assessments for PEV charger installations completed before November 2014, SCE required service upgrades only 26 times (0.3%).22 The service upgrade costs ranged from $274 to $33,499, with service line upgrades averaging $2,055 and distribution line upgrades averaging $7,165.23 It is important to note that these include a significant share of single-family households that are more likely to have sufficient capacity available. SCE also needed nine service upgrades for commercial installations, which may be more reflective of medium- and large-sized MUDs. In the event that a service upgrade is required, the applicant shall be granted an allowance of $3,402 per residential dwelling unit.24
18 California Department of Housing and Community Development. 2013. Electric Vehicle Ready Homes. Accessed August 2017 from http://www.hcd.ca.gov/building-standards/state-housing-law/docs/ev_readiness.pdf 19 San Diego Gas & Electric. 2014. Joint IOU Electric Vehicle Load Research Report. Accessed August 2017 from http://docs.cpuc.ca.gov/PublishedDocs/Efile/G000/M143/K954/143954294.PDF 20 Ibid. 21 Phone Interview with Southern California Edison, November 28, 2015. 22 San Diego Gas & Electric. 2014. Joint IOU Electric Vehicle Load Research Report. Accessed August 2017 from http://docs.cpuc.ca.gov/PublishedDocs/Efile/G000/M143/K954/143954294.PDF 23 Ibid. 24 Southern California Edison Tariff Books. Rule 15. Accessed August 2017 from https://www.sce.com/NR/sc3/tm2/pdf/Rule15.pdf

Overcoming Barriers To EV Charging in MUDs – A Westside Cities Case Study 36
4.4 Cost-Saving Opportunities to Reduce Charging Fees
To help reduce the cost of EVSE installations at MUD sites, multiple PEV drivers at one location can split the up-front installation costs. If this isn’t an option, PEV drivers can opt to rely on Level 1 charging and possibly avoid installation costs altogether. This section reviews these two cost-saving strategies.
Cost Advantages to Group Investing in Level 2 Charging Infrastructure
PEV owners can share EVSE installation costs at MUD residences. Figure 4.6 shows the decreasing cost per added EVSE on a site, as based on 13 different potential charging configurations at eight different sample sites.25 When considering EVSE installation, an owner or renter should survey neighbor units to gauge interest in PEV ownership and sharing of costs associated with EVSE installation.
Figure 4.6: Cost Reductions Achieved Due to Multiple EVSE Installations
25 UCLA Luskin Center for Innovation. 2016. Overcoming Barriers to Electric Vehicle Charging in Multi-unit Dwellings: A South Bay Case Study.
$0
$2,000
$4,000
$6,000
$8,000
$10,000
$12,000
$14,000
0 2 4 6 8 10
Co
st p
er C
har
ger
($)
Number of Chargers
Unique Charging Configurations (n=13)
Source: On Target Electric, for study purposes only

Overcoming Barriers To EV Charging in MUDs – A Westside Cities Case Study 37
Technological solutions can support group investments in EVSE installation. For example, energy-saving technologies such as energy management systems (EMS) can be installed to optimize multiple PEV charges. The management of energy in response to the charging needs of PEVs and the available electrical capacity of a building can delay the need for costly electrical upgrades. For example, if a building’s electrical capacity can handle only one PEV charging at full capacity but there are three PEVs in the building, EMS technology can distribute power to each PEV at different times so that all three PEVs can charge overnight. This prevents the need to upgrade the electrical capacity of the building to accommodate all three PEVs.
Accessing Level 1 Charging to Avoid Electrical Upgrades
Depending on a PEV driver’s available charge time and daily commute, MUD parking environments with access to 110/120-volt outlets may be good candidates for Level 1 EVSE charging. The resident, property manager, or owner, along with an electrician or electrical engineer, should review the annual peak load of the house panel to determine if there is available capacity considering other loads tied to the panel, such as laundry machines, pool pumps, etc. This information is often available from the utility provider at the request of the person named on the electric bill.
If the house panel does not have sufficient capacity to accommodate Level 1 charging, strategic energy efficiency measures may be deployed to reduce the overall load of the house panel. This can include efficient lighting, or energy-efficient replacements for a property’s electric water heater, washer/dryer, or pool pump. Electric utilities offer a number of rebates and incentives to improve efficiency. See Figure 4.7 for an overview of how the average household in California consumes electricity. The greatest savings can be achieved in improving the efficiency of lighting fixtures, refrigerators/freezers, and household devices with screens (e.g., televisions, personal computers, etc.).
Figure 4.7: Average California Electricity Consumption per Household26
(6,296 kWh per Household)
26 California Energy Commission, 2010. 2009 California Residential Appliance Saturation Study. Accessed August 2017 from http://www.energy.ca.gov/appliances/rass/
Source:
Lighting22%
Refrigerators + Freezers
20%
TV, PC, and Office Equipment
20%
Air Conditioning7%
Pools + Spas7%
Dishwasher + Cooking
4%
Laundry4%
Space Heating2%
Water Heating3%
Miscellaneous11%

Overcoming Barriers To EV Charging in MUDs – A Westside Cities Case Study 38
4.5 Charging Potential in the Westside Cities by Parking Layout
In Southern California, and specifically the Westside Cities subregion, the private vehicle has played a significant role in shaping land use patterns and the built environment, as well as MUD architectural designs. The latter tend to change over time and location depending on construction trends and sociodemographic changes. These changes can influence unit size, the availability of on-site amenities such as laundry services, and the parking layout of the property.
The parking layout is of particular importance to PEV ownership and EVSE installation. Indeed, one of the most significant drivers of EVSE installation costs is the distance from the electrical panel to the PEV charging spot and a MUD’s parking layout will greatly influence this length of distance. The parking layout may also determine whether a PEV driver will have access to an electrical outlet for Level 1 charging. And finally, some parking layouts such as shared garages may provide opportunities for sharing the installation costs for multiple EVSE or the deployment of new technologies such as energy management systems (EMS) which allow for the strategic charging of multiple PEVs by optimally balancing each vehicle’s state of charge with available electrical capacity.
Eight common MUD parking layouts across the Westside Cities Subregion include: 1) dingbat with door, 2) dingbat without door, 3) detached parking with door, 4) detached parking without door, 5) podium garage, 6) subterranean garage 7) parking lot, and 8) driveway only. See Table 4.1 for a description of each parking layout.

Overcom
Table 4.1
Parkin
Dingba • Enclose• Equipp• Often lo• At or be• High pr
Dingba • Open o• Not equ• Located• At or be• Medium
Detach • Enclose• Equipp• Detach• At grad• Medium
Detach • Open p• Not equ• Detach• At grad• Low to
ming Barriers
1: Common
ng Layout T
at With Doo
ed individual ped with privatocated directlelow grade robability of e
at Without
or partitioned uipped with pd below houselow grade m probability o
hed Parkin
ed individual ped with privathed from mainde m to high prob
hed Parkin
parking structuipped with p
hed from mainde
medium prob
s To EV Cha
n MUD Park
Type
or
garage partitte garage dooly below drive
lectrical outle
Door
parking spotsprivate garagesing units
of electrical o
g With Doo
garage partitte garage doo
n MUD structu
bability of elec
g Without
ure often partprivate garagen MUD structu
bability of elec
arging in MU
ing Layouts
ioned by wallor er’s housing u
et access
s e door
outlet access
or
ioned by wallor ure
ctrical outlet a
Door
titioned by wae door ure
ctrical outlet a
Ds – A Wes
s Across th
S
s
unit
P
P
s
access
P
alls
access
P
stside Cities
he Westside
ample Pho
Photo credit: UC
Photo credit: UC
Photo credit: UC
Photo credit: UC
Case Study
e Cities Sub
oto
CLA Luskin Ce
CLA Luskin Ce
CLA Luskin Ce
CLA Luskin Ce
y 39
bregion
nter
nter
nter
nter
9

Overcom
Podium • Enclose• Not equ• Located• At grad• Medium
Subter • Enclose• Not equ• Located• Below g• Medium
Drivew • Open p• Not equ• Located• At grad• Zero to
Parkin • Open p• Not equ• Located• At grad• Zero to
ming Barriers
m Garage
ed shared gauipped with pd below hous
de m to high prob
rranean Ga
ed shared gauipped with pd below housgrade m to high prob
way Only
parking spot ouipped with pd adjacent to
de o low probabil
g Lot
parking lot notuipped with pd adjacent to
de o low probabil
s To EV Cha
arage private garagesing units
bability of elec
arage
arage private garagesing units
bability of elec
or spots not pprivate garage
main MUD s
ity of electrica
t partitioned bprivate garage
main MUD s
ity of electrica
arging in MU
e door
ctrical outlet a
e door
ctrical outlet a
artitioned by e door tructure
al outlet acce
by walls e door tructure
al outlet acce
Ds – A Wes
access
P
access
P
walls
ss
P
ss
P
stside Cities
Photo credit: UC
Photo credit: UC
Photo credit: Go
Photo credit: Go
Case Study
CLA Luskin Ce
CLA Luskin Ce
oogle Map Data
oogle Map Data
y 40
nter
nter
a
a
0
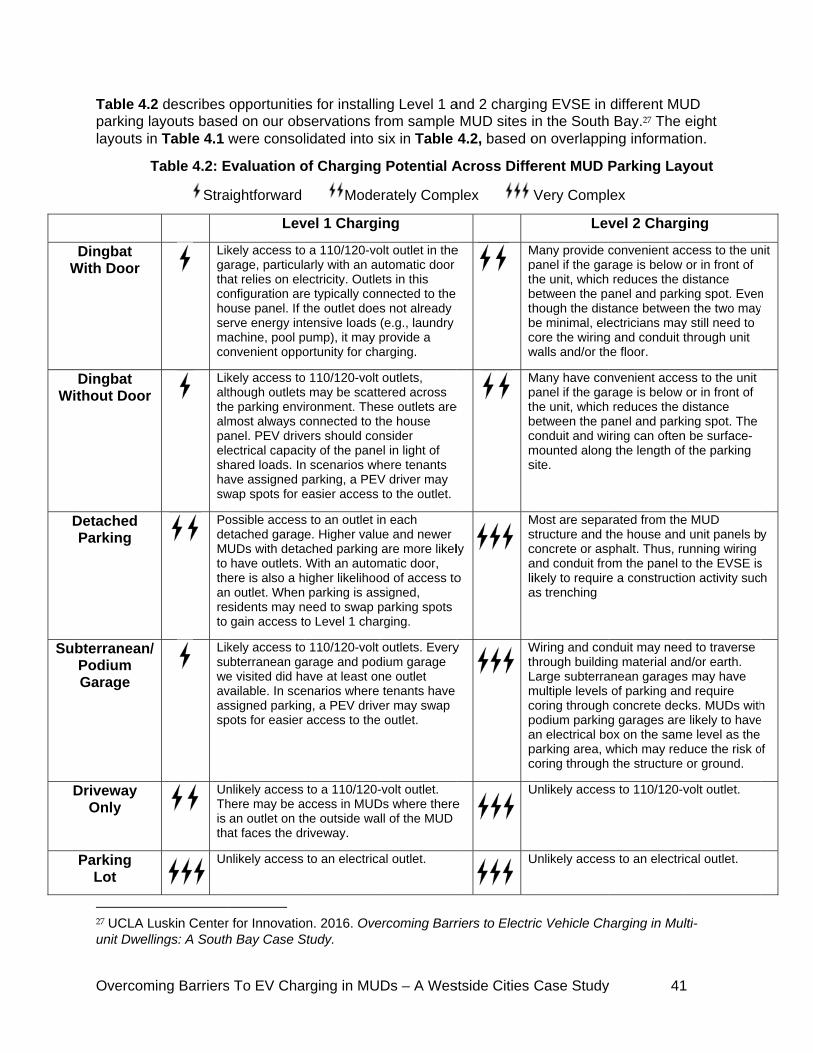
W
Wi
D
Sub
D
Overcom
Table 4.2parking lalayouts in
T
Dingbat With Door
Dingbat thout Door
Detached Parking
bterranean/Podium Garage
Driveway Only
Parking Lot
27 UCLA Lunit Dwell
ming Barriers
2 describes ayouts basen Table 4.1
Table 4.2: E
Stra
Likgathacohosemaco
Likaltthealmpaeleshhasw
PodeMto theanreto
/
Liksuweavassp
UnThis tha
Un
Luskin Centerlings: A South
s To EV Cha
opportunitieed on our obwere consol
Evaluation o
aightforward
Lev
kely access toarage, particulaat relies on ele
onfiguration areouse panel. If terve energy intachine, pool p
onvenient oppo
kely access tothough outletse parking envimost always canel. PEV driveectrical capac
hared loads. Inave assigned pwap spots for e
ossible accessetached garagUDs with detahave outlets.
ere is also a hn outlet. Whensidents may ngain access t
kely access toubterranean gae visited did havailable. In scessigned parkinpots for easier
nlikely access here may be aan outlet on that faces the dr
nlikely access
r for Innovatioh Bay Case S
arging in MU
es for installinservations frlidated into s
of Charging
Mode
vel 1 Chargi
o a 110/120-voarly with an auectricity. Outlee typically conthe outlet doestensive loads
pump), it may portunity for cha
o 110/120-volt s may be scattironment. The
connected to thers should conity of the pane
n scenarios whparking, a PEVeasier access
s to an outlet ine. Higher valu
ached parking With an autom
higher likelihoo parking is ass
need to swap po Level 1 char
o 110/120-volt arage and podave at least onenarios where g, a PEV driveaccess to the
to a 110/120-access in MUDhe outside wariveway.
to an electrica
on. 2016. OveStudy.
Ds – A Wes
ng Level 1 arom sample six in Table
g Potential A
rately Comp
ing
olt outlet in theutomatic door ets in this nnected to the s not already (e.g., laundry provide a arging.
outlets, tered across se outlets arehe house nsider el in light of here tenants V driver may to the outlet.
n each ue and newer are more likel
matic door, od of access tosigned, parking spots rging.
outlets. Everydium garage ne outlet tenants have
er may swap outlet.
-volt outlet. Ds where therell of the MUD
al outlet.
ercoming Barr
stside Cities
and 2 charginMUD sites i4.2, based o
Across Diffe
plex
e
Mptbtbcw
e
Mptbcms
ly
o
Mscalia
y WtLmcpapc
e U
U
riers to Electr
Case Study
ng EVSE in in the Southon overlappi
erent MUD
Very Compl
Lev
Many provide cpanel if the gahe unit, which
between the pahough the dist
be minimal, elecore the wiringwalls and/or th
Many have conpanel if the gahe unit, which
between the paconduit and wimounted alongsite.
Most are sepastructure and tconcrete or asand conduit froikely to requireas trenching
Wiring and conhrough buildin
Large subterramultiple levels coring throughpodium parkingan electrical boparking area, wcoring through
Unlikely acces
Unlikely acces
ric Vehicle Ch
y 41
different MUh Bay.27 The ing informati
Parking Lay
lex
vel 2 Charg
convenient acrage is below reduces the danel and parktance betweenectricians mayg and conduit the floor.
nvenient accerage is below reduces the danel and parkring can often
g the length of
rated from thethe house andphalt. Thus, ru
om the panel te a constructio
nduit may neeng material ananean garages
of parking an concrete decg garages areox on the samwhich may red the structure
ss to 110/120-v
ss to an electri
harging in Mul
1
UD eight ion.
yout
ging
ccess to the unor in front of
distance ing spot. Evenn the two mayy still need to through unit
ess to the unit or in front of
distance ing spot. The
n be surface-f the parking
e MUD d unit panels bunning wiring to the EVSE ison activity suc
ed to traverse d/or earth. s may have d require
cks. MUDs withe likely to have
me level as the duce the risk oor ground.
volt outlet.
cal outlet.
lti-
nit
n y
y
s h
h e
of

Overcom
CHAPPEV A
To achieto ensuremust havtrue for thEVSE insproperty residencestate ageentities”) barriers t
1. Design
2. Implem
3. Expan
4. Condu
These po
An examp
ming Barriers
PTER 5Adoptio
ve the Statee equitable dve the optionhe Westsidestallation cosowners shoe or propertyencies, air qu
can deploy to PEV adop
n incentives
ment PEV re
nd availability
uct outreach
olicy tools ar
ple of public cha
s To EV Cha
5: Policyon in M
e of Californidistribution on to charge te Cities subrsts at MUD sw a low to ny. To this enuality managthe followin
ption:
to reduce th
eady new co
y of public P
to drive PEV
re the focus
arging infrastru
arging in MU
y ToolsMUDs
a’s ambitiouof the ZEV btheir plug-in egion, whichsites are var
nonexistent mnd, regional, gement distrg policy tool
he cost of EV
nstruction co
PEV charging
V ownership
of this chap
ucture sited nea
Ds – A Wes
s to Ove
us zero-emisenefits, residelectric vehi
h has 253,87riable and ofmotivation tosubregional
ricts, and utis to overcom
VSE installat
odes.
g opportuniti
p and EVSE
ter.
ar a MUD (Pho
stside Cities
ercome
ssion vehicledents of muicles (PEVs)76 MUD unitften high. Mo
o invest in chl, and municlities (hereafme MUD-rela
tion.
ies for MUD
installation
oto credit: City o
Case Study
e Barrie
e (ZEV) adoplti-unit dwell) at home. Tts. As revieworeover, renharging infracipal governmfter “other adated EVSE
residents.
in MUDs.
of Torrance).
y 42
ers to
ption goals, ings (MUDs
This is particuwed in Chapnters and astructure at ments, as wdministrativeinstallation
2
and ) ularly
pter 4,
their ell as e

Overcoming Barriers To EV Charging in MUDs – A Westside Cities Case Study 43
5.1 Design Incentives to Reduce the Cost of EVSE Installation
Policymakers can design public financial incentives such as price subsidies, rebates, tax credits, sales tax exemptions, and subsidized financing to induce consumers to adopt PEV technology. The Clean Vehicle Rebate Program (CVRP) offers PEV buyers $1,500 for a plug-in electric hybrid vehicle (PHEV), or a $2,500 rebate for a battery electric vehicle (BEV) after purchase. Sixty-five percent of PEV drivers found the CVRP to be extremely or very important to their purchase decision.28 The state, local municipalities, and other administrative entities can also provide free or subsidized Level 2 chargers. Sixty percent of early PEV adopters found a rebate to be extremely or very important to their decision to install a Level 2 charger.29 Due to the variable and often high cost for installing EVSE at MUD sites, a specific installation rebate may be an effective policy tool to ease the cost barrier and expand PEV access.
To increase the cost effectiveness of rebates for EVSE installation, and to maximize the adoption of PEVs at MUDs, we recommend requiring multiple PEV drivers per single MUD to qualify. As reviewed in Chapter 4, the high variable costs for EVSE installations provide an opportunity to share costs across multiple residences.
To accommodate a range of incomes, administrative entities could offer tiered rebates based on consumer income levels. These types of progressive rebates have proven to be more cost-effective, have lower total policy costs, and result in greater allocative equity.30 We recommend designing rebate tiers so that they vary by household income or locational attributes such as MUDs within disadvantaged communities.
Rebates for Level 1 charging can also be an effective option. If drivers at MUDs have access to an outlet, the driver would only need to ensure that the outlet is connected to a panel with sufficient electrical capacity for Level 1 charging. For this level of charging, we recommend a program that partners with utilities and covers the cost for local electricians or electrical engineers to review the electrical capacity of the panel and to conduct an overall assessment of charging readiness. 31
5.2 Implement PEV-Ready New Construction Codes
Local jurisdictions can also set guidelines for remodels and new MUD construction that require developers to provide Level 1 or 2 charging readiness. Many new building code examples exist throughout California that can serve as models for the cities on the Westside. At a minimum, local jurisdictions must implement the 2016 California Green Building Standards, which in relation to PEVs in MUDs states, at least “3% of the total number of parking spaces provided for all types of parking facilities, but in no case less than one, shall be electric vehicle charging spaces (EV spaces) capable of supporting future EVSE.”32 Beyond that minimum, local 28 Center for Sustainable Energy. California Plug-in Electric Vehicle Driver Survey Results – May 2013. 29 Ibid. 30 Sheldon, Tamara L., J.R. DeShazo, Richard T. Carson, and Samuel Krumholz. 2016. Factors Affecting Plug-in Electric Vehicle Sales in California. Accessed August 2017 from http://innovation.luskin.ucla.edu/content/factors-affecting-plug-electric-vehicle-sales-california 31 A utility’s primary role can be to be responsive to annual peak load requests per site. 32 California Department of Housing and Community Development. 2016. “Residential Mandatory Measures Effective January 1, 2017.” Accessed October 2017 from http://www.hcd.ca.gov/building-standards/calgreen/docs/HCDSHL605_2016.pdf

Overcoming Barriers To EV Charging in MUDs – A Westside Cities Case Study 44
jurisdictions can require a greater number of PEV ready parking spaces. The city of Los Angeles, for example, has a Green Building Code (Chapter IX, Article 9, of the Los Angeles Municipal Code), which mandates newly constructed multi-family dwelling (larger than 2 units) to provide Level 2 ready outlets at 5 percent of the total number of parking spaces.33
Unfortunately, much of the residential land use in the Westside Cities subregion is already built out. If new construction codes were adopted by the cities in the subregion, it would take many years at current construction rates for a significant percentage of MUDs to be capable of providing PEV charging access. Thus, this policy tool should not be adopted in isolation of the other policy tools discussed in this chapter.
5.3 Expand Public Charging Opportunities for MUD Residents
Local governments can also provide alternative public charging sites in locations such as city-owned parking lots. Strategic siting of Level 2 or DC Fast Chargers near clusters of MUDs may provide an option for multi-unit dwellers who cannot charge at home. To ensure reliable access to a charger, local governments may need to also administer a charging program that coordinates charging sessions among potential users.
The City of Torrance, for example, launched the "One Mile, One Charger Project" with the goal of expanding PEV infrastructure throughout Torrance so that a PEV driver is never more than one mile from a charging station within the city.34 The city worked with ChargePoint to install, operate, and maintain publicly accessible PEV charging infrastructure at six public locations (e.g., parks, libraries, civic buildings, etc.). All sites included a minimum of two Level 2 charging units and one DC Fast Charging unit.
5.4 Conduct Outreach to Encourage PEV / EVSE Investments at MUDs
The PEV remains a relatively new technology. Substantial sales of BEVs started only in 2010, and most believe we are still in the very early stages of PEV adoption.35 As with many new technologies, consumers have been hesitant to switch out their internal combustion engine (ICE) for a PEV. Some of this hesitation can be rooted in the comfort level drivers have with the ICE and/or the uncertainty, real or perceived, of new technologies, like range anxiety – the fear of running out of battery power mid-trip. ICEs have been the dominant form of private transportation for over a century. Its refueling infrastructure is robust and easily accessible.
Outreach and education can help address this hesitation and introduce potential PEV drivers to the new technology by promoting its environmental and financial benefits as well as answering common questions and concerns. From an EVSE in MUD perspective, the goal with outreach and education is to drive demand for home charging among MUD residents, and shift the investment motivation from the renter to the property owner, who may be motivated to attract tenants by providing new amenities. With strong PEV adoption rates in the Westside Cities
33 City of Los Angeles. 2017. Official City of Los Angeles Municipal Code.
34 City of Torrance. “EV Project.” Accessed August 2017 from https://www.torranceca.gov/our-city/community-development/planning/ev-project
35 Sheldon, Tamara L., J.R. DeShazo, Richard T. Carson, and Samuel Krumholz. 2016. Factors Affecting Plug-in Electric Vehicle Sales in California. Accessed August 2017 from http://innovation.luskin.ucla.edu/content/factors-affecting-plug-electric-vehicle-sales-california

Overcoming Barriers To EV Charging in MUDs – A Westside Cities Case Study 45
subregion, as well as a large number of high-value MUDs (3,798 MUDs with an average unit value of $500,000 or greater), the subregion may help lead this shift in investment motivation.
Outreach and education can include direct-mail initiatives, advertising, workshops, and e-newsletters. Local governments and/or Southern California Edison should focus neighborhood-level outreach on MUDs, identified in Chapter 3, that are high-quality candidates because of their estimated latent PEV demand. Outreach and education materials should focus on a series of topics including:
New technology education, including available PEV models and associated lifespan, electric mile range, and maintenance requirements; purchase or lease costs and associated rebates; charging technologies such as Level 1 and Level 2 charging, including a tool for estimating charging times (with Level 1 highlighted as a feasible charging choice); and location of public chargers.
Environmental and financial benefits, including emissions avoided and fuel savings.
Charging in MUDs, including instruction on how to evaluate panel electrical capacity for Level 1 (20-amp circuit with available panel capacity), Level 2 charging (40-amp circuit with available panel capacity), and how to identify cost drivers for EVSE installation (as reviewed in Chapter 4).
o For Level 1 charging, instruction on how to verify available electrical capacity on the house or unit panel by reviewing shared loads such as laundry machines, pool pump, etc., as well as the annual peak load from the utility bill.
o For Level 2 charging, instruction on how to evaluate installation cost drivers including the distance from the electrical box or relevant electrical panel to the PEV parking spot, and insight into the cost advantages of group purchases for Level 2 charging installation including recommendations to survey other tenants’ interest in PEV ownership.
Renters’ rights, including information about California law SB 880 (Corbett), which makes it illegal to impose any condition that “effectively prohibits or unreasonably restricts” installation of charging equipment in an owner’s designated parking space, and California law AB 2565 (Muratsuchi), which requires a lessor of a dwelling to approve a request to install EVSE at a designated parking spot if the installation “complies with the lessor’s procedural approval process for modification of the property.”
Westside specific benefits, including the cost and time savings that come from access to high-occupancy vehicle (HOV) lanes, a benefit that has had a significant impact on PEV sales.36
Specialized and culturally sensitive outreach and education including Spanish-language materials and income-adjusted rebate information, such as with the Enhanced Fleet Modernization Program (EFMP) Plus-up Program (see below), for the disadvantaged communities of the South Bay.
36 Sheldon, Tamara L., J.R. DeShazo, Richard T. Carson, and Samuel Krumholz. 2016. Factors Affecting Plug-in Electric Vehicle Sales in California. Accessed August 2017 from http://innovation.luskin.ucla.edu/content/factors-affecting-plug-electric-vehicle-sales-california

Overcoming Barriers To EV Charging in MUDs – A Westside Cities Case Study 46
Increasing adoption among low- and moderate-income households within disadvantaged communities is a particular challenge but important to achieve the environmental equity goals of California. Low- and moderate-income households are less likely to purchase new vehicles (PEVs or otherwise) and many reside in MUDs without access to home charging.
To address this challenge, the California Air Resources Board (CARB) has launched a number of initiatives under its Low Carbon Transportation Program aimed at expanding PEV adoption among low- and moderate-income households. The EFMP Plus-Up program, for example provides low-income households up to $12,000 for the purchase or lease of a battery electric vehicle (BEV).37,38 In addition, individuals who purchase a BEV are eligible for up to $2,000 for a charging unit. To qualify, the household must reside in a zip code that includes a disadvantaged community census tract.
Additionally, Southern California Edison’s Charge Ready program — which aims to install up to 1,500 charging stations at parking sites where dwell times exceed four hours or at longer-term parking sites including MUDs — will target at least 10% of its deployment within disadvantaged communities.39
We recommend that city governments in the Westside Cities subregion, CARB, SCE, and the South Coast Air Quality Management District collaborate to optimize outreach effectiveness by conducting joint efforts within disadvantaged communities. Events such as “ride and drives” with representatives from both programs can showcase the PEV as well as the significant savings that can be realized when participating in both programs. Additional direct-mail campaigns and workshops can promote both programs and the potential savings (see Section 2.6 for locations of disadvantaged communities within the Westside Cities COG). Event staff and outreach materials should be conscious of language and cultural barriers and adjust accordingly.
37 Includes the $2,500 Clean Vehicle Rebate Program (CVRP) rebate.
38 California Air Resources Board. “Making the Cleanest Cars Affordable.” Accessed August 2017 from https://www.arb.ca.gov/newsrel/efmp_plus_up.pdf
39 Edison International. “Charge Ready: A Plan for California.” Accessed O 2017 from https://www.edison.com/home/innovation/electric-transportation/charge-ready-a-plan-for-california.html

Overcoming Barriers To EV Charging in MUDs – A Westside Cities Case Study 47
APPENDIX
Appendix 1. Propensity to Purchase Model Methodology
Researchers constructed the propensity to propensity-to-purchase model using statewide survey data from the Clean Vehicle Rebate Project (CVRP), census tract level PEV registration data from IHS Automotive, census tract level socioeconomic data from the 2011–2015 American Community Survey (ACS), and parcel level data from the Los Angeles County Office of the Assessor. The model was constructed according to these five steps:
i. First, researchers forecasted the number of PEV purchases per census tract based on historical PEV purchases within that census tract between October 2015 and September 2016. Here, researchers assume that as many PEVs that were sold during the sample period will also be sold during the next 12-months (i.e., October 2016 through September 2017). All else equal, the likelihood that a household will purchase a PEV increases with the total number of PEVs historically sold in that household’s census tract.
ii. Second, researchers computed the number of PEV purchases across different income groups for each census tract. That is, how many of the total PEV purchases will be made by households with annual incomes of less than $24,999, between $25,000 and $49,999 and so on. To accomplish this, researchers applied the distribution of CVRP rebates across household income brackets to the forecasted total number of PEV purchases within a census tract. Here, researchers assume that the income distribution of PEV buyers at the census tract level reflects that of CVRP recipients statewide. Researchers also assume that the historical relationship between income and PEV adoption will continue in the short run, such that the majority of PEV purchases will be made by households with incomes above the California median household income.
iii. Third, researchers calculated the probability that a household belonging to a given income group in a given census tract will purchase a PEV. This probability is simply the forecasted number of PEVs purchased by that income group (as derived in the previous step) divided by the number of households belonging to that that income group (as obtained from ACS data). This probability can also be understood as the PEV adoption rate for a particular income group. All else equal, the likelihood that a household will purchase a PEV increases with the PEV adoption rate associated with that household’s income group.
iv. Fourth, researchers calculated the probability distribution of a household living in a home of a given value belonging to the income groups from step 2. That is, the chance that the occupant of a home worth $500,000 will have an annual income that is less than $24,999, between $25,000 and $49,00, and so on. Researchers used tract-level ACS data on the relationship between home value and household income to complete this step. The operation is necessary because microdata on individual household income in the study area is not available. Researchers assume that the relationship between home values and income is transferable to condos and apartments. Researchers also assume that the historical relationship between home values and income will continue into the future, such that households with higher incomes will occupy higher value properties.

Overcoming Barriers To EV Charging in MUDs – A Westside Cities Case Study 48
v. Fifth, researchers estimated the probability that a household occupying a unit of a
given value in a given census tract will purchase a PEV in the next year. To do so, researchers joined the data from the two previous steps, multiplying the probability that a household will purchase a PEV given that household’s income by the probability that the same household will occupy a MUD unit given that unit’s value. Researchers then summed the resulting probabilities for each income group, yielding an expected value of the probability that any given occupant of that unit might purchase a PEV. In effect, the greater the value of a condo or apartment, the higher the likelihood that the occupant has an income above the median, and the higher the propensity-to-purchase score assigned to that unit.
After calculating propensity to-purchase scores for different property values, researchers then assigned the scores to specific MUD parcels within the study region using parcel data from the Los Angeles County Office of the Assessor. Propensity-to-purchase scores are assigned to an MUD parcel based on an MUD’s average unit value (i.e., total property value divided by number of units), rather than the MUD’s total property value.