fy13 annual briefing and the new mid-term … results briefing and the new midthe new mid--term...
TRANSCRIPT

FY2014/3 Results Briefing andFY2014/3 Results Briefing andthe New Midthe New Mid--Term Management PlanTerm Management Plan
May 12, 2014May 12, 2014
S iti d 6268S iti d 6268
yy
The forecast data presented herein reflects assumed results based on conditions that are subject to change.
Securities code: 6268Securities code: 6268
Nabtesco Corporation does not make representations as to, or warrant, in whole or in part, the attainment or realization of any of the forecasted results presented in this document.
AgendaAgenda
I. I. Annual Consolidated Results for 2014/3Annual Consolidated Results for 2014/3
II. Review of the Previous II. Review of the Previous MidMid Term Management PlanTerm Management Plan (2012/3~2014/3)(2012/3~2014/3)MidMid--Term Management Plan Term Management Plan (2012/3~2014/3)(2012/3~2014/3)
III. The New MidIII. The New Mid--Term Management PlanTerm Management Plan(2015/3~2017/3)(2015/3~2017/3)
2
AgendaAgenda
I. I. Annual Consolidated Results for 2014/3Annual Consolidated Results for 2014/3
II. Review of the Previous II. Review of the Previous MidMid Term Management PlanTerm Management Plan (2012/3~2014/3)(2012/3~2014/3)MidMid--Term Management Plan Term Management Plan (2012/3~2014/3)(2012/3~2014/3)
III. The New MidIII. The New Mid--Term Management PlanTerm Management Plan(2015/3~2017/3)(2015/3~2017/3)
3
Sales and profits increased compared to the previous fiscal year and theSales and profits increased compared to the previous fiscal year and the
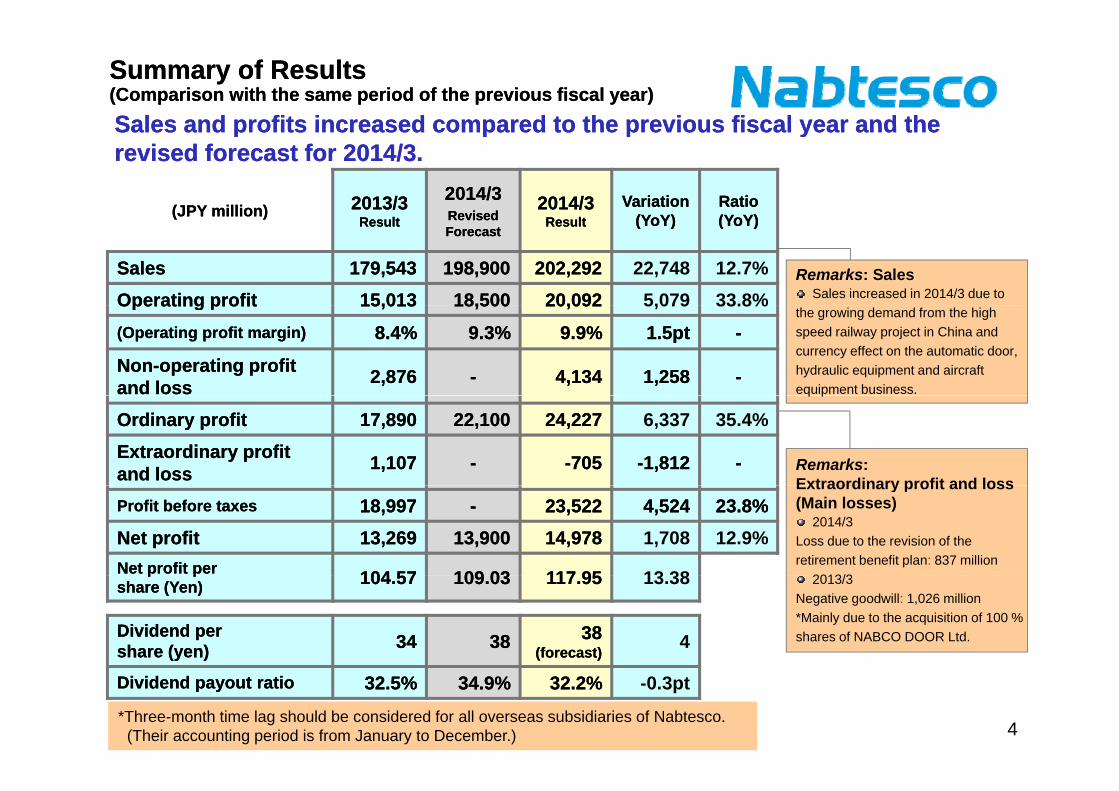
Summary of ResultsSummary of Results(Comparison with the same period of the previous fiscal year)(Comparison with the same period of the previous fiscal year)Sales and profits increased compared to the previous fiscal year and the Sales and profits increased compared to the previous fiscal year and the revised forecast for 2014/3.revised forecast for 2014/3.
(JPY million)(JPY million) 2013/32013/3 2014/32014/3RevisedRevised
2014/32014/3 VariationVariation((Y YY Y))
RatioRatio((Y YY Y))(JPY million)(JPY million)
ResultResult Revised Revised ForecastForecast
ResultResult ((YoYYoY)) ((YoYYoY))
SalesSales 179,543179,543 198,900198,900 202,292202,292 22,748 12.7%Operating profitOperating profit 15,01315,013 18,50018,500 20,09220,092 5,079 33.8%
Remarks: SalesSales increased in 2014/3 due to Operating profitOperating profit 15,01315,013 18,50018,500 20,09220,092 5,079 33.8%
(Operating profit margin)(Operating profit margin) 8.4%8.4% 9.3%9.3% 9.9%9.9% 1.5pt1.5pt --
NonNon--operating profit operating profit and lossand loss 2,8762,876 -- 4,1344,134 1,2581,258 --
the growing demand from the high speed railway project in China and currency effect on the automatic door, hydraulic equipment and aircraft equipment business.
Ordinary profitOrdinary profit 17,89017,890 22,10022,100 24,22724,227 6,337 35.4%Extraordinary profit Extraordinary profit and lossand loss 1,1071,107 -- --705705 --1,8121,812 --
q p
Remarks:Extraordinary profit and loss
Profit before taxesProfit before taxes 18,99718,997 -- 23,52223,522 4,5244,524 23.8%23.8%Net profitNet profit 13,26913,269 13,90013,900 14,97814,978 1,708 12.9%Net profit per Net profit per 104 57104 57 109 03109 03 117 95117 95 13 38
Extraordinary profit and loss(Main losses)
2014/3Loss due to the revision of the retirement benefit plan: 837 million
2013/3p pp p
share (Yen)share (Yen) 104.57104.57 109.03109.03 117.95117.95 13.38
Dividend per Dividend per share (yen)share (yen) 3434 3838 3838
(forecast)(forecast) 4
2013/3Negative goodwill: 1,026 million*Mainly due to the acquisition of 100 % shares of NABCO DOOR Ltd.
Dividend payout ratioDividend payout ratio 32.5%32.5% 34.9%34.9% 32.2%32.2% -0.3pt
*Three-month time lag should be considered for all overseas subsidiaries of Nabtesco.(Their accounting period is from January to December.)
*Three-month time lag should be considered for all overseas subsidiaries of Nabtesco.(Their accounting period is from January to December.) 4

Profit & Loss Result for FY2014/3 Profit & Loss Result for FY2014/3 (Analysis of Changes in Operating Profit)(Analysis of Changes in Operating Profit)
Remarks:Increase in R&D expensesIncrease in SG&A expenses for further growth(headquarters‘ training cost and increase in overseas subsidiaries’ SG&A)
(JPY billion)(JPY billion)
2 2 0 3
30
Cost reduction
Increase in costdue to the
depreciation of yen(within Japan)
Decrease in D&A
Increase in SG&A
expenses, etc***
)
Increase of sales *
Productivity improvement,
etc
15.0
20.01.23.8
2.2 0.3
-2.40.1
-0.220
of sales *
10FOREX effect **
0
FOREX effect 2013/3 (result) US$1=¥80.12 RMB1=¥12.70 EUR1=¥103.46 CHF1=¥85.902014/3 (result) US$1= ¥97.99 RMB1=¥15.87 EUR1=¥130.56 CHF1=¥106.15
2014/32013/3 result
2014/3result
*Fluctuations in operating profit owing to the increase or decrease of sales are based on the calculation without FOREX effect.
** FOREX sensitivity in O. P. (US$):JPY 99 million, (RMB): JPY 60 million, (EUR): minimal, (CHF): minimal
(This represents the effect to be expected on operating profit if the exchange rate fluctuates by one yen.)
*** Fluctuations in operating profit owing to the increase or decrease in SG&A expenses are based on the calculation without FOREX effect.
5

Precision EquipmentPrecision Equipment
(JPY million)(JPY million) 2013/32013/3ResultResult
2014/32014/3Revised Revised ForecastForecast
2014/32014/3ResultResult
VariationVariation((YoYYoY))
RatioRatio((YoYYoY))
Results for 2014/3
Rapid prototyping machines
ForecastForecast
SalesSales 41,57841,578 43,30043,300 42,85342,853 1,2751,275 3.1%3.1%Operating profitOperating profit 5,3545,354 6,3006,300 6,3596,359 1,0041,004 18.8%18.8%
Vacuum equipment
Main Products and Customers
Operating profit Operating profit marginmargin 12.9%12.9% 14.6%14.6% 14.8%14.8%
Vacuum equipment
・Precision reduction gearsIndustrial Robots: Fanuc, Yaskawa Electric, KUKA Roboter (Germany), ABB Robotics (Sweden) Machine Tools: Yamazaki Mazak, Okuma, DMG Mori Seiki
・New energy businessgyDrive Units for Wind Turbines: MHI, etc.
Notes:
Precision reduction gears
Drive units for wind turbines Solar tracking equipment
Notes:
Precision reduction gears: Sales of precision reduction gears decreased only slightly in 2014/3 due to the recovery of demand for industrial robots, despite zero sales of solar tracking equipment, which had been posted in 2013/3.
New energy business: Sales of drive units for wind turbines increased largely year-on-year. No sales for solar tracking equipment for 2014/3.
O.P. of the segment: Increased in 2014/3 due to enhancement of productivity and reduction of indirect cost.
6

Transport EquipmentTransport Equipment
(JPY million)(JPY million) 2013/32013/3ResultResult
2014/32014/3Revised Revised ForecastForecast
2014/32014/3ResultResult
VariationVariation((YoYYoY))
RatioRatio((YoYYoY))
Results for 2014/3
ForecastForecast
SalesSales 44,26244,262 49,80049,800 52,64152,641 8,3788,378 18.9%18.9%Operating profitOperating profit 4,2144,214 5,2005,200 6,3446,344 2,1292,129 50.5%50.5%
Main Products and Customers・Railroad vehicle equipment (brake systems door operating units)
Railroad vehicle equipment C i l hi l i t
Operating profit Operating profit marginmargin 9.5%9.5% 10.4%10.4% 12.1%12.1%
Railroad vehicle equipment (brake systems, door operating units)JR companies, Private railway companies, KHI, Bullet train and subway projects in China, etc.
・Commercial vehicle equipment (air brake peripheral equipment)Hino, Mitsubishi Fuso Truck & Bus, Hino, Isuzu, UD Trucks
M i l i t ( t t l t f i
equipment Commercial vehicle equipment
・Marine vessels equipment (remote control systems for marine diesel engines)
KHI, Mitsui Engineering & Shipbuilding, Hitachi Zosen, MHI, Diesel United, Hyundai Heavy Industries (Korea), MAN Diesel (Denmark) Marine vessels equipment
Notes:
Railroad vehicle equipment: Sales increased in 2014/3 due to the growth of sales for high speed trains in China and increasing demand for repair parts in Japan.
Commercial vehicle equipment: Sales increased in 2014/3 due to strong demand for trucks in Japan.Commercial vehicle equipment: Sales increased in 2014/3 due to strong demand for trucks in Japan.
Marine vessels equipment: Sales increased in 2014/3 thanks to the recovery of new ship-building orders.
O.P. of the segment: Increased in 2014/3 as a result of growth of sales in each of the businesses. 7

Aircraft & Hydraulic EquipmentAircraft & Hydraulic Equipment
(JPY million)(JPY million) 2013/32013/3ResultResult
2014/32014/3Revised Revised ForecastForecast
2014/32014/3ResultResult
VariationVariation((YoYYoY))
RatioRatio((YoYYoY))
Results for 2014/3
ForecastForecast
SalesSales 45,74645,746 52,40052,400 52,53352,533 6,7866,786 14.8%14.8%Operating profitOperating profit 1,8361,836 3,1003,100 3,8623,862 2,0262,026 110.3%110.3%
Main Products and Customers・Hydraulic equipment
Hydraulic equipment
Operating profit Operating profit marginmargin 4.0%4.0% 5.9%5.9% 7.4%7.4%
Hydraulic equipmentTraveling motors:Japan: Komatsu, Kobelco Construction Machinery, Kubota,
Sumitomo Construction Machinery ManufacturingChina: Sany, Xugong Excavator, Liu Gong, Zoomlion
・Aircraft equipmentFlight control actuation systems: Boeing, KHI, MHI, IHI, Japanese Ministry of Defense, Airlines
Aircraft equipment
Notes:
Hydraulic equipment: Sales increased in 2014/3 due to the last-minute demand associated with the emission gas regulations within Japan, moderate recovery of demand due to a decrease in the inventory of construction machines in China and currency effect.
Aircraft equipment: Sales increased in 2014/3 due to expansion of demand in the private sector and currency effect.
O.P. of the segment: Increased in 2014/3 mainly due to growth of sales for hydraulic equipment.8

Industrial EquipmentIndustrial Equipment
(JPY million)(JPY million) 2013/32013/3ResultResult
2014/32014/3Revised Revised ForecastForecast
2014/32014/3ResultResult
VariationVariation((YoYYoY))
RatioRatio((YoYYoY))
Packaging machines
Results for 2014/3
ForecastForecast
SalesSales 47,95647,956 53,40053,400 54,26454,264 6,3086,308 13.2%13.2%Operating profitOperating profit 3,6083,608 3,9003,900 3,5263,526 --8282 --2.3%2.3%
machines
Main Products and Customers・Automatic doors
Operating profit Operating profit marginmargin 7.5%7.5% 7.3%7.3% 6.5%6.5%
・Automatic doorsAutomatic doors for buildings: Major general contractors, sash manufacturers,
hospitals, banks, public institutions, etc.Platform doors: Subway projects in France, China etc
・Packaging machines (Toyo Jidoki Co Ltd )
Special purpose machine tools
Packaging machines (Toyo Jidoki Co., Ltd.)Ajinomoto, NIPPON MEAT PACKERS, ARIAKE JAPAN, KENKO Mayonnaise,
P&G, Kao, Lion, Mars (France), American Beverage Corporation (USA), food companies in China
Automatic Doors
Notes:
Automatic doors: Sales increased in 2014/3 due to steady increase in domestic and overseas automatic door markets as well as currency effect.
Packaging machines: Sales decreased in 2014/3 due to the disappearance of the special demand from the sugar industry seen in 2013/3 and a decrease in sales in the overseas market.industry seen in 2013/3 and a decrease in sales in the overseas market.
O.P. of the segment : Although automatic door sales in domestic and overseas markets stayed firm, profit decreased in 2014/3 due to the posting of retirement benefit cost in response to accounting principles change in overseas, increase of goodwill affected by FOREX and sales decrease for packaging machines. 9

Balance Sheet Summary
(JPY million)(JPY million) 2013/32013/3ResultResult
2014/32014/3ResultResult VariationVariation
AssetsAssets 203,056203,056 233,984233,984 30,92830,928,, ,, ,,((Cash and time depositsCash and time deposits)) 40,903 53,725 12,822
((Accounts receivableAccounts receivable)) 45,13145,131 52,840 7,708R i bl t i d
Remark:Trade notes and accounts payable
+7.2 billion yenIncome taxes payable
Receivable turnover period (in days) 94 88 6
((InventoryInventory)) 20,52920,529 22,233 1,704Inventory turnover period 55 53 2
p y+2.6 billion yen
Inventory turnover period(in days) 55 53 2
((Fixed assetsFixed assets)) 54,47554,475 55,225 749
LiabilitiesLiabilities 82,19882,198 94 51394 513 12 31412 314Remark:
Earned surplus+10.6 billion yen
Translation adjustments
LiabilitiesLiabilities 82,19882,198 94,51394,513 12,31412,314((InterestInterest--bearing debtbearing debt)) 26,38926,389 26,204 -184
Net assetsNet assets 120,857120,857 139,471139,471 18,61318,613+ 8.4 billion yen
Treasury stock- 2.2 billion yen
(Stock acquisition right)(Stock acquisition right) 304304 306 1((Minority interestsMinority interests)) 6,5146,514 8,121 1,606Equity capitalEquity capital 114,038114,038 131,043131,043 17,00417,004Equity capitalEquity capital 114,038114,038 131,043131,043 17,00417,004
※ ※ Equity ratio :Equity ratio : 56.2% 56.0%56.0%10

CAPEX, R&D , Depreciation, FCFCAPEX, R&D , Depreciation, FCF
( )( )(JPY million)(JPY million) 2013/3 result2013/3 result 2014/3 result2014/3 result
CAPEXCAPEX 10 19010 190 6 7606 760CAPEXCAPEX 10,19010,190 6,7606,760
R&DR&D 5 5355 535 6 4016 401R&DR&D 5,5355,535 6,4016,401
DepreciationDepreciation 7,9237,923 7,6007,600pp ,, ,,
FCFFCF --741741 19,53319,533
11
AgendaAgenda
I. I. Annual Consolidated Results for 2014/3Annual Consolidated Results for 2014/3
II. Review of the Previous II. Review of the Previous MidMid Term Management PlanTerm Management Plan (2012/3~2014/3)(2012/3~2014/3)MidMid--Term Management Plan Term Management Plan (2012/3~2014/3)(2012/3~2014/3)
III. The New MidIII. The New Mid--Term Management PlanTerm Management Plan(2015/3~2017/3)(2015/3~2017/3)
12

Attainment of Targeted Financial FiguresAttainment of Targeted Financial Figures
2011/32011/3 2014/32014/3 2014/32014/32011/32011/3ResultResult
2014/32014/3Previous midPrevious mid--tem plantem plan
2014/32014/3ResultResult
SalesSales 169.3169.3 240240 202.2202.2
(JPY billion)
169.3169.3 240240 202.2202.2Operating profitOperating profit 20.220.2 31.331.3 2020O P marginO P margin 11 9%11 9% 13%13% 9 9%9 9%O. P. marginO. P. margin 11.9%11.9% 13%13% 9.9%9.9%Net ProfitNet Profit 13.313.3 20.320.3 14.914.9ROAROA 8.1%8.1% 9.5%9.5% 6.9%6.9%
ROEROE 15.8%15.8% 17.0%17.0% 12.2%12.2%
Payout ratioPayout ratio 23.6%23.6% 30%30% 32.2%32.2%
13

Attainment in 2014/3 (Previous midAttainment in 2014/3 (Previous mid--term plan) term plan) by Business Segmentby Business Segment
(JPY million)
SegmentSegment TermTerm The previous mid-term plan Result Attainment Comment
SalesSales 53,000 42,853 81%Precision reduction gears:
Affected by no growth for industrialPrecisionPrecision
Sa esSa es 53,000 ,853 8 % Affected by no growth for industrial robots and delayed solar power projectO. P.O. P. 10,900 6,359 58%
SalesSales 60 000 52 641 88% Railroad vehicle equipment:
TransportTransportSalesSales 60,000 52,641 88% q p
Sluggish due to order suppression by accident and difficulty in winning orders from the China subway project
O. P.O. P. 7,800 6,344 81%
Aircraft & Aircraft & HydraulicHydraulic
SalesSales 77,000 52,533 68%Hydraulic equipment: Affected
by the decrease in demand from Chinese construction machinery manufacturers
Aircraft equipment: ExceededAircraft equipment: Exceeded the plan due to the currency effectO. P.O. P. 8,100 3,862 48%
SalesSales 50 000 54 264 109%Automatic doors:
Currency effect , but was also
IndustrialIndustrialSalesSales 50,000 54,264 109% affected by overseas accounting
system change resulting in temporary loss, restructuring cost of overseas bases and increase in goodwill after conversion into yen.
O. P.O. P. 4,500 3,526 78%goodwill after conversion into yen.
14

AgendaAgenda
I. I. Annual Consolidated Results for 2014/3Annual Consolidated Results for 2014/3
II. Review of the Previous II. Review of the Previous MidMid Term Management PlanTerm Management Plan (2012/3~2014/3)(2012/3~2014/3)MidMid--Term Management Plan Term Management Plan (2012/3~2014/3)(2012/3~2014/3)
III. The New MidIII. The New Mid--Term Management PlanTerm Management Plan(2015/3~2017/3)(2015/3~2017/3)
15
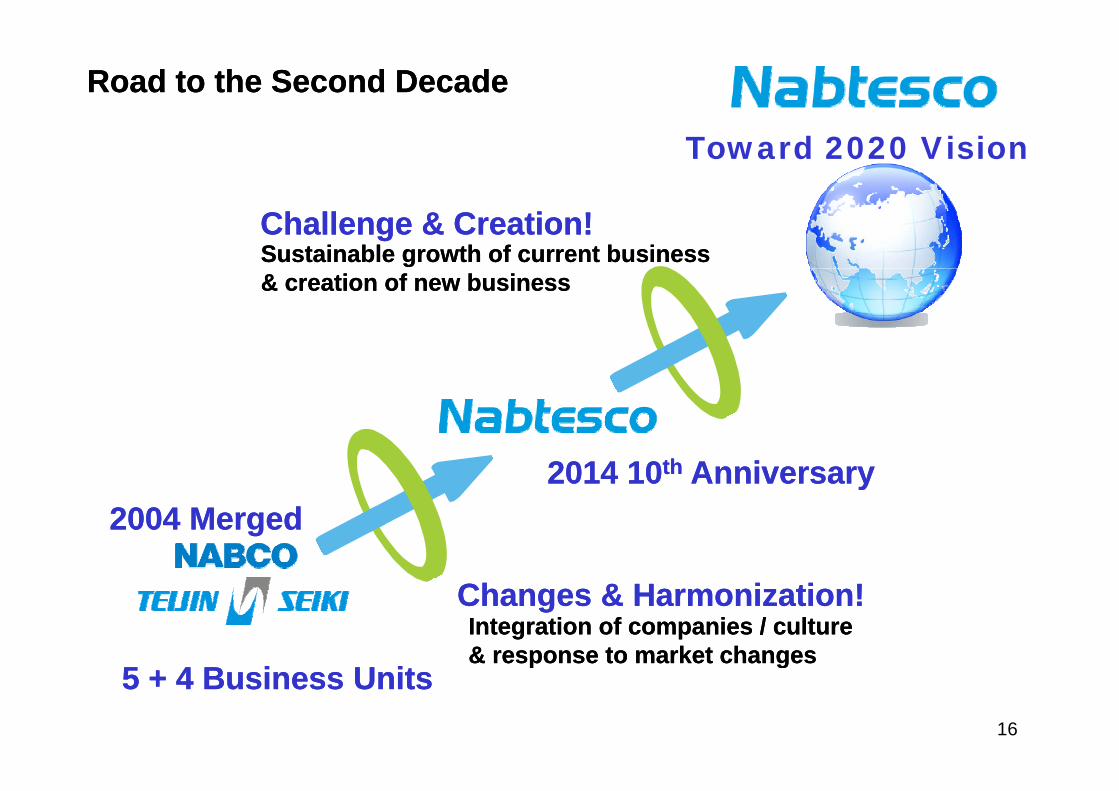
Road to the Second DecadeRoad to the Second Decade
Ch ll & C ti !Ch ll & C ti !
Toward 2020 Vision
Challenge & Creation!Challenge & Creation!Sustainable growth of current businessSustainable growth of current business& creation of new business& creation of new business
2014 102014 10thth AnniversaryAnniversary2004 Merged2004 Merged
yy
Changes & Harmonization!Changes & Harmonization!Integration of companies / cultureIntegration of companies / culture& response to market changes& response to market changes
5 + 4 Business Units5 + 4 Business Unitsp gp g
16

Targeted Financial FiguresTargeted Financial FiguresTargeted EPS: ¥190 by 2017/3Targeted EPS: ¥190 by 2017/3
2014/32014/3ActualActual
2015/32015/3PlanPlan
2017/32017/3PlanPlan
2021/32021/3LongLong--term visionterm visionannouncedannounced in May 2012in May 2012(JPY billion)
Targeted EPS: ¥190 by 2017/3Targeted EPS: ¥190 by 2017/3
announced announced in May 2012in May 2012
SalesSales 202.2 216 280±5% 400
Operating profitOperating profit 20 21.6 34 60
( )
O.P. marginO.P. margin 9.9% 10.0% 12.0% 15.0%
Net profitNet profit 14.9 15.5 24 -pp
ROAROA 6.9% 6.5% 7.5% 11.0%
ROEROE 12.2% 11.5% 15.0% 18.0%5 5 0 8 0
Payout ratioPayout ratio 32.2% 32.8% 30% being maintained
Basic policy of the new mid-term management plan from 2015/3 to 2017/3p y g p
1. Further expansion of the business scale and pursuance of profitability
2. Promoting management with the conscious of asset and capital efficiency
3. Distribution of business earnings with the conscious of corporate growth 17

Profit & Loss Forecast for 2015/3Profit & Loss Forecast for 2015/3(Analysis of Changes in Operating Profit)(Analysis of Changes in Operating Profit)
(JPY billion)(JPY billion)
Remark:Increase of advertising expenseIncrease of R&D costPromoting the IT infrastructureIncrease of oversea subsidiaries cost
21 60.44.3 0.1 0.9
30Increase in sales*
Decrease in D&A
Increase in SG&A expenses, etc
Increase of oversea subsidiaries costProductivity improvement, etc
20.021.6
-4.120
10FOREX ff t **
0
FOREX effect **2014/3(result) US$1=¥97.99 RMB1=¥15.87 EUR1=130.56 CHF1=106.152015/3(premise) US$1=¥100 RMB1=¥16.40 EUR1=130.00 CHF1=107.00
2014/3result
2015/3plan
* Fluctuations in operating profit owing to the increase or decrease of sales are based on the calculation without FOREX effect
** FOREX sensitivity in O. P. (US$):JPY 107 million, (RMB): JPY 69 million, (EUR): minimal, (CHF): minimal(This represents the effect to be expected on operating profit if the exchange rate fluctuates by one yen.)
without FOREX effect.
18
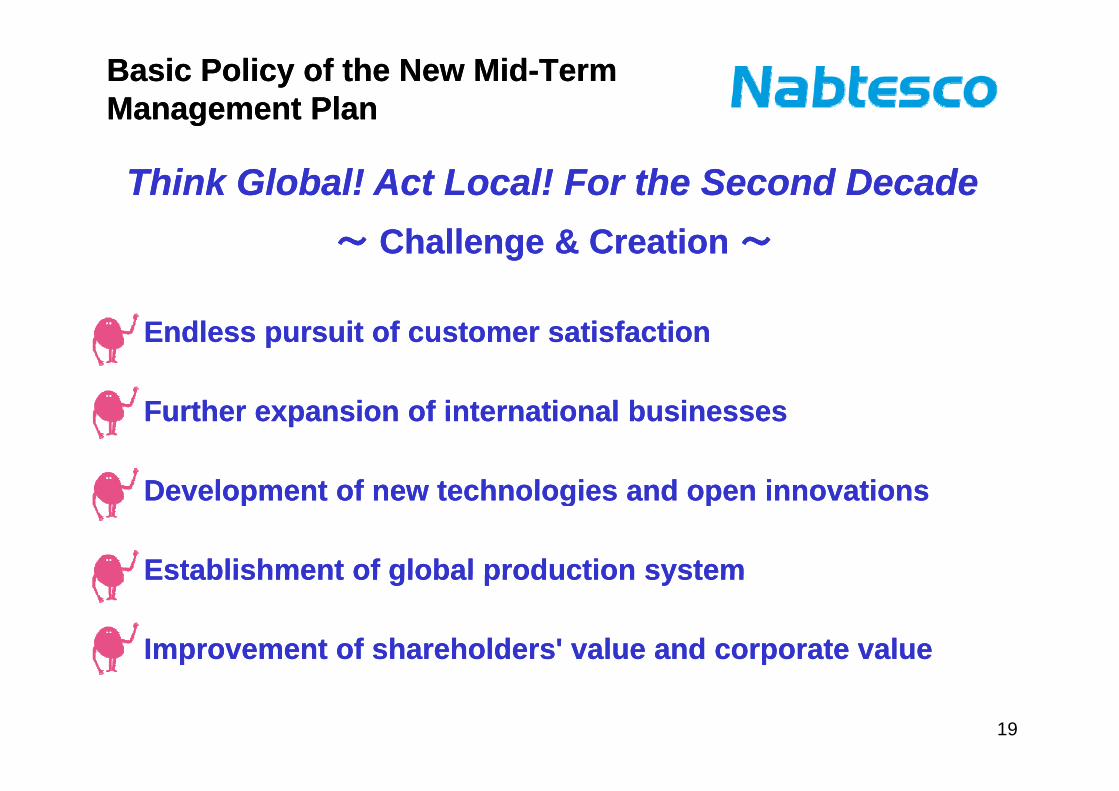
Basic Policy of the New MidBasic Policy of the New Mid--Term Term Management PlanManagement Plan
Think Global! Act Local! For the Second DecadeThink Global! Act Local! For the Second Decade~~ Challenge & Creation Challenge & Creation ~~
Endless pursuit of customer satisfactionEndless pursuit of customer satisfaction
Further expansion of international businessesFurther expansion of international businesses
Development of new technologies and open innovationsDevelopment of new technologies and open innovationsDevelopment of new technologies and open innovationsDevelopment of new technologies and open innovations
Establishment of global production systemEstablishment of global production systemEstablishment of global production systemEstablishment of global production system
Improvement of shareholders' value and corporate valueImprovement of shareholders' value and corporate value
19

Strategy on a CompanyStrategy on a Company--Wide Basis:Wide Basis:Pursuing Business Expansion with ProfitPursuing Business Expansion with Profit
Endless pursuit of customer satisfaction
M k C iM k C i Further expansion of international businesses
Market CreationMarket Creation
・M&AFinancial StrategyFinancial Strategy
・M&A
Improvement of
Technology InnovationTechnology Innovation
Improvement of shareholders' valueImprovement of corporate value
Development of new technologies and open innovations
Technology InnovationTechnology Innovationcorporate value
Establishment of global production system
20
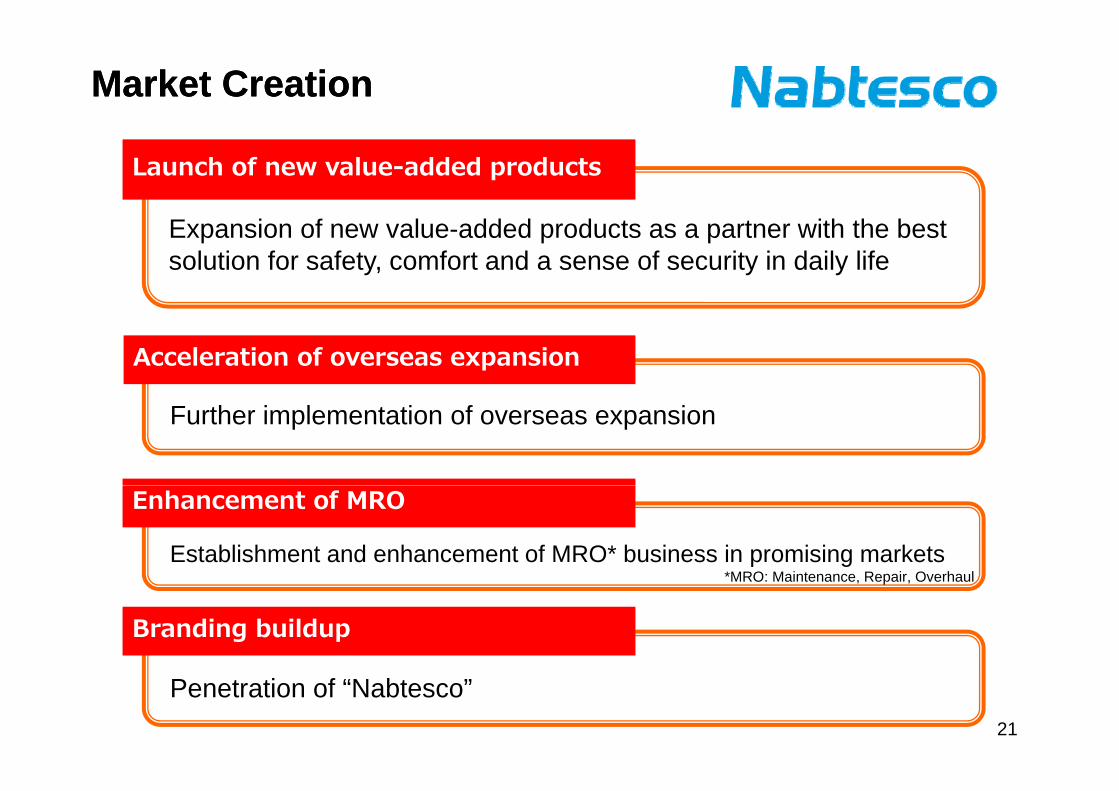
Market CreationMarket Creation
Launch of new value-added products
Expansion of new value-added products as a partner with the best solution for safety, comfort and a sense of security in daily life
Acceleration of overseas expansion
Further implementation of overseas expansion
Enhancement of MRO
Establishment and enhancement of MRO* business in promising markets *MRO: Maintenance Repair Overhaul
Branding buildup
*MRO: Maintenance, Repair, Overhaul
Penetration of “Nabtesco”21

Technology InnovationTechnology Innovation
Implementation of technological development
P i i l R&D d ll b i i d dilPromoting internal R&D and collaboration in order to speedily offer products which meet the diversified needs
Acceleration of global production system
Evolution of ‘local production for local consumption’ through establishment of the global production system
Transform domestic production bases into mother factories
Modernization of domestic production bases
22

Financial StrategyFinancial StrategyPursuit of assets efficiency
Promoting management with conscious of the assets and capital efficiency (ROA, ROE) Creation of consistent cash
Utilization of financial leverage
Debt financing (bank loans + straight bond)Sustaining credit rating A *
*Rating by JCRA
Improvement of shareholder return
g y
Maintaining dividend payout ratio at 30%, stable dividend policyNo dividend cut as long as the payout ratio does not exceed 40%No dividend cut as long as the payout ratio does not exceed 40%
23

Precision Equipment
(JPY million)(JPY million)
2014/3 2015/3 2017/3
H1H1 H2H2 FullFull yearyear H1H1 H2H2 FullFull yearyear FullFull yearyear
Results for 2014/3 and plan
( )( ) H1H1resultresult
H2H2resultresult
FullFull--yearyearresultresult
H1H1planplan
H2H2planplan
FullFull--yearyearplanplan
FullFull--yearyearplanplan
SalesSales(year(year--onon--year)year)
19,51319,513((--3.9%)3.9%)
23,33923,339(+9.8%)(+9.8%)
42,85342,853(+3.1%)(+3.1%)
22,70022,700(+16.3%)(+16.3%)
23,10023,100((--1.0%)1.0%)
45,80045,800(+6.9%)(+6.9%) 66,00066,000(( )) ( )( ) ( )( ) ( )( ) (( )) ( )( )
Operating profitOperating profit(year(year--onon--year)year)
2,6652,665(+24.2%)(+24.2%)
3,6943,694(+15.1%)(+15.1%)
6,3596,359(+18.8%)(+18.8%)
3,1003,100(+16.3%)(+16.3%)
3,7003,700(+0.2%)(+0.2%)
6,8006,800(+6.9%)(+6.9%) 11,20011,200
Operating profit Operating profit 13 7%13 7% 15 8%15 8% 14 8%14 8% 13 7%13 7% 16 0%16 0% 14 8%14 8% 17 0%17 0%
Precision Reduction Gears
Others
marginmargin 13.7%13.7% 15.8%15.8% 14.8%14.8% 13.7%13.7% 16.0%16.0% 14.8%14.8% 17.0%17.0%
Sales(JPY billion)Sales(JPY billion)
54.0 * Due to the establishment
12.0 17.8 21.1
38.9
20.3 20.4
40.8
Due to the establishment of the New Energy Business Development Division in April 2013,the sales of drive units for wind turbine generators were transferred from the
1.6 2.1 3.8 2.3 2.6 4.9
H1 result
H2 result
Full-yearresult
H1plan
H2plan
Full-yearplan
Full-yearplan
2014/3 2015/3 2017/3
Aircraft & Hydraulic Segment to the Precision Equipment Segment from 2014/3.
24

Precision Equipment: Mid-Term Strategies for Precision Reduction Gears
unit Japan Europe North America Korea China APAC Other 6000
Forecast for Sales of Chinese Local Robot ManufacturersunitWorldwide Annual Shipment of Industrial Robots
200,000
250,000
4000
5000
CAGR 6% CAGR 50%
100,000
150,000
2000
3000
0
50,000
2008 2009 2010 2011 2012 2013 2014 2015 20160
1000
2010 2011 2012 2013 2014 2015 2016Source: IFR Source: CRIA
Main StrategiesMain StrategiesAssured penetration into the Chinese local robot manufacturers throughAssured penetration into the Chinese local robot manufacturers through cooperation with the local joint venture
Amplification of product lineup in general industries
Maintain the market share of the joints of industrial robots with absolute confidence from customers
25
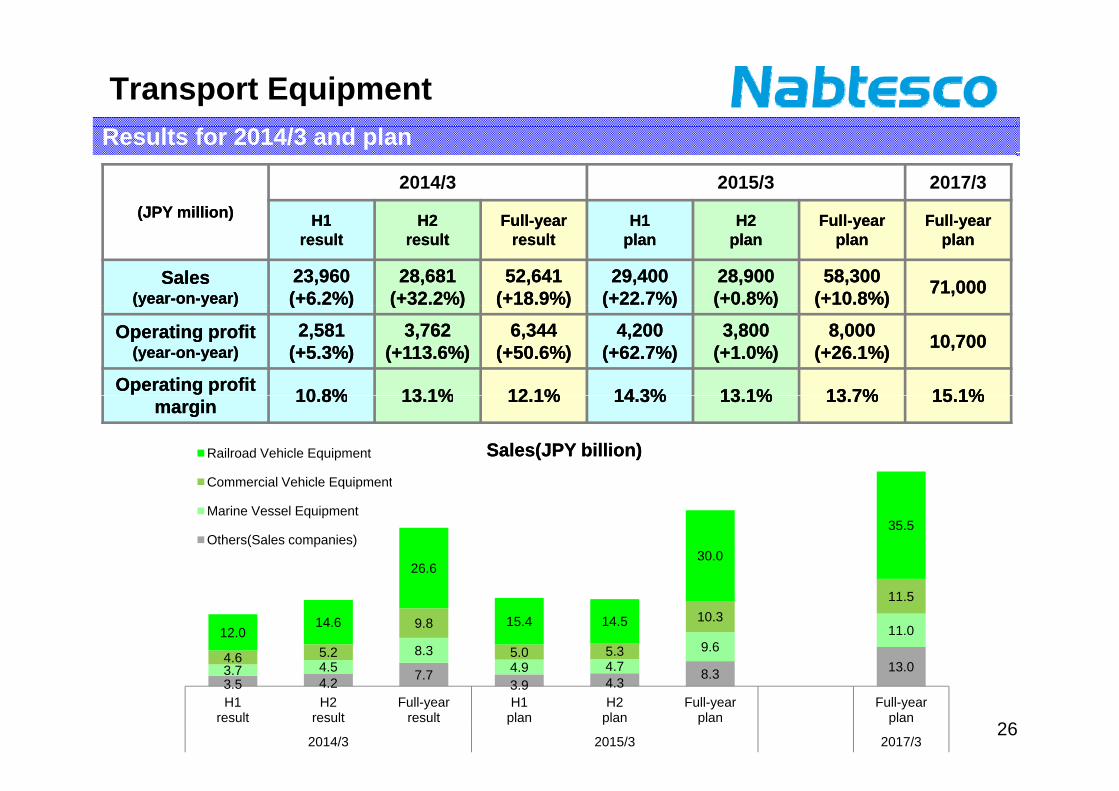
Transport EquipmentResults for 2014/3 and plan
(JPY million)(JPY million)
2014/3 2015/3 2017/3
H1H1 H2H2 F llF ll H1H1 H2H2 F llF ll F llF ll(JPY million)(JPY million) H1H1resultresult
H2H2resultresult
FullFull--yearyearresultresult
H1H1planplan
H2H2planplan
FullFull--yearyearplanplan
FullFull--yearyearplanplan
SalesSales(year(year--onon--year)year)
23,96023,960(+6.2%)(+6.2%)
28,68128,681(+32.2%)(+32.2%)
52,64152,641(+18.9%)(+18.9%)
29,40029,400(+22.7%)(+22.7%)
28,90028,900(+0.8%)(+0.8%)
58,30058,300(+10.8%)(+10.8%) 71,00071,000(y(y y )y ) ( )( ) ( )( ) ( )( ) ( )( ) ( )( ) ( )( )
Operating profitOperating profit(year(year--onon--year)year)
2,5812,581(+5.3%)(+5.3%)
3,7623,762(+113.6%)(+113.6%)
6,3446,344(+50.6%)(+50.6%)
4,2004,200(+62.7%)(+62.7%)
3,8003,800(+1.0%)(+1.0%)
8,0008,000(+26.1%)(+26.1%) 10,70010,700
Operating profit Operating profit 10 8%10 8% 13 1%13 1% 12 1%12 1% 14 3%14 3% 13 1%13 1% 13 7%13 7% 15 1%15 1%
Railroad Vehicle Equipment
Commercial Vehicle Equipment
marginmargin 10.8%10.8% 13.1%13.1% 12.1%12.1% 14.3%14.3% 13.1%13.1% 13.7%13.7% 15.1%15.1%
Sales(JPY billion)Sales(JPY billion)
26.6 30.0
35.5
Commercial Vehicle Equipment
Marine Vessel Equipment
Others(Sales companies)
13 04 58.3
4 9 4 79.6
11.0
4.6 5.2
9.8
5.0 5.3
10.3 11.5
12.0 14.6 15.4 14.5
3.5 4.2 7.7 3.9 4.3
8.3 13.03.7 4.5 4.9 4.7
H1 result
H2 result
Full-yearresult
H1plan
H2plan
Full-yearplan
Full-yearplan
2014/3 2015/3 2017/326

Transport Equipment: Mid-Term Strategies for Railroad Vehicle Equipment
7,000
8,000
(Car)
2011 2016
Comparison of New Car Demand by Region
3 000
4,000
5,000
6,000
Penetration into European Market
0
1,000
2,000
3,000
Chi W t E J N th E t E O i L ti Af i Middl CISChina West Europe Japan North America
East Europe Oceania Latin America
Africa-Middle East
CIS
Nabtesco Estimates
Main StrategiesMain StrategiesExpansion of sales and release of new products in Chinese and European marketsExpansion of sales and release of new products in Chinese and European markets
Appropriate development, procurement and production in Japan, China and Europe
Enhancement of MRO business (installation of the full-time sales people)
27

Transport Equipment: Mid-Term Strategies for Commercial Vehicle Equipment
Japan’s 4mt+ truck sales1,000 vehicles
Nabtesco Estimates
Main StrategiesMain StrategiesggExpansion of overseas sales with the ability to make product proposals and utilization of Thai and Indian bases
Cost reduction through productivity improvement and overseas procurementCost reduction through productivity improvement and overseas procurement
28

Transport Equipment: Mid-Term Strategies for Marine Vehicle Equipment
1,800
2,000Unit Global production of 2-stroke engines for marine vessels
1 400
1,600
1,800
1,200
1,400
1,0002009 2010 2011 2012 2013 2014 2015 2016 2017 2018 2019 2020CY
Nabtesco Estimates as of January 2014
Main StrategiesMain Strategies
Maintain the Japan-China-Korea trilateral production frameworkp p
Capture key players in each market
Enhancement of MRO business through preventive maintenance proposals and the expansion of service networksexpansion of service networks
29

Aircraft& Hydraulic EquipmentAircraft& Hydraulic EquipmentResults for 2014/3 and plan
(JPY million)(JPY million)
2014/3 2015/3 2017/3
H1H1 H2H2 F llF ll H1H1 H2H2 F llF ll F llF ll(JPY million)(JPY million) H1H1resultresult
H2H2resultresult
FullFull--yearyearresultresult
H1H1planplan
H2H2planplan
FullFull--yearyearplanplan
FullFull--yearyearplanplan
SalesSales(year(year--onon--year)year)
26,53826,538(+3.2%)(+3.2%)
25,99425,994(+29.8%)(+29.8%)
52,53352,533(+14.8%)(+14.8%)
27,80027,800(+4.8%)(+4.8%)
26,20026,200(+0.8%)(+0.8%)
54,00054,000(+2.8%)(+2.8%) 66,00066,000(y(y y )y ) ( )( ) ( )( ) ( )( ) ( )( ) ( )( ) ( )( )
Operating Operating profitprofit
(year(year--onon--year)year)
1,8401,840(+8.9%)(+8.9%)
2,0222,022(+1275.5%)(+1275.5%)
3,8623,862(+110.3%)(+110.3%)
1,2001,200((--34.8%)34.8%)
1,6001,600((--20.9%)20.9%)
2,8002,800((--27.5%)27.5%) 5,9005,900
O tiO ti
Hydraulic Equipment
Operating Operating profit marginprofit margin 6.9%6.9% 7.8%7.8% 7.4%7.4% 4.3%4.3% 6.1%6.1% 5.2%5.2% 8.9%8.9%
Sales(JPY billion)Sales(JPY billion)
32.6 33.045.0
Hydraulic Equipment
Aircraft Equipment
9.2 10.619.8
10.3 10.520.9 21.0
17.2 15.3 17.4 15.6 ※Due to the establishment of the New Energy Business Development Division in April 2013,the sales of drive units for wind turbine
H1 result
H2 result
Full-yearresult
H1plan
H2plan
Full-yearplan
Full-yearplan
2014/3 2015/3 2017/3
units for wind turbine generators were transferred from the Aircraft & Hydraulic Segment to the Precision Equipment Segment from 2014/3. 30

Aircraft & Hydraulic Equipment: Aircraft & Hydraulic Equipment: MidMid--Term Strategies for Hydraulic EquipmentTerm Strategies for Hydraulic Equipment
350
400
450
North Ameri a
World Demand for Excavators China’s Demand for Excavators(1,000 units)(units)
70,000
80,000
200
250
300
350 North America
Europe
Japan
Others40,000
50,000
60,000
70,000
~6t
7t~19t
50
100
150 India
Asia and Oceania
China
10,000
20,000
30,000 20t~28t
29t~
02008 2009 2010 2011 2012 2013 2014 2015 2016
Main StrategiesMain StrategiesMain StrategiesMain Strategies
CYCY
Sales by Geographic SegmentSales (JPY billion)
60060
02008 2009 2010 2011 2012 2013 2014 2015 2016
Main StrategiesMain Strategies
Expansion of businesses to Europe and USA while maintaining the business in China
Improvement of profitability through the
Main StrategiesMain Strategies
Expansion of businesses to Europe and USA while maintaining the business in China
Improvement of profitability through the
400
500
Japan
Europe and America
50
40
30 Improvement of profitability through the promotion of local procurement
Improvement of response capabilities to production fluctuation by shortening production
Improvement of profitability through the promotion of local procurement
Improvement of response capabilities to production fluctuation by shortening production 100
200
300 Europe and America
Emerging Countries
China
30
20
10 Approx. Approx. Approx. 40%
p y g plead-time and promoting automationp y g plead-time and promoting automation
Nabtesco EstimatesFY
02013 2014 2016
00
pp40%
pp40% 40%
31

Aircraft & Hydraulic Equipment: Aircraft & Hydraulic Equipment: MidMid--term Strategies for Aircraft Equipmentterm Strategies for Aircraft Equipment
2000
(Units) Transition of Delivery of Aircrafts
1200
1600
Others
Airbus
New Programs for Private New Programs for Private 400
800Boeing
Sector Starting to Contribute from FY2017Sector Starting to Contribute from FY2017
Nabtesco Estimates
02012 2013 2014 2015 2016 ⇒ 2022CY
Main StrategiesMain Strategies
Product proposals for new projects in private sector while maintaining the business with p p p j p gthe Ministry of Defense
Establishment and enhancement of MRO system through customer-oriented approach in order to improve profitability
Production innovation and pursuit of differentiation through high skills and new technology
32

Industrial EquipmentIndustrial EquipmentR lt f 2014/3 d lResults for 2014/3 and plan
(JPY million)(JPY million)
2014/3 2015/3 2017/3
H1H1 H2H2 FullFull yearyear H1H1 H2H2 FullFull yearyear FullFull yearyear( )( ) H1H1resultresult
H2H2resultresult
FullFull--yearyearresultresult
H1H1planplan
H2H2planplan
FullFull--yearyearplanplan
FullFull--yearyearplanplan
SalesSales(year(year--onon--year)year)
23,44523,445(+6.2%)(+6.2%)
30,81930,819(+19.1%)(+19.1%)
54,26454,264(+13.2%)(+13.2%)
26,10026,100(+11.3%)(+11.3%)
31,80031,800(+3.2%)(+3.2%)
57,90057,900(+6.7%)(+6.7%) 77,00077,000( )( ) ( )( ) ( )( ) ( )( ) ( )( ) ( )( )
Operating Operating profitprofit
(year(year--onon--year)year)
851851((--34.0%)34.0%)
2,6752,675(+15.1%)(+15.1%)
3,5263,526((--2.3%)2.3%)
600600((--29.8%)29.8%)
3,4003,400(+26.7%)(+26.7%)
4,0004,000(+13.4%)(+13.4%) 6,2006,200
OperatingOperating
Automatic Doors
Packaging Machines
Operating Operating profit marginprofit margin 3.6%3.6% 8.7%8.7% 6.5%6.5% 2.3%2.3% 10.7%10.7% 6.9%6.9% 8.1%8.1%
Sales(JPY billion)Sales(JPY billion)
59.0
Others
4 9 9 2 5 610.0
12.0 18.424.3
42.7
20.324.7
45.0
0.7 1.5 2.2 1.2 1.4 2.7 6.0 4.2 4.9 9.2 4.4 5.6
H1 result
H2 result
Full-yearresult
H1plan
H2plan
Full-yearplan
Full-yearplan
2014/3 2015/3 2017/3 33

Industrial Equipment: MidIndustrial Equipment: Mid--term Strategies of term Strategies of Automatic Doors and Packaging MachinesAutomatic Doors and Packaging Machines
2008 2009 2010 2011 2012 2013 2014 2015 2018
Japan -1.0 -5.5 4.7 -0.6 1.4 1.7 1.7 1.0 1.1
GDP Growth Rate
Switzerland 2.2 -1.9 3.0 1.8 1.0 1.7 1.8 1.9 1.9
USA -0.3 -2.8 2.5 1.8 2.8 1.9 2.8 3.0 3.1
Euro Area 0.4 -4.4 2.0 1.5 -0.7 -0.4 1.0 1.4 1.6
UK -0.8 -5.2 1.7 1.1 0.3 1.7 1.7 1.0 2.3
Germany 0.8 -5.1 3.9 3.4 0.9 0.5 1.6 1.4 1.2
France -0.1 -3.1 1.7 2.0 0.0 0.2 1.0 0.8 1.9
Austria 1.4 -3.8 1.8 2.8 0.9 0.4 0.9 1.2 1.4
Canada 1 2 2 7 3 4 2 5 1 7 1 7 2 4 2 2 2 2
Expansion of Market through M&A i D l d C t iExpansion of Market through M&A i D l d C t iCanada 1.2 -2.7 3.4 2.5 1.7 1.7 2.4 2.2 2.2
Russia 5.2 -7.8 4.5 4.3 3.4 1.5 2.0 2.5 3.5
Source: IMF World Economic Outlook
M&A in Developed Countries Being Vital for Future GrowthM&A in Developed Countries Being Vital for Future Growth
Main StrategiesMain StrategiesPackaging Machines:
Expansion of businesses in China and
Main StrategiesMain StrategiesPackaging Machines:
Expansion of businesses in China and
Main StrategiesMain StrategiesAutomatic Doors:
Strengthening operating base through value chain management
Main StrategiesMain StrategiesAutomatic Doors:
Strengthening operating base through value chain management pNorth America by strengthening sales network
Further improvement of profitabolitythrough community-based MRO service framework
pNorth America by strengthening sales network
Further improvement of profitabolitythrough community-based MRO service framework
Expansion of business scale through M&A
Amplification of product lineup according to characteristics of markets and regions
Enhancement of profitability through the evolution of
Expansion of business scale through M&A
Amplification of product lineup according to characteristics of markets and regions
Enhancement of profitability through the evolution of frameworkframeworkEnhancement of profitability through the evolution of MRO businessEnhancement of profitability through the evolution of MRO business
34

ConsolidatedConsolidated Results and Plan by Results and Plan by GeographicGeographic SegmentSegmentGeographic Geographic SegmentSegment
2017/32017/3 PlanPlan2014/32014/3 ResultResultOthers
1%(JPY 3 billion)North America
14%(JPY 39 billion)
Others0.3%
( JPY 0.5 billion)North America
7.7%(JPY 15.5 billion)
JPYEurope
(JPY 39 billion)
JPY
Europe15%
(JPY 30.4 billion)
280billion
Japan42%
(JPY 117 billion)
Europe17%
(JPY 48 billion)202.2 billion
Japan56.6%
(JPY 114.5 billion)
Other Asia(Excluding Japan & China)
7%( JPY 14.1 billion)
China20%
(JPY 56 billion)
Other Asia(Excluding Japan & China)
6%(JPY 17 billion)
China13.4%
(JPY 27.1billion)
( )
Overseas Sales RatioOverseas Sales Ratio
5858%%
Overseas Sales RatioOverseas Sales Ratio
43.443.4%%
35

CAPEX, R&D and DepreciationCAPEX, R&D and Depreciation
(JPY billion)(JPY billion) Three Year TotalThree Year Total(2012/3(2012/3-- 2014/3 result)2014/3 result)
Three Year TotalThree Year Total(2015/3(2015/3-- 2017/32017/3 plan)plan)
CAPEXCAPEX 30 430 4 45 045 0CAPEXCAPEX 30.430.4 45.045.0R&DR&D 17.1 17.1 23.023.0
DepreciationDepreciation 22.122.1 23.023.0
CAPEX by UsageCAPEX by Usage
pp
CAPEX by UsageCAPEX by UsageNew New
JPYJPY
New products
8%Others 20%
JPYJPYOthers
29%
New products
11%Production
increaseJPY JPY 30.4 30.4
billionbillion
Production increase
43%Productivity
JPY JPY 45.0 45.0
billionbillion
increase 13%
billionbillionProductivity improvement
29% Productivity improvement
47%
Three Year TotalThree Year Total(2012/3(2012/3-- 2014/3 result)2014/3 result)
Three Year TotalThree Year Total(2015/3(2015/3-- 2017/32017/3 plan)plan)
36

Topics:
September 2013: included in the global indices for socially responsiblei t t (SRI)investment (SRI)
-Dow Jones Sustainability Asia Pacific Index (First time)-FTSE4Good Index Series (Ten times in a row) (April)-FTSE4Good Index Series (Ten times in a row) (April)
November 2013: selected as a component of ‘JPX-Nikkei Index 400’
January 2014: A group company, CMET’s 3D Printer “RapidMeister
ATOMm4000” won the “Nikkei Business Daily Awards for
Excellence” at “2013 Nikkei Superior Products and
Services Awards”.
37

Topics:
March 2014: started collaboration with Swiss Federal Institute of Technology in Zurich (ETHZ: Eidgenössische Technische Hochschule Zürich) to develop power electronics technology
April 2014: participated in the United Nations Global Compact and will further foster CSR-oriented management style
April 2014: won ‘Supplier of the Year’award FY2013 from Boeing
38


AppendixAppendix
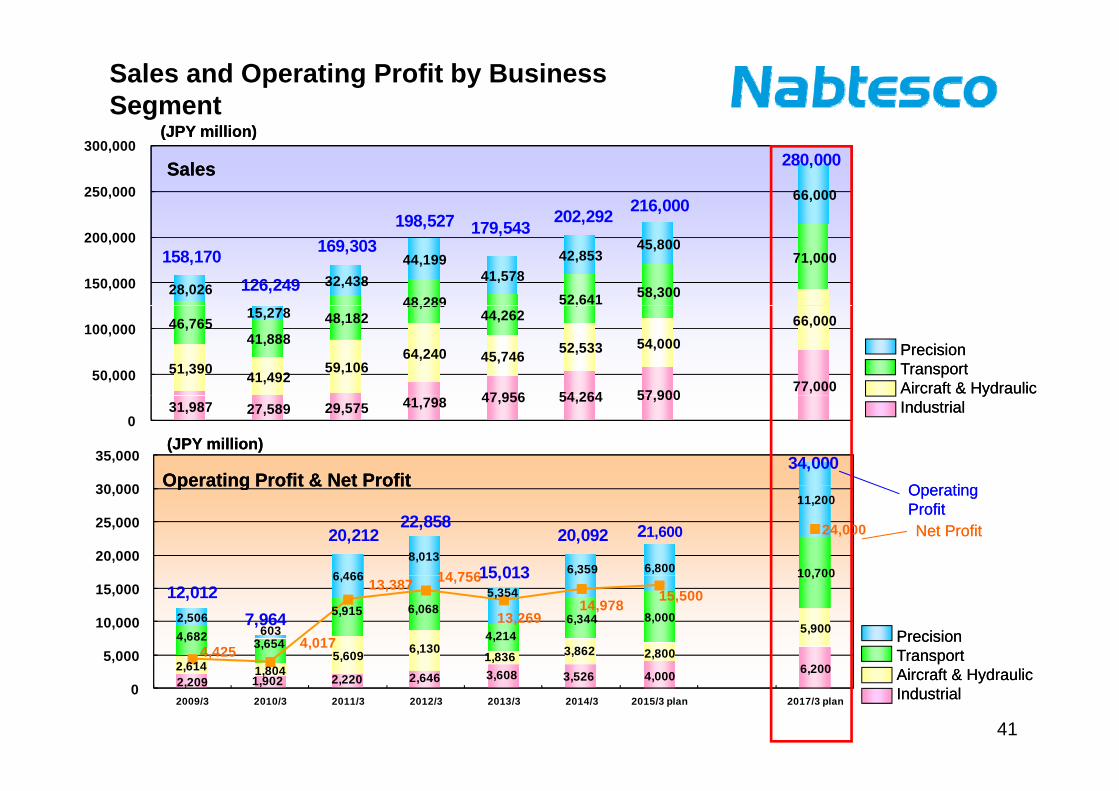
Sales and Operating Profit by Business Segment
(JPY illi )(JPY illi )
66,000
198 527 202 292 216,000
280,000
250,000
300,000 (JPY million)(JPY million)
SalesSales
48,289 52,641 58,300
71,000
28,026 32,438 44,199
41,578 42,853
45,800 158,170
126,249
169,303198,527 179,543 202,292
150,000
200,000
47 956 54 264 57 900 77,00051,390 41,492
59,106 64,240 45,746 52,533 54,000
66,000 46,765 41,888
48,182 48,289
44,262 ,
15,278
50,000
100,000 PrecisionPrecisionTransportTransportAircraft & HydraulicAircraft & Hydraulic
34,000 30 000
35,000
31,987 27,589 29,575 41,798 47,956 54,264 57,900
0
yyIndustrialIndustrial
Operating Profit & Net ProfitOperating Profit & Net Profit O tiO ti
(JPY million)(JPY million)
10 7006 4668,013
6,359 6,800
11,200
20,212 22,858
15 013
20,092 21,600
14 756
24,000
20,000
25,000
30,000 Operating Profit & Net ProfitOperating Profit & Net Profit Operating Operating ProfitProfitNet ProfitNet Profit
6 2002 6145,609 6,130
1,836 3,862 2,800
5,900 4,682 3,654
5,915 6,068
4,214 6,344 8,000
10,700
2,506603
6,4665,354
,
12,012 7,964
15,013
4,425 4,017
13,387 14,756
13,26914,978 15,500
5,000
10,000
15,000
PrecisionPrecisionTransportTransport
2,209 1,902 2,220 2,646 3,608 3,526 4,000 6,200 2,614 1,804 0
2009/3 2010/3 2011/3 2012/3 2013/3 2014/3 2015/3 plan 2017/3 plan
Aircraft & HydraulicAircraft & HydraulicIndustrialIndustrial
41

Sales by Businesses
P i i R d ti G(JPY billion)Precision
Ai ft & H d liPrecision Reduction Gears
OthersHydraulic Equipment
Aircraft Equipment
(JPY billion)Aircraft & Hydraulic
39 4 38.9 40.8
54.0
28.832.6 33.0
45.0
1.0 1.1 2.1 1.6 2.1 3.8 2.3 2.6 4.912.0
19.2 20.1
39.4
17.8 21.1 20.3 20.4
H1 H2 Full-year H1 H2 Full-year H1 H2 Full-year Full-year
8.2 8.616.8
9.2 10.619.8
10.3 10.520.9 21.0
17.411.3
17.2 15.3 17.4 15.6
H1 H2 Full-year H1 H2 Full-year H1 H2 Full-year Full-yearH1 result
H2 result
Full yearresult
H1 result
H2 result
Full yearresult
H1plan
H2plan
Full yearplan
Full yearplan
2013/3 2014/3 2015/3 2017/3
Railroad Vehicle Equipment
Commercial Vehicle Equipment
(JPY billion)
H1 result
H2 result
Full yearresult
H1 result
H2 result
Full yearresult
H1plan
H2plan
Full yearplan
Full yearplan
2013/3 2014/3 2015/3 2017/3
Automatic Doors
(JPY billion)Transport Industrial
20 526.6
30.0
35.5
q p
Marine Vessel Equipment
Others(Sales companies)
59.0
Packaging Machines
Others
6 7 7 7 3 9 4 3 8 3 13.04.2 3.7 7.9
3.7 4.5 8.3
4.9 4.7 9.6
11.0
4.6 4.3
9.0
4.6 5.2
9.8
5.0 5.3
10.3 11.5
10.4 10.0
20.5
12.0 14.6 15.4 14.5
6 04 5 5 5 10.14 2 4 9 9.2
4 4 5 610.0
12.0 16.6 19.3
36.0
18.424.3
42.7
20.324.7
45.0
3.2 3.5 6.7 3.5 4.2 7.7 3.9 4.3 8.3
H1 result
H2 result
Full-yearresult
H1 result
H2 result
Full-yearresult
H1plan
H2plan
Full-yearplan
Full-yearplan
2013/3 2014/3 2015/3 2017/3
0.7 1.0 1.7 0.7 1.5 2.2 1.2 1.4 2.7 6.0 4.5 5.5 4.2 4.9 4.4 5.6H1
resultH2
resultFull-year
resultH1
resultH2
resultFull-year
resultH1
planH2
planFull-year
planFull-year
plan
2013/3 2014/3 2015/3 2017/3
* Due to the elimination, sales has changed compare to 2014/3 2Q briefing ** FOREX effect 2015/3~2017/3(premise) US$1=¥100 RMB1=¥16.40 EUR1=130.00 CHF1=107.0042

CAPEX, R&D , DepreciationCAPEX, R&D , Depreciation
( )( ) 2013/32013/3 2014/32014/3 2015/32015/3(JPY million)(JPY million) 2013/32013/3ResultResult
2014/32014/3ResultResult
2015/32015/3PlanPlan
CAPEXCAPEX 10,19010,190 6,7606,760 12,00012,000
R&DR&D 5,5355,535 6,4016,401 7,0007,000
923923 600600 6 006 00DepreciationDepreciation 7,9237,923 7,6007,600 6,7006,700
Notes:
Increase in CAPEX in 2015/3 in light of postponement in 2014/3 and the modernization of domestic production bases.
Declining-balance method was adopted for parent company and part of consolidated subsidiaries in 2014/3 as the depreciation method for tangible fixed asset. Decrease of 0.9 billion is expected since it will be changed to straight-line
Notes:
Increase in CAPEX in 2015/3 in light of postponement in 2014/3 and the modernization of domestic production bases.
Declining-balance method was adopted for parent company and part of consolidated subsidiaries in 2014/3 as the depreciation method for tangible fixed asset. Decrease of 0.9 billion is expected since it will be changed to straight-linedepreciation method for tangible fixed asset. Decrease of 0.9 billion is expected since it will be changed to straight line method.depreciation method for tangible fixed asset. Decrease of 0.9 billion is expected since it will be changed to straight line method.
43
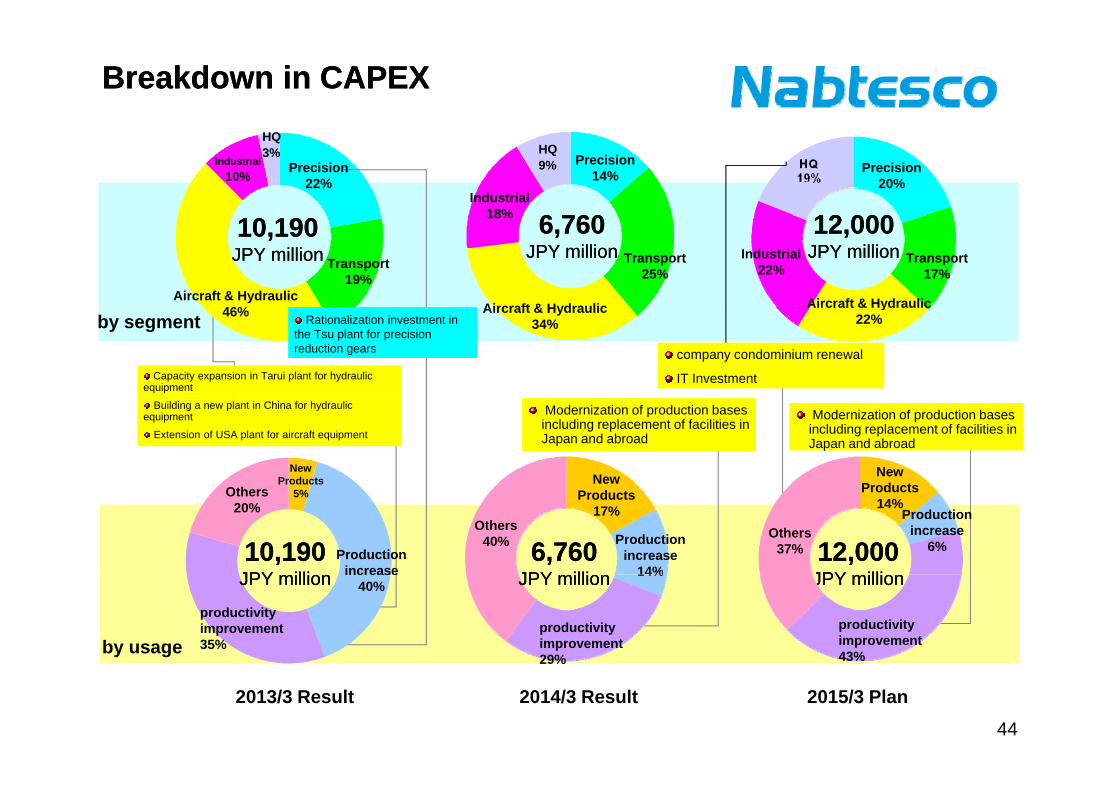
Breakdown in CAPEXBreakdown in CAPEXHQ3%
Industrial10%
12 00012 000
HQ9%
6 7606 760
Precision20%
Precision14%Precision
22%Industrial
18% 12,00012,000JPY millionJPY million
Aircraft & H dra lic
6,7606,760JPY millionJPY million
10,19010,190JPY millionJPY million
Aircraft & Hydraulic Aircraft & Hydraulic
Transport19%
Transport25%
Transport17%
18%
Industrial22%
Aircraft & Hydraulic34%
46% Aircraft & Hydraulic22%by segment Rationalization investment in
the Tsu plant for precision reduction gears
Rationalization investment in the Tsu plant for precision reduction gears
Capacity expansion in Tarui plant for hydraulic equipment
Capacity expansion in Tarui plant for hydraulic equipment
company condominium renewal
IT Investment
company condominium renewal
IT Investment
Modernization of production bases including replacement of facilities in Japan and abroad
Modernization of production bases including replacement of facilities in Japan and abroad
New Products New New
Products
Building a new plant in China for hydraulic equipment
Extension of USA plant for aircraft equipment
Building a new plant in China for hydraulic equipment
Extension of USA plant for aircraft equipment
Modernization of production bases including replacement of facilities in Japan and abroad
Modernization of production bases including replacement of facilities in Japan and abroad
12,00012,000JPY millionJPY million
10,19010,190JPY millionJPY million
6,7606,760JPY millionJPY million
Production increase
Production increase
14%
Production increase
6%
Others20%
Others40% Others
37%
5% Products17%
Products14%
JPY millionJPY million
productivity improvement 35%
JPY millionJPY million JPY millionJPY million
by usage
40%14%
productivity improvement 29%
productivity improvement 43%
2013/3 Result 2015/3 Plan2014/3 Result44

Consolidated Cash FlowConsolidated Cash Flow
Operating Cash Flow Investment Cash Flow Free Cash Flow
(JPY million)
2013/3 2014/32009/3 2010/3 2011/3 2012/32008/3 2015/3 Plan
45