plos biology atonal homolog 1 is a tumor suppressor gene · atonal homolog 1 is a tumor suppressor...
TRANSCRIPT

Atonal homolog 1 Is a Tumor Suppressor GeneWouter Bossuyt1,2,3[, Avedis Kazanjian4[, Natalie De Geest1,2, Sofie Van Kelst1,2, Gert De Hertogh5, Karel Geboes5,
Greg P. Boivin6, Judith Luciani7, Francois Fuks7, Marinee Chuah8,9, Thierry VandenDriessche8,9, Peter Marynen2,3,10,
Jan Cools2,3,10, Noah F. Shroyer4,11,12*, Bassem A. Hassan1,2,3*
1 Laboratory of Neurogenetics, Department of Molecular and Developmental Genetics, VIB, Leuven, Belgium, 2 Department of Human Genetics, K.U. Leuven School of
Medicine, Leuven, Belgium, 3 Doctoral Program in Molecular and Developmental Genetics, K.U. Leuven Group Biomedicine, Leuven, Belgium, 4 Division of Gastroenterology,
Hepatology, & Nutrition, Children’s Hospital Research Foundation, Cincinnati, Ohio, United States of America, 5 Department of Pathology, Leuven University Hospital, K.U.
Leuven, Leuven, Belgium, 6 Department of Pathology and Laboratory Medicine, University of Cincinnati College of Medicine, Cincinnati, Ohio, United States of America,
7 Laboratory of Cancer Epigenetics, Faculty of Medicine, Free University of Brussels (U.L.B.), Brussels, Belgium, 8 The Vesalius Research Center, VIB, Leuven, Belgium, 9 The
Vesalius Research Center, K.U. Leuven School of Medicine, Leuven, Belgium, 10 The Human Genome Laboratory, Department of Molecular and Developmental Genetics, VIB,
Leuven, Belgium, 11 Division of Developmental Biology, Children’s Hospital Research Foundation, Cincinnati, Ohio, United States of America, 12 Department of Pediatrics,
University of Cincinnati, Cincinnati, Ohio, United States of America
Colon cancer accounts for more than 10% of all cancer deaths annually. Our genetic evidence from Drosophila andprevious in vitro studies of mammalian Atonal homolog 1 (Atoh1, also called Math1 or Hath1) suggest an anti-oncogenic function for the Atonal group of proneural basic helix-loop-helix transcription factors. We asked whethermouse Atoh1 and human ATOH1 act as tumor suppressor genes in vivo. Genetic knockouts in mouse and molecularanalyses in the mouse and in human cancer cell lines support a tumor suppressor function for ATOH1. ATOH1antagonizes tumor formation and growth by regulating proliferation and apoptosis, likely via activation of the Jun N-terminal kinase signaling pathway. Furthermore, colorectal cancer and Merkel cell carcinoma patients show geneticand epigenetic ATOH1 loss-of-function mutations. Our data indicate that ATOH1 may be an early target for oncogenicmutations in tissues where it instructs cellular differentiation.
Citation: Bossuyt W, Kazanjian A, De Geest N, Van Kelst S, De Hertogh G, et al. (2009) Atonal homolog 1 is a tumor suppressor gene. PLoS Biol 7(2): e1000039. doi:10.1371/journal.pbio.1000039
Introduction
The Atonal (Ato) proneural transcription factors form ahighly conserved group of key developmental regulators inmultiple neural and neuroendocrine tissues. The mammalianAto (CG7508) ortholog, ATOH1 (Ensembl accession number:ENSG00000172238), is essential for cell fate commitment ofmechanoreceptive Merkel cells in the skin [1] and thesecretory goblet, Paneth, and enteroendocrine cells in theintestine [2,3] in addition to multiple neuronal lineages [4,5].The functional conservation between the fly and mammalianproteins is underscored by the fact that Drosophila ato can fullyrescue the Atoh1 (Ensembl: ENSMUSG00000073043) nullmutant mouse [6].
Genetic analyses in Drosophila [7] suggest that ato regulatesthe formation and progression of tumors in fly retina, whereit acts as a master regulator of cell fate specification. Inmammals, two aggressive human cancers derive from tissueswhere ATOH1 instructs cell fate commitment, namely Merkelcell carcinoma (MCC) and colorectal cancer (CRC). MCC is arare, but very aggressive, neuroendocrine cancer of the skinwith approximately 40% mortality [8]. CRC is a highlyprevalent cancer with high mortality (36%) representing11% of all cancer deaths annually [9]. Recent studies in coloncancer cell lines suggest that ATOH1 can inhibit tumor cellgrowth in vitro [10]. If the anti-oncogenic function ofDrosophila ato is conserved in its mammalian counterparts,one would predict that the loss and gain of function ofATOH1 would enhance and suppress tumor formation,respectively, in MCC and CRC models. In addition, theATOH1 should be subject to loss-of-function mutations in asignificant number of human cancer patients.
We tested this prediction in two different mouse models for
colon cancer, as well as human MCC and CRC cell lines. Inaddition, we examined the status of the ATOH1 locus inprimary tumor samples from human MCC and CRC patients.Our data show that loss of ATOH1 strongly enhances theformation and progression of tumors in mice and human celllines. Conversely, gain of ATOH1 function strongly inhibits theoncogenic phenotypes in human cell lines. Furthermore, wefind genetic and epigenetic loss-of-function mutations withvery high frequency in primary human tumors derived fromATOH1-dependent tissues and provide biochemical insight intohow these epigeneticmutationsmay arise. Finally, we describe ahighly conserved anti-oncogenic molecular signaling pathwaythat links ATOH1 activity to the stress sensor Jun N-terminalkinase (JNK) pathway mediated via cell type–specific differ-ential co-option of receptor tyrosine kinases (RTKs). Togetherwith the genetic analysis in Drosophila [7], these data support anovel, highly conserved tumor suppressor function for theAtonal group of transcription factors.
Academic Editor: Nicholas Hastie, Western General Hospital, United Kingdom
Received September 4, 2008; Accepted January 12, 2009; Published February 24,2009
Copyright: � 2009 Bossuyt et al. This is an open-access article distributed underthe terms of the Creative Commons Attribution License, which permits unrestricteduse, distribution, and reproduction in any medium, provided the original authorand source are credited.
Abbreviations: AOM, azoxymethane; CGH, comparative genomic hybridization;CRC, colorectal cancer; GALT, gut-associated lymphoid tissue; JNK, Jun N-terminalkinase; MCC, Merkel cell carcinoma; NTRK, Neurotrophic tyrosine kinase receptortype 1; RTK, receptor tyrosine kinase; RT-qPCR, quantitative reverse-transcriptasePCR
* To whom correspondence should be addressed. E-mail: [email protected](NFS); [email protected] (BAH)
[ These authors contributed equally to this work.
PLoS Biology | www.plosbiology.org February 2009 | Volume 7 | Issue 2 | e10000390311
PLoS BIOLOGY

Results
Loss of Atoh1 Promotes Tumor Formation in TwoColorectal Cancer Mouse ModelsIn the mouse, Atoh1 is a master regulator of secretory cell
fate commitment in the intestinal epithelium [2,11]. Toinvestigate whether Atoh1 plays a role in intestinal tumors,we analyzed the function of the mammalian ato homolog,Atoh1, in colon tumorigenesis. We assessed the tumorsusceptibility of mice with an intestine-specific deletion ofAtoh1 (Atoh1Dintestine) [3] in two different established mousemodels of CRC.We first treated Atoh1Dintestine mice with azoxymethane
(AOM), a chemical carcinogen that preferentially inducescolon tumors. We found a significant enhancement in polypformation in the large intestines of Atoh1Dintestine compared towild-type littermate mice, characterized by increased inci-dence (33% [4/12] vs. 100% [8/8], p , 0.005; Figure 1A),multiplicity (0.75 vs. 10.3 polyps/colon, p , 0.0008; Figure 1C),and size (2.1 vs. 4.1 mm/polyp, p , 0.0004; Figure 1E) whenexamined under the dissecting microscope. Histologicalanalysis of colons from AOM-treated Atoh1Dintestine mice
Figure 1. Loss of Atoh1 Enhances Tumor Formation in the Mouse Colon
(A) shows the incidence of polyps in AOM-treated mice.(B) shows the incidence of polyps in the Atoh1wt and Atoh1Dintestine mice in an APC min background.In (A) and (B), the two-tailed Fisher exact test was used.(C) Bar graph shows the average number of macroscopically visible polyps (.1 mm) in the colons of AOM-treated Atoh1wt (WT; n¼ 9 polyps in 12 mice,white bars) and Atoh1Dintestine (n¼ 82 polyps in 8 mice, black bars).(D) The average number of polyps in the colons of APC min (n¼ 27 polyps in 27 mice) and APC min; Atoh1Dintestine (n¼ 123 polyps in 10 mice).(E and F) The average maximum diameter of each polyp is shown as a bar graph for Atoh1wt or Atoh1Dintestine mice. (E) Comparison of polyp size fromAOM-treated Atoh1wt and Atoh1Dintestine mice; and (F) from APC min and APC min; Atoh1Dintestine mice.For (C–F), the two-tailed Student t-test was used to measure significance. Error bars indicate the standard error of the mean. Double asterisks (**)indicate p ,0.01; triple asterisks (***) indicate p ,0.001.doi:10.1371/journal.pbio.1000039.g001
PLoS Biology | www.plosbiology.org February 2009 | Volume 7 | Issue 2 | e10000390312
ATOH1 Is a Tumor Suppressor
Author Summary
Like most cancers, colon cancer displays a loss of differentiation, andthe stronger this property, the more aggressive the cancer. Thissuggests that the loss of the capacity to differentiate may be acritical and possibly early event during the formation of thesetumors. The key gene instructing secretory cell fate differentiation inthe epithelium of the colon, namely Atonal homolog 1 (ATOH1), ishighly conserved in flies, mice, and humans. We asked whetherATOH1 could be a pivotal factor in causing colon cancer in mice andhumans. Our studies show that colon-specific loss of ATOH1 in miceis sufficient to trigger colon cancer and that the majority of humancolon cancers also have an inactivated ATOH1. Reactivating ATOH1in cultured human colon cancer cells causes these cells to stopdividing and to commit suicide. Since reactivation of this epigeneti-cally silenced gene can be achieved using small chemicalcompounds, studying how ATOH1 acts may offer therapeuticavenues in the future.
confirmed these findings and showed a range of histologicalphenotypes, from severely hyperplastic mucosa with embed-ded multifocal adenomas, to large, highly dysplastic adeno-mas, with one animal having invasive adenocarcinoma (Figure2A, 2A9, and 2A99). In contrast, histological examination ofAOM-treated Atoh1wt littermates showed none with adenom-atous changes; with all polyp-like structures shown to be gut-associated lymphoid tissue (GALT; Figures 2B and S1). Thesedata support the notion that loss of Atoh1 can be an initiatingevent in mammalian cancer formation.
In previous work, we found that ablation of Atoh1 leads toan increase of proliferation but has no effect on apoptosis [3].We therefore examined proliferation and apoptosis in the‘‘preneoplastic’’ normal-appearing epithelium within thecolons of AOM-treated Atoh1wt and Atoh1Dintestine mice. As inthe Drosophila model, we find more proliferation of epithelialcells in Atoh1Dintestine crypts compared to nonrecombined wild-type crypts within the same animals, or compared to cryptsfrom Atoh1wt littermates (Figures 2E and S2D–S2F) but noobvious difference in apoptosis (Figures 2F and S2G–S2I).
We extended our tumor analysis with an independentgenetic mouse model for CRC by crossing Atoh1Dintestine miceto APCmin mice (APC: ENSMUSG00000005871), in which Wntsignaling is constitutively activated [12,13]. APCmin micedevelop spontaneous adenomas primarily in the smallintestine, with only occasional polyps in the colon [14].Interestingly, Wnt signaling is thought to interact negativelywith ato during sense organ formation in the developingDrosophila epithelium [15]. Comparing the large intestines ofAPCmin; Atoh1wt mice to APCmin; Atoh1Dintestine littermates at 16wk, we find significantly more polyps in the colons of double-mutant mice, characterized by increased incidence (52% [14/27] vs. 100% [10/10], p ,0.007; Figure 1B), multiplicity (1.1 vs.12.3 polyps/colon, p ,0.0001; Figure 1D), and size (3.3 vs. 4.3mm/colon, p ,0.0002; Figure 1F). Histological examinationconfirmed these polyps as adenomas in both APCmin; Atoh1wt
and APCmin; Atoh1Dintestine mice, with two polyps in APCmin;Atoh1Dintestine mice having progressed to invasive adenocarci-noma (Figure 2C and 2D). The polyps in the APCmin;Atoh1Dintestine mice originated from the Atoh1 mutant cryptsas indicated by the absence of goblet cells in the polyps(Figure S3A and S3B).
In summary, thus far, loss-of-function analysis of Atoh1 intwo mouse models of colon tumorigenesis supports a role forAtoh1 as a key switch in tumor formation and progression.This role appears to be mediated by increased cell prolifer-ation in the absence of Atoh1. Importantly, the mouse tumorslack the secretory cell types that depend on Atoh1 for theirformation. Thus, the role of Atoh1 in tumor formation is likelylinked to its function as a master regulator of differentiation.
Loss of ATOH1 Expression in Primary Human CRC andMCC Tumors
Given the remarkable evolutionary conservation of ato/Atoh1 function in cancer development, we decided to analyzewhether loss of the human ortholog, ATOH1, might beselected for during malignant transformation in humancancer. To this end, we investigated the role of ATOH1 inCRC and MCC. In vitro overexpression experiments in CRCcell lines suggest that ATOH1 gain of function decreases thepopulation growth potential of CRC cells [10]. Similarly,expression analysis in MCC cell lines suggests an inverse
correlation between ATOH1 levels and the populationgrowth of MCC cells (Figure S4A–S4C) [16]. These observa-tions hint at a potential role for ATOH1 in these cancers.To test this possibility in vivo in primary human tumors, we
began by asking whether the expression of ATOH1 is down-regulated in primary tumor samples from 42 CRC and fourMCC patients. As MCC is a very rare cancer, only foursamples were available for analysis. Seventy percent of theCRC samples show a significant decrease of ATOH1 mRNAexpression compared to tissue-matched colon samples fromnormal controls as analyzed by quantitative reverse-tran-scriptase PCR (RT-qPCR), suggesting that loss of ATOH1expression is a highly common feature of CRC oncogenesis(Figures 3F and S4). Furthermore, ATOH1 mRNA levels aresignificantly lower in adenocarcinoma samples compared toadenomas (t-test: p ¼ 0.017), indicating progressive loss ofATOH1 expression levels with increasing tumor severity(Figure 3A). Similarly, in MCC, the two samples with lowerATOH1 expression levels were derived from the two patientsshowing metastases (Figure S5).
CRC and MCC Patients Show Deletions in the ATOH1LocusOne mechanism to explain loss of gene expression during
oncogenesis is the deletion of the locus, which we tested forusing quantitative PCR on genomic DNA in all 46 patientsamples, one MCC cell line (MCC14.2), and one CRC cell line(Ht29). At least one deletion in the locus was detected in 57%of the samples (Figure 3B and 3F). A second primer setyielded similar results (49% deletion rate, Figure 3B). Oneallele was also deleted in both Ht29 and MCC14.2. Com-parative genomic hybridization (CGH) array experiments [17]on three samples did not show a deviation of the clonesflanking the ATOH1 locus (Figures S5 and S6), indicating thatthe deletions observed in patients are likely to be ATOH1-specific microdeletions. When only one copy is deleted,complete loss of gene function could be achieved by pointmutations in the remaining allele. Sequencing of the ATOH1open reading frame of 24 samples, however, did not revealany mutations in any of the samples (unpublished data).Together with the loss of ATOH1 mRNA expression inpatients, these results suggest that an epigenetic silencingmechanism may be involved—a possibility we tested infurther detail.
The ATOH1 Locus Is Methylated in CRC and MCC PatientsTo address a putative epigenetic transcriptional silencing
mechanism, we began by asking whether transcription could,in principle, be initiated from the ATOH1 locus in cancercells. Drosophila ato and mouse Atoh1 are both known to beautoregulatory [18,19]. This provides the opportunity to testwhether transcription could be activated from the ATOH1locus by ATOH1 itself in normal versus cancer cells. We tookadvantage of expressing the mouse ortholog in human cells todistinguish the expression of endogenous ATOH1 from thatof Atoh1. For the tests in human cancer cell lines, we used theMCC14.2 cell line, which is derived from MCC and hasstrongly reduced expression of ATOH1. Surprisingly, Atoh1overexpression failed to activate endogenous human ATOH1expression in the MCC14.2 cell line (Figure 3C), despite thevirtually complete conservation of the two proteins. This maybe due to a key difference between the two proteins, or to a
PLoS Biology | www.plosbiology.org February 2009 | Volume 7 | Issue 2 | e10000390313
ATOH1 Is a Tumor Suppressor

Figure 2. Increased Proliferation Contributes to Tumorigenesis in Atoh1Dintestine Colon
(A) Hematoxylin and eosin staining of a representative adenoma in AOM-treated Atoh1Dintestine colon (53 magnification). The section is in the rectalregion and is characterized by cystic structures with severe crypt hyperplasia with multifocal embedded adenomas and severe lymphocyte infiltration ofthe submucosa. (L, lumen; M, muscle). (A)9 and (A)99 show higher magnification (203) of two areas of the adenoma, indicating the aberrant branchedcrypt structures that are imbedded in the submucosa.(B) The colons of AOM-treated Atoh1wt mice showed large GALT (highlighted by arrows) that were macroscopically counted as polyps. Magnification is53. Note the relative size of the GALT compared to adjacent normal-appearing crypts.(C) Histological analysis of colon in APCmin.
PLoS Biology | www.plosbiology.org February 2009 | Volume 7 | Issue 2 | e10000390314
ATOH1 Is a Tumor Suppressor

(D) Histological analysis in APCmin; Atoh1Dintestine mice show highly dysplastic adenomas with cystic structures and lymphocyte infiltration.(E) Proliferation was measured by determining the percentage of BrdU-positive epithelial cells in AOM-treated Atoh1wt and Atoh1Dintestine normal-appearing colonic crypts. The white bar represents crypts from Atoh1wt mice; the gray bar represents nondeleted Atoh1wt crypts, and the black barAtoh1-null crypts in Atoh1Dintestine mice.(F) Apoptosis was measured by determining the percentage of cleaved caspase-3 (c-Caspase 3)-positive epithelial cells in AOM-treated Atoh1wt andAtoh1Dintestine normal-appearing colonic crypts. Bar shading indicates crypt genotype as in (E).For each graph in (E and F), the two-tailed Student t-test was used to measure significance: a single asterisk (*) indicates p , 0.05; double asterisks (**)indicate p , 0.01. Error bars indicate the standard error of the mean.doi:10.1371/journal.pbio.1000039.g002
Figure 3. Loss of ATOH1 Expression and Genomic Deletions in CRC Patient Samples
(A) ATOH1 expression normalized to GADPH and control colon samples: ATOH1 expression is lower in tumor compared to control samples. Additionally,adenocarcinomas have significantly lower ATOH1 expression than adenomas. Box plot indicating 25–75 percentiles, central line indicates the median,red cross indicates the mean. Error bars indicate next data point. Outliers are represented as dots. Double asterisks (**) indicate p , 0.01 (t-test).(B) Deletions in the ATOH1 locus. Upper dashed line indicates the upper limit of single-deletion detection set at 0.70 of the ratio of ATOH1 locus tocontrol locus. White and gray bars indicate different primer sets.(C) Endogenous ATOH1 expression in different MCC14.2-derived cell lines and human keratinocytes (HK) in response to Atoh1 expression.(D) Detection of methylation at the ATOH1 locus using pull-down assay of methylated DNA. Bands in ‘‘M-CpG pulldown’’ indicate positive for ATOH1methylation. ‘‘Input’’ shows DNA input before the pull-down. Samples were processed blindly. Internal methylated and unmethylated controls areshown in the last four lanes.(E) Inhibition of methyltransferase activity with 5-aza-deoxycytosine for 7 d leads to an increase of ATOH1 expression in the Ht29 cell line. Error barsindicate the standard deviation.(F) Graph representing observations on the genomic and mRNA levels. First column: percentage of patients showing deletions or duplications (black:deletions, gray: two copies, and white: duplications). Second column: percentage of patients showing methylation using the pull-down of methylatedDNA assay (black: methylated, and white: not methylated). Third column: mRNA expression of CRC samples versus control colon (black: low expression,grey: normal expression, and white: high expression).doi:10.1371/journal.pbio.1000039.g003
PLoS Biology | www.plosbiology.org February 2009 | Volume 7 | Issue 2 | e10000390315
ATOH1 Is a Tumor Suppressor

possible disruption of the autoregulatory loop during onco-genesis. To test whether Atoh1 can activate ATOH1 expres-sion in normal noncancerous skin cells, we transducednormal human primary keratinocytes with an Atoh1 expres-sion vector and tested the expression of endogenous ATOH140 h after lentiviral transduction. In contrast to the cancercell lines, endogenous ATOH1 is up-regulated 38-fold byAtoh1 (Figure 3C). This indicates that the expressability ofthe ATOH1 locus is inhibited during oncogenesis.
Genomic database searches show that all known ATOH1orthologs, from human to Drosophila, reside in a CpG islandcovering at least the promoter and the transcription start site,suggesting that CpG methylation may be a mechanism ofATOH1 loss of function. We therefore assayed all patientsamples and both cell lines for ATOH1 methylation usingthree independent assays: pull-down of methylated DNA,methylation-sensitive restriction digest, and methylation-specific PCR for bisulfite DNA modification. We found thatup to 81% of the patients, as well as both cell lines, showmethylation of the ATOH1 locus in both the coding sequenceand the promoter sequences directly upstream of the ATG. Incontrast, none of the control samples show ATOH1 methyl-ation (Figures 3D, 3F, and S7A–S7C). This suggests thatmethylation is likely causal to the transcriptional silencing ofthe locus during oncogenesis as this is accompanied by lowerATOH1 expression. In a few cases, however, the correlationwas not observed. In two cases (samples 27 and 30), this maybe due to the presence of a putative duplication, which is yetto be methylated. Alternatively, but not exclusively, it may bedue to heterogeneity of the degree of methylation in differentcells comprising the tumor samples analyzed. To provideevidence that methylation silences the ATOH1 locus, weinhibited DNA methyltransferases (Dnmts) with 5-azadeox-ycytidine in the Ht29 cell line. This results in an approx-imately 8-fold increase in ATOH1 expression (Figure 3E).Thus, the ATOH1 locus is methylated in cancer patients andderived cell lines, and this methylation can be reversed,resulting in the transcriptional reactivation of the locus. Theautoregulatory function of ATOH1 combined with themethylation of its regulatory sequences might hint to theinvolvement of ATOH1 in the silencing of its own promoter.To gain some insight into whether this may indeed be thecase, we asked whether Atoh1 can physically interact withDnmt proteins. We tested the binding of Atoh1 to Dnmt1(ENSG00000130816), Dnmt3a (ENSG00000119772), andDnmt3b (ENSG00000088305) using GST pull-down assays.We find that Atoh1 binds to all three Dnmts. This is furthersupported by the ability of GST-Atoh1 to pull down DNAmethyltransferase activity from nuclear extracts, similar tothe positive control (EED: embryonic ectoderm development,ENSG00000074266) [20]. Focusing on Dnmt1, the mainte-nance DNA methyltransferase, we confirmed this observationusing coimmunoprecipitation experiments in 293T cellstransfected with HA-tagged Atoh1. Lastly, mapping experi-ments identified several regions of Dnmt1 as mediating theassociation with Atoh1 (Figure S8A–S8D).
In summary, deletions and epigenetic silencing via meth-ylation combine to cause loss-of-function mutations of thehuman ATOH1 locus in primary human cancers. Togetherwith loss-of-function evidence in five independent cancermodels in human cells, Drosophila, and mouse, these data
strongly support a role for the Ato/ATOH1 transcriptionfactors as key modulators of oncogenic transformation.
ATOH1 Functions via JNK-Dependent Inhibition of the CellCycle and Induction of ApoptosisTo better understand the role that ATOH1 plays in cancer,
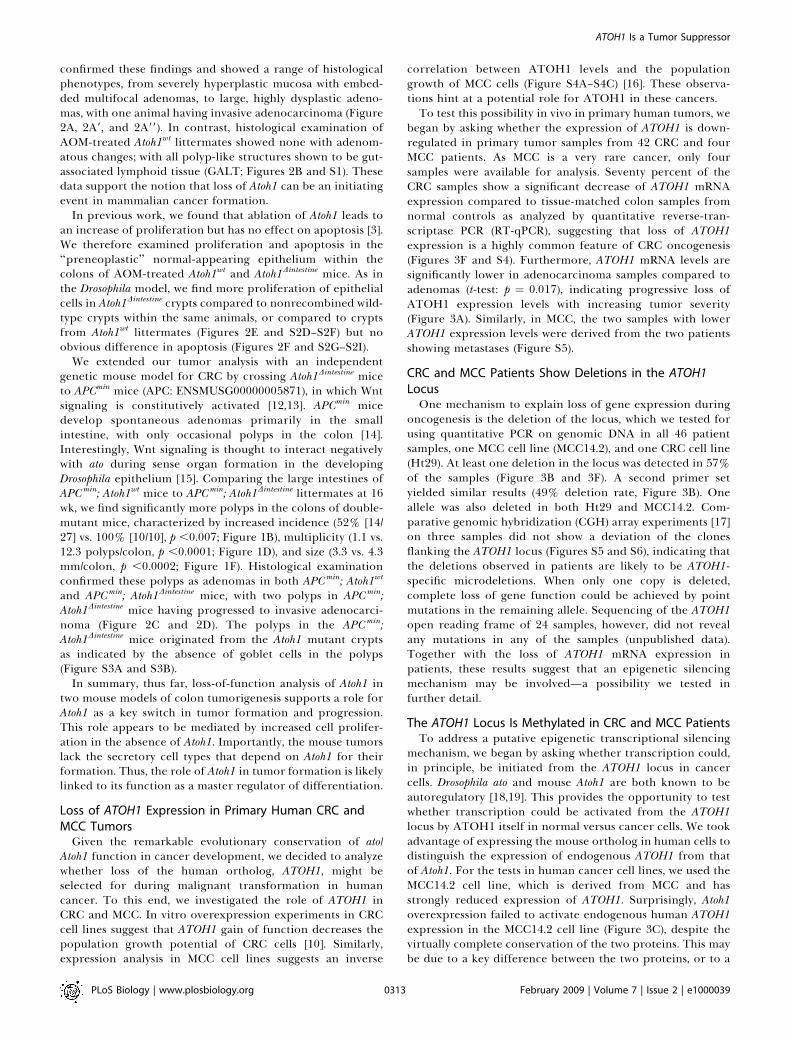
we sought to determine the molecular mechanism by which itacts to suppress the formation and progression of tumors.Gain- and loss-of-function analyses point to Atoh1-dependentregulation of proliferation in mouse colon tumors (Figures 2Eand S3D–S3F). Analysis of the role of Drosophila ato in flyretinal tumors [7] shows that this function is mediated by theJNK signaling pathway. We hypothesized that the Ato-JNK-p21 pathway may mediate the tumorigenic phenotype in ourmouse models of CRC as well. If loss of ATOH1 were indeedan initiating event in tumor formation, we reasoned that theeffects of Atoh1 function would have to be detectable inpreneoplastic tissue as this is where oncogenesis begins. Wetherefore first examined the expression levels of Atoh1,Cdkn1a (p21 , ENSG00000124762) , Cdkn1b (p27 ,ENSG00000111276), and Cdkn1c (p57, ENSG00000129757)and the JNK target cJun (ENSG00000177606) in colon cryptsisolated from Atoh1wt and Atoh1Dintestine mice (Figure 4A). Weobserve a 6.8-fold reduction in Atoh1 expression and anapproximately 2.8-fold reduction in expression of all threeCdkn1 isoforms in colon crypts from Atoh1Dintestine mice. Wealso observe a similar reduction in cJun mRNA levels. Wefurther examined the Ato-JNK-Cdkn1 pathway by immuno-blotting proteins from colon polyps and normal-appearingcolon tissue from APCmin /þ; Atoh1wt and APCmin /þ; Atoh1Dintestine
mice. Colon polyps show higher levels of cJun and p21waf
protein compared to normal colonic tissue. Importantly,however, we find a reduction in cJun levels in APCmin /þ;Atoh1Dintestine polyps compared to APCmin /þ; Atoh1wt polyps,consistent with the mRNA analysis showing less cJun (Figure4B). Importantly, we find a reduction in p27 protein and atrend toward less p21 in Atoh1-mutant colon tissues andpolyps, consistent with our analysis of mRNA levels (Figure4B). We also find a specific reduction in pJNK1 levels(Figure 4C) in APC min /þ; Atoh1wt versus APC min /þ;Atoh1Dintestine tissues, in agreement with earlier reports thatJNK1 (MAPK8: ENSG00000107643) may have anti-oncogenicactivity in the mouse intestine [21], whereas JNK2 (MAPK9:ENSG00000050748) deficiency enhances tumorigenesis inother epithelia [22]. Finally, we examined the pattern ofJNK activation in the colon of Atoh1wt and Atoh1Dintestine mice,and observe identical numbers of pJNK1/2-positive cells inAtoh1-null compared to control crypts (Figure S9). Togetherwith western blot analysis demonstrating selective reductionin pJNK1, but not pJNK2, our data suggest that the level ofpJNK1 in individual crypt cells is decreased upon loss ofAtoh1. These data are consistent with a preneoplasticfunction of Atoh1 in regulating proliferation, by a JNK-dependent induction of cell cycle inhibitors.Next we asked whether the molecular mechanism of
ATOH1 function in human cancer is similar to the mouse.We took advantage of several established MCC cell lines[23,24] with either high ATOH1 expression (MCC1 and MCC6,derived from less aggressive tumors) or low ATOH1 expres-sion (MCC13, MCC14.2, and MCC26, derived from highlyaggressive metastatic tumors; Figure S4A and S4C). We findthat the growth rate of cell lines, measured as their doubling
PLoS Biology | www.plosbiology.org February 2009 | Volume 7 | Issue 2 | e10000390316
ATOH1 Is a Tumor Suppressor
time, correlates inversely with levels of ATOH1 expression(Figure S4B). To determine whether the reduction in ATOH1levels might be causal to decreased doubling time, werestored ATOH1 function by creating stable cell linesexpressing Atoh1 using lentiviral vectors (Figure 5A and 5B).Stable Atoh1-expressing cell lines (MCC14.2-Atoh1.1a,MCC14.2-Atoh1.1b, MCC14.2-Atoh1.2a, and MCC14.2-Atoh1.2b) have a significantly slower population doublingtime compared to control cell lines (MCC14.2 and MCC14.2-GFP; p ,0.0001; Figure 5C). To assess whether this increase indoubling time reflects decreased malignancy, we tested thesecell lines for growth in soft agar. Cell lines with high levels ofAtoh1 expression display a marked decrease in growth in softagar compared to control cell lines (Figure 5D, p , 0.001).The change in population doubling time could be due to aslower cell cycle, an increased apoptotic rate, or both.
Although the distribution of cells in the cell cycle appearsunaltered (Figure S10A), the speed of the cell cycle is 25%lower in Atoh1-expressing cells, as assayed by BrdU pulse-chase experiments (Figure 5E, p ,0.01).In addition to slower proliferation, we find a specific and
strong increase in apoptotic cell death, asmeasured by annexin-V and cleaved caspase-3 (ENST00000308394), inMCC (MCC14.2series) and CRC (Ht29) cell lines transduced or transfected withAtoh1 (Figures 6A, 6B, and S10B). This increase in cell death ismediated by the intrinsic apoptosis pathway, as suggested byenhanced caspase-9 (ENST00000333868) cleavage (Figure 6Aand 6B).Data from mouse models indicate an involvement of JNK-
mediated regulation of cell proliferation for the tumorsuppressor effect of Atoh1. To assess whether the samemechanisms are operating in human cancer, we tested the
Figure 4. JNK Pathway Influenced by Atoh1
(A) Gene expression analysis in colon crypts from Atoh1Dintestine and Atoh1wt mice. Quantitative RT-PCR was used to assess gene expression in isolatedcolon crypts. The ratio of gene expression is shown, in which negative numbers indicate reduced expression in Atoh1Dintestine crypts. t-tests determinedp-values shown for each gene.(B) Western analysis of p27kip, p21waf1, and c-JUN in APC min; Atoh1wt, and APC min; Atoh1Dintestine colonic tissues and polyps. Representative colonic tissueand polyp lysates of APC min; Atoh1wt, and APC min; Atoh1Dintestine were used for western analysis of p27kip, p21waf1, and c-JUN. Actin was used a loadingcontrol. p21waf1 was significantly up-regulated in polyps compared to nonneoplastic colon tissue. c-Jun protein levels were significantly reduced incolonic polyps upon Atoh1 loss. p27 is down-regulated in preneoplastic colonic tissue upon loss of Atoh1. Quantifications are shown in Figure S12A–S12C.(C) Representative tissues were used for Western analysis of phosphorylated JNK1 and JNK2. Total JNK1 and JNK2 are shown as control. Actin loadingcontrol is shown below. pJNK1, but not pJNK2, was significantly reduced in colon tissue from Atoh1Dintestine compared to Atoh1wt mice. Quantificationsare shown in Figure S12D1–S12D29.doi:10.1371/journal.pbio.1000039.g004
PLoS Biology | www.plosbiology.org February 2009 | Volume 7 | Issue 2 | e10000390317
ATOH1 Is a Tumor Suppressor

expression levels of the caspase-3 and caspase-9, p21waf1, andp-JNK in MCC and CRC cells lines. We note a clear andspecific up-regulation of p21waf1 and p-JNK levels upon Atoh1expression (Figures 6A, 6B, and S10C–S10H). Similarly,transfection of wild-type Drosophila Ato results in the up-regulation of cleaved caspase-3, p21waf1, and p-JNK (Figure6C), in contrast to a null-mutant form of the protein thatcompletely fails to bind DNA [25], indicating the conserva-tion and specificity of the Ato/Atoh1 effect.
Next, we tested the expression of these proteins in a loss-
of-function setting. We generated and expressed the tran-scriptional repressor form of ATOH1 by fusing it to theengrailed repressor domain (ATOH1ERD) [26], which specif-ically inhibits the Atoh1-induced effects on MCC cell lines(Figure 6D). In the MCC1 cell line, which shows higherendogenous ATOH1 expression compared to MCC14.2(Figure S4C), expression of ATOH1ERD leads to a down-regulation of p21waf1 and p-JNK as well as inhibition ofcaspase-3 cleavage (Figure 6E).In summary, gain- and loss-of-function studies in mouse
Figure 5. ATOH1 Suppresses Growth by Interfering with the Cell Cycle
(A) Constructs used for creating lentiviral and transfection vectors.(B) Western blot analysis for Atoh1 and chromogranin on untransduced MCC14.2 cells (lane 1), GFP-transduced MCC14.2 cells (lane 2), and twoindependently derived MCC14.2 cell lines transduced with Atoh1-IRES-eGFP (lane 3: MCC14.2-Atoh1.1a, and lane 4: MCC14.2-Atoh1.2a). Quantificationsin Figure S12E and S12F.(C) Doubling time in hours for MCC14.2 (lane 1), MCC14.2-GFP (lane 2), and four lines independently transduced with Atoh1-IRES-eGFP (lanes 3–6:MCC14.2-Atoh1.1a, MCC14.2-Atoh1.1b, MCC14.2-Atoh1.2a, and MCC14.2-Atoh1.2b, respectively).(D) Assay for growth in soft agar. Colonies per view with a 103 lens, lane 1: MCC14.2, lane 2: MCC14.2-GFP, lane 3: MCC14.2-Atoh1.1a, and lane 4:MCC14.2-Atoh1.2a. Error bars indicate the 25th and 75th percentiles.The triple asterisks (***) in (C and D) indicate a significant difference from MCC14.2 (t-test: p , 0.001).(E) Percentage of cells positively labeled for BrdU and past S-phase in a BrdU pulse-chase experiment; double asterisks (**) indicate p , 0.01 (t-test).doi:10.1371/journal.pbio.1000039.g005
PLoS Biology | www.plosbiology.org February 2009 | Volume 7 | Issue 2 | e10000390318
ATOH1 Is a Tumor Suppressor

colon cancer models and human cancer cells support aconserved antitumor function for ATOH1 mediated by JNKand p21.
ATOH1 Activates RTK Expression in Human Cancer CellsHow does ATOH1 expression lead to JNK activation in
cancer cells? ATOH1 and its orthologs are known to exerttheir developmental functions by modulating Notch; Atonalorthologs inhibit Notch signaling to induce differentiation
during development, whereas Notch inhibits ato expressionby its target gene Hes1 (ENSG00000114315) [27–29]. Notchsignaling has also been described to be upstream of JNK [30].However, three lines of evidence suggest that the Atoh1-mediated effects are not Notch-dependent. First, Atoh1expression levels do not influence expression of HES1, aNotch signaling target gene (Figure S11A). Second, we do notdetect cleaved intracellular Notch in the MCC14.2 cell line,which expresses low levels of ATOH1 (Figure S11B). Finally,
Figure 6. ATOH1 Leads to Activation of Apoptosis and Expression of p21waf1
(A) Western blot analysis for p21waf1, cleaved caspase-3, cleaved caspase-9, and phosphorylated JNK of lysates of MCC14.2 cells, MCC14.2-GFP, and twoMCC14.2 cell lines transduced with Atoh1-IRES-eGFP (MCC14.2-Atoh1.1a and MCC14.2-Atoh1.2a). The corresponding actin loading controls are shownunder each blot. Quantifications are shown in Figure S12G–S12J.(B) Western blot analysis for p21waf1, cleaved caspase-3, cleaved caspase-9, and p-JNK of lysates of Ht29 cell line transfected with pCLIG-eGFP (left lane)or pCLIG-Atoh1-IRES-eGFP (right lane); actin loading controls are shown under the respective blots. Quantifications are shown in Figure S12K–S12N.(C) The molecular changes are specific to functional ato: western blot of lysates of Ht29 cells transfected with CMV-ato, CMV-ato1, or empty vector. Actinloading controls are shown below the respective blots. Quantifications are shown in Figure S12O–S12Q.(D) Graph expressing ratio of cell numbers of MCC14.2-derived cell lines transfected with pMSCV-ATOH1ERD-IRES-eGFP versus cell number of cell linestransfected with pMSCV-IRES-eGFP (vector). Statistical analysis was done using t-test under different conditions compared to MCC14.2. Single asterisk (*)indicates p , 0.05; double asterisks (**) indicate p , 0.01.(E) MCC1 cells transfected with dominant-negative ATOH1ERD fusion (lanes 1 and 2) and with empty vector control (lanes 3 and 4). Western blot analysisfor p21waf1, phosphorylated JNK, and cleaved caspase-3 on lysates of MCC1 cell line. The actin loading control of each blot is shown below.Quantifications are shown in Figure S12R–S12T.doi:10.1371/journal.pbio.1000039.g006
PLoS Biology | www.plosbiology.org February 2009 | Volume 7 | Issue 2 | e10000390319
ATOH1 Is a Tumor Suppressor

blocking of Notch activation by selective inhibition of c-secretase [31] has no effect on the growth of MCC cells(Figure S11C). Other known upstream activators of JNK areRTKs [32]. As Atoh1 is a transcription factor, we checkedmRNA expression of all 90 human RTKs upon Atoh1expression in both the MCC14.2 and the Ht29 cell linecompared to control cells. We observed a significant andspecific Atoh1-dependent up-regulation of Neurotrophictyrosine kinase receptor type 1 (NTRK1: ENSG00000198400),a hallmark for differentiation in Merkel cells [33,34] inMCC14.2, and of FGF receptors in Ht29 (Figure S11D). Theincrease in NTRK1 expression in MCC14.2 seen on themRNA level was confirmed using RT-qPCR (Figure S10E). Wealso observed elevated NTRK1 levels in the endogenouslyATOH1-expressing MCC1 cells (Figure S10E). This wasaccompanied by higher protein levels of both the NTRK1receptor and one of its ligands, Neurotrophin-3 (NT3:ENSG00000185652; Figure S10E–S10H), also a marker for
Merkel cell differentiation. Therefore, Ato gain of functionresults in tumor type–specific elevation of RTK levels.
ATOH1 Functions by RTK-Mediated JNK ActivationTo test whether the RTKs may be functionally linked with
ATOH1, we incubated the various MCC cell lines with K252a,a narrow-specificity RTK inhibitor (NTRK, FGFR, PDGFR,and IGFR) [35–37]. This results in a dose-dependent decreasein doubling time of the MCC14.2-derived, Atoh1-expressingcell lines, indicating that the Atoh1-induced change indoubling time is RTK-dependent (Figure 7A). In addition,the induction of apoptosis by Atoh1 in the MCC14.2 and theHt29 cell line is blocked by RTK inhibition (Figure 7B and7C). These effects are accompanied by RTK inhibitor–dependent decrease in the expression of p21waf1 and p-JNK(Figure 7D), suggesting that both p21waf1 and p-JNK aredownstream effectors of Atoh1-induced RTK signaling. Next,we asked whether p-JNK is required for p21waf1 up-regulationand apoptosis by treating MCC cells with SAPK Inhibitor II, a
Figure 7. Molecular Mechanism for ATOH1 Function
(A–D) show that ATOH19s anti-oncogenic function acts through receptor tyrosine kinases. (A) Doubling times in hours of MCC14.2 and MCC14.2transduced with eGFP (lane 2) or Atoh1-IRES-eGFP (lanes 3 and 4) with increasing concentrations of K252a. (B) AnnexinV-positive signals normalized totransfected MCC14.2 cells (GFP). Cells transduced with eGFP (lanes 1 and 2) and Atoh1-IRES-eGFP (lanes 3 and 4) with 0.33 lM K252a (lanes 2 and 4) orDMSO as a control (lanes 1 and 3). The double asterisks (**) indicate significant difference from GFP transfected without K252a (t-test: p , 0.05). (C)AnnexinV-positive signals normalized to transfected Ht29 cells (GFP). Cells transfected with eGFP (lanes 1 and 2) and Atoh1-IRES-eGFP (lanes 3 and 4)with 0.33 lM K252a (lanes 2 and 4) or DMSO as control (lanes 1 and 3). The double asterisks (**) indicate significant difference from GFP transfectedwithout K252a (t-test: p , 0.05). (D) Inhibition of RTKs inhibits p21waf1 expression and JNK phosphorylation. Western blot analysis for p21waf1 and pJNKof MCC14.2 (lanes 1 and 5), MCC14.2 transduced with eGFP (lanes 2 and 6), and two MCC14.2-derived cell lines transduced with Atoh1-IRES-eGFP (lanes3, 4, 7, and 8) with 0.3 lM K252a (lanes 1–4) and with DMSO as a control (lanes 5–8). Actin loading controls are shown below each blot. Quantificationsare shown in Figure S12U and S12V.(E) JNK regulates apoptosis and p21waf1 expression. Western blot analysis for p21waf1 and cleaved caspase-3 of MCC14.2 (lanes 1 and 5), MCC14.2transduced with eGFP (lanes 2 and 6), and two MCC14.2-derived cell lines transduced with Atoh1-IRES-eGFP (lanes 3, 4, 7, and 8) with 1 lM JNK inhibitor(lanes 1–4) and with DMSO as a control (lanes 5–8). Actin loading control is shown below the blots. Phospho-JNK (P-JNK) blot shows the effect of theJNK inhibitor on JNK phosphorylation status Quantifications are shown in Figure S12W–S12Y.(F) Relative cell numbers (the number of Tam67-transfected cells divided by the number of mock-transfected cells) for MCC14.2 and MCC14.2transduced with eGFP (lane 2) or Atoh1-IRES-eGFP (lanes 3 and 4) with dominant-negative c-jun (TAM67).doi:10.1371/journal.pbio.1000039.g007
PLoS Biology | www.plosbiology.org February 2009 | Volume 7 | Issue 2 | e10000390320
ATOH1 Is a Tumor Suppressor
specific JNK inhibitor [38]. We observed a decrease in theAtoh1-induced expression of p21waf1 and cleaved caspase-3(Figure 7E). Similarly, transfection of dominant-negative c-jun(TAM67) [39] leads to a significant increase in cell numbercompared to mock-transfected cells (t-test: p ¼ 0.04),specifically in the MCC14.2-Atoh1.2a, which has high Atoh1expression levels (Figure 7F).
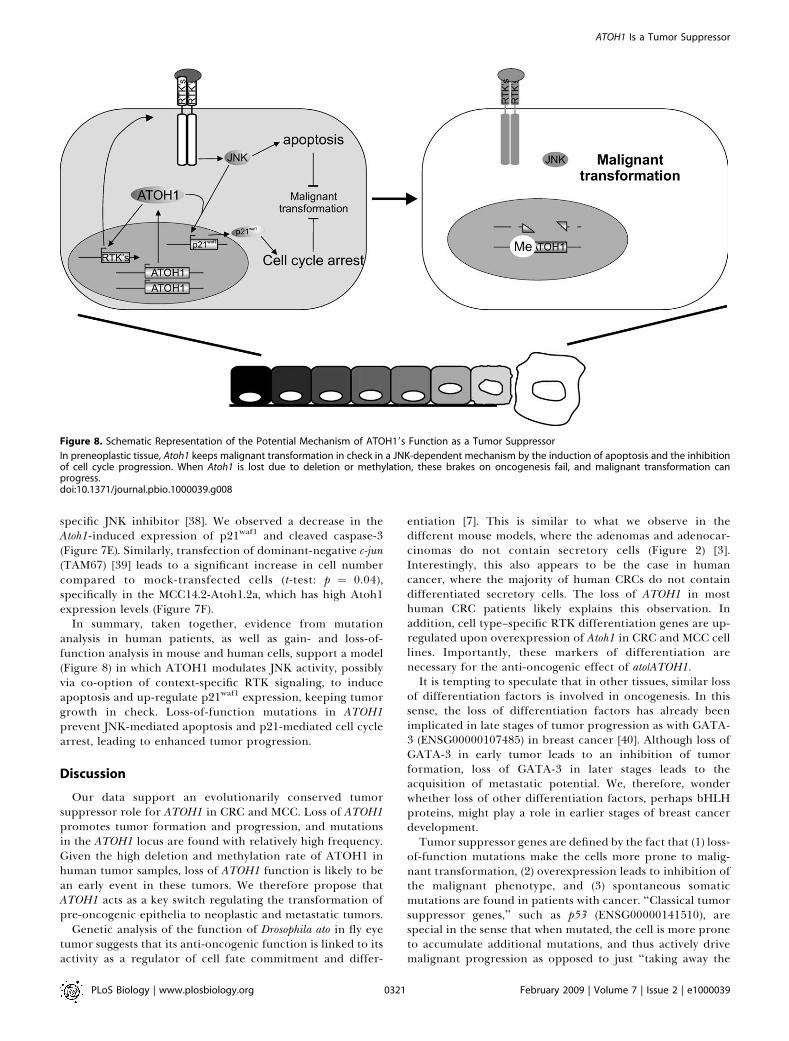
In summary, taken together, evidence from mutationanalysis in human patients, as well as gain- and loss-of-function analysis in mouse and human cells, support a model(Figure 8) in which ATOH1 modulates JNK activity, possiblyvia co-option of context-specific RTK signaling, to induceapoptosis and up-regulate p21waf1 expression, keeping tumorgrowth in check. Loss-of-function mutations in ATOH1prevent JNK-mediated apoptosis and p21-mediated cell cyclearrest, leading to enhanced tumor progression.
Discussion
Our data support an evolutionarily conserved tumorsuppressor role for ATOH1 in CRC and MCC. Loss of ATOH1promotes tumor formation and progression, and mutationsin the ATOH1 locus are found with relatively high frequency.Given the high deletion and methylation rate of ATOH1 inhuman tumor samples, loss of ATOH1 function is likely to bean early event in these tumors. We therefore propose thatATOH1 acts as a key switch regulating the transformation ofpre-oncogenic epithelia to neoplastic and metastatic tumors.
Genetic analysis of the function of Drosophila ato in fly eyetumor suggests that its anti-oncogenic function is linked to itsactivity as a regulator of cell fate commitment and differ-
entiation [7]. This is similar to what we observe in thedifferent mouse models, where the adenomas and adenocar-cinomas do not contain secretory cells (Figure 2) [3].Interestingly, this also appears to be the case in humancancer, where the majority of human CRCs do not containdifferentiated secretory cells. The loss of ATOH1 in mosthuman CRC patients likely explains this observation. Inaddition, cell type–specific RTK differentiation genes are up-regulated upon overexpression of Atoh1 in CRC and MCC celllines. Importantly, these markers of differentiation arenecessary for the anti-oncogenic effect of ato/ATOH1.It is tempting to speculate that in other tissues, similar loss
of differentiation factors is involved in oncogenesis. In thissense, the loss of differentiation factors has already beenimplicated in late stages of tumor progression as with GATA-3 (ENSG00000107485) in breast cancer [40]. Although loss ofGATA-3 in early tumor leads to an inhibition of tumorformation, loss of GATA-3 in later stages leads to theacquisition of metastatic potential. We, therefore, wonderwhether loss of other differentiation factors, perhaps bHLHproteins, might play a role in earlier stages of breast cancerdevelopment.Tumor suppressor genes are defined by the fact that (1) loss-
of-function mutations make the cells more prone to malig-nant transformation, (2) overexpression leads to inhibition ofthe malignant phenotype, and (3) spontaneous somaticmutations are found in patients with cancer. ‘‘Classical tumorsuppressor genes,’’ such as p53 (ENSG00000141510), arespecial in the sense that when mutated, the cell is more proneto accumulate additional mutations, and thus actively drivemalignant progression as opposed to just ‘‘taking away the
Figure 8. Schematic Representation of the Potential Mechanism of ATOH19s Function as a Tumor Suppressor
In preneoplastic tissue, Atoh1 keeps malignant transformation in check in a JNK-dependent mechanism by the induction of apoptosis and the inhibitionof cell cycle progression. When Atoh1 is lost due to deletion or methylation, these brakes on oncogenesis fail, and malignant transformation canprogress.doi:10.1371/journal.pbio.1000039.g008
PLoS Biology | www.plosbiology.org February 2009 | Volume 7 | Issue 2 | e10000390321
ATOH1 Is a Tumor Suppressor

brakes’’ [41]. It is notable that ato/Atoh1 shows most of thehallmarks of a tumor suppressor gene. Because silencing ofato/Atoh1 is not sufficient to drive oncogenesis, we suggest thatato/Atoh1, and similar genes, are important brakes onmalignant transformation. Therefore, the role that differ-entiation factors might play as key switches in malignanttransformation in different tissues is not different from theclassical definition of tumor suppressor in a functionallyrelevant sense.
The RTK and JNK signaling pathways, which are essentialfor Atoh1’s tumor suppressor activity, have been suggested ascontext-dependent oncogenes or tumor suppressors [42]. Ourdata indicate that Atoh1 is important in deciding this contextby the up-regulation of cell type–specific RTKs. Theactivation and co-option of RTK and JNK signaling by Ato/ATOH1 in this context suggests that the status of differ-entiation of the tumor-initiating cell may be the keydeterminant of the specific role of various signaling pathwaysin cancer. This may have important clinical implications:treatment of CRC or MCC patients with RTK or JNKinhibitors might have an adverse effect on tumors whereATOH1 is still expressed.
In this medical context, our data suggest that screening forATOH1 expression, deletion, and methylation may be a usefuldiagnostic tool for early detection and treatment decision ofMCC and CRC. Similarly, treatment of CRC and MCCpatients whose tumors show epigenetic silencing of ATOH1with DNA methyltransferase inhibitors might prove a power-ful avenue for therapy, because it appears to be sufficient torestore ATOH1 expression and induce cancer cell death.Furthermore, such treatment in combination with Notchinhibitors may enhance re-expression of the ATOH1-drivendifferentiation program [43,44] and synergistically inhibitcancer growth. Therefore, elucidation of the basic mecha-nisms of ato/ATOH1 function, as well as their target genes andinteracting proteins, might offer potential avenues for futuretherapeutic intervention.
Materials and Methods
Cloning of ATOH1ERD expression construct. The ATOH1 openreading frame was PCR amplified and fused in frame with theengrailed repressor domain after XhoI restriction digest. This fusionproduct was then blunt ligated in the MSCV-IRES-GFP vector(Clontech), giving rise to the MSCV-ATOH1ERD-IRES-GFP construct.
Mouse models and treatments. Atoh1Dintestine mice are a conditionaldeletion of Atoh1 and are described in more detail elsewhere [3,45].These mice were generated using the loxP/cre system in which Cre-mediated deletion of Atoh1 is mosaic and is restricted to the distalileum and large intestine (80%–90% deletion). APCmin mice werepurchased from The Jackson Laboratory and mated with Atoh1Dintestine
mice to generate APCmin; Atoh1Dintestine mice. Eight-week-old maleAtoh1wt and Atoh1Dintestine littermates were injected intraperitoneallywith AOM (Midwest Research Institute of the National CancerInstitute’s chemical carcinogen repository) at 10 mg/kg body weight.AOM was injected weekly for a total of six injections, and the micewere sacrificed 20 wk after the first AOM injection. Two hours priorto sacrifice, mice were injected with 50 mg/kg BrdU. The largeintestine was isolated and flushed with PBS and then fixed in 10%buffered formalin at room temperature for 16–24 h. Colons wereplaced in 70% ethanol before macroscopic analysis of polyps, andthen embedded into paraffin blocks. Similarly, 16–19-wk-old APCmin
and APCmin; Atoh1Dintestine colons were isolated and fixed as for theAOM-treated colons. For macroscopic analysis, the position anddiameter (millimeters) of each polyp were recorded using a dissectingmicroscope. The protocol for use of animals was approved by theCincinnati Children’s Hospital Institutional Animal Care and UseCommittee.
Immunohistochemistry and microscopic analysis. The colons wereimbedded in paraffin blocks and sectioned for hematoxylin and eosinstaining by the University of Cincinnati pathology core facility.Tumor phenotypes were determined as in Boivin et al. (2003) [46].Paraffin-embedded colons of AOM-treated mice were sectioned at 5lm and used for BrdU and cleaved caspase-3 staining. Mouse anti-BrdU antibodies were obtained from the Developmental StudiesHybridoma Bank maintained by the Department of BiologicalSciences of the University of Iowa. The sections were de-paraffinized,rehydrated, and antigen retrieval was performed in citric acid buffer(pH ¼ 6) using a microwave. Endogenous peroxidase activity wasblocked with hydrogen peroxide/methanol solution, and Avidin/Biotin block was performed according to the manufacturer’srecommendations (Vector Laboratories). Endogenous immunoglobu-lins block and primary and secondary antibody incubations wereperformed using the M.O.M. kit following the manufacturer’srecommendations (Vector Laboratories). Anti-BrdU antibody wasincubated for 16 h at 4 8C in a humidified chamber. Color wasdeveloped using the DAB peroxidase substrate kit (Vector Labora-tories) followed with hematoxylin staining and dehydration of thetissues. Nuclei from well-oriented crypts in Atoh1wt and Atoh1Dintestine
colons were counted at 403 magnification, followed by counts ofBrdU-positive cells. The percent of BrdU-positive Atoh1wt or Atoh1-null cells was determined for each animal (at least 1,000 cells pergenotype were counted for each animal). Student two-tailed t-test wasperformed to measure significance. Cleaved caspase-3 staining andcounting were performed similarly to BrdU staining and analysis.Polyclonal rabbit anti–cleaved caspase-3 antibodies (1:100) wereobtained from Cell Signaling Technology. The Rabbit IgG VECTAS-TAIN ABC kit was used according to the manufacturer’s recom-mendations for blocking, antibody incubations, and signalamplification (Vector Laboratories).
Crypt preps. Crypts from wild-type and Atoh1Dintestine mice wereisolated using a modification of the Evans method [47,48]. Mice weresacrificed and the colons removed and flushed with ice-cold PBS,opened flat, and then placed in cold PBS containing protease andphosphatase inhibitors. After a brief vortexing, the colon was cut intofour pieces and placed into a 15-ml tube containing shaking solution(1.5 mM KCL, 96 mM NaCl, 27 mM Na Citrate, 8 mM KH2PO4, 5.6 mMNa2HPO4, 15 mM EDTA, and 1 mM dithiothreitol supplemented withprotease and phosphatase inhibitors). The tubes were agitated at 4 8Con a vortexer holding the tubes at 1808 until the solution appearedcloudy (5–8 min). The colon pieces were transferred into new tubeswith shaking buffer and agitated until most of the crypts werereleased (enrichment was assessed by phase contrast microscopy atdifferent time points). The solution containing the crypts was filteredthrough a 100-lm cell strainer to isolate the crypts, and sorbitol (2%final concentration) was slowly added and mixed immediately. Thesolution was centrifuged at 160g for 8 min at 4 8C. The supernatant(containing single cells) was removed, and the pellet (containingpurified crypts) was snap frozen in liquid nitrogen, to be used forprotein and RNA analyses.
Quantitative reverse-transcriptase polymerase chain reaction. RNAwas purified from colon crypts isolated from wild-type andAtoh1Dintestine mice using Trizol (Invitrogen) according to themanufacturer’s recommendations. Trizol-purified RNA (100 lg) wassubjected to DNase digestion and further purification (RNeasy Mini;Qiagen); 2 lg of total RNA was reverse transcribed (Superscript III,Invitrogen), and cDNA equivalent to 100 ng of RNA used for SYBRGreen–based real-time PCR using an Mx3005 (Stratagene). For eachgene assessed, colon crypt RNA from nine wild-type and eightAtoh1Dintestine mice was compared using the standard curve method ofrelative quantification. All gene expression levels were normalized tothe expression of GAPDH. t-Tests measured significant differencesbetween the average normalized expression levels in wild-type versusAtoh1Dintestine mice.
Whole-tissue/polyp preparations. Cecal and colonic tissues fromwild-type and Atoh1Dintestine mice were homogenized in lysis buffer (13Phosphate Buffered Saline, 1% NP-40, 0.5% sodium deoxycholate,0.1% SDS, 0.7 mM EDTA supplemented with protease andphosphatase inhibitors), sonicated, and the lysates used for quanti-tation and western blots. Similarly, lysates of colonic tissues andpolyps from APCmin, and APCmin; Atoh1Dintestine double-mutant micewere used for whole lysate preparation and western blots. Thefollowing antibodies were used for western blot analysis: p21waf1
mouse monoclonal antibody (1:500, cat #556431; BD Pharmingen),actin mouse IgM antibodies (1:100, JLA20; Developmental StudiesHybridoma Bank), mouse monoclonal p27kip1 antibody (1:250, cat#610241; BD Transduction Laboratories), goat anti-p57 polyclonalantibodies (1:100, cat # sc-1039; Santa Cruz Biotechnology), rabbit
PLoS Biology | www.plosbiology.org February 2009 | Volume 7 | Issue 2 | e10000390322
ATOH1 Is a Tumor Suppressor

polyclonal c-Jun antibodies (1:1000, cat # sc-1694; Santa CruzBiotechnology), and pJNK antibody (1:1000, cat #559309; EMD-Calbiochem).
pJNK IHC. Formalin-fixed tissues from AOM-treated mice wereused for phosphorylated-JNK (pJNK) immunohistochemistry. Rabbitpolyclonal pJNK antibody was used (1:100, cat #559309; EMD-Calbiochem). The sections were de-paraffinized, hydrated, and theantigen retrieval was performed in citric acid buffer using amicrowave. Endogenous peroxidase activity was blocked with hydro-gen peroxide/methanol solution, a short remobilization step wasincluded (0.2% Triton X 100 in PBS), and Avidin/Biotin block wasperformed according to the manufacturer’s recommendations(Vector Laboratories). The Rabbit IgG VECTASTAIN ABC kit wasused according to the manufacturer’s recommendations for blockingand antibody incubations (Vector Laboratories). Primary antibodywas incubated at 4 8C for 14–16 h; color was developed using the DABperoxidase substrate kit (Vector Laboratories) followed by hematox-ylin staining and coverslipping. Cells of well-oriented crypts in wild-type and Atoh1Dintestine colons were counted at 403 magnifications,followed by counts of pJNK-positive cells. The total number of cellsand pJNK-positive cell numbers were added for each animal, and theaverage numbers were compared across crypts and animals. AStudent t-test was performed to measure significance.
Cell culture. MCC cell lines were cultured in RPMI mediumsupplemented with 15% FCS (Perbio). The Ht29 cell lines (obtainedfrom Deutsche Sammlung von Mikroorganismen und Zellkulturen[DSMZ]) were cultured in McCoy medium supplemented with 10%FCS. Primary human keratinocytes were isolated and pooled fromforeskins of three different donors (less than 6 y). Fourth passage cellswere used in the experiments. The procedure has been approved bythe ethical committee of the University of Leuven. Experimentsperformed adhered to the Declaration of Helsinki Principles.Keratinocytes were seeded in serum-free and growth factor–contain-ing medium (Keratinocyte-SFM; Invitrogen), which contains severalgrowth factors (5 lg/ml insulin, 74 ng/ml hydrocortisone, 6.7 ng/mltriiodo-L-thyronine, 50 lg/ml bovine pituitary extract, and 5 ng/mlhuman recombinant EGF). All culture experiments were done at 378C in 5% CO2.
Doubling time. A fixed amount of cells was seeded in standardculture conditions, and the number of cells was counted after 3 to 5 d.The doubling times (T2X) were calculated using the formula T2X ¼LN(2)/((LN(nDt)-LN(n0))/Dt) with Dt, time in culture, n0, number ofseeded cells, and nDt the number of cells after Dt
Lentiviral vectors. The lentiviral vector HIV-CMV-Atoh1-IRES-GFP was constructed by cloning a PCR fragment of Atoh1-IRES intothe HIV-CMV-GFP vector [49], which was used as control vector. TheHIV-CMV-GFP vector was first restricted with XbaI and Age1, andligated to the Atoh1-IRES fragment, which was spanned betweenXba1 and Age1. The Atoh1 and GFP were expressed from abicistronic vector under the control of the CMV promoter. Theselentiviral vectors were produced as described in [50,51]. Stable celllines were created by transducing the cells in normal medium,supplemented with 8 nM polybrene and a multiplicity of infectionbetween 100 and 150). Four stable cell lines were made with thelentiviral vectors expressing Atoh1 and eGFP from a bicistronicAtoh1-IRES-eGFP construct (MCC14.2-Atoh1.1a, MCC14.2-Atoh1.1b,MCC14.2-Atoh1.2a, and MCC14.2-Atoh1.2b), and one with eGFPalone (MCC14.2-GFP) as a negative control, under the control of aCMV promoter (Figure 5A). We failed to created stable cell lines fromthe Ht29. Cells were heavily selected against, and FACS isolation didnot yield surviving cells.
Colony formation in soft agar. A total of 2,500 cells/ml wereresuspended in 0.6% agarose (Invitrogen) in culture medium. A 2-mllayer of 0.35% agarose in culture medium was added on top of the 2-ml 0.6% layer. After 1 wk, 2 ml of 0.35% agarose in culture mediumwas added. Cells were cultured for 2 wk in standard conditions, andthe number of colonies was analyzed under an inverted microscopewith a 103 magnification. The experiment was done in triplicate.
Cell cycle distribution and progression. Cells were grown up to40% confluency under standard conditions and were trypsinized.Cells were fixed and permeabilized using 70% ice-cold ethanol for 2h. Cells were washed in PBS, and cells were stained for 30 min using0.1% (v/v) Triton X-100 (Sigma) in PBS and 0.2 mg/ml DNase-freeRnase A (Sigma) and 20 lg/ml PI (Sigma). Cells were analyzed on aFACSCalibur cytometer (BectonDickinson). To analyze the cell cycleprogression, cells were pulsed for 20 min with 10 lM BrdU (Sigma).Medium was then substituted with normal medium for 6 h. Cells werecollected and fixed in 70% ice-cold ethanol. DNA was denaturedusing 2 M HCl for 20 min. Cells were stained using anti-BrdU andIgG-alexa555 and analyzed in a FACSCalibur (BD Bioscience).
Apoptosis detection. Annexin-V staining was performed usingAnnexin-V-biotin (Roche) and streptavidin-PercP (BD biosciences) asdescribed by the manufacturer. Cells were imaged with the Leica TCSSp2 confocal microscope, and images were analyzed and quantifiedusing LCS software.
Western blotting. Lysates were obtained by scraping cells inmedium and centrifuging the medium. The pellet was resuspended inlysis buffer containing PBS with 1 mM EDTA, 1 mM EGTA, 50 mMNaF, 1% TritonX, 5 mM Na3VO4, 20 lM PAO, and Complete ProteaseInhibitor. The crude extract was separated by SDS-PAGE in a 4%–12% NuPAGE novex bis-tris gel (Invitrogen) and electroblotted ontoHybond-ECL membrane (Amersham). Antibodies were diluted in theappropriate concentrations in 5% BSA in TBS-tween20. Theantibodies used are beta-actin (clone AC-15; Sigma), anti–cleavedcaspase-3 (Asp-175; Cell Signaling Technology), polyclonal antibodyto caspase-9(active) (ALEXIS), chromogranin AþB (Abcam), cyclinA1(Santa Cruz Biotechnology), pJNK (Thr183/Tyr185; BioSource), p27(BD Bioscience), p21waf1 (DCS60; Cell Signaling Technology), PCNA(clone PC10; Sigma), TRK (Santa Cruz Biotechnology), Atoh1 (1/50;Developmental Studies Hybridoma Bank), NT3 (Santa Cruz Bio-technology), and Cleaved Notch (Val1744; Cell Signaling Technology).All western blot analyses are quantified in Figure S11.
Tyrosine kinase inhibitor, SAPK inhibitor II, and c-secretaseinhibitor. K252a diluted in DMSO, from VWR, and DMSO as controlwere used. Final concentrations ranged from 0 lM to 0.5 lM; when noconcentration is mentioned, 0.33 lM was used. SAPK inhibitor II,from Calbiochem, was used at a concentration of 10 lM. We usedinhibitor X as a c-secretase inhibitor (Calbiochem). Concentrationsused are mentioned in the figure legend.
RT-PCR and qPCR. mRNA was amplified using the Superscript IIOne-Step RT-PCR system with Platinum Taq-100 reactions (Invitro-gen) and the ATOH1 primers CAGCCAGTGCAGGAGGAAAA andGAAAATTCCCCGTCGCTTCT, and the Hes1 primers GGA-CATTCTGGAAATGACAGTGAA and AGCGCAGCCGTCATCTG,according to the manufacturer’s protocol. Quantitative RT-PCR wasperformed on a ABI prism 7000 (Applied Biosystems). The primerswere designed using Primer Express (Applied Biosystems). Theprimers used are ATOH1: CAGCCAGTGCAGGAGGAAAA andGAAAATTCCCCGTCGCTTCT; Atoh1: GCTGTGCAAGCTGAAGGGand TCTTGTCGTTGTTGAAGG. Primers to check copy number ofthe ATOH1 locus: ATOH1 locus set 1: CCCCGGGAGCAATCTTG andGGGACCGAGGCGAAGTT; control locus set 1: TCTGGGACCT-GAGCTAATGGA and GGCCATAATTAGGACCATGAAAGA; andATOH1 locus set 2: GCCAGTGCAGGAGGAAAACA andGAAAATTCCCCGTCGCTTCT . Con t ro l l o cu s s e t 2 :GGGTTCAGCCTCAACTTGTATCC and CCCACCACCTGG-CATCTCT.
The 90 kinase RT-PCR assay. RNA was diluted to 300 lg/ll andtreated with TURBO DNA-free (Ambion) following the manufac-turer’s protocol. cDNA was synthesized using random primers andSuperscriptII reverse transcription (Invitrogen) using the manufac-turer’s protocol. cDNA was amplified using gene-specific primers(concentration 5 lM) for the different human tyrosine kinases.
Methylation detection. Methylation of the DNA was detected usingApaI enzyme. DNA (2 lg) was dissolved in 50 ll of the appropriatebuffer and 10 U of ApaI, and incubated at 30 8C overnight. A mirrorcondition was done in which the ApaI was exchanged by glycerol as acontrol for unspecific degradation. The resulting DNA was analyzedusing two primer sets: one set spanning the restriction site(AATAAGACGTTGCAGAAGAG and TCGCAGAGCAAAAAT-TAAAGGGTGC) and another set next to the restriction site(CCCCGGGAGCATCTTGCAGCCA and TCGCAGAGCAAAAAT-TAAAGGGTGC).
Pull-down of methylated DNA fragments (restricted using EcoRI)was performed using the Methylcollector kit (Active Motif), andbisulfite modification of DNA was done using the EZ DNAMethylation-Gold kit (Zymo Research) according to the manufac-turers’ protocols.
Array CGH. We carried out array CGH using Code Linked Slides(AP Biotech) containing the 3,527 BAC clones from the WellcomeTrust Sanger Institute 1 Mb Clone Set, a gift from N. P. Carter (TheWellcome Trust Sanger Institute). Array CGH was performed asdescribed [17].
Sequencing. The ATOH1 open reading frame was amplified withPCR using AATAAGACGTTGCAGAAGAG and TCGCAGAG-CAAAAATTAAAGGGTGC and AmpliTaq Gold DNA polymeraseand the GeneAmp PCR System 2400 (Applied Biosystems). The PCRproducts were purified and sequenced in both directions on the ABIPrism BigDye (Terminator Cycle Sequencing Kit version 1.1) on anABI PRISM 3100 Genetic Analyser (Applied Biosystems).
PLoS Biology | www.plosbiology.org February 2009 | Volume 7 | Issue 2 | e10000390323
ATOH1 Is a Tumor Suppressor
Supporting Information
Figure S1. Gut-Associated Lymphoid Tissues in AOM-Treated Atoh1wt
Mice
The colons of AOM-treated Atoh1wt mice showed large GALT thatwere macroscopically counted as polyps; shown is 53magnification ofrepresentative colonic GALTs. GALT indicated by an arrow.
Found at doi:10.1371/journal.pbio.1000039.sg001 (726 KB PDF).
Figure S2. Histology of Polyps in APCmin Background
(A) Polyps in the APCmin background still have goblet cells, indicatingthat Atoh1 is still active.(B) The polyps in the APCmin; Atoh1Dintestine mice originate in Atoh1mutant tissue as seen by the absence of goblet cells.
Found at doi:10.1371/journal.pbio.1000039.sg002 (4.70 MB PDF).
Figure S3. Representative Normal-Appearing Crypts in AOM-Treated Atoh1wt and Atoh1Dintestine Colons
AOM-treated colon sections with well-oriented crypts were used forBrdU and cleaved caspase-3 (c-Caspase 3) counting. The genotypes ofthe representative slides are indicated on the left side of the figure.The specific stain is identified at the top part of the figure. Atoh1wt
(WT) crypts were distinguished from Atoh1-null crypts by the lack ofthe secretory goblet cells in the null crypts.(A–C) Hematoxylin and eosin (H & E) staining of Atoh1wt crypts inAtoh1wt mice (A); and nondeleted Atoh1wt (B) and Atoh1-null (C) inAtoh1Dintestine mice.(D–F) Representative BrdU staining of normal-appearing crypts inAtoh1wt mice (D) and nondeleted Atoh1wt (E) and Atoh1-null (F) inAtoh1Dintestine mice.(G–I) Representative cleaved caspase-3 staining of normal-appearingcrypts in Atoh1wt mice (G); and nondeleted Atoh1wt (H) and Atoh1-null(I) in Atoh1Dintestine mice. Arrows point to positive cells at the surface ofthe crypts. The images were captured at 203 magnification.
Found at doi:10.1371/journal.pbio.1000039.sg003 (4.96 MB PDF).
Figure S4. ATOH1 Expression Correlates with Population DoublingTime
(A) ATOH1mRNA transcripts in five independent MCC cell lines. Thename of the cell line is indicated above each lane. RT-PCR was donewith 100 ng of RNA under nonsaturating conditions.(B) Doubling times in hours of the five MCC cell lines. Error barsindicate the standard deviation.(C) RT-qPCR for ATOH1 in MCC1 and MCC14.2 cell lines. ATOH1mRNA levels standardized to GADPH mRNA levels.
Found at doi:10.1371/journal.pbio.1000039.sg004 (760 KB PDF).
Figure S5. Summary Table of All Patient Data
First column indicates patient numbers. Next, the relative ratios forATOH1 genomic DNA (gDNA) over control locus is presented foreach of the two primer sets as analyzed by qPCR. The next twocolumns indicate the classification of the deletion/duplication statusof the ATOH1 locus. The mRNA expression is shown relative tocontrol colon samples, with next to it, the classification of theexpression. Clinical data are given in the third panel, namely cancerstage and metastasis. In the last panel, methylation of the ATOH1locus is shown using three different methods.
Found at doi:10.1371/journal.pbio.1000039.sg005 (760 KB PDF).
Figure S6. Array CGH Analysis of Three Patient Samples, Demon-strating No Aberration of the ATOH1 Locus
Each bar represents the log2 of the value for affected individuals (ind)versus a control sample (reference) for each probe, ordered based onthe probes’ chromosomal location. The region between 131 Mb and141 Mb is shaded. The location of the ATOH1 locus is shown with anarrow. The abnormalities were confirmed by dye swap experiments.
Found at doi:10.1371/journal.pbio.1000039.sg006 (4.55 MB PDF).
Figure S7. Methylation of the ATOH1 Locus
(A) Schematic representation of ATOH1 locus. The white box indicatethe ATOH1ORF, and the gray box the position of the CpG island. Theprimers are indicated as arrows.(B) Detection of methylation at the ATOH1 locus using the ApaImethylation-sensitive restriction enzyme. PCR fragments generatedusing primers spanning the ApaI restriction site from ApaI restrictedgenomic DNA; presence of a band indicates methylation of theATOH1 CpG island.
(C) Detection of methylation using methylation-sensitive PCR: uponbisulfite modification, presence of a band indicates methylation ofthe ATOH1 CpG island.
Found at doi:10.1371/journal.pbio.1000039.sg007 (159 KB PDF).
Figure S8. Atoh1 Binds the Dnmt Proteins and Associates to a DNAMethyltransferase Activity
(A) GST Pull-down assays using Atoh1 protein fused to GST (GST-Atoh1) and in vitro translated Dnmts (IVT-Dnmt1, IVT-Dnmt3a, orIVT-Dnmt3b).(B) A GST-fused Atoh1 protein was used to purify DNA methyl-transferase activity from nuclear extracts. After incubation, the beadswere washed and assayed for DNA methyltransferase activity read asc.p.m. of S-adenosyl-L[methyl-3H] methionine incorporated into anoligonucleotide substrate. GST-tagged embryonic ectoderm develop-ment protein (GST-EED) was used as a positive control.(C) Coimmunoprecipitation experiments shows that Atoh1 associatedwith Dnmt1. The 293T cells were transiently transfected in culturedishes (10-cm diameter) with 3 lg of HA-Atoh1 plasmid(D) Mapping of Atoh1 binding to Dnmt1. GST Pull-downs wereperformed with Dnmt1 fragments fused to GST and in vitro–translated Atoh1. The upper part is a schematic representation of theDnmt1 sequences used.
Found at doi:10.1371/journal.pbio.1000039.sg008 (1.04 MB PDF).
Figure S9. Immunohistochemical Analysis of Phosphorylated JNK inAtoh1Dintestine and Atoh1wt Mice
(A) Representative pJNK1/2 staining in Atoh1wt crypt (dashed whiteline). The arrows indicate pJNK-positive cells.(B) pJNK-positive cells (arrows) in wild-type (dashed gray line) andAtoh1-null (dashed black line) crypts in Atoh1Dintestine mice.(C) Bar graph showing the percentage of pJNK-positive cells in wild-type mice (white); and wild-type (gray) and Atoh1-null crypts inAtoh1Dintestine mice. Error bars indicate the standard error of the mean.No significant differences between genotypes were detected.
Found at doi:10.1371/journal.pbio.1000039.sg009 (4.18 MB PDF).
Figure S10. ATOH1 Interacts with the Cell Cycle and Apoptosis
(A) Cell cycle distribution of MCC14.2-derived cell lines without(MCC14.2 and MCC14.2-GFP) and with Atoh1 expression (MCC14.2-Atoh1.1a and MCC14.2-Atoh1.2a). No significant change in distribu-tion throughout the cell cycle can be observed.(B) Maximal projection image of AnnexinV staining (red) on cellstransduced with lentiviral vectors expressing GFP (left panel) orAtoh1-IRES-GFP (right panel). GFP is in green.(C) Western blot analysis for CyclinA1, PCNA, p27kip, c-myc, phospho-H3 and p21waf1 of lysates of MCC14.2 cells, MCC14.2-GFP and twoMCC14.2 cell lines transduced with Atoh1-IRES-eGFP (MCC14.2-Atoh1.1a and MCC14.2-Atoh1.2a). The corresponding actin loadingcontrols are shown under each blot.(D–H) Quantification of expression levels of cyclinA1 (D), PCNA (E),p27 (F), c-myc (G), and phospho-histoneH3. (H) Representative blotsare shown in (C).
Found at doi:10.1371/journal.pbio.1000039.sg010 (2.90 MB PDF).
Figure S11. ATOH1 Acts Independently of Notch but Modulates RTKExpression
(A) RT-PCR for target of Notch signaling HES1 on mRNA isolatedfrom MCC14.2 cells, MCC14.2 cells transduced with GFP, and twoMCC14.2 cell lines transduced with Atoh1-IRES-eGFP (MCC14.2-Atoh1.1a and MCC14.2-Atoh1.2a). GADPH loading control is shownbelow.(B) Western blot analysis for cleaved intracellular Notch (NICD).Different concentrations of presinilin inhibitor X were used; a plussign (þ) indicates a positive control for cleaved NICD.(C) Different concentrations of c-secretase inhibitor (inhibitor X) onMCC14.2 do not influence the proliferation rate. First lane: 10 lMinhibitor X, second lane: DMSO control of previous lane, third lane: 1lM inhibitor X, fourth lane: DMSO control of previous lane, and fifthlane: untreated.(D) RT-PCR for expression of 90 tyrosine kinases scored fromundetectable (white) over orange (expression) to red (strong expres-sion) on mRNA or on untransduced MCC14.2 cells (lane 1), GFPtransduced MCC14.2 cell line (lane 2), and two independent MCC14.2-derived cell lines transduced with Atoh1-IRES-eGFP vectors (lane 3:MCC14.2-Atoh1.2a) and on untransfected HT29 cells (lane14: HT29),GFP-transfected HT29 cells (lane5: HT29-GFP), and HT29 cellstransfected with the Atoh1-IRES-eGFP construct (lane 6: HT29-Atoh1).
PLoS Biology | www.plosbiology.org February 2009 | Volume 7 | Issue 2 | e10000390324
ATOH1 Is a Tumor Suppressor

(E) RT-qPCR for ATOH1 mRNA levels (compared to GADPH mRNAlevels) in MCC cell lines. MCC1 (first lane: MCC cell line withendogenous high ATOH1 expression), MCC14.2 (lane 2), GFP-transduced MCC14.2 cell line (lane 3), and two independently madeMCC14.2-derived cell lines transduced with Atoh1-IRES-GFP vectors(lane 4: MCC14.2-Atoh1.1a, and lane 5: MCC14.2-Atoh1.2a).(F) Western blot analysis for NTRK1 and Neurotrophin-3 (NT3) ofuntransduced MCC14.2 cells (lane 1), GFP-transduced MCC14.2 cellline (lane 2), and two independently made MCC14.2-derived cell linestransduced with Atoh1-IRES-GFP vectors (lane 3: MCC14.2-Atoh1.1a,and lane 4: MCC14.2-Atoh1.2a); actin loading controls are repre-sented below each blot.(G and H) Quantifications of western blots in (F), normalized to actin.
Found at doi:10.1371/journal.pbio.1000039.sg011 (2.04 MB PDF).
Figure S12. Quantifications of Western Blot Analysis in Main Figures(Minimum of Two Blots per Quantification)
The quantifications are performed with USI software. The signal forthe protein of interest was standardized to its respective actin loadingcontrol. Antibody is stated above each graph, representative experi-ments are shown in main figures: (A) Figure 4B, (B) Figure 4B, (C)Figure 4B, (D1) Figure 4C, (D19) Figure 4C, (D2) Figure 4C, (D29)Figure 4C, (E) Figure 5B , (F) Figure 5B, (G) Figure 6A, (H) Figure 6A,(I) Figure 6A, ( J) Figure 6A, (K) Figure 6B, (L) Figure 6B, (M) Figure6B, (N) Figure 6B, (O) Figure 6C, (P) Figure 6C, (Q) Figure 6C, (R)Figure 6E, (S) Figure 6E, (T) Figure 6E, (U) Figure 7D, (V) Figure 7D,(W) Figure 7E, (X) Figure 7E, and (Y) Figure 7E.
Found at doi:10.1371/journal.pbio.1000039.sg012 (365 KB PDF).
Acknowledgments
We thank H. Van Miegroet and N. Mentens for performing andscoring the 90 tyrosine kinase experiment; Chelsea Combs andJefferson Vallance for technical assistance; S. Claerhout for providingprimary keratinocytes; and S. Reeve, S. Claerhout, P. Vanderhaeghen,P. Verstreken, J. C. Marine, and P. Carmeliet for critical reading ofthe manuscript.
Author contributions. WB, AK, FF, NFS, and BAH conceived anddesigned the experiments. WB, AK, NDG, SVK, and JL performed theexperiments. WB, AK, JL, FF, JC, NFS, and BAH analyzed the data.GDH, KG, GPB, MC, TV, PM, and JC contributed reagents/materials/analysis tools. WB, AK, JC, NFS, and BAH wrote the paper.
Funding. This work was supported by VIB, a Stichting EmmanuelVan der Scheuren predoctoral fellowship to WB, Fonds voorWetenschappelijk Onderzoek–Vlaanderen (FWO) postdoctoral fel-lowship to SA, the European Molecular Biology Organization (EMBO)Young Investigator Program, Impuls, CREA, and GeconcerteerdOnderzoeksacties (GOA) grants from K.U. Leuven, and FWO grantsG.0542.08N and G.0543.08N to BAH, the Foundation against Cancer,foundation of public interest to JC and Foundation for DigestiveHealth and Nutrition Research Scholars Award, National Institutes ofHealth (NIH) K01 DK071686, and American Cancer Society (OhioAffiliate) Pilot Award to NFS. The funders had no role in studydesign, data collection and analysis, decision to publish, orpreparation of the manuscript.
Competing interests. The authors have declared that no competinginterests exist.
References1. Ben-Arie N, Hassan BA, Bermingham NA, Malicki DM, Armstrong D, et al.
(2000) Functional conservation of atonal and Math1 in the CNS and PNS.Development 127: 1039–1048.
2. Yang Q, Bermingham NA, Finegold MJ, Zoghbi HY. (2001) Requirement ofMath1 for secretory cell lineage commitment in the mouse intestine.Science 294: 2155–2158.
3. Shroyer NF, Helmrath MA, Wang VY, Antalffy B, Henning SJ, et al. (2007)Intestine-specific ablation of mouse atonal homolog 1 (Math1) reveals arole in cellular homeostasis. Gastroenterology 132: 2478–2488.
4. Ben-Arie N, Bellen HJ, Armstrong DL, McCall AE, Gordadze PR, et al.(1997) Math1 is essential for genesis of cerebellar granule neurons. Nature390: 169–172.
5. Bermingham NA, Hassan BA, Price SD, Vollrath MA, Ben-Arie N, et al.(1999) Math1: an essential gene for the generation of inner ear hair cells.Science 284: 1837–1841.
6. Wang VY, Hassan BA, Bellen HJ, Zoghbi HY (2002) Drosophila atonal fullyrescues the phenotype of Math1 null mice: new functions evolve in newcellular contexts. Curr Biol 12: 1611–1616.
7. Bossuyt W, De Geest N, Aerts S, Leenaerts I, Marynen P, et al. (2009) TheAtonal proneural transcription factor links differentiation and tumorformation in Drosophila. PLoS Biol 7: e1000040. doi:10.1371/journal.pbio.1000040
8. Brenner B, Sulkes A, Rakowsky E, Feinmesser M, Yukelson A, et al. (2001)Second neoplasms in patients with Merkel cell carcinoma. Cancer. 91:1358–1362.
9. O’Connell JB, Maggard MA, Ko CY (2004) Colon cancer survival rates withthe new American Joint Committee on Cancer sixth edition staging. J NatlCancer Inst 96: 1420–1425.
10. Leow CC, Romero MS, Ross S, Polakis P, Gao WQ (2004) Hath1, down-regulated in colon adenocarcinomas, inhibits proliferation and tumori-genesis of colon cancer cells. Cancer Res 64: 6050–6057.
11. Radtke F, Clevers H (2005) Self-renewal and cancer of the gut: two sides of acoin. Science 307,: 1904–1909.
12. Su LK, Kinzler KW, Vogelstein B, Preisinger AC, Moser AR, et al. (1992)Multiple intestinal neoplasia caused by a mutation in the murine homologof the APC gene. Science 256: 668–670.
13. Moser AR, Pitot HC, Dove WF (1990) A dominant mutation thatpredisposes to multiple intestinal neoplasia in the mouse. Science 247:322–324.
14. Colnot S, Niwa-Kawakita M, Hamard G, Godard C, Le Plenier S, et al. (2004)Colorectal cancers in a new mouse model of familial adenomatouspolyposis: influence of genetic and environmental modifiers. Lab Invest84: 1619–1630.
15. Niwa N, Hiromi Y, Okabe M (2004) A conserved developmental programfor sensory organ formation in Drosophila melanogaster. Nat Genet 36:293–297.
16. Leonard JH, Cook AL, Van Gele M, Boyle GM, Inglis KJ, et al. (2002)Proneural and proneuroendocrine transcription factor expression incutaneous mechanoreceptor (Merkel) cells and Merkel cell carcinoma. IntJ Cancer 101: 103–110.
17. Fiegler H, Carr P, Douglas EJ, Burford DC, Hunt S, et al. (2003) DNA
microarrays for comparative genomic hybridization based on DOP-PCRamplification of BAC and PAC clones. Genes Chromosomes Cancer 36:361–374.
18. Sun Y, Jan LY, Jan YN (1998) Transcriptional regulation of atonal duringdevelopment of the Drosophila peripheral nervous system. Development125: 3731–3740.
19. Helms AW, Abney AL, Ben-Arie N, Zoghbi HY, Johnson JE (2000)Autoregulation and multiple enhancers control Math1 expression in thedeveloping nervous system. Development 127: 1185–1196.
20. Vire E, Brenner C, Deplus R, Blanchon L, Fraga M, et al. (2006) ThePolycomb group protein EZH2 directly controls DNA methylation. Nature439: 871–874.
21. Tong C, Yin Z, Song Z, Dockendorff A, Huang C, et al. (2007) c-Jun NH2-terminal kinase 1 plays a critical role in intestinal homeostasis and tumorsuppression. Am J Pathol 171: 297–303.
22. Chen N, Nomura M, She QB, Ma WY, Bode AM, et al. (2001). Suppression ofskin tumorigenesis in c-Jun NH(2)-terminal kinase-2-deficient mice. CancerRes 61: 3908–3912.
23. Leonard JH, Bell JR, Kearsley JH (1993) Characterization of cell linesestablished from Merkel-cell ("small-cell") carcinoma of the skin. Int JCancer 55: 803–810.
24. Leonard JH, Dash P, Holland P, Kearsley JH, Bell JR (1995) Characterisationof four Merkel cell carcinoma adherent cell lines. Int J Cancer 60: 100–107.
25. Jarman AP, Grell EH, Ackerman L, Jan LY, Jan YN (1994) Atonal is theproneural gene for Drosophila photoreceptors. Nature 369: 398–400.
26. John A, Smith ST, Jaynes JB (1995) Inserting the Ftz homeodomain intoengrailed creates a dominant transcriptional repressor that specificallyturns off Ftz target genes in vivo. Development 121: 1801–1813.
27. Ligoxygakis P, Yu SY, Delidakis C, Baker NE (1998) A subset of notchfunctions during Drosophila eye development require Su(H) and the E(spl)gene complex. Development 125: 2893–2900.
28. Hassan BA, Bellen HJ (2000) Doing the MATH: is the mouse a good modelfor fly development? Genes Dev 14: 1852–1865.
29. Li Y, Baker NE (2001) Proneural enhancement by Notch overcomesSuppressor-of-Hairless repressor function in the developing Drosophilaeye. Curr Biol 11: 330–338.
30. Kim JW, Kim MJ, Kim KJ, Yun HJ, Chae JS, et al. (2005) Notch interfereswith the scaffold function of JNK-interacting protein 1 to inhibit the JNKsignaling pathway. Proc Natl Acad Sci U S A 102: 14308–14313.
31. Shearman MS, Beher D, Clarke EE, Lewis HD, Harrison T, et al. (2000) L-685,458, an aspartyl protease transition state mimic, is a potent inhibitor ofamyloid beta-protein precursor gamma-secretase activity. Biochemistry 39:8698–8704.
32. Schlessinger J (2000) Cell signaling by receptor tyrosine kinases. Cell 103:211–225.
33. Fundin BT, Silos-Santiago I, Ernfors P, Fagan AM, Aldskogius H, et al.(1997) Differential dependency of cutaneous mechanoreceptors on neuro-trophins, trk receptors, and P75 LNGFR. Dev Biol 190: 94–116.
34. Szeder V, Grim M, Kucera J, Sieber-Blum M (2003) Neurotrophin-3signaling in mammalian Merkel cell development. Dev Dyn 228: 623–629.
35. Tapley P, Lamballe F, Barbacid M (1992) K252a is a selective inhibitor of
PLoS Biology | www.plosbiology.org February 2009 | Volume 7 | Issue 2 | e10000390325
ATOH1 Is a Tumor Suppressor

the tyrosine protein kinase activity of the trk family of oncogenes andneurotrophin receptors. Oncogene 7: 371–381.
36. Nye SH, Squinto SP, Glass DJ, Stitt TN, Hantzopoulos P, et al. (1992) K-252aand staurosporine selectively block autophosphorylation of neurotrophinreceptors and neurotrophin-mediated responses. Mol Biol Cell 3: 677–686.
37. Ruggeri BA, Miknyoczki SJ, Singh J, Hudkins RL (1999) Role of neuro-trophin-trk interactions in oncology: the anti-tumor efficacy of potent andselective trk tyrosine kinase inhibitors in pre-clinical tumor models. CurrMed Chem 6: 845–857.
38. Shin M, Yan C, Boyd D (2002) An inhibitor of c-jun aminoterminal kinase(SP600125) represses c-Jun activation, DNA-binding and PMA-inducible92-kDa type IV collagenase expression. Biochim Biophys Acta 1589: 311–316.
39. Alani R, Brown P, Binetruy B, Dosaka H, Rosenberg RK, et al. (1991) Thetransactivating domain of the c-Jun proto-oncoprotein is required forcotransformation of rat embryo cells. Mol Cell Biol 11: 6286–6295.
40. Kouros-Mehr H, Bechis SK, Slorach EM, Littlepage LE, Egeblad M, et al.(2008) GATA-3 links tumor differentiation and dissemination in a luminalbreast cancer model. Cancer Cell 13: 141–152.
41. Harris H (2004) Tumor suppression: putting on the brakes. Nature 427,:201.
42. Heasley LE, Han SY (2006) JNK regulation of oncogenesis. Mol Cells 21:167–173.
43. Searfoss GH, Jordan WH, Calligaro DO, Galbreath EJ, Schirtzinger LM, etal. (2003) Adipsin, a biomarker of gastrointestinal toxicity mediated by afunctional gamma-secretase inhibitor. J Biol Chem 278: 46107–46116.
44. van Es JH, van Gijn ME, Riccio O, van den Born M, Vooijs M, et al. (2005)Notch/gamma-secretase inhibition turns proliferative cells in intestinalcrypts and adenomas into goblet cells. Nature 435: 959–963.
45. Kiesslich R, Goetz M, Angus EM, Hu Q, Guan Y, et al. (2007) Identificationof epithelial gaps in human small and large intestine by confocalendomicroscopy. Gastroenterology 133: 1769–1778.
46. Boivin GP, Washington K, Yang K, Ward JM, Pretlow TP, et al. (2003)Pathology of mouse models of intestinal cancer: consensus report andrecommendations. Gastroenterology 124: 762–777.
47. Flint N, Cove FL, Evans GS (1991) A low-temperature method for theisolation of small-intestinal epithelium along the crypt-villus axis. BiochemJ 280: 331–334.
48. Taylor JA, Martin CA, Nair R, Guo J, Erwin CR, et al. (2008). Lessonslearned: optimization of a murine small bowel resection model. J PediatrSurg 43,: 1018–1024.
49. Van Damme A, Thorrez L, Ma L, Vandenburgh H, Eyckmans J, et al. (2006)Efficient lentiviral transduction and improved engraftment of human bonemarrow mesenchymal cells. Stem Cells 24: 896–907.
50. VandenDriessche T, Naldini L, Collen D, Chuah MK (2002) Oncoretroviraland lentiviral vector-mediated gene therapy. Methods Enzymol 346: 573–589.
51. VandenDriessche T, Thorrez L, Naldini L, Follenzi A, Moons L, et al. (2002)Lentiviral vectors containing the human immunodeficiency virus type-1central polypurine tract can efficiently transduce nondividing hepatocytesand antigen-presenting cells in vivo. Blood 100: 813–822.
PLoS Biology | www.plosbiology.org February 2009 | Volume 7 | Issue 2 | e10000390326
ATOH1 Is a Tumor Suppressor