portfolio construction for pharmaceutical industry
TRANSCRIPT

[email protected], [email protected] *[email protected]
Portfolio Construction for Pharmaceutical Industry
Xiqing Sun†1,a, Baichuan Li*, †2,b, Huatian Pang†3,c
1School of Statistics and Mathematics Zhongnan University of Economics and Law Wuhan, China 2College of Liberal Arts & Sciences University of Illinois at Urbana-Champaign Urbana-Champaign, United States 3School of information and Engineering Technology Nanjing University Jinling College Nanjing, China †These authors contributed equally.
Abstract. In finance area, portfolio construction is one of the most vital questions since the primary work of modern finance and attract numerous studies. In this paper, we focused on this issue in pharmaceutical industry since the industry is crucial for human beings. We adopted several methods for portfolio construction, like Equal Weighted Model, Monte Carlo simulation, and maximize Sharpe ratio etc. Specifically, five assets are selected. Then based on the Monte Carlo method, we constructed two optimized portfolios in the framework of the efficient frontier, i.e., portfolios with minimum variance and maximum Sharpe ratio. By analyzing the two portfolios, we found that the NVS accounts for the largest proportions in the optimized portfolio. The results in this paper may shed lights for certain investors who invest in pharmaceutical industry.
1 Introduction
In finance area, portfolio construction is one of the most vital question asked every day [1]. Building a portfolio can decrease risks effectively. The purpose of buying more than one kind of security may decrease the risk as far as possible and meanwhile increase revenue. It’s obvious that portfolio building can reach that goal. Therefore, portfolio building is allowed to make a long-term investment approach [2]. In 2020, COVID-19 swept the world. It has brought death to various countries around the world, lots of people lost their family and many countries have suffered serious economic downturns.
As we know, the pharmaceutical industry was greatly simulated by the deterioration of Covid-19. Firstly, more attention was paid for exploration of new medical facilities and medicine, like the world-wide production of vaccines [3], which can induce a wider market. Then, although in some regions the epidemic has been controlled, the public are continually focusing on public health, like the fetter of diseases, primary therapy, and medicine storage, in this way, the rising trend for pharmaceutical industry is lasting and globally [4]. Finally, with the medical system is becoming more and more sophisticated in some countries, the number of hospitals and medical institutions is proliferated [5]. All the above aspects may change the portfolio construction regarding the medical industry specifically during the corona-virus pandemic.
In fact, numerous portfolio constructions regarding pharmaceutical industry have been done. For example, using measurements of daily stock market swings based on 1900 contemporary journalistic accounts, Baker et al. [6] show that the U.S. stock market volatility during the first half of 2020 is unprecedented [6].
In recent years, the high growth of bio-medical companies has attracted the pursuit of many capitals, including value investors’ investment in the bio-medical industry. Silvijus Abramavičius [7] selected the financial data, yield data of pharmaceutical companies, and established a multiple regression model. The results shown that net sales interest rate, operating income growth rate, and the proportion of sales expenses to operating income are significantly related to the investment income of individual stocks. Zhang Hongfan [8] selected individual stocks based on fundamental indicators, then calculated the combination with the largest excess return through the program, and further used momentum model strategies to execute transactions. Finally, it is verified that the effectiveness of dynamic quantitative investment in the A-share market. However, there are still few studies on the selection and combination of pharmaceutical industry stocks using quantitative methods during corona-virus pandemic, and thus, the related research is needed.
To the best of our knowledge, this paper makes the following contributions to the literature. We derived pharmaceutical stock portfolios based on models such as equal weighting models and Monte Carlo simulations, and back to the test to derived the optimal weights related to maximum Sharpe ratio or minimum variance. Then, after compared to NASDAQ Composite Index, it provides investors with reference for stock selection in the pharmaceutical sector, especially during the corona-virus pandemic, it is important for investors to utilize the chance and have a clear expectation for the future.
The paper is organized as follows. Section 2 shows the data used in this paper. Section 3 depicts the methods. Empirical results are summarized in Section 4 and Section 5 concludes the paper.
© The Authors, published by EDP Sciences. This is an open access article distributed under the terms of the Creative Commons Attribution License 4.0
(http://creativecommons.org/licenses/by/4.0/).
E3S Web of Conferences 275, 03032 (2021) https://doi.org/10.1051/e3sconf/202127503032EILCD 2021

2 Data and stocks selection
In this paper, we use the classic low price to-sales ratio stock selection method to select the stocks that make up our portfolio. In practice, a stock with a low price-to-sales ratio usually implies that the stock has a high growth value. However, if only low price-to-sales ratio is used as the only criterion for stock selection, it is easy to select stocks of companies with poor financial status or poor management, so further screening should be done by using auxiliary financial indicators based on low price-to-sales ratio.
In this paper, the following four auxiliary financial indicators are considered, gearing ratio, net profit growth rate, operating income growth rate, and net profit margin. The U.S. Nasdaq stock market is used as the stock selection sample. The time series data of stocks are obtained from Yingwei Finance Website. The capacity of the stock pool is studied and set to 5 stocks.
Firstly, companies that have been listed for less than 60 days are excluded to avoid significant impact on stock prices due to the company’s initial public offering. Secondly, using January 1, 2018 as the node, stocks are relatively undervalued can be identified by comparing the price-to-sales ratios of different stocks in each industry.
Finally, using auxiliary financial indicators, companies with poor financial fundamentals and high risk are eliminated. The auxiliary financial indicators including eliminating stocks with the highest gearing ratio relative to 1/3 of the industry; eliminating stocks with negative net profit growth rate; selecting stocks with the highest operating income growth rate relative to 1/3 of the industry; and eliminating stocks with the lowest net profit ratio relative to 1/3 of the industry. Consequently, the selected companies are Johnson&Johnson, Merck&Co Inc, Novartis AG, Pfizer Inc and Sanofi. We transfer all the prices to log-return data, and show the basic information in Figure 1, Figure 2, Table 1 and Table 2, respectively.
Figure 1. Prices of the stocks
Figure 2. Daily returns of the stocks
It’s obvious that JNJ stock price fell more than 10% in
mid-December 2018. The reason about it is FDA detected that there are some hazardous substances in their products. Therefore, based on the data in the table, 5 stocks most worthy of selection are:
Table1. 5 stocks we chose
Company JNJ Johnson&Johnson
MRK Merck&Co,. Inc. NVS Novartis AG PFE Pfizer Inc. SNY Sanofi
Table2. Descriptive statistics of 5 stocks
Min Max Mean Std. Dev Skewness
Kurtosis
-0.035 0.106 -0.0002 0.0111 2.253 18.274 -0.057 0.063 -0.0005 0.0114 0.205 5.429 -0.047 0.044 -0.0003 0.0104 -0.014 3.030 -0.047 0.055 -0.0006 0.0101 0.372 4.339 -0.040 0.050 -0.0001 0.0113 0.151 1.270
From the table 2, we can find that the SNY has the
largest mean value and the PFE return has the least fluctuation. The overall difference between the variance and mean of the historical data for each stock is small.
3 Methodology
3.1 Portfolio Selection Models
According to modern portfolio theory, the portfolio returns, and variance can be calculated as follows,
𝑅 𝑥′𝜇 (1)
𝜎 𝑥′𝜔𝑥 (2)
where 𝑅 reflects the return of the portfolio, σ means the variance of the portfolio return, x refers to the vector of asset weight, 𝜇 is the mean value of assets, and 𝜔 represents the variance-covariance matrix. In this paper,
2
E3S Web of Conferences 275, 03032 (2021) https://doi.org/10.1051/e3sconf/202127503032EILCD 2021

we focus on three models, i.e., equal weighted portfolio, minimized variance portfolio and portfolio with largest Sharpe ratio.
Equal weight portfolio is a type of weighting that gives the same weight, for all stocks in our portfolio, no matter how large or small the company is, they have the same weight, which means the weight for each asset is 1/n, where n refers to the number of the selected asset [9]. In 2012, the group of Yuliya Plakha compared the performance of the equal-weighted portfolio relative with the value and price-weighted portfolios. To undertake analysis, they constructed equal, value, and price-weighted portfolios from 100 stocks randomly selected from the constituents of the S&P 500 index over the past 40 years. The total return of the equal-weighted portfolio was higher than that of the value and price-weighted portfolios by 271 and 112 basis points a year. The four-factor alpha of the equal-weighted portfolio was 175 basis points a year, more than 2.5 times the 60 and 67 basis points a year for the value and price-weighted portfolios respectively. The differences in total mean return and alpha are significant, even after allowing for transactions costs of 50 basis points.[10] In this paper, once we set x=(1/5, 1/5, 1/5, 1/5, 1/5), we got the equal weighted portfolio.
The Sharpe ratio is a standardized indicator of portfolio performance evaluation. It is one of the three classic indicators that can comprehensively consider returns and risks. The purpose of Sharp ratio is to calculate how much excess returns will be generated for each unit of total risk that the investment portfolio bears. If it is greater than 1, it means that the fund return rate is higher than the volatility risk; if it is less than 1, it means that the fund’s operational risk is greater than the return rate. In this way, each investment portfolio can calculate the Sharpe Ratio, which is the ratio of return on investment to risk taking. The higher the ratio, the better the portfolio. The calculation method is as follows,
𝑆ℎ𝑎𝑟𝑝𝑅𝑎𝑡𝑖𝑜
where R is Risk-free rate, σ is Standard deviation of portfolio return.
The minimum variance portfolio is the portfolio with the smallest risk among a series of portfolios, suitable for risk-averse investors. Due to the reciprocal relationship between risk and return, the return of this investment method is also the lowest. In other words, if we minimize , we could get the related asset weights.
3.2 Monte Carlo Methods
Due to the advantages of the Monte Carlo method, (1) intuitive and easy to understand (2) less affected by geometric conditions (3) probability convergence has nothing to do with the dimension of the problem, we continue to use the Monte Carlo method for weight simulation.
Considering that the real analytic equation of the frontier surface is difficult to obtain, this paper uses Monte Carlo simulation to generate many random weight vectors and records the expected return and variance of the
random portfolio to find the feasible set of the portfolio and the balance of expected return and risk. Monte Carlo simulation method is a general term for a class of stochastic methods, which are characterized by estimating the probability of something occurring based on the frequency of the thing occurring in order to calculate on random sampling to get approximate results, and the probability of getting the correct result gradually increases as the sampling increases, but it is impossible to know whether the obtained result is the real result until the real result is obtained.
To increase the credibility of the results, this paper performs 5000 random assignments of weights to generate 5000 different sets of portfolios and records their expected returns and variances. The resulting expected returns and variances were used to further generate the feasible set and efficient frontier of the portfolios; in addition to that, the minimum variance and Sharp Ratio optimal points on that efficient frontier were calculated and analyzed in this paper.
4 Empirical results
4.1 Equal Weight Model Result
Therefore, we decided to use way of Equal weight to construct our model. We collected data from Jan 2017 to Dec 2018 to do the equal weight model, the annual return is 12.7% and sharpness ratio is 1, which are not bad. And for the cumulative returns, the general trend is increasing. The annual volatility is 12.8%, so that it seems risky and requires some improvement. Then, we do the backtest of the equal weight model, and the result is shown in table 3, and it is obviously the Sharpe ratio is 1.
Table3. The backtest results of equal weight
Backtest
Annual return 12.7%
Cumulative returns 26.9%
Annual volatility 12.8%
Sharpe ratio 1.00
Calmar ratio 0.99
Stability 0.56
Max drawdown -12.9%
Omega ratio 1.19
Sortino ratio 1.39
Skew -0.69
Kurtosis 3.32
Tail ratio 0.99
Daily value at risk -1.6%
However, equal weight model has its drawbacks. Since
2016, an equal weighted portfolio of stocks in the S&P500 has significantly under-performed the market capitalization weighted portfolio. In this paper we analyzed this under-performance using stochastic portfolio theory. We have shown that the equal weighted portfolio does appear to outperform the market
3
E3S Web of Conferences 275, 03032 (2021) https://doi.org/10.1051/e3sconf/202127503032EILCD 2021
capitalization weighted portfolio over the long-term but with periods of significant short-term under-performance. It is possible that the diversification return is too low, or because individual stock volatilities are low, or correlation is high and does not warrant rebalancing of the portfolio back to equal weights [11]. That may be an issue. Notice that all our stocks are selected from pharmaceutical industry, which means the correlation is very high. Therefore, there may be some better way to construct the portfolio, in this way, we tried Monte Carlo simulation.
4.2 Efficient Frontier Determination for Portfolios Based on Monte Carlo Methods
We performed 50,00 simulations, and the simulation results are shown as dots in Figure 3. The blue line in the chart is the effective leading edge. Assuming that investors are risk averse, they will choose less risky assets for the same level of return. Similarly, when the level of risk is the same, investors will tend to choose higher-yielding assets. Following this logic, the efficient frontier represents the most efficient portfolio of all risky assets. The point on the left border of the efficient frontier is called the minimum variance portfolio. Next, we will select the best portfolio of assets on the efficient frontier.
Figure 3. Monte Carlo simulation results
4.3 Optimal Portfolio Selection Based on Effective Frontiers
We calculated the Sharpe ratio maximum point on the effective frontier, and the weight of each stock is shown in Table 4. We can get the weights of five stocks about Sharpe ratio maximum point easily that from the data of this table. It is obvious that JNJ accounted for 0.19%, MRK accounted for 79.92%, NVS accounted for 4.06%, PFE accounted for 9.18% and SNY accounted for 6.65%.
Table4. the weight of each stock on the Sharpe ratio maximum point
JNJ MRK NVS PFE SNY
Weights 0.19% 79.92% 4.06% 9.18% 6.65%
We calculate the minimum point of variance on the
effective frontier, and the weight of each stock is shown in the Table 5. We can get the weights of five stocks about
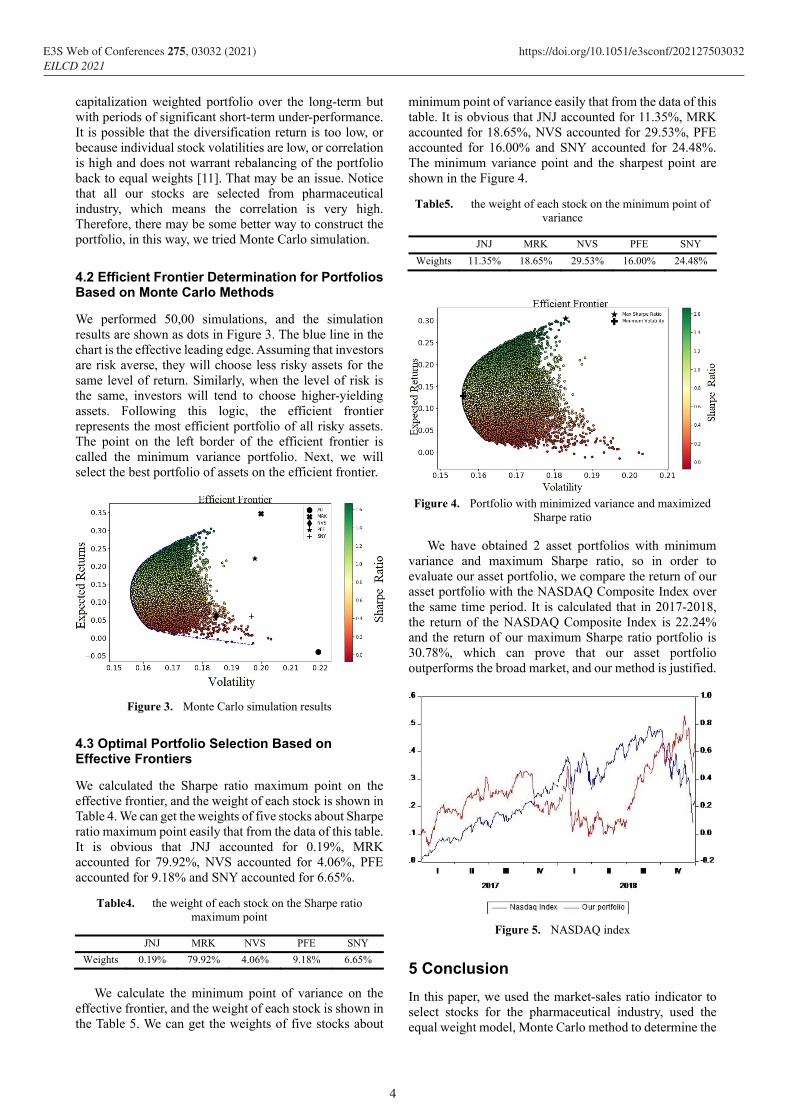
minimum point of variance easily that from the data of this table. It is obvious that JNJ accounted for 11.35%, MRK accounted for 18.65%, NVS accounted for 29.53%, PFE accounted for 16.00% and SNY accounted for 24.48%. The minimum variance point and the sharpest point are shown in the Figure 4.
Table5. the weight of each stock on the minimum point of variance
JNJ MRK NVS PFE SNY
Weights 11.35% 18.65% 29.53% 16.00% 24.48%
Figure 4. Portfolio with minimized variance and maximized
Sharpe ratio
We have obtained 2 asset portfolios with minimum variance and maximum Sharpe ratio, so in order to evaluate our asset portfolio, we compare the return of our asset portfolio with the NASDAQ Composite Index over the same time period. It is calculated that in 2017-2018, the return of the NASDAQ Composite Index is 22.24% and the return of our maximum Sharpe ratio portfolio is 30.78%, which can prove that our asset portfolio outperforms the broad market, and our method is justified.
Figure 5. NASDAQ index
5 Conclusion
In this paper, we used the market-sales ratio indicator to select stocks for the pharmaceutical industry, used the equal weight model, Monte Carlo method to determine the
4
E3S Web of Conferences 275, 03032 (2021) https://doi.org/10.1051/e3sconf/202127503032EILCD 2021

weights, and combined the Sharpe ratio, variance and effective frontier to determine the best investment portfolio. We found that the Monte Carlo method has significant advantages over the equal weight method. For equal weight model, the Sharpe ratio is 1.00, but that for Monte Carlo method is over 1.4, which means it has higher excess return. Also, it is obvious that compared Monte Carlo method based on minimum variance point, that based on “MRK” takes a larger part in the portfolio, which means more input in this asset would bring more returns. The effective frontier theory is effective in the US stock market. At the same time, we obtain a portfolio with a return rate of 30.78%, which is higher than the index return rate over the same period. Therefore, such result further proves the rationality of our method. Although the model yields a good result, more improvement can be achieved by using more advanced techniques or more exact data. By conducting stability test, the latest data can be analyzed by better model. In short, this aspect is indeed worth further discussion.
References
1. Diego L, Aragón A, Javier Sandoval J, et al. Clustering algorithms for Risk-Adjusted Portfolio Construction. (Volume 108, 2017, Pages 1334-1343) DOI: 10.1016/j.procs.2018.07.243. This paper can be achieved at: https://www.sciencedirect.com/science/article/pii/S187705091730772X3.
2. Tarczynski W, Tarczynska-luniewska M. The construction of fundamental portfolio with the use of multivariate approach(2018 volume 126)page 2508-2596,DOI: 10.1016/j.procs.2018.07.243.
3. Yunus M, Donaldson C, Perron J. COVID-19 Vaccines A Global Common Good (2020), DOI: 10.1016/S2666-7568(20)30003-9.
4. Sharma D, Mittal S. The Impact of COVID-19 on Stock Returns of the Indian Healthcare and Pharmaceutical Sector.(2021 volume 15). This paper can be achieved at: https://ro.uow.edu.au/aabfj/vol15/iss1/2/.
5. Statistical information center of China. Number of national medical and health institutions by the end of Novembr2019(2020) This paper can be achieved at: http://www.nhc.gov.cn/mohwsbwstjxxzx/s7967/202001/d73a47fbda0e4ea4bbb8d20387992871.shtml.
6. Silvio C, Pierangelo D. The International Spread of COVID-19 Stock Market Collapses. (2020)This paper can be achieved at: https://ideas.repec.org/p/clm/pomwps/1013.html
7. Silvijus Abramavičius et al. "Stock price reaction to the drug development setbacks in the pharmaceutical industry". DARU Journal of Pharmaceutical Sciences (2021): 1-11.
8. Zhang Hongfan. The theory and practice of using quantitative investment strategies to achieve excess return Alpha. (2015) This paper can be achieved at:
https://kns.cnki.net/KCMS/detail/detail.aspx?dbname=CMFD201502&filename=1015590256.nh.
9. Chen J, Equal Weight.(2020) p.1. This paper can be achieved at: https://www.investopedia.com/terms/e/equalweight.asp.
10. Plyakha Y, How equal-weighting wins (2012) p.1. This paper can be achieved at: https://www.ipe.com/smart-beta-how-equal-weighting-wins/45806.articl.
11. Taljaard B, Mare E. Why Has the Equal Weight Portfolio Underperformed and What Can We Do About It? (2020) p.1 – 2. This paper can be achieved at: https://papers.ssrn.com/sol3/papers.cfm?abstract_id=3608632
5
E3S Web of Conferences 275, 03032 (2021) https://doi.org/10.1051/e3sconf/202127503032EILCD 2021