report of the actuarial analysis of the projected costs of ... · actuary to perform the analysis...
TRANSCRIPT
Report of the Actuarial Analysis of the Projected Costs of Providing
Insurance Coverage for the Screening, Diagnosis, and Treatment of Autism Spectrum Disorders
In Accordance with Act 185 (SLH 2014)
Submitted by the INSURANCE DIVISION
DEPARTMENT OF COMMERCE AND CONSUMER AFFAIRS STATE OF HAWAII December 2014
Report of the Actuarial Analysis of the Projected Costs of Providing Insurance Coverage December 2014 for the Screening, Diagnosis, and Treatment of Autism Spectrum Disorders
___________________________________
2
Foreword Act 185 (SLH 2014) requires the Insurance Commissioner to submit to the Legislature a report that provides the results of an actuarial analysis of the projected costs of providing insurance coverage for screening, diagnosis, and treatment of autism spectrum disorders. GORDON I. ITO Insurance Commissioner
Report of the Actuarial Analysis of the Projected Costs of Providing Insurance Coverage December 2014 for the Screening, Diagnosis, and Treatment of Autism Spectrum Disorders
___________________________________
3
Report of the Actuarial Analysis of the Projected Costs of Providing Insurance Coverage for the Screening, Diagnosis, and Treatment of Autism Spectrum Disorders (2014) Act 185 (SLH 2014) (or S.B. No. 2054, S.D. 3, H.D. 3, C.D. 1) requires the Insurance Commissioner to contract for an actuarial analysis of the projected costs of providing insurance coverage for the screening, diagnosis, and treatment of autism spectrum disorders and to provide a report of these findings to the Legislature. The Division obtained the services of Wakely Consulting Group as the consulting actuary to perform the analysis and write the report, which is attached as Appendix A. The Insurance Division’s conclusions to the questions posed by Act 185 (SLH 2014) were reached by evaluating and commenting on similar studies of autism spectrum disorders done by the actuarial consulting firm of Oliver Wyman and by examining data provided by the Department of Human Services Medicaid program and other sources. The Division also conducted a data call of the Hawai`i health insurance industry. The responding health insurers made good-faith attempts to comply; however, due to the short timeframe required for submission of this report, the data provided was not consistent or credible enough to be included in this report. For a number of years, the issue of a mandated benefit for autism spectrum disorders has been the subject of legislative debate. The Patient Protection and Affordable Care Act of 2010 (“PPACA”) added further complexity to this issue. Section 1311(d)(3) of the PPACA directs states to defray costs if they require qualified health plans to offer benefits in addition to the ten essential health benefits that the PPACA requires for small groups and individuals. Payments must be made on behalf of persons eligible for cost sharing reductions or premium tax credit subsidies. Any mandated state benefit enacted after December 31, 2011, that exceeds the PPACA essential health benefits must be paid for by the state, unless the mandate was enacted early enough in 2012 for inclusion in the benchmark plan for essential health benefits selected by the state. It is not possible to accurately pinpoint the exact costs associated with covering autism spectrum disorders. Only estimates of costs can be made, and the actual results may vary from those predicted. Due to the lack of sufficient Hawai`i data, the Division lacks exact knowledge of the margin of error and cannot state exactly what the confidence intervals would be. Many variables will affect what happens in actual practice. In addition, costs may vary over time as both the incidence of diagnosis and the possibilities for treatment change.
Report of the Actuarial Analysis of the Projected Costs of Providing Insurance Coverage December 2014 for the Screening, Diagnosis, and Treatment of Autism Spectrum Disorders
___________________________________
4
The costs will also be related to the parameters set forth in any mandated benefit. The existence of standards for diagnosis and treatment and limits on the scope of the mandate will also affect the costs. Additionally, the Legislature should consider to what extent, if any, the degree of control over the management of care for autism should be delegated to the insurers. In constructing a mandated benefit for autism, the Legislature must be mindful that some care providers are outside the field of credentialed medical providers and that supervision by licensed practitioners may be advisable. Also, the line between those portions of autism which are covered by the government and those that are, or may be, covered by private insurance must be considered. It would be advantageous to have a system where there is effective coordination of care between government and the private sector. APPENDIX A Report of Wakely Consulting Group
APPENDIX A
Analysis of Costs of Insuring Certain Behavioral Health Treatments for Autism
Spectrum Disorders (SB 2054) State of Hawaii Insurance Division Department of Commerce and Consumer Affairs
December 5, 2014
Wakely Consulting Group Chris Bach, ASA, MAAA, FCA Senior Consulting Actuary 1660 Highway 100 South, Suite 590 Minneapolis, MN 55416 (p) 727-259-7479 [email protected]
Wakely Consulting Group Kelsey Stevens, FSA, MAAA, MBA Consulting Actuary 17757 US Highway 19 North, Suite 310 Clearwater, FL 33764 (p) 727-259-7465 [email protected]

State of Hawaii Analysis of Cost of Certain ASD Services Final Report 12/05/14
Contents
I. Executive Summary ............................................................................................................................................................ 3
Background and Scope of Work .................................................................................................................................... 3
Summary of Wakely’s Analysis ..................................................................................................................................... 4
Results ................................................................................................................................................................ ..................... 6
Disclosures and Limitations ........................................................................................................................................... 7
Comments Relative to Applicable ASOPs .................................................................................................................. 8
II. Summary of Wakely’s Analysis ..................................................................................................................................... 9
Data & Reliances .................................................................................................................................................................. 9
Wakely’s Approach............................................................................................................................................................. 9
Wakely’s Assumptions .................................................................................................................................................... 10
Differences in Assumptions between Wakely and 2014 OW Report .......................................................... 16
III. Detailed Discussion of Findings ................................................................................................................................ 18
Wakely Cost Estimates - Commercial ....................................................................................................................... 18
Review of 2014 OW Report .......................................................................................................................................... 20
Impact of Differences in Assumptions between Wakely and 2014 OW Report ..................................... 20
IV. Medicaid Considerations ............................................................................................................................................. 22
Wakely Cost Estimates - Medicaid ............................................................................................................................. 22
Wakely Review of 2014 DHS Report ........................................................................................................................ 23
V. Impact of Other Potential Provisions ....................................................................................................................... 25
Impact of Including Developmental Delays ........................................................................................................... 25
Impact of Benefit Limitations ...................................................................................................................................... 25
VI. Conclusion ................................................................................................................................................................ .......... 26
Appendix A: Scope of Work .............................................................................................................................................. 27
Appendix B: SB 2054 ........................................................................................................................................................... 28
Appendix C: Data Sources ................................................................................................................................................. 32
Appendix D: Oliver Wyman Report ............................................................................................................................... 33
Appendix E: Detailed Discussion of Applicable ASOPs ......................................................................................... 97
P a g e | 2
State of Hawaii Analysis of Cost of Certain ASD Services Final Report 12/05/14
I. Executive Summary
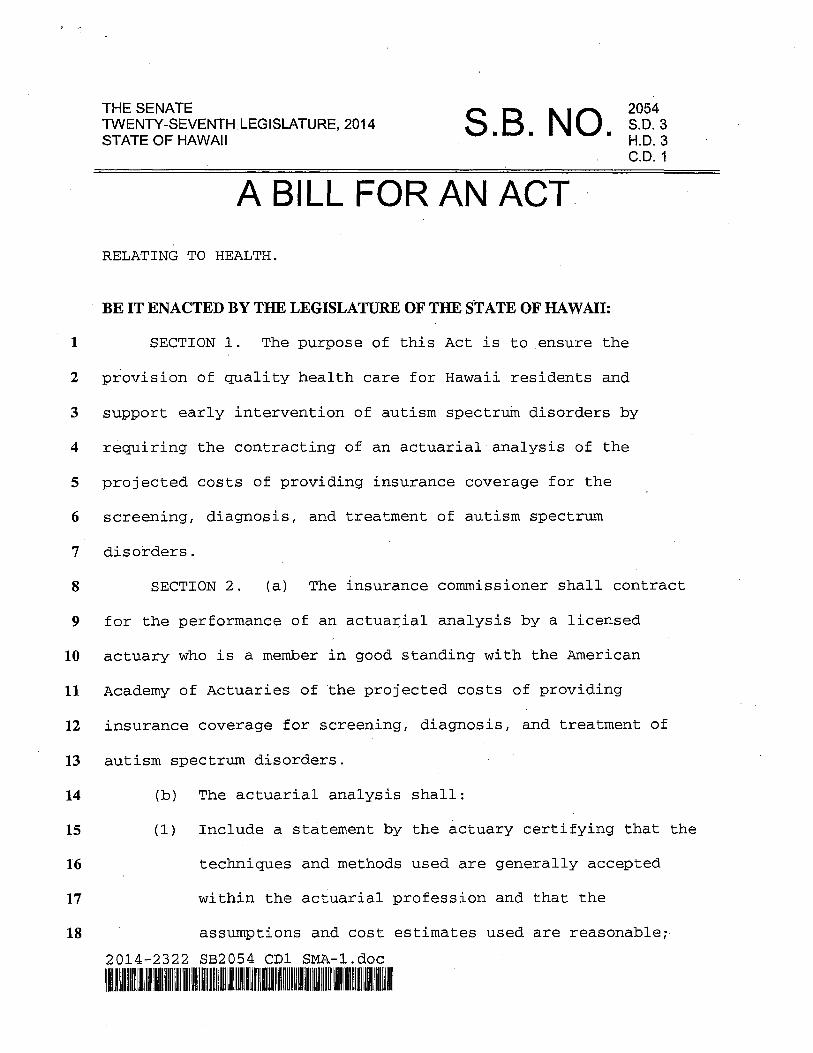
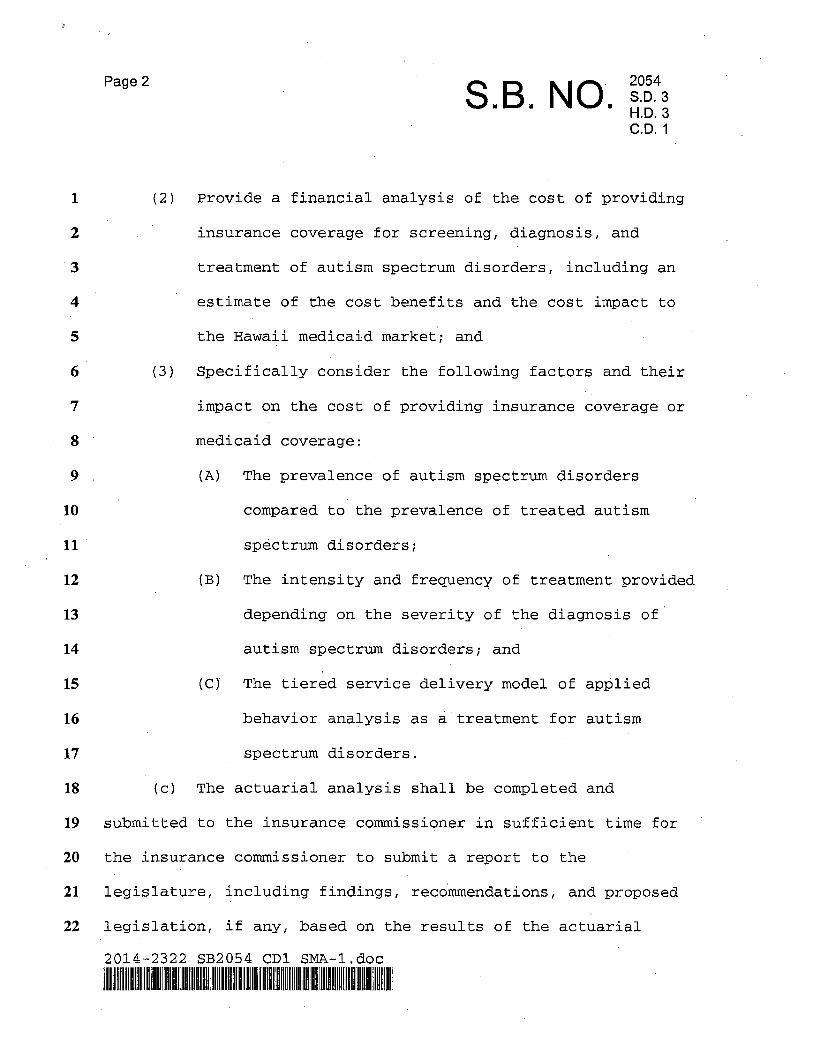
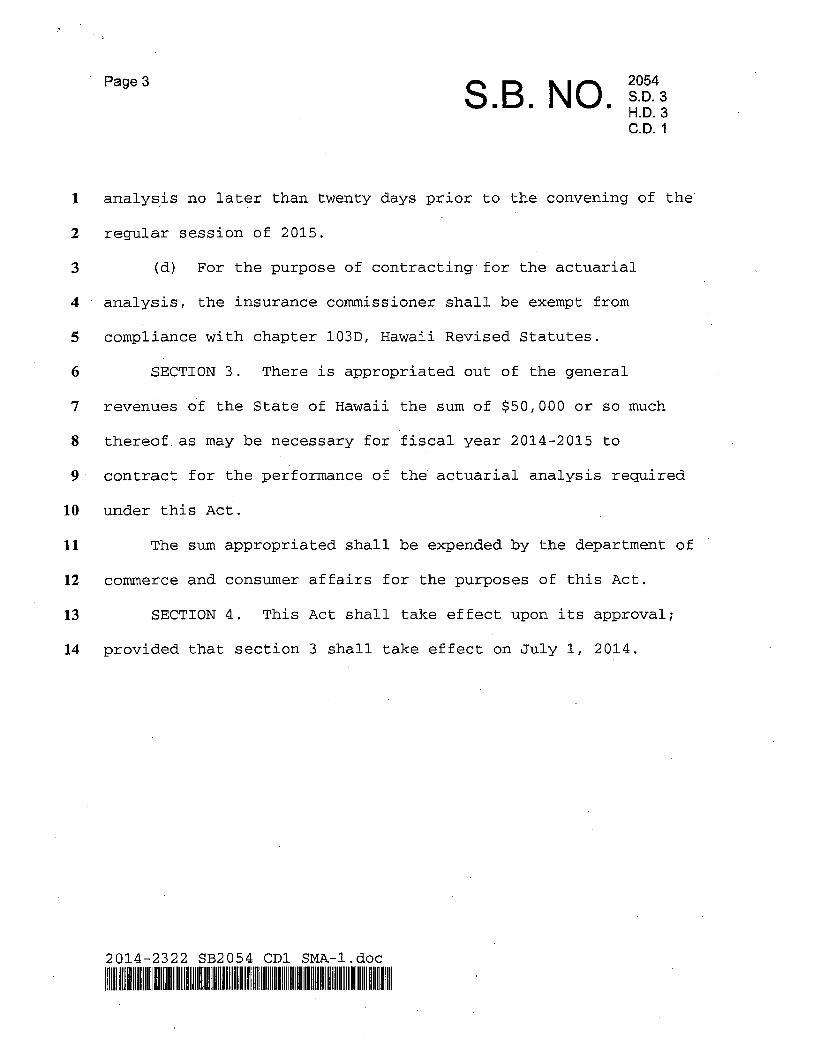
Background and Scope of Work Wakely Consulting Group, Inc. (Wakely) was retained by the State of Hawaii Insurance Division Department of Commerce and Consumer Affairs (State) to perform an analysis to determine the cost of insuring certain behavioral health treatments for children diagnosed as having an autism spectrum disorder (ASD) as identified in Senate Bill 2054, SD3, HD3, CD1 (SB2054). A detailed description of the scope of work included in this engagement is included in Appendix A of this report. A copy of SB2054 is included in Appendix B of this report.
SB2054 is intended to ensure the provision of quality health care and support early intervention of autism spectrum disorders by conducting an actuarial analysis to determine the cost impact to commercial health insurers and the Hawaii Medicaid program to cover the treatment of children diagnosed as having an ASD. SB2054 requires that the following factors be considered in the analysis:
1. Prevalence of ASDs compared to prevalence of treated ASDs (in other words, how may children diagnosed as having an ASD actually receive treatment for the ASD);
2. Intensity and frequency of treatment based on the ASD severity (in other words, the number of treatments and length of each treatment based on the severity of the ASD); and,
3. A tiered delivery model for ABA when used as a treatment for ASDs (in other words, a team of providers at a variety of professional levels are usually involved in ABA treatment).
Since this specific version of SB2054 does not include details on the types of treatments that will be included, eligibility requirements or benefit levels, we relied on previous versions of the bill and discussions with various parties (as documented throughout this report) to determine the types of treatment, eligibility requirements and benefits to consider in the analysis. While some previous versions of SB2054 state that the mandated coverage will include all services including well-baby and well-child screening, diagnosis, and evidence-based treatment of ASDs, we noted that many screening, diagnostic and behavioral health services are already covered by Hawaii insurers.
Therefore, based on our understanding of both the current coverage and SB2054, the primary change that is anticipated, should treatment of ASD services be mandated, is the coverage of certain behavioral health treatments. Specifically, the behavioral health treatments considered in Wakely’s analysis were limited to applied behavioral analysis (ABA) services for children diagnosed as having an ASD. ABA services are defined as “…a scientifically validated approach to understanding and analyzing behavior and how it is affected by the environment. Behavior analysis has developed many techniques for increasing useful behaviors and reducing those that may cause harm or
P a g e | 3
State of Hawaii Analysis of Cost of Certain ASD Services Final Report 12/05/14 interfere with learning. Applied behavior analysis (ABA) is the use of these techniques and principles to bring about meaningful and positive change in behavior.” C-1
This report documents Wakely’s assumptions, approach and results of the analysis.
Summary of Wakely’s Analysis Wakely’s analysis included the following items:
• An independent projection of the costs of providing insurance coverage for ABA services used in the treatment of children diagnosed with an ASD, including the cost impact of providing similar coverage in Hawaii's Medicaid program.
• An evaluation of the February 26, 2014 Oliver Wyman report titled “ACTUARIAL COST ESTIMATE: HAWAII SENATE BILL 2054 SD1”, hereinafter referred to as the “2014 OW Report” and the February 11, 2014 Department of Human Services (DHS) cost testimony regarding the coverage of behavioral health treatments for ASD in Hawaii's Medicaid program, hereinafter referred to as the “2014 DHS Report”, to determine if the cost estimates in these studies are credible and reasonable.
We made the following general assumptions in performing our analysis:
• The only significant cost implications of SB2054 are related to the coverage of ABA services.
• Only children clinically diagnosed with an ASD will be eligible to have coverage for ABA services. We discuss the impact of expanding coverage eligibility in Section V of this report.
• In order to allow for greatest flexibility in benefit design considerations, no benefit limitations were assumed. However, we discuss the impact of annual benefit limitations in Section V of this report so the cost impact of such limitations can be considered in the final benefit design.
• Not all children who are diagnosed with an ASD receive treatment for the ASD, nor do all children diagnosed with an ASD seek ABA treatment.
• The use of ABA services varies based on the severity of a child’s ASD.
• The amount of ABA services used by those who receive treatments varies based on the severity of a child’s ASD.
• The cost of ABA services represents the average cost of a tiered delivery approach.
Wakely primarily relied on industry data in choosing the assumptions used in the development of the cost estimates in this report. Appendix C includes a detailed list of sources used. References
P a g e | 4
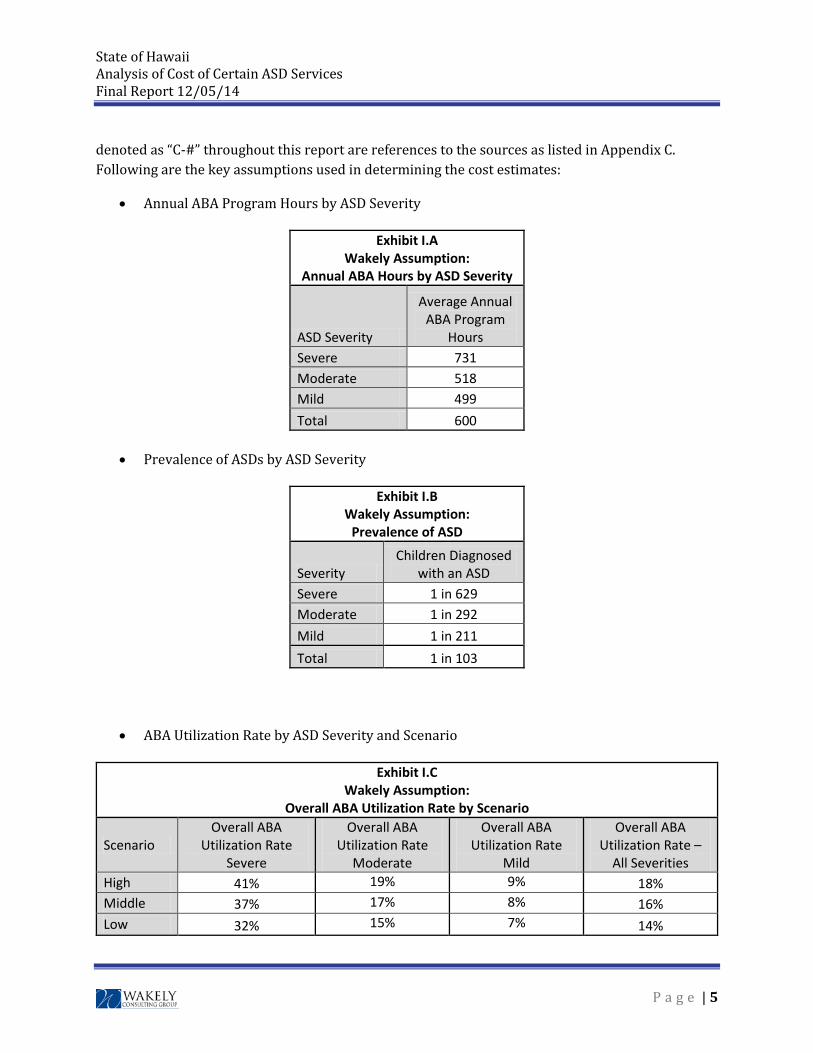
State of Hawaii Analysis of Cost of Certain ASD Services Final Report 12/05/14 denoted as “C-#” throughout this report are references to the sources as listed in Appendix C. Following are the key assumptions used in determining the cost estimates:
• Annual ABA Program Hours by ASD Severity
Exhibit I.A Wakely Assumption:
Annual ABA Hours by ASD Severity
ASD Severity
Average Annual ABA Program
Hours Severe 731 Moderate 518 Mild 499 Total 600
• Prevalence of ASDs by ASD Severity
Exhibit I.B Wakely Assumption:
Prevalence of ASD
Severity Children Diagnosed
with an ASD Severe 1 in 629 Moderate 1 in 292 Mild 1 in 211 Total 1 in 103
• ABA Utilization Rate by ASD Severity and Scenario
Exhibit I.C Wakely Assumption:
Overall ABA Utilization Rate by Scenario
Scenario Overall ABA
Utilization Rate Severe
Overall ABA Utilization Rate
Moderate
Overall ABA Utilization Rate
Mild
Overall ABA Utilization Rate –
All Severities High 41% 19% 9% 18% Middle 37% 17% 8% 16% Low 32% 15% 7% 14%
P a g e | 5
State of Hawaii Analysis of Cost of Certain ASD Services Final Report 12/05/14
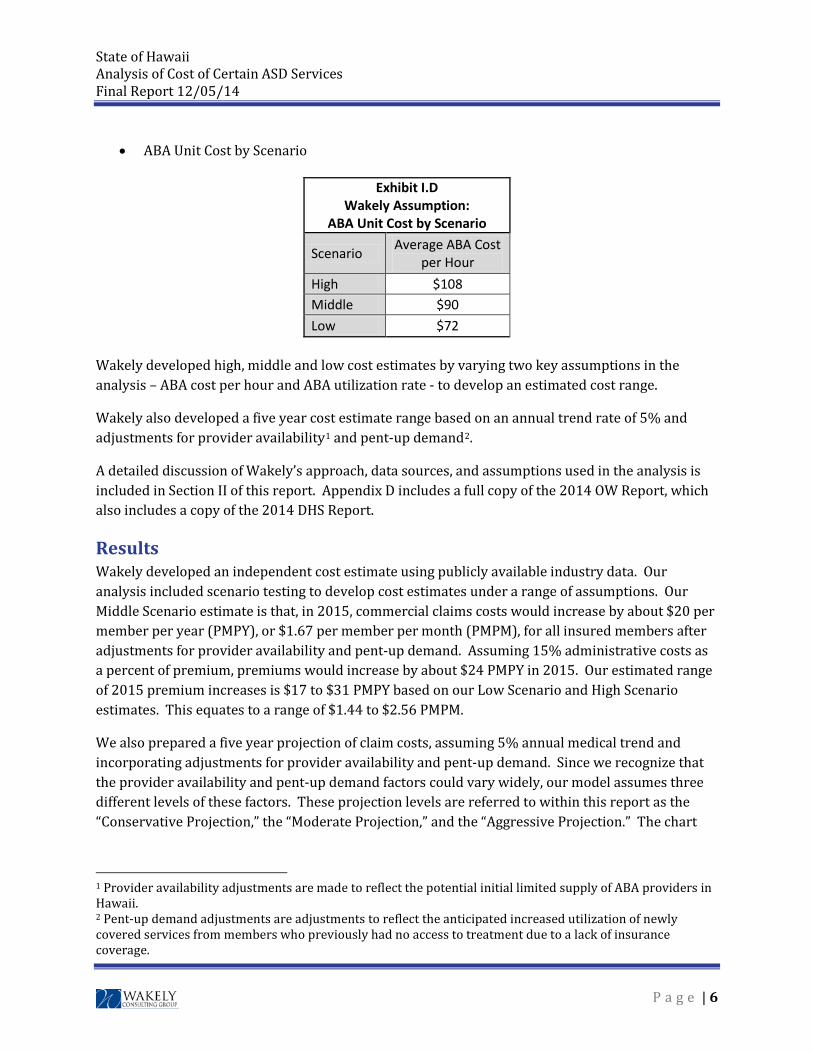
• ABA Unit Cost by Scenario
Exhibit I.D Wakely Assumption:
ABA Unit Cost by Scenario
Scenario Average ABA Cost per Hour
High $108 Middle $90 Low $72
Wakely developed high, middle and low cost estimates by varying two key assumptions in the analysis – ABA cost per hour and ABA utilization rate - to develop an estimated cost range.
Wakely also developed a five year cost estimate range based on an annual trend rate of 5% and adjustments for provider availability1 and pent-up demand2.
A detailed discussion of Wakely’s approach, data sources, and assumptions used in the analysis is included in Section II of this report. Appendix D includes a full copy of the 2014 OW Report, which also includes a copy of the 2014 DHS Report.
Results Wakely developed an independent cost estimate using publicly available industry data. Our analysis included scenario testing to develop cost estimates under a range of assumptions. Our Middle Scenario estimate is that, in 2015, commercial claims costs would increase by about $20 per member per year (PMPY), or $1.67 per member per month (PMPM), for all insured members after adjustments for provider availability and pent-up demand. Assuming 15% administrative costs as a percent of premium, premiums would increase by about $24 PMPY in 2015. Our estimated range of 2015 premium increases is $17 to $31 PMPY based on our Low Scenario and High Scenario estimates. This equates to a range of $1.44 to $2.56 PMPM.
We also prepared a five year projection of claim costs, assuming 5% annual medical trend and incorporating adjustments for provider availability and pent-up demand. Since we recognize that the provider availability and pent-up demand factors could vary widely, our model assumes three different levels of these factors. These projection levels are referred to within this report as the “Conservative Projection,” the “Moderate Projection,” and the “Aggressive Projection.” The chart
1 Provider availability adjustments are made to reflect the potential initial limited supply of ABA providers in Hawaii. 2 Pent-up demand adjustments are adjustments to reflect the anticipated increased utilization of newly covered services from members who previously had no access to treatment due to a lack of insurance coverage.
P a g e | 6
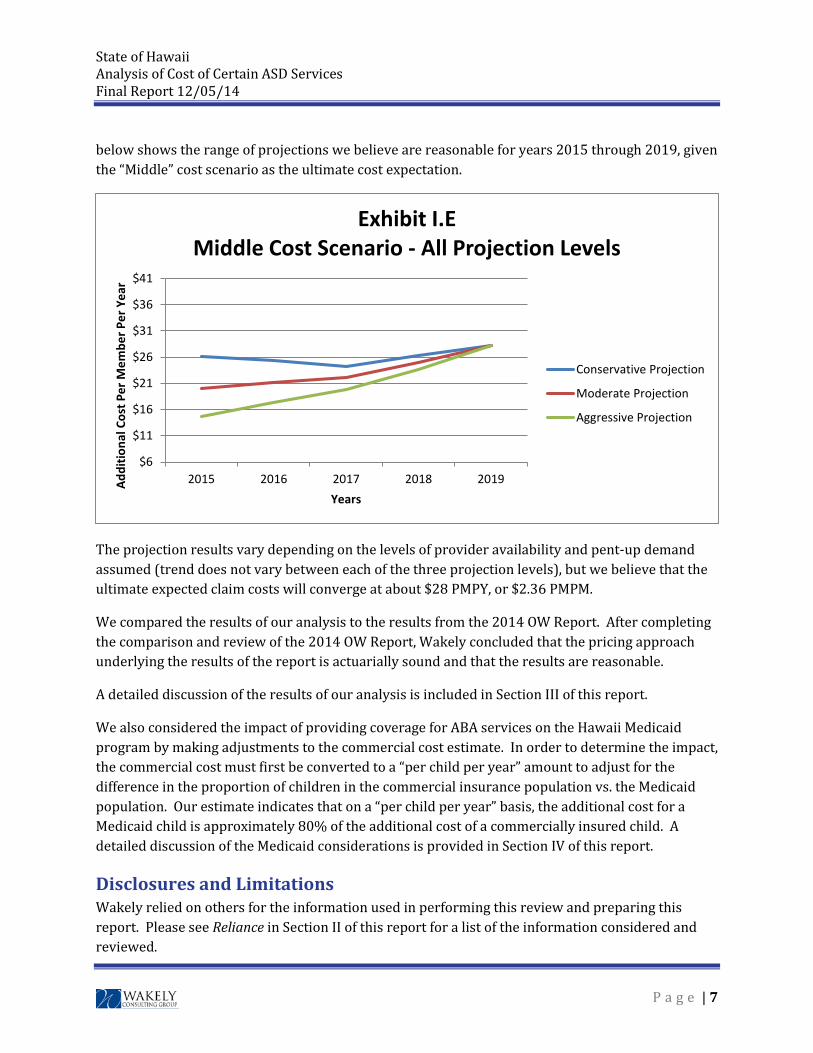
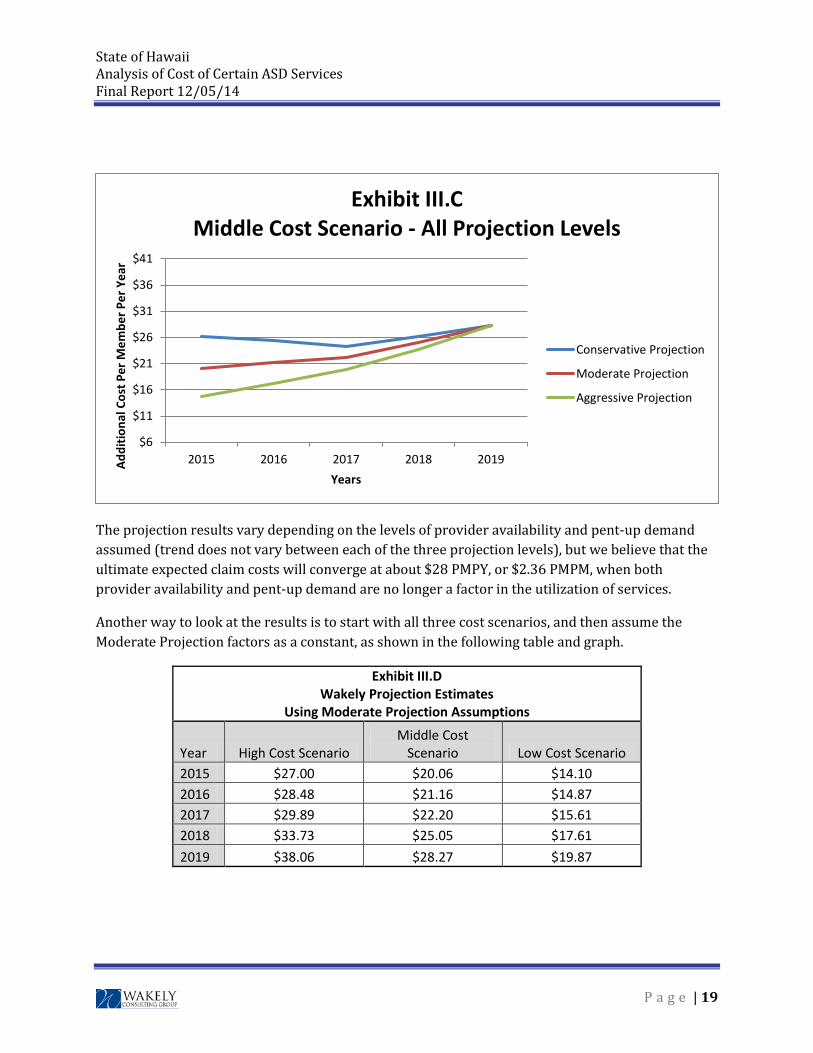
State of Hawaii Analysis of Cost of Certain ASD Services Final Report 12/05/14 below shows the range of projections we believe are reasonable for years 2015 through 2019, given the “Middle” cost scenario as the ultimate cost expectation.
The projection results vary depending on the levels of provider availability and pent-up demand assumed (trend does not vary between each of the three projection levels), but we believe that the ultimate expected claim costs will converge at about $28 PMPY, or $2.36 PMPM.
We compared the results of our analysis to the results from the 2014 OW Report. After completing the comparison and review of the 2014 OW Report, Wakely concluded that the pricing approach underlying the results of the report is actuarially sound and that the results are reasonable.
A detailed discussion of the results of our analysis is included in Section III of this report.
We also considered the impact of providing coverage for ABA services on the Hawaii Medicaid program by making adjustments to the commercial cost estimate. In order to determine the impact, the commercial cost must first be converted to a “per child per year” amount to adjust for the difference in the proportion of children in the commercial insurance population vs. the Medicaid population. Our estimate indicates that on a “per child per year” basis, the additional cost for a Medicaid child is approximately 80% of the additional cost of a commercially insured child. A detailed discussion of the Medicaid considerations is provided in Section IV of this report.
Disclosures and Limitations Wakely relied on others for the information used in performing this review and preparing this report. Please see Reliance in Section II of this report for a list of the information considered and reviewed.
$6
$11
$16
$21
$26
$31
$36
$41
2015 2016 2017 2018 2019Addi
tiona
l Cos
t Per
Mem
ber P
er Y
ear
Years
Exhibit I.EMiddle Cost Scenario - All Projection Levels
Conservative Projection
Moderate Projection
Aggressive Projection
P a g e | 7
State of Hawaii Analysis of Cost of Certain ASD Services Final Report 12/05/14 The data provided were reviewed for reasonableness, but Wakely did not perform an independent audit or otherwise verify the accuracy of the information. See Appendix C for a detailed list of all data sources. The result of our analysis is an estimate based on reasonable data and assumptions available at the time this report was written, as documented within this report. Actual costs may vary significantly from these estimates and will be based on a large number of factors including, but not limited to, the mandated benefits included in the final law (if passed), limitations on the benefits (number of visits or dollar limits), the population served (i.e. ASD or any developmental delay), provider availability and cost (including the impact of any potential provider licensing requirements), and member utilization of these services. Reliance on this report is at State’s discretion. If this report is distributed, it should be provided in its entirety.
Comments Relative to Applicable ASOPs Wakely’s review and this report comply with all applicable Actuarial Standards of Practice (ASOPs). Details regarding the applicable ASOPs are presented in Appendix E.
P a g e | 8
State of Hawaii Analysis of Cost of Certain ASD Services Final Report 12/05/14
II. Summary of Wakely’s Analysis
A detailed discussion of Wakely’s approach, data sources and assumptions follows.
Data & Reliances Wakely relied on the following information when completing this analysis:
• Detailed discussion via telephone with the following key resources: o Jennifer Diesman from Hawaii Medical Service Association (HMSA) regarding the
plan’s current ASD benefits and eligibility parameters. 10/6/14 o Justin Birrell from Milliman regarding the impact on the Medicaid program and
available data sources. 10/9/14 o Senator Rosalyn Baker regarding the history and scope of the bills related to the
coverage of ASD treatments. 10/13/14
• Submitted data request templates from the following carriers: o Alohacare o Hawaii Medical Assurance Association (HMAA) o Hawaii Medical Service Association (HMSA) o Kaiser Foundation Health Plan, Inc. (Kaiser) o University Health Alliance (UHA) o UnitedHealthcare (UHC)
• Publicly available industry data regarding ASDs
Appendix C includes a detailed list of data sources used in this analysis.
Wakely’s Approach Wakely took a two-fold approach to creating an independent projection of costs. First, we collected data from the majority of health insurers in the state of Hawaii regarding the benefit structure and experience for any services related to the treatment of ASD. We developed a detailed data request intended to capture a multitude of information including, but not limited to the following:
1. Current coverage for ASD treatment options by type of service (including annual or lifetime limits, provider licensing requirements, pre-authorization requirements, and specific age and/or diagnosis requirements);
2. Prevalence of autism by diagnosis and by age; and
3. Claims, premium, and membership experience by diagnosis and by age.
P a g e | 9
State of Hawaii Analysis of Cost of Certain ASD Services Final Report 12/05/14 We also requested experience for individuals without any ASD related diagnoses in order to help us gauge the relative differences among populations.
In general, the carrier data we received were not credible and consistent enough to be relied upon. Some carriers completed only the benefit coverage section of the template, and left the experience portion blank. Of those who did complete the experience portion, several carriers completed it only for members with an ASD diagnosis, but not for all other members, making it difficult to compare costs and understand prevalence rates. Some carriers reported rolled up data (not split by age or diagnosis) and others had missing lines of business or years. One carrier had seemingly reliable data, but in order to protect anonymity, we have chosen not to rely on this data for cost estimate purposes.
Additionally, as expected, very few carriers currently cover ABA services. Since we believe the majority of the added cost resulting from the mandated coverage of ASD services will be attributable to ABA services, we were required to rely on industry data, rather than Hawaii specific carrier data, for the majority of our source data and model inputs.
The more impactful component of our two-fold approach for developing an independent projection was industry research. We relied on several credible industry sources to aid us in evaluating the reasonability of the 2014 OW Report assumptions and developing our own best estimate assumptions. See Appendix C for a detailed list of all data sources.
Wakely’s Assumptions Since there was very little Hawaii specific data available, we determined it would be best to develop an estimated range of costs based on what we believe are reasonable data and assumptions. Actual costs will depend on a large number of factors including, but not limited to, the type and level of benefits, the population served, provider availability and cost, and member utilization of these services. In order to develop our cost estimate range, we made several assumptions about these factors. A detailed discussion of each assumption follows.
Benefit and Eligibility Assumptions We assumed the only significant additional costs associated with the passing of SB2054 would be the added cost of covering ABA services. Therefore, our models are based on the cost and utilization of ABA services only. We assumed the children eligible for coverage of ABA services would be children who were clinically diagnosed with an ASD where ABA services were determined to be medically necessary and provided by a licensed ABA provider. Therefore, our models are based on published ASD prevalence and ABA costs and statistics. Should additional children be eligible for coverage of ABA services, the results will vary significantly.
P a g e | 10
State of Hawaii Analysis of Cost of Certain ASD Services Final Report 12/05/14 It should be noted that the criteria for the diagnosis of ASDs changed with the introduction of Diagnostic and Statistical Manual of Mental Disorders (DSM) version V, effective May 2013. There are studies that indicate this change may reduce the prevalence of diagnosed ASDs by up to 20%. However, the studies also indicate that there may be additional diagnoses of ASDs that would not have been captured in the previous DSM version that will compensate for some, if not all, of the decrease in diagnoses.C-3 The results presented in this report assume no change in the prevalence of diagnosis of ASDs due to the implementation of DSM-V. In order to allow the most flexibility in benefit design considerations, we assumed no annual benefit limitations would be associated with the ABA services. Limits on the benefits, such as annual dollar limits or number of visit limits, will cause the results to vary significantly. We have included discussions of the estimated impact of various benefit limitations and coverage for developmentally delayed children in Section V of this report.
Finally, children diagnosed with an ASD are typically divided into three severity categories based on the level of function loss apparent in their daily lives; severe, moderate, and mild. The severity of the ASD impacts the amount of services used by each child. We have incorporated these severity levels into our analysis.
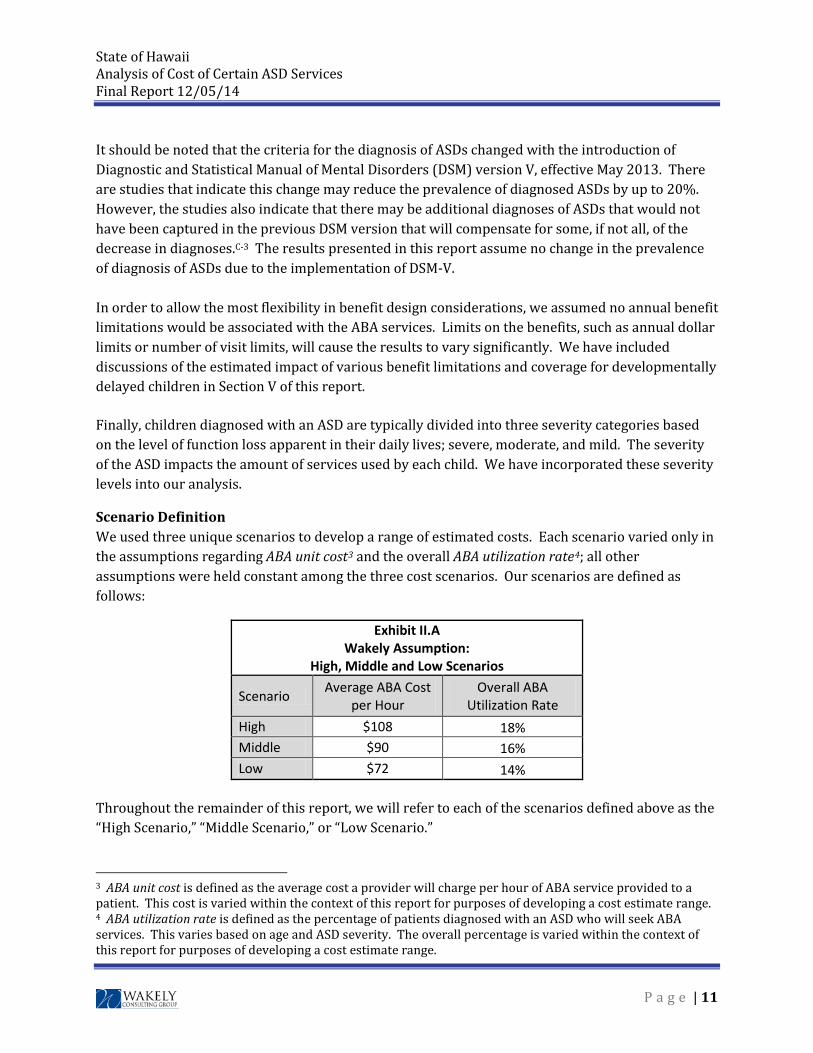
Scenario Definition We used three unique scenarios to develop a range of estimated costs. Each scenario varied only in the assumptions regarding ABA unit cost3 and the overall ABA utilization rate4; all other assumptions were held constant among the three cost scenarios. Our scenarios are defined as follows:
Exhibit II.A Wakely Assumption:
High, Middle and Low Scenarios
Scenario Average ABA Cost per Hour
Overall ABA Utilization Rate
High $108 18% Middle $90 16% Low $72 14%
Throughout the remainder of this report, we will refer to each of the scenarios defined above as the “High Scenario,” “Middle Scenario,” or “Low Scenario.”
3 ABA unit cost is defined as the average cost a provider will charge per hour of ABA service provided to a patient. This cost is varied within the context of this report for purposes of developing a cost estimate range. 4 ABA utilization rate is defined as the percentage of patients diagnosed with an ASD who will seek ABA services. This varies based on age and ASD severity. The overall percentage is varied within the context of this report for purposes of developing a cost estimate range.
P a g e | 11

State of Hawaii Analysis of Cost of Certain ASD Services Final Report 12/05/14 Annual ABA Program Hours We based our assumption for annual ABA program hours5 for children with an ASD on a report from the California Health Benefits Review Program (CHBRP) to the 2013-2014 State LegislatureC-2. This report estimated the weighted average of annual total hours of intensive behavioral intervention therapies for children with an ASD to be nearly 40% lower than the weighted average of hours assumed in the 2014 OW Report. The table below displays our assumed annual ABA program hours for children diagnosed with an ASD.
Exhibit II.B Wakely Assumption:
Annual ABA Hours by Age
Age Range
Annual ABA Program Hours
Severe ASD
Annual ABA Program Hours Moderate ASD
Annual ABA Program Hours
Mild ASD
Annual ABA Program Hours
All Severities
Ages 0-7 930 698 698 801 Ages 8-12 416 312 312 349
Ages 13-20 249 187 187 209
Total – All Ages 731 518 499 600
We assumed a reduced number of annual ABA hours for the moderate and mild ASD severity levels as compared to the severe level. We have chosen to assume that when moderately or mildly autistic children receive ABA services their annual hours utilized are 75% of the amount of hours utilized by severely autistic children. We have assumed 600 hours per year on average, after being rolled up by age and severity.
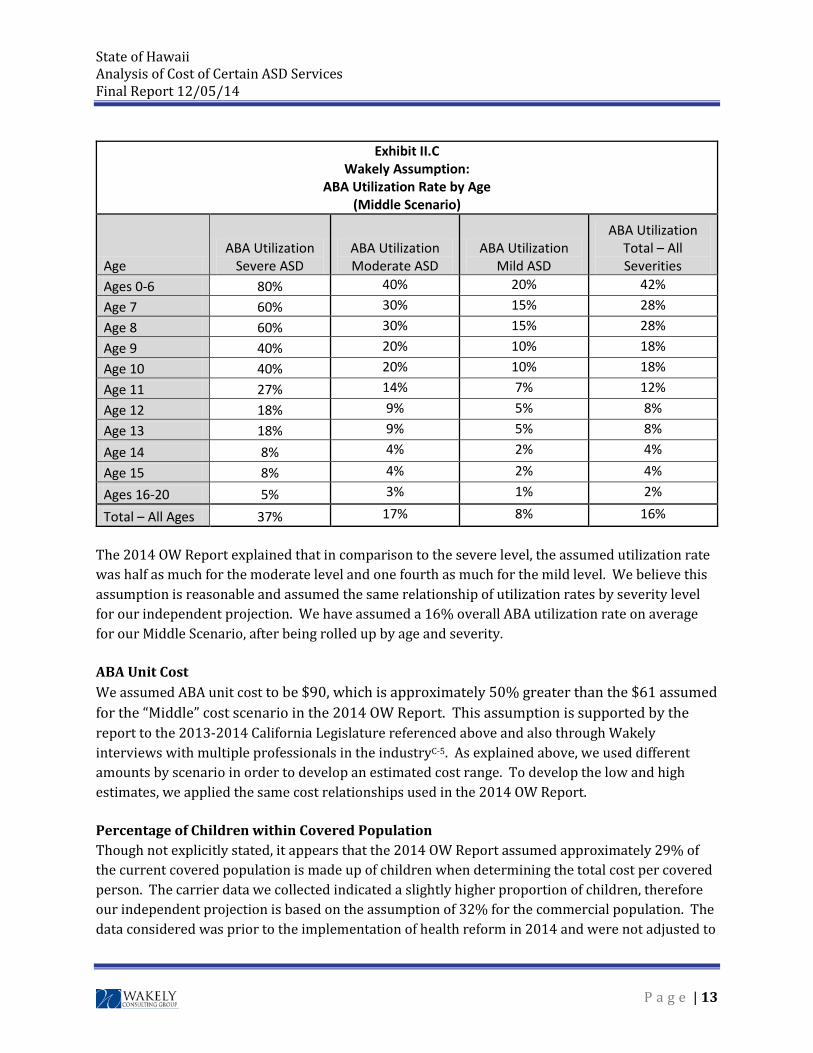
ABA Utilization Rate We based our assumption for the ABA utilization rate for children with an ASD on a news article from September of this year regarding the recent move to provide Medicaid coverage for ABA for autistic children in CaliforniaC-4. This report notes that according to advocacy group Autism Speaks, about 1 in 6 eligible children will ultimately utilize behavioral health treatment based on medical necessity and other factors. The table on the following page shows our assumed ABA utilization rate by age for children diagnosed with an ASD for the Middle Scenario.
5 ABA program hours is defined as the annual number of hours of ABA services each ASD patient will receive given they actually utilize ABA services. This varies based on age and ASD severity.
P a g e | 12
State of Hawaii Analysis of Cost of Certain ASD Services Final Report 12/05/14
Exhibit II.C Wakely Assumption:
ABA Utilization Rate by Age (Middle Scenario)
Age ABA Utilization
Severe ASD ABA Utilization Moderate ASD
ABA Utilization Mild ASD
ABA Utilization Total – All Severities
Ages 0-6 80% 40% 20% 42% Age 7 60% 30% 15% 28% Age 8 60% 30% 15% 28% Age 9 40% 20% 10% 18% Age 10 40% 20% 10% 18% Age 11 27% 14% 7% 12% Age 12 18% 9% 5% 8% Age 13 18% 9% 5% 8%
Age 14 8% 4% 2% 4%
Age 15 8% 4% 2% 4%
Ages 16-20 5% 3% 1% 2%
Total – All Ages 37% 17% 8% 16%
The 2014 OW Report explained that in comparison to the severe level, the assumed utilization rate was half as much for the moderate level and one fourth as much for the mild level. We believe this assumption is reasonable and assumed the same relationship of utilization rates by severity level for our independent projection. We have assumed a 16% overall ABA utilization rate on average for our Middle Scenario, after being rolled up by age and severity.
ABA Unit Cost We assumed ABA unit cost to be $90, which is approximately 50% greater than the $61 assumed for the “Middle” cost scenario in the 2014 OW Report. This assumption is supported by the report to the 2013-2014 California Legislature referenced above and also through Wakely interviews with multiple professionals in the industryC-5. As explained above, we used different amounts by scenario in order to develop an estimated cost range. To develop the low and high estimates, we applied the same cost relationships used in the 2014 OW Report.
Percentage of Children within Covered Population Though not explicitly stated, it appears that the 2014 OW Report assumed approximately 29% of the current covered population is made up of children when determining the total cost per covered person. The carrier data we collected indicated a slightly higher proportion of children, therefore our independent projection is based on the assumption of 32% for the commercial population. The data considered was prior to the implementation of health reform in 2014 and were not adjusted to
P a g e | 13
State of Hawaii Analysis of Cost of Certain ASD Services Final Report 12/05/14 reflect the impact of potential changes in the distribution of adults and children covered in the commercial market due to the implementation of health reform.
Prevalence of Autism
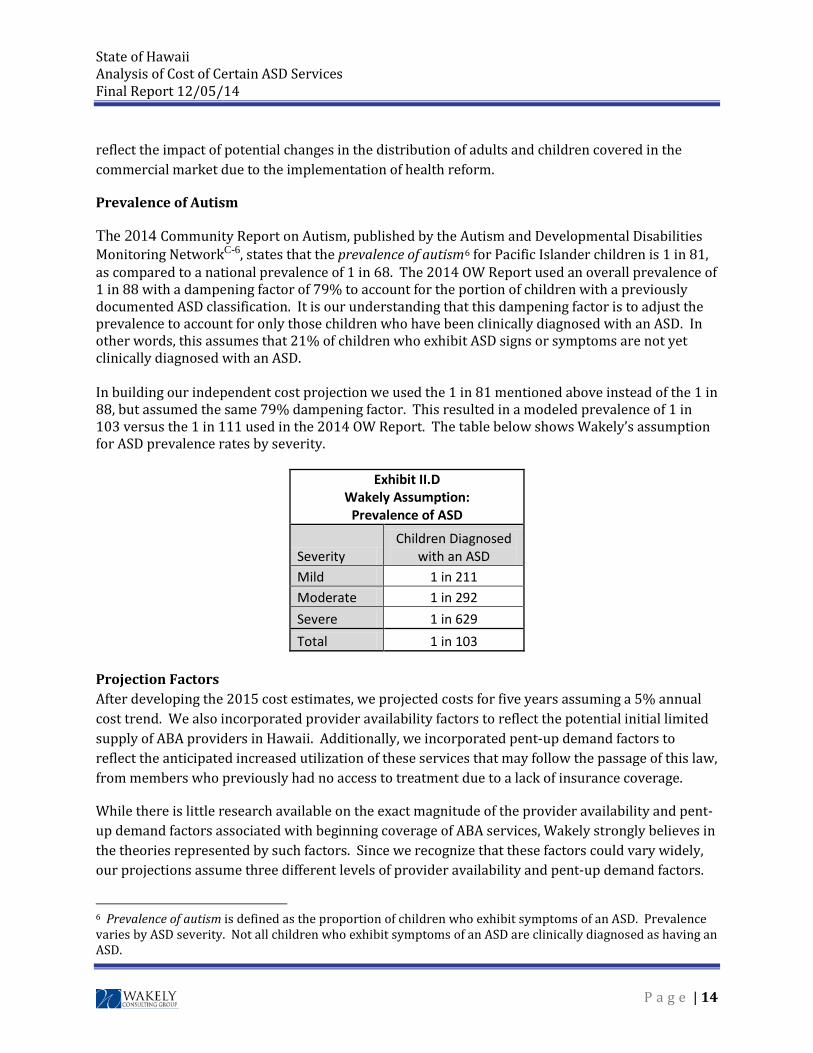
The 2014 Community Report on Autism, published by the Autism and Developmental Disabilities Monitoring NetworkC-6, states that the prevalence of autism6 for Pacific Islander children is 1 in 81, as compared to a national prevalence of 1 in 68. The 2014 OW Report used an overall prevalence of 1 in 88 with a dampening factor of 79% to account for the portion of children with a previously documented ASD classification. It is our understanding that this dampening factor is to adjust the prevalence to account for only those children who have been clinically diagnosed with an ASD. In other words, this assumes that 21% of children who exhibit ASD signs or symptoms are not yet clinically diagnosed with an ASD. In building our independent cost projection we used the 1 in 81 mentioned above instead of the 1 in 88, but assumed the same 79% dampening factor. This resulted in a modeled prevalence of 1 in 103 versus the 1 in 111 used in the 2014 OW Report. The table below shows Wakely’s assumption for ASD prevalence rates by severity.
Exhibit II.D Wakely Assumption:
Prevalence of ASD
Severity Children Diagnosed
with an ASD Mild 1 in 211 Moderate 1 in 292 Severe 1 in 629 Total 1 in 103
Projection Factors After developing the 2015 cost estimates, we projected costs for five years assuming a 5% annual cost trend. We also incorporated provider availability factors to reflect the potential initial limited supply of ABA providers in Hawaii. Additionally, we incorporated pent-up demand factors to reflect the anticipated increased utilization of these services that may follow the passage of this law, from members who previously had no access to treatment due to a lack of insurance coverage.
While there is little research available on the exact magnitude of the provider availability and pent-up demand factors associated with beginning coverage of ABA services, Wakely strongly believes in the theories represented by such factors. Since we recognize that these factors could vary widely, our projections assume three different levels of provider availability and pent-up demand factors.
6 Prevalence of autism is defined as the proportion of children who exhibit symptoms of an ASD. Prevalence varies by ASD severity. Not all children who exhibit symptoms of an ASD are clinically diagnosed as having an ASD.
P a g e | 14
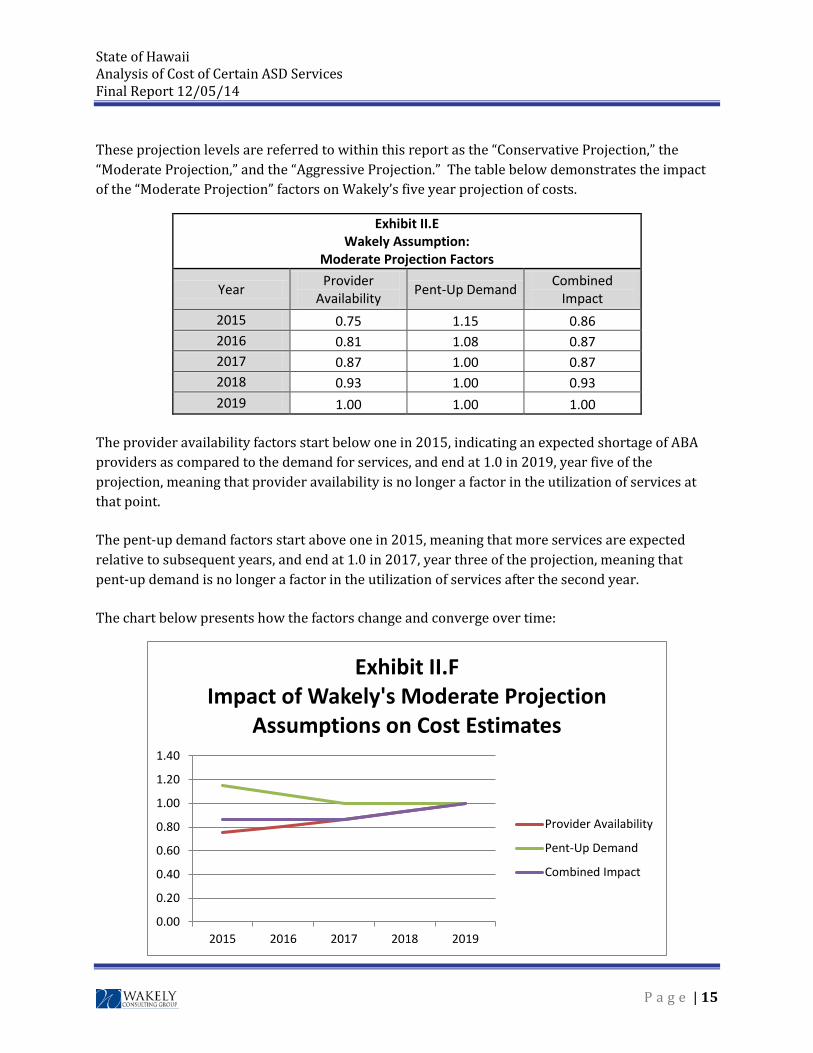
State of Hawaii Analysis of Cost of Certain ASD Services Final Report 12/05/14 These projection levels are referred to within this report as the “Conservative Projection,” the “Moderate Projection,” and the “Aggressive Projection.” The table below demonstrates the impact of the “Moderate Projection” factors on Wakely’s five year projection of costs.
Exhibit II.E Wakely Assumption:
Moderate Projection Factors
Year Provider Availability Pent-Up Demand Combined
Impact 2015 0.75 1.15 0.86 2016 0.81 1.08 0.87 2017 0.87 1.00 0.87 2018 0.93 1.00 0.93 2019 1.00 1.00 1.00
The provider availability factors start below one in 2015, indicating an expected shortage of ABA providers as compared to the demand for services, and end at 1.0 in 2019, year five of the projection, meaning that provider availability is no longer a factor in the utilization of services at that point.
The pent-up demand factors start above one in 2015, meaning that more services are expected relative to subsequent years, and end at 1.0 in 2017, year three of the projection, meaning that pent-up demand is no longer a factor in the utilization of services after the second year.
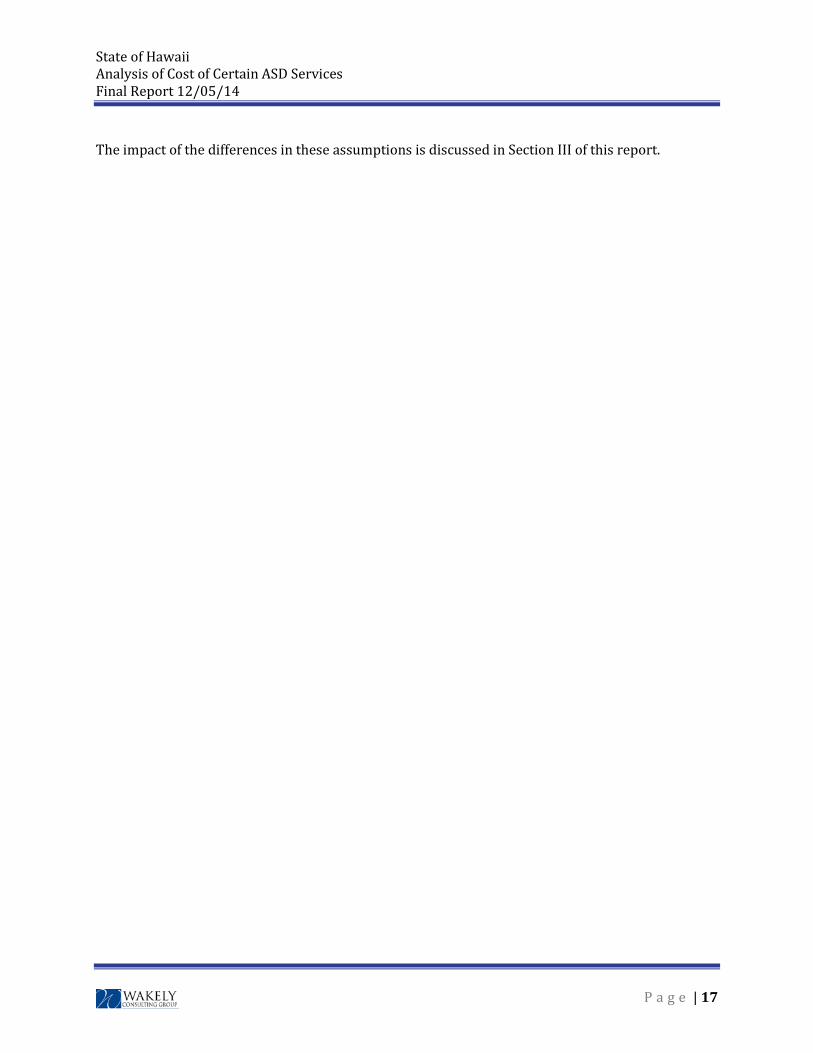
The chart below presents how the factors change and converge over time:
0.00
0.20
0.40
0.60
0.80
1.00
1.20
1.40
2015 2016 2017 2018 2019
Exhibit II.FImpact of Wakely's Moderate Projection
Assumptions on Cost Estimates
Provider Availability
Pent-Up Demand
Combined Impact
P a g e | 15

State of Hawaii Analysis of Cost of Certain ASD Services Final Report 12/05/14 By the year 2019, the provider availability and pent-up demand factors are assumed to converge to 1.0. That is, our study assumes that everyone who is eligible for and desires use of these services receives them in a timely manner by the year 2019, resulting in an ultimate cost which will increase only by medical trend in subsequent years.
Differences in Assumptions between Wakely and 2014 OW Report As a first step in evaluating the 2014 OW Report, Wakely built a cost model intended to reproduce the report results. We read the details included in the report regarding their general modeling process and incorporated all of the assumptions documented in Section 6 of the 2014 OW Report into our model. We filled in any apparent gaps with our best estimate of the assumptions used.
We were unable to exactly reproduce the results documented in the 2014 OW Report, but the results from our model were relatively similar to the reported results on a PMPM basis.
This re-pricing exercise served several purposes:
1. It helped us to verify the OW pricing approach.
2. It helped us to verify each of the assumptions employed.
3. It enabled us to evaluate the credibility and reasonability of OW’s pricing approach and assumptions.
4. It provided a foundation for us to begin our independent projection of costs.
For purposes of Wakely’s review, we recognize that two qualified actuaries could follow applicable ASOPs, each using reasonable methods and assumptions, and reach different, but reasonable, results. Therefore, we have allowed for differences in actuarial judgment in defining what we believe are reasonable assumptions, methods and results in our review.
There were some areas where our best estimate assumptions deviated significantly from those used in the 2014 OW Report. The significant differences are listed below:
1. Wakely assumed a higher ABA utilization rate.
2. Wakely assumed no benefit limits; OW assumed a $50,000 annual benefit limitation.
3. Wakely assumed lower annual ABA program hours.
4. Wakely assumed a higher ABA unit cost.
5. Wakely assumed a higher percentage of children within the covered population.
6. Wakely assumed a higher prevalence of autism.
P a g e | 16
State of Hawaii Analysis of Cost of Certain ASD Services Final Report 12/05/14 The impact of the differences in these assumptions is discussed in Section III of this report.
P a g e | 17
State of Hawaii Analysis of Cost of Certain ASD Services Final Report 12/05/14
III. Detailed Discussion of Findings
A detailed discussion of the findings of Wakely’s analysis follows.
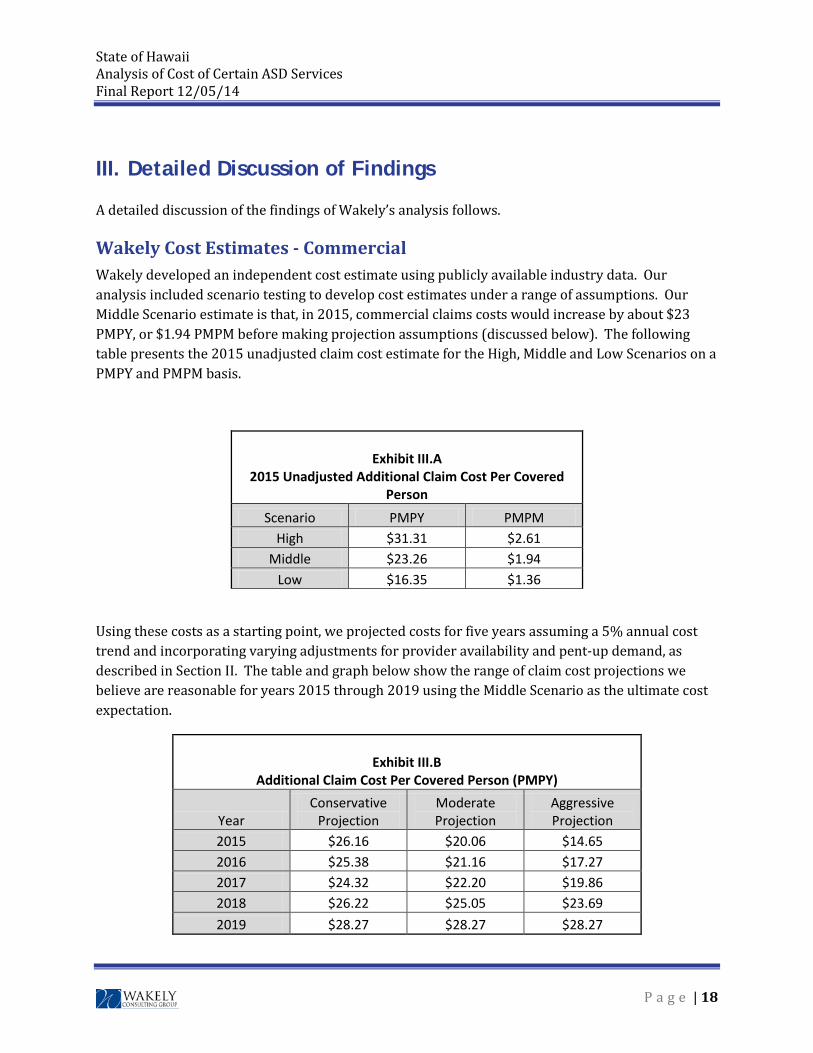
Wakely Cost Estimates - Commercial Wakely developed an independent cost estimate using publicly available industry data. Our analysis included scenario testing to develop cost estimates under a range of assumptions. Our Middle Scenario estimate is that, in 2015, commercial claims costs would increase by about $23 PMPY, or $1.94 PMPM before making projection assumptions (discussed below). The following table presents the 2015 unadjusted claim cost estimate for the High, Middle and Low Scenarios on a PMPY and PMPM basis.
Exhibit III.A
2015 Unadjusted Additional Claim Cost Per Covered Person
Scenario PMPY PMPM High $31.31 $2.61
Middle $23.26 $1.94 Low $16.35 $1.36
Using these costs as a starting point, we projected costs for five years assuming a 5% annual cost trend and incorporating varying adjustments for provider availability and pent-up demand, as described in Section II. The table and graph below show the range of claim cost projections we believe are reasonable for years 2015 through 2019 using the Middle Scenario as the ultimate cost expectation.
Exhibit III.B
Additional Claim Cost Per Covered Person (PMPY)
Year Conservative
Projection Moderate Projection
Aggressive Projection
2015 $26.16 $20.06 $14.65 2016 $25.38 $21.16 $17.27 2017 $24.32 $22.20 $19.86 2018 $26.22 $25.05 $23.69 2019 $28.27 $28.27 $28.27
P a g e | 18
State of Hawaii Analysis of Cost of Certain ASD Services Final Report 12/05/14
The projection results vary depending on the levels of provider availability and pent-up demand assumed (trend does not vary between each of the three projection levels), but we believe that the ultimate expected claim costs will converge at about $28 PMPY, or $2.36 PMPM, when both provider availability and pent-up demand are no longer a factor in the utilization of services.
Another way to look at the results is to start with all three cost scenarios, and then assume the Moderate Projection factors as a constant, as shown in the following table and graph.
Exhibit III.D Wakely Projection Estimates
Using Moderate Projection Assumptions
Year High Cost Scenario Middle Cost
Scenario Low Cost Scenario 2015 $27.00 $20.06 $14.10 2016 $28.48 $21.16 $14.87 2017 $29.89 $22.20 $15.61 2018 $33.73 $25.05 $17.61 2019 $38.06 $28.27 $19.87
$6
$11
$16
$21
$26
$31
$36
$41
2015 2016 2017 2018 2019Addi
tiona
l Cos
t Per
Mem
ber P
er Y
ear
Years
Exhibit III.CMiddle Cost Scenario - All Projection Levels
Conservative Projection
Moderate Projection
Aggressive Projection
P a g e | 19
State of Hawaii Analysis of Cost of Certain ASD Services Final Report 12/05/14
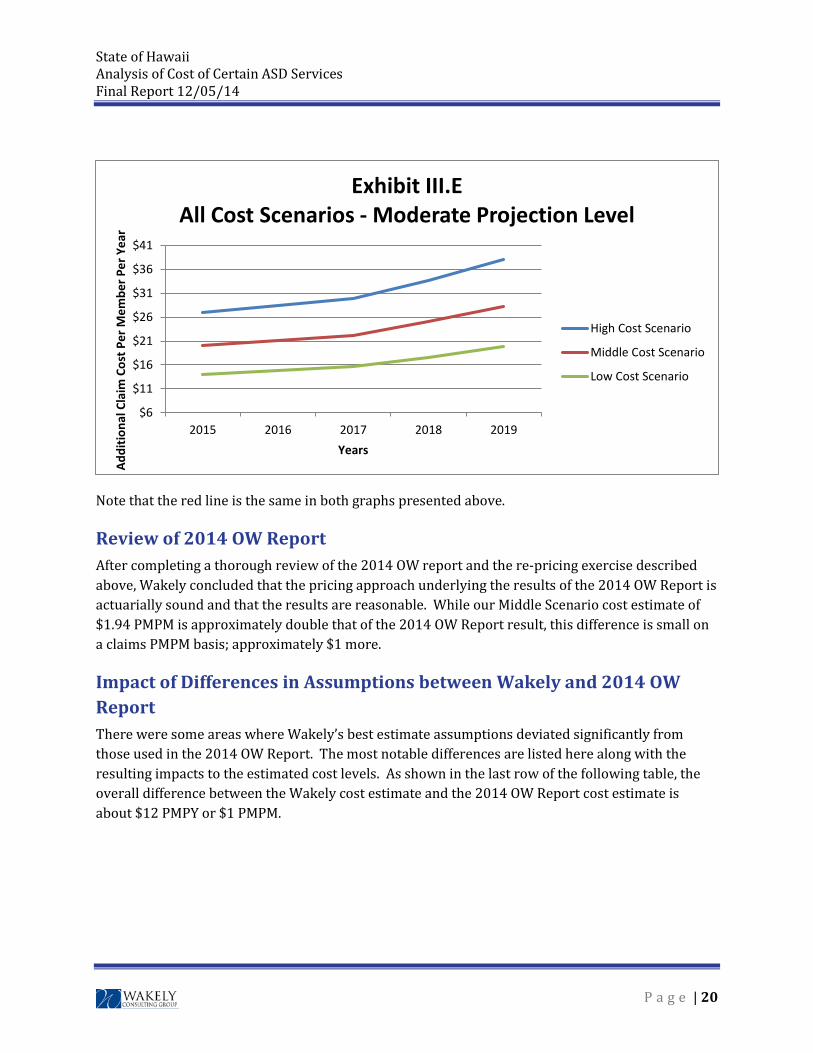
Note that the red line is the same in both graphs presented above.
Review of 2014 OW Report After completing a thorough review of the 2014 OW report and the re-pricing exercise described above, Wakely concluded that the pricing approach underlying the results of the 2014 OW Report is actuarially sound and that the results are reasonable. While our Middle Scenario cost estimate of $1.94 PMPM is approximately double that of the 2014 OW Report result, this difference is small on a claims PMPM basis; approximately $1 more.
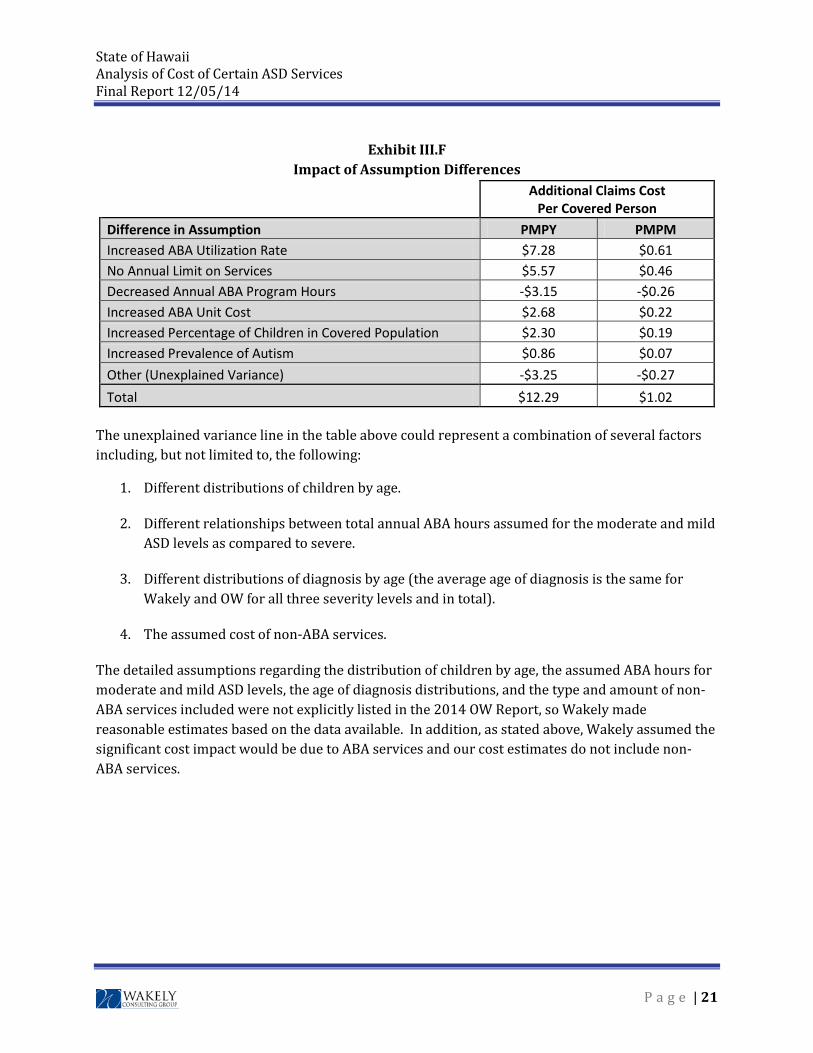
Impact of Differences in Assumptions between Wakely and 2014 OW Report There were some areas where Wakely’s best estimate assumptions deviated significantly from those used in the 2014 OW Report. The most notable differences are listed here along with the resulting impacts to the estimated cost levels. As shown in the last row of the following table, the overall difference between the Wakely cost estimate and the 2014 OW Report cost estimate is about $12 PMPY or $1 PMPM.
$6
$11
$16
$21
$26
$31
$36
$41
2015 2016 2017 2018 2019
Addi
tiona
l Cla
im C
ost P
er M
embe
r Per
Yea
r
Years
Exhibit III.EAll Cost Scenarios - Moderate Projection Level
High Cost Scenario
Middle Cost Scenario
Low Cost Scenario
P a g e | 20
State of Hawaii Analysis of Cost of Certain ASD Services Final Report 12/05/14
Exhibit III.F Impact of Assumption Differences
Additional Claims Cost Per Covered Person
Difference in Assumption PMPY PMPM Increased ABA Utilization Rate $7.28 $0.61 No Annual Limit on Services $5.57 $0.46 Decreased Annual ABA Program Hours -$3.15 -$0.26 Increased ABA Unit Cost $2.68 $0.22 Increased Percentage of Children in Covered Population $2.30 $0.19 Increased Prevalence of Autism $0.86 $0.07 Other (Unexplained Variance) -$3.25 -$0.27 Total $12.29 $1.02
The unexplained variance line in the table above could represent a combination of several factors including, but not limited to, the following:
1. Different distributions of children by age.
2. Different relationships between total annual ABA hours assumed for the moderate and mild ASD levels as compared to severe.
3. Different distributions of diagnosis by age (the average age of diagnosis is the same for Wakely and OW for all three severity levels and in total).
4. The assumed cost of non-ABA services.
The detailed assumptions regarding the distribution of children by age, the assumed ABA hours for moderate and mild ASD levels, the age of diagnosis distributions, and the type and amount of non-ABA services included were not explicitly listed in the 2014 OW Report, so Wakely made reasonable estimates based on the data available. In addition, as stated above, Wakely assumed the significant cost impact would be due to ABA services and our cost estimates do not include non-ABA services.
P a g e | 21
State of Hawaii Analysis of Cost of Certain ASD Services Final Report 12/05/14
IV. Medicaid Considerations
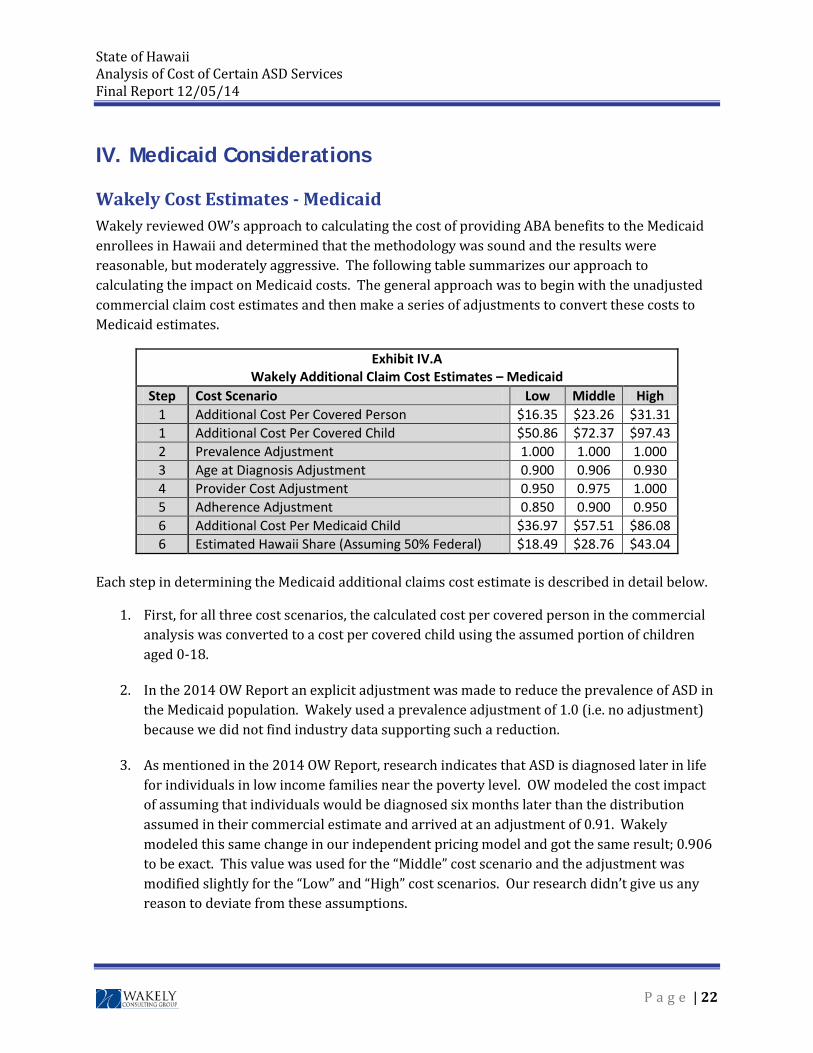
Wakely Cost Estimates - Medicaid Wakely reviewed OW’s approach to calculating the cost of providing ABA benefits to the Medicaid enrollees in Hawaii and determined that the methodology was sound and the results were reasonable, but moderately aggressive. The following table summarizes our approach to calculating the impact on Medicaid costs. The general approach was to begin with the unadjusted commercial claim cost estimates and then make a series of adjustments to convert these costs to Medicaid estimates.
Exhibit IV.A Wakely Additional Claim Cost Estimates – Medicaid
Step Cost Scenario Low Middle High 1 Additional Cost Per Covered Person $16.35 $23.26 $31.31 1 Additional Cost Per Covered Child $50.86 $72.37 $97.43 2 Prevalence Adjustment 1.000 1.000 1.000 3 Age at Diagnosis Adjustment 0.900 0.906 0.930 4 Provider Cost Adjustment 0.950 0.975 1.000 5 Adherence Adjustment 0.850 0.900 0.950 6 Additional Cost Per Medicaid Child $36.97 $57.51 $86.08 6 Estimated Hawaii Share (Assuming 50% Federal) $18.49 $28.76 $43.04
Each step in determining the Medicaid additional claims cost estimate is described in detail below.
1. First, for all three cost scenarios, the calculated cost per covered person in the commercial analysis was converted to a cost per covered child using the assumed portion of children aged 0-18.
2. In the 2014 OW Report an explicit adjustment was made to reduce the prevalence of ASD in the Medicaid population. Wakely used a prevalence adjustment of 1.0 (i.e. no adjustment) because we did not find industry data supporting such a reduction.
3. As mentioned in the 2014 OW Report, research indicates that ASD is diagnosed later in life for individuals in low income families near the poverty level. OW modeled the cost impact of assuming that individuals would be diagnosed six months later than the distribution assumed in their commercial estimate and arrived at an adjustment of 0.91. Wakely modeled this same change in our independent pricing model and got the same result; 0.906 to be exact. This value was used for the “Middle” cost scenario and the adjustment was modified slightly for the “Low” and “High” cost scenarios. Our research didn’t give us any reason to deviate from these assumptions.
P a g e | 22

State of Hawaii Analysis of Cost of Certain ASD Services Final Report 12/05/14
4. According to the 2014 OW Report, Medicaid programs typically reimburse providers at lower rates than commercial payers. We have assumed the same concept in our pricing model, but dampened the magnitude from a 5% discount to a 2.5% discount, after a conversation we had with Justin Birrell regarding Medicaid implications. It is his understanding that more Medicaid providers are seeking to be reimbursed at commercial contract levels.
5. We have relied upon the OW assumptions for the anticipated lower ABA program adherence for Medicaid versus Commercial enrollees. We have not found any support for changing these factors.
6. We calculate the additional claims cost estimate for the provision of ABA benefits to the Hawaii Medicaid enrollees by multiplying all of the items described above, resulting in a cost estimate range of $37 to $86 per year ($3 to $7 per month) per eligible Medicaid child. If we assume this will be shared approximately 50/50 with the Federal Government, the estimated Hawaii share would range from $18 to $43 per eligible Medicaid child per year or $1.50 to $3.50 per eligible Medicaid child per month. Based on the July 7, 2014 memo from the Center for Medicare and Medicaid Services (CMS), states have numerous options for being reimbursed for the coverage of services to treat ASDs under various authorities.C-7
The amounts shown above are 2015 estimates under each of Wakely’s cost scenarios, without any adjustments for provider availability or pent-up demand. The “Conservative Projection,” the “Moderate Projection,” and the “Aggressive Projection” assumptions described above for the commercial population can also be applied to the Medicaid cost estimates in order to prepare a five year projection of costs. It should be noted, however, that our research indicates that pent-up demand may be less significant for the Medicaid population as compared to the commercially insured population.
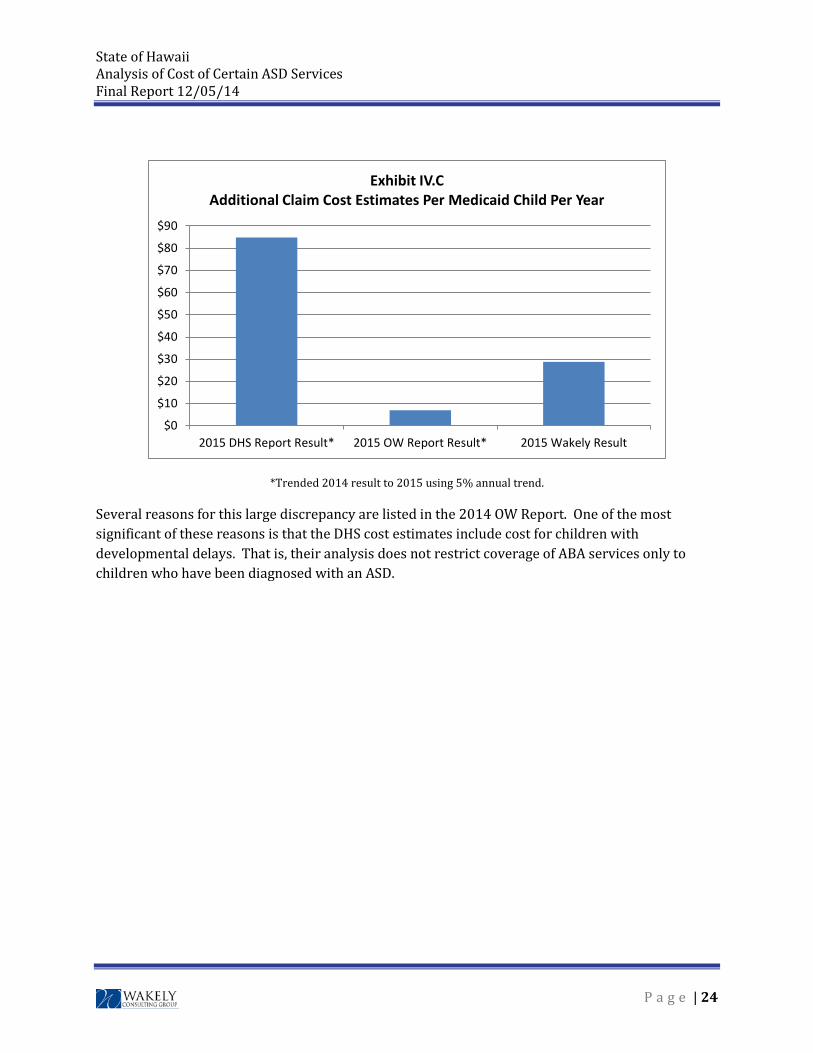
Wakely Review of 2014 DHS Report Wakely also briefly reviewed the “2014 DHS Report” regarding the coverage of behavioral health treatments for ASD in Hawaii's Medicaid program. This report indicated a far greater estimated cost for providing ABA services to the Medicaid population of Hawaii than the amounts calculated by either OW or Wakely as illustrated in the table and graph below.
Exhibit IV.B Additional Cost Per Medicaid Child Per Year
Estimated Hawaii Share (Assuming 50% Federal)
Cost Scenario 2015 DHS Report
Result* 2015 OW Report
Result* 2015 Wakely
Result Middle $84.89 $6.92 $28.76
P a g e | 23
State of Hawaii Analysis of Cost of Certain ASD Services Final Report 12/05/14
*Trended 2014 result to 2015 using 5% annual trend.
Several reasons for this large discrepancy are listed in the 2014 OW Report. One of the most significant of these reasons is that the DHS cost estimates include cost for children with developmental delays. That is, their analysis does not restrict coverage of ABA services only to children who have been diagnosed with an ASD.
$0
$10
$20
$30
$40
$50
$60
$70
$80
$90
2015 DHS Report Result* 2015 OW Report Result* 2015 Wakely Result
Exhibit IV.CAdditional Claim Cost Estimates Per Medicaid Child Per Year
P a g e | 24
State of Hawaii Analysis of Cost of Certain ASD Services Final Report 12/05/14 V. Impact of Other Potential Provisions
Impact of Including Developmental Delays Wakely completed a separate analysis to assess the impact of including all children with developmental delays in the cost estimate of providing coverage for ABA services. According to a survey conducted by the CDCC-8, the population of children with a developmental delay other than autism is about 1.5 times as large as the ASD population. Additionally, these children utilize ABA services about half as often as autistic children do. We modeled the pricing impact of adding these children and determined that this would increase the estimated costs by almost 75%.
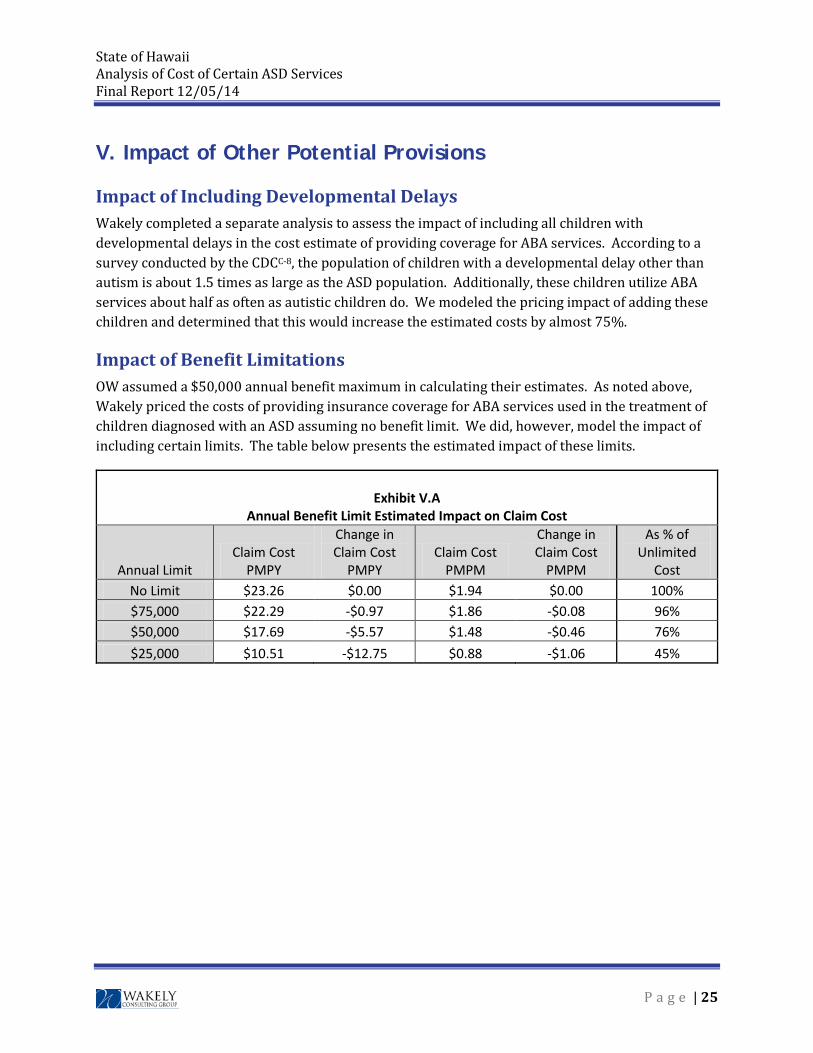
Impact of Benefit Limitations OW assumed a $50,000 annual benefit maximum in calculating their estimates. As noted above, Wakely priced the costs of providing insurance coverage for ABA services used in the treatment of children diagnosed with an ASD assuming no benefit limit. We did, however, model the impact of including certain limits. The table below presents the estimated impact of these limits.
Exhibit V.A
Annual Benefit Limit Estimated Impact on Claim Cost
Annual Limit Claim Cost
PMPY
Change in Claim Cost
PMPY Claim Cost
PMPM
Change in Claim Cost
PMPM
As % of Unlimited
Cost No Limit $23.26 $0.00 $1.94 $0.00 100% $75,000 $22.29 -$0.97 $1.86 -$0.08 96% $50,000 $17.69 -$5.57 $1.48 -$0.46 76% $25,000 $10.51 -$12.75 $0.88 -$1.06 45%
P a g e | 25
State of Hawaii Analysis of Cost of Certain ASD Services Final Report 12/05/14 VI. Conclusion
The results of our analysis are based on reasonable data and assumptions available at the time this report was written, as documented within this report. The techniques and methods used abide by generally accepted actuarial principles and ASOPs. The true results will be based on actual cost and utilization of covered services, may vary significantly from the estimates presented in this report, and may take up to two or three years to be fully realized. The impact between various commercial insurance markets was beyond the scope of this engagement and has not been considered in this analysis. Should coverage for the treatment of ASDs be mandated only for a particular subset of the commercial insurance market there may be a significant anti-selection issue generated among the various markets. For example, if coverage is only mandated for “off-exchange” plans and not mandated for “exchange” plans, the off-exchange plans may get a disproportionate share of children with ASDs enrolled in those plans. Finally, while understanding the medical cost impact of covering the treatment of ASDs is important, there are other social and economic benefits which may offset the increase in medical costs that are not considered in the results presented in this report.
P a g e | 26
State of Hawaii Analysis of Cost of Certain ASD Services Final Report 12/05/14
Appendix A: Scope of Work
The scope of work for this engagement included:
a) Evaluate the 2014 study on Hawaii autism costs by Oliver Wyman, including the source information;
b) Evaluate the data and studies on autism from Hawaii’s Medicaid program;
c) Determine if the cost estimates in these studies are credible and reasonable;
d) Project the costs of providing insurance coverage for the screening, diagnosis, and treatment of autism spectrum disorders based on the data in (a) and (b) and other publicly available data;
e) Project the cost impact of providing autism coverage on Hawaii’s Medicaid program;
f) Submit a written report on these topics in accordance with SB 2054, CD 1 in sufficient time for the insurance commissioner to submit a report to the legislature no later than twenty days prior to the convening of the 2015 session of the Hawaii Legislature; and,
g) Testify publicly about the findings of the report, including testimony at the Hawaii Legislature.
P a g e | 27
State of Hawaii Analysis of Cost of Certain ASD Services Final Report 12/05/14
Appendix B: SB 2054
P a g e | 28
State of Hawaii Analysis of Cost of Certain ASD Services Final Report 12/05/14
Appendix C: Data Sources
1. Autism Speaks: http://www.autismspeaks.org/what-autism/treatment/applied-behavior-analysis-aba (as of November 24, 2014)
2. California Health Benefits Review Program - Analysis of Senate Bill 126: Health Care Coverage: Pervasive Developmental Disorder or Autism (File: SB126_13_FullReport.pdf): http://chbrp.ucop.edu/index.php?action=read&bill_id=135&doc_type=3 (as of November 24, 2014)
3. CDC, Potential impact of DSM-5 criteria on autism spectrum disorder (ASD) prevalence estimates: http://www.cdc.gov/ncbddd/autism/features/impact-dsm5.html (as of December 5, 2014)
4. California To Start Medicaid Coverage Monday for ABA For Autism: Advocacy News, Autism Speaks: http://www.autismspeaks.org/advocacy/advocacy-news/california-start-medicaid-coverage-monday-aba-autism (as of November 24, 2014)
5. Jenny Armanious, Board Certified Behavior Analyst Stacey Peters, School Based Behavior Specialist
6. Autism Spectrum Disorder (ASD) Data & Statistics (File: CDC _ Data and Statistics _ Autism Spectrum Disorder (ASD) _ NCBDDD.pdf): http://www.cdc.gov/NCBDDD/autism/data.html (as of November 24, 2014)
7. CMS, Clarification of Medicaid Coverage of Services to Children with Autism, July 7, 2014
8. CDC, Survey of Pathways to Diagnosis and Services, 2011
P a g e | 32
State of Hawaii Analysis of Cost of Certain ASD Services Final Report 12/05/14 Appendix D: Oliver Wyman Report
P a g e | 33
ACTUARIAL COST ESTIMATE: HAWAII SENATE BILL 2054 SD1
THE PURPOSE OF THIS ACT IS TO ENSURE THE PROVISION OF QUALITY HEALTH CARE FOR ALL HAWAII RESIDENTS BY REQUIRING COVERAGE OF TREATMENT FOR AUTISM SPECTRUM DISORDERS: “LUKE’S LAW”
February 26, 2014
Marc Lambright, FSA, MAAA
ACTUARIAL COST ESTIMATE – HAWAII SB 2054
OLIVER WYMAN
i
CONTENTS 1. Executive Summary .................................................................................................... 1 2. Background ................................................................................................................. 4 3. Scope and Limitations ................................................................................................. 5 4. Description of Key SB 2054 Provisions and Their Impact on Covered Benefits ......... 6
• Insurance Markets Covered by SB 2054 .............................................................. 6 • Covered Benefits ................................................................................................... 6
5. Modeling Methodology ................................................................................................ 8 • Modeling Perspective ............................................................................................ 8 • Emerging Cost Experience for Autism Coverage .................................................. 8 • General Modeling Process .................................................................................. 11
6. Summary of Key Assumptions .................................................................................. 12 • Treated Prevalence and Age at Diagnosis .......................................................... 12 • ABA Program Utilization and Cost ...................................................................... 13
7. Cost Estimates .......................................................................................................... 17 • Group Markets Long-Term Cost Estimates - “Middle” Cost Scenario ................. 17 • Scenario Estimates ............................................................................................. 17 • Group Markets Short-Term Cost Estimates by Scenario .................................... 18 • Individual Market and State Plan Cost Estimates ............................................... 20
8. Cost Estimates- Medicaid ......................................................................................... 21 • Medicaid Long-Term Cost Estimates .................................................................. 21 • Medicaid Short-Term Cost Estimates ................................................................. 22 • Differences with February 11, 2014 DHS Cost Estimate .................................... 23
9. Cost – Benefit Analysis for ASD Treatments ............................................................ 25 • Cost – Benefit Analysis for ASD Treatments ...................................................... 25 • Societal Costs of Autism- Ganz Report ............................................................... 25 • Cost Savings to State and Local Governments .................................................. 26
Cost Assumptions – Illustrative Exhibits Senate Bill 2054 SD1 Text DHS Cost Testimony
ACTUARIAL COST ESTIMATE – HAWAII SB 2054
OLIVER WYMAN
1
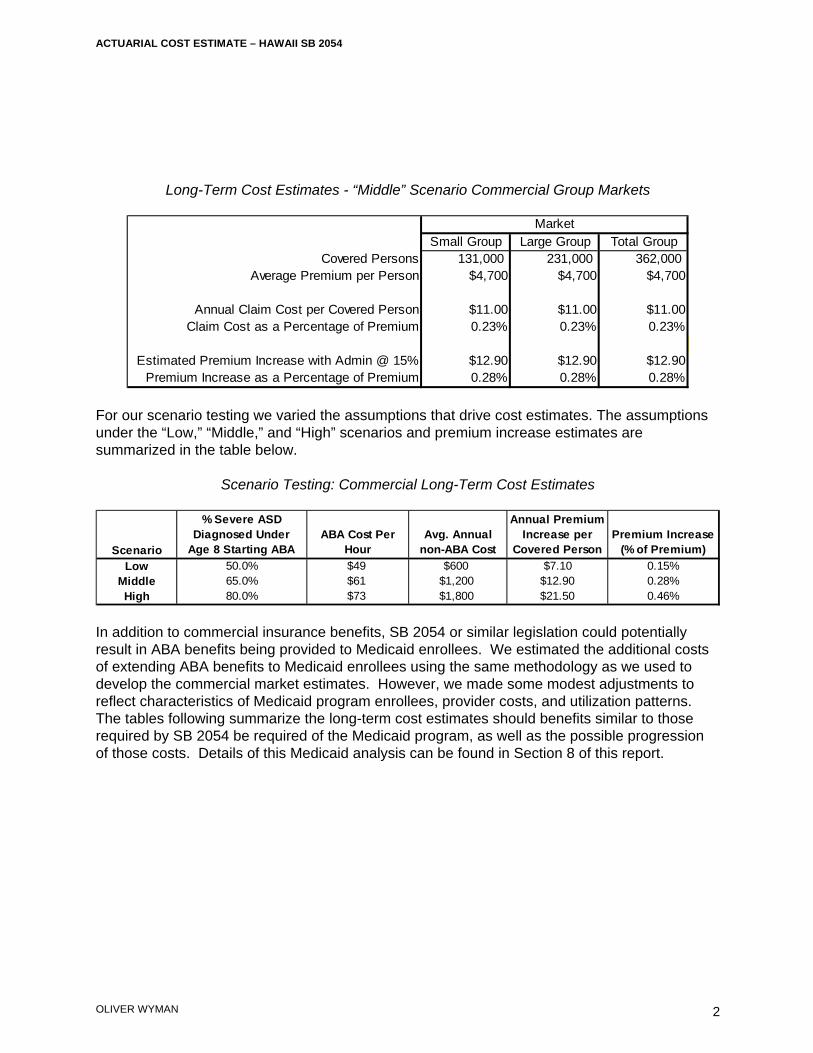
1 Executive Summary Oliver Wyman Actuarial Consulting, Inc. (Oliver Wyman) has been engaged by Autism Speaks to develop a cost model in order to analyze and estimate the impact of commercial insurance and Medicaid benefits for autism spectrum disorders (ASDs) under Hawaii Senate Bill 2054 SD1 that will be referred to as SB 2054 throughout this report. The most significant class of treatments covered under SB 2054 is behavioral health treatments, which is referred to as applied behavior analysis, or “ABA,” throughout this document, since ABA is one of the most common behavioral health treatments and the general approach and costs for ABA are assumed to be similar to those of other intensive behavioral health treatments. The key provisions of SB 2054 are explained further in Section 4 of this report. Our analysis involved developing a robust model that reflects the likely behavior of consumers, providers and insurers of ABA services, and includes Hawaii demographic and insurance market information. Key assumptions, including the treated prevalence of ASD, the age of diagnosis, ABA program utilization by age, ABA annual costs by age, and additional other (i.e., non-ABA) medical costs, as well as the modeling methodology are explained in detail in Sections 5 and 6 of this report and summarized through graphs in the Appendices. Our analysis included scenario testing to develop cost estimates under a range of assumptions. Our “Middle” estimate is that, in the long-term, commercial claims costs would increase by about 0.23% of premiums and premiums would increase by about 0.28% should SB 2054 be enacted. Our estimated range of long-term premium increases is 0.15% to 0.46% based on our “Low” and “High” estimates. We expect that commercial premium increases would be lower in the years immediately following the passage of a law consistent with the provisions of SB 2054, with first year premium increases in the range of 0.05% to 0.31%. Our expectation of lower first year costs is based on experiences in other states that have seen low initial costs when ASD benefits were first covered. These lower costs can be expected due to the lags typically seen in accessing new benefits and the limited supply of ABA providers. The estimated long-term cost increases for our “Middle” scenario, along with some statistics for the individual, small, and large group markets, are shown in the table below.
ACTUARIAL COST ESTIMATE – HAWAII SB 2054
OLIVER WYMAN
2
Long-Term Cost Estimates - “Middle” Scenario Commercial Group Markets
For our scenario testing we varied the assumptions that drive cost estimates. The assumptions under the “Low,” “Middle,” and “High” scenarios and premium increase estimates are summarized in the table below.
Scenario Testing: Commercial Long-Term Cost Estimates
In addition to commercial insurance benefits, SB 2054 or similar legislation could potentially result in ABA benefits being provided to Medicaid enrollees. We estimated the additional costs of extending ABA benefits to Medicaid enrollees using the same methodology as we used to develop the commercial market estimates. However, we made some modest adjustments to reflect characteristics of Medicaid program enrollees, provider costs, and utilization patterns. The tables following summarize the long-term cost estimates should benefits similar to those required by SB 2054 be required of the Medicaid program, as well as the possible progression of those costs. Details of this Medicaid analysis can be found in Section 8 of this report.
Small Group Large Group Total GroupCovered Persons 131,000 231,000 362,000
Average Premium per Person $4,700 $4,700 $4,700
Annual Claim Cost per Covered Person $11.00 $11.00 $11.00Claim Cost as a Percentage of Premium 0.23% 0.23% 0.23%
Estimated Premium Increase with Admin @ 15% $12.90 $12.90 $12.90Premium Increase as a Percentage of Premium 0.28% 0.28% 0.28%
Market
Scenario
% Severe ASD Diagnosed Under
Age 8 Starting ABAABA Cost Per
HourAvg. Annual
non-ABA Cost
Annual Premium Increase per
Covered PersonPremium Increase
(% of Premium)
Low 50.0% $49 $600 $7.10 0.15%Middle 65.0% $61 $1,200 $12.90 0.28%High 80.0% $73 $1,800 $21.50 0.46%
ACTUARIAL COST ESTIMATE – HAWAII SB 2054
OLIVER WYMAN
3
Long-Term Cost Estimates – Medicaid
Progression of Costs Estimates – Medicaid
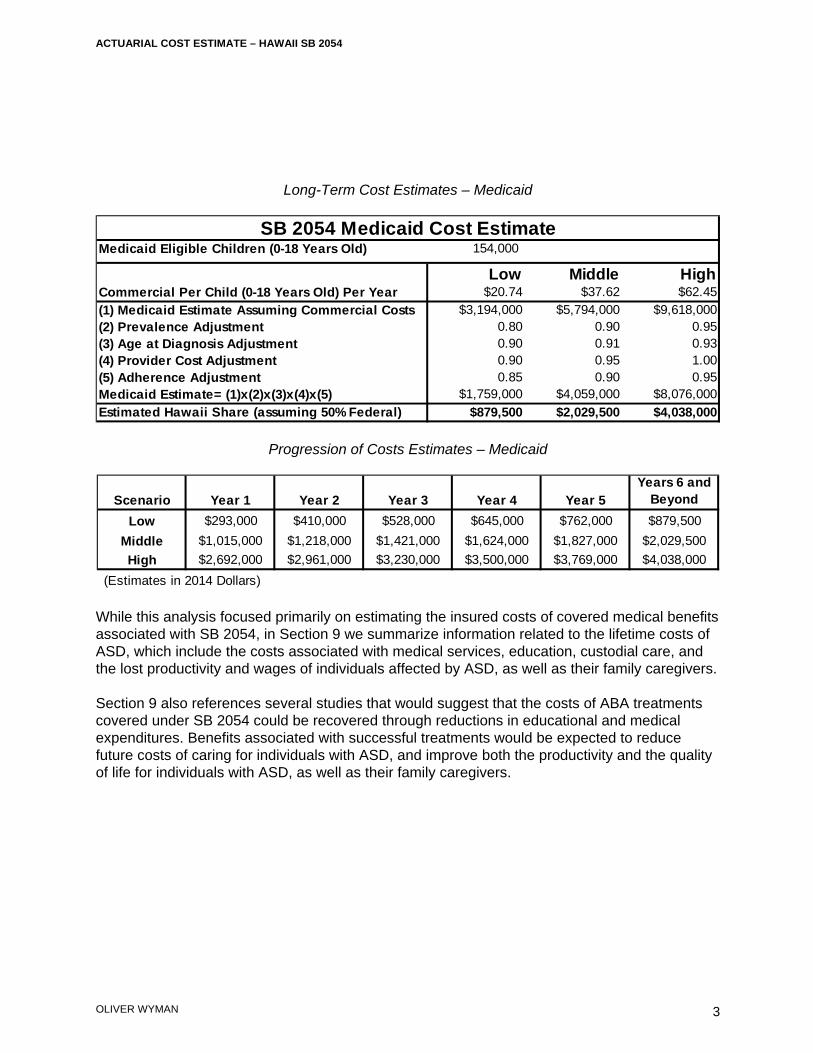
While this analysis focused primarily on estimating the insured costs of covered medical benefits associated with SB 2054, in Section 9 we summarize information related to the lifetime costs of ASD, which include the costs associated with medical services, education, custodial care, and the lost productivity and wages of individuals affected by ASD, as well as their family caregivers. Section 9 also references several studies that would suggest that the costs of ABA treatments covered under SB 2054 could be recovered through reductions in educational and medical expenditures. Benefits associated with successful treatments would be expected to reduce future costs of caring for individuals with ASD, and improve both the productivity and the quality of life for individuals with ASD, as well as their family caregivers.
Medicaid Eligible Children (0-18 Years Old) 154,000
Low Middle HighCommercial Per Child (0-18 Years Old) Per Year $20.74 $37.62 $62.45(1) Medicaid Estimate Assuming Commercial Costs $3,194,000 $5,794,000 $9,618,000(2) Prevalence Adjustment 0.80 0.90 0.95(3) Age at Diagnosis Adjustment 0.90 0.91 0.93(4) Provider Cost Adjustment 0.90 0.95 1.00(5) Adherence Adjustment 0.85 0.90 0.95Medicaid Estimate= (1)x(2)x(3)x(4)x(5) $1,759,000 $4,059,000 $8,076,000Estimated Hawaii Share (assuming 50% Federal) $879,500 $2,029,500 $4,038,000
SB 2054 Medicaid Cost Estimate
Scenario Year 1 Year 2 Year 3 Year 4 Year 5Years 6 and
Beyond
Low $293,000 $410,000 $528,000 $645,000 $762,000 $879,500Middle $1,015,000 $1,218,000 $1,421,000 $1,624,000 $1,827,000 $2,029,500High $2,692,000 $2,961,000 $3,230,000 $3,500,000 $3,769,000 $4,038,000
(Estimates in 2014 Dollars)
ACTUARIAL COST ESTIMATE – HAWAII SB 2054
OLIVER WYMAN
4
2 Background Oliver Wyman Actuarial Consulting, Inc. (Oliver Wyman) has been engaged by Autism Speaks to develop a cost model in order to analyze and estimate the impact of legislation providing for additional insurance benefits for autism spectrum disorders (ASDs) on insurance premiums. As part of this work, Oliver Wyman has developed a range of independent estimates of the impact of SB 2054 on insurance premiums, which provides coverage for the diagnosis and treatment of ASDs. Oliver Wyman is a part of the Marsh & McLennan family of companies. With 80 members of the American Academy of Actuaries, Oliver Wyman is one of the largest actuarial practices in North America. Oliver Wyman’s health practice, which has seventeen credentialed actuaries, advises insurers, regulators, governments, interest groups, and others. This report, along with its supporting analysis, was developed by Marc Lambright, a Principal and consulting actuary in Oliver Wyman’s Philadelphia office. Marc is a Fellow of the Society of Actuaries and a member of the American Academy of Actuaries and is professionally qualified to analyze the cost impact of SB 2054 and provide the estimates shown in this report. As part of Oliver Wyman’s quality assurance process, the underlying analysis and this report were independently peer reviewed by another credentialed Oliver Wyman actuary.
ACTUARIAL COST ESTIMATE – HAWAII SB 2054
OLIVER WYMAN
5
3 Scope and Limitations The intent of this analysis is to provide a reasonable range of estimates for the incremental insured costs of the ASD benefits provided for by SB 2054 and the associated premium impact on the Hawaii commercial insurance market, as well as the Hawaii Medicaid program should similar benefits be covered by Medicaid. This analysis also identifies and partially quantifies identified offsetting cost savings associated with successful ASD treatment. We note that cost estimates associated with autism coverage legislation have varied widely state to state based on state specific differences in legislation and the methods and assumptions used in estimating costs, though typically independent estimates show premium increases due to legislation covering additional autism benefits of less than 1%. A growing amount of actual cost data shows that the initial costs associated with autism insurance laws similar to SB 2054 have been low. This emerging experience is discussed in Section 5. While the ultimate cost of covering ABA benefits is uncertain, this analysis reflects the likely behavior of consumers, providers, and insurers of ABA services in developing the assumptions underlying the cost estimates. Likewise, the additional costs for medical services other than ABA are uncertain. Insurance policies often cover certain services for children diagnosed with an ASD, although the legislation could cause the insured costs for these services to increase because ASD exclusions or limitations are common. Certain services that may have been initially denied or terminated following utilization review or benefit limitations might be covered with the passage of legislation consistent with SB 2054.
ACTUARIAL COST ESTIMATE – HAWAII SB 2054
OLIVER WYMAN
6
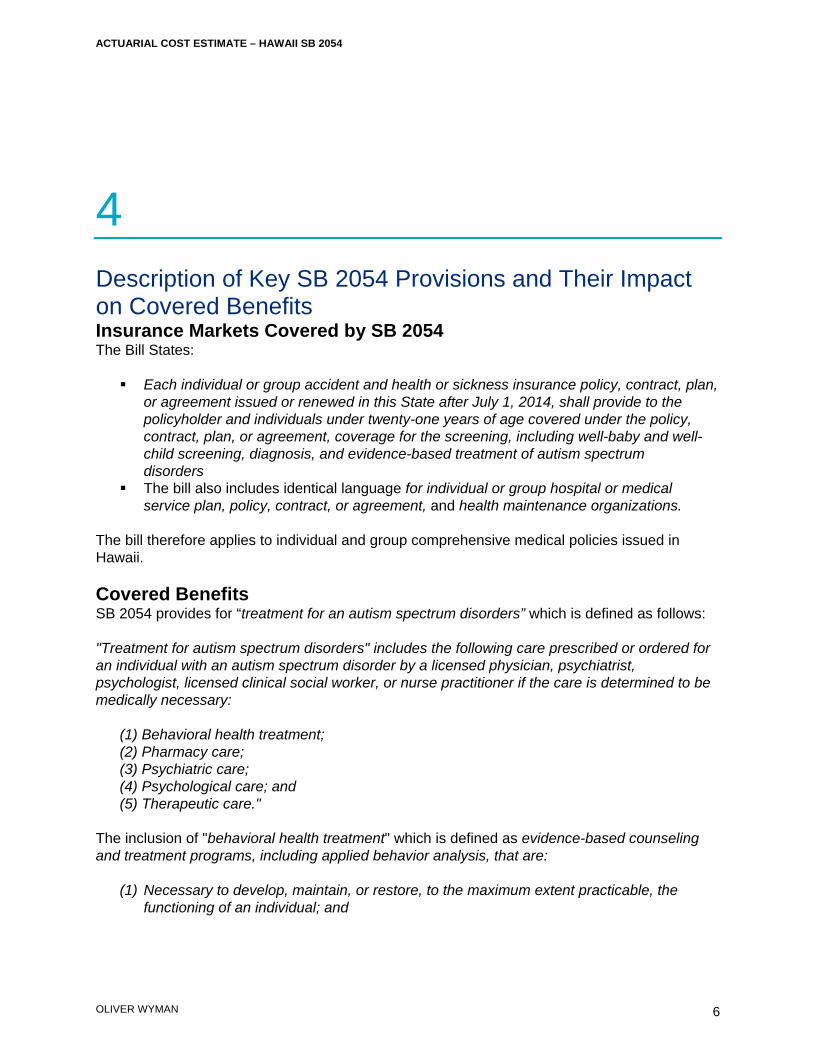
4 Description of Key SB 2054 Provisions and Their Impact on Covered Benefits Insurance Markets Covered by SB 2054 The Bill States: Each individual or group accident and health or sickness insurance policy, contract, plan,
or agreement issued or renewed in this State after July 1, 2014, shall provide to the policyholder and individuals under twenty-one years of age covered under the policy, contract, plan, or agreement, coverage for the screening, including well-baby and well-child screening, diagnosis, and evidence-based treatment of autism spectrum disorders
The bill also includes identical language for individual or group hospital or medical service plan, policy, contract, or agreement, and health maintenance organizations.
The bill therefore applies to individual and group comprehensive medical policies issued in Hawaii. Covered Benefits SB 2054 provides for “treatment for an autism spectrum disorders” which is defined as follows: "Treatment for autism spectrum disorders" includes the following care prescribed or ordered for an individual with an autism spectrum disorder by a licensed physician, psychiatrist, psychologist, licensed clinical social worker, or nurse practitioner if the care is determined to be medically necessary:
(1) Behavioral health treatment; (2) Pharmacy care; (3) Psychiatric care; (4) Psychological care; and (5) Therapeutic care."
The inclusion of "behavioral health treatment" which is defined as evidence-based counseling and treatment programs, including applied behavior analysis, that are:
(1) Necessary to develop, maintain, or restore, to the maximum extent practicable, the functioning of an individual; and
ACTUARIAL COST ESTIMATE – HAWAII SB 2054
OLIVER WYMAN
7
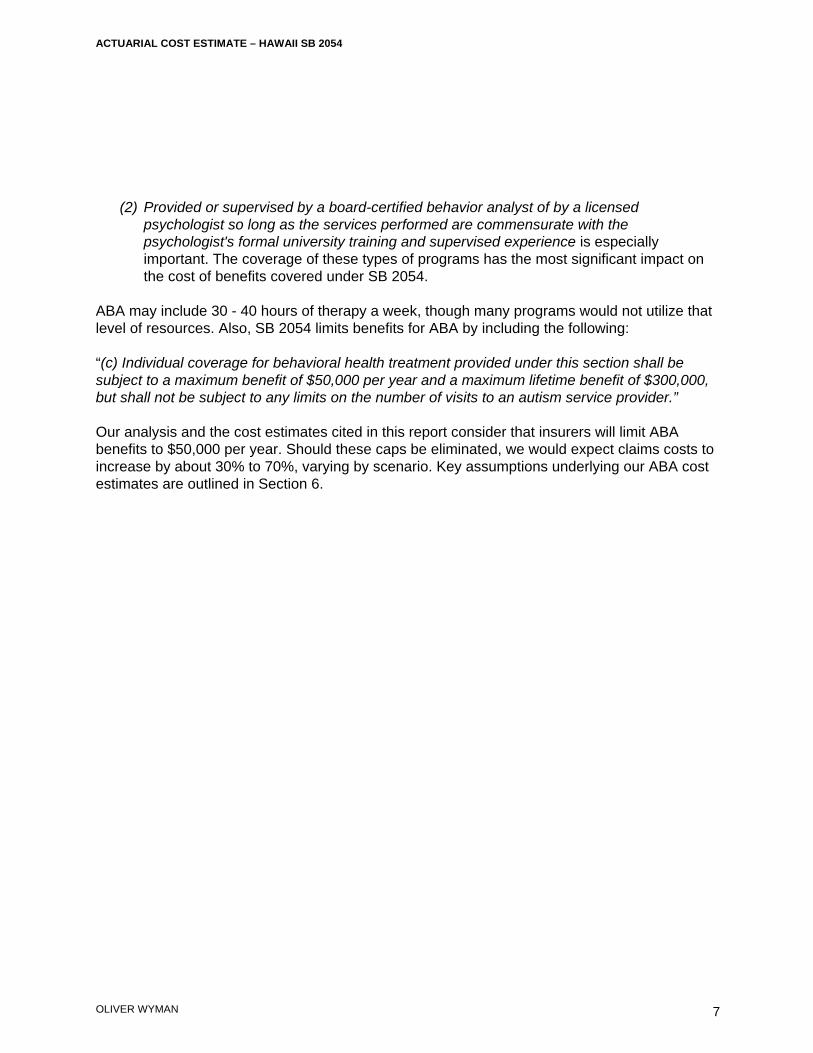
(2) Provided or supervised by a board-certified behavior analyst of by a licensed
psychologist so long as the services performed are commensurate with the psychologist's formal university training and supervised experience is especially important. The coverage of these types of programs has the most significant impact on the cost of benefits covered under SB 2054.
ABA may include 30 - 40 hours of therapy a week, though many programs would not utilize that level of resources. Also, SB 2054 limits benefits for ABA by including the following: “(c) Individual coverage for behavioral health treatment provided under this section shall be subject to a maximum benefit of $50,000 per year and a maximum lifetime benefit of $300,000, but shall not be subject to any limits on the number of visits to an autism service provider.” Our analysis and the cost estimates cited in this report consider that insurers will limit ABA benefits to $50,000 per year. Should these caps be eliminated, we would expect claims costs to increase by about 30% to 70%, varying by scenario. Key assumptions underlying our ABA cost estimates are outlined in Section 6.
ACTUARIAL COST ESTIMATE – HAWAII SB 2054
OLIVER WYMAN
8
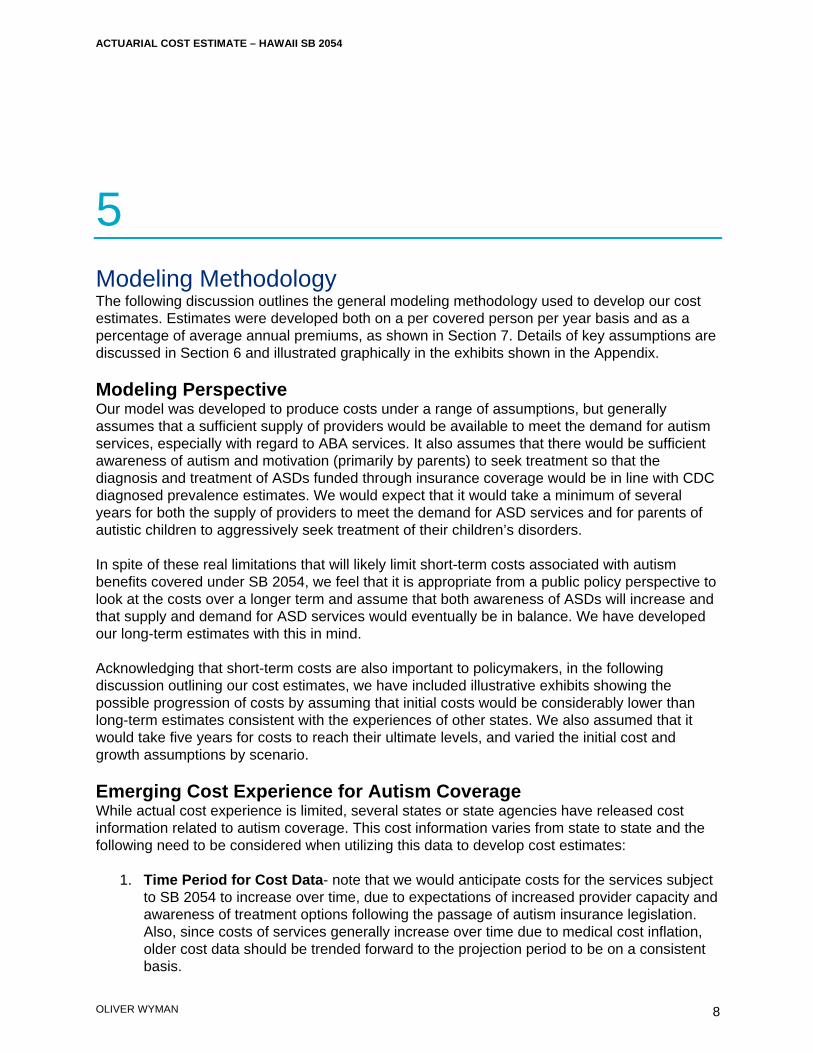
5 Modeling Methodology The following discussion outlines the general modeling methodology used to develop our cost estimates. Estimates were developed both on a per covered person per year basis and as a percentage of average annual premiums, as shown in Section 7. Details of key assumptions are discussed in Section 6 and illustrated graphically in the exhibits shown in the Appendix. Modeling Perspective Our model was developed to produce costs under a range of assumptions, but generally assumes that a sufficient supply of providers would be available to meet the demand for autism services, especially with regard to ABA services. It also assumes that there would be sufficient awareness of autism and motivation (primarily by parents) to seek treatment so that the diagnosis and treatment of ASDs funded through insurance coverage would be in line with CDC diagnosed prevalence estimates. We would expect that it would take a minimum of several years for both the supply of providers to meet the demand for ASD services and for parents of autistic children to aggressively seek treatment of their children’s disorders. In spite of these real limitations that will likely limit short-term costs associated with autism benefits covered under SB 2054, we feel that it is appropriate from a public policy perspective to look at the costs over a longer term and assume that both awareness of ASDs will increase and that supply and demand for ASD services would eventually be in balance. We have developed our long-term estimates with this in mind. Acknowledging that short-term costs are also important to policymakers, in the following discussion outlining our cost estimates, we have included illustrative exhibits showing the possible progression of costs by assuming that initial costs would be considerably lower than long-term estimates consistent with the experiences of other states. We also assumed that it would take five years for costs to reach their ultimate levels, and varied the initial cost and growth assumptions by scenario. Emerging Cost Experience for Autism Coverage While actual cost experience is limited, several states or state agencies have released cost information related to autism coverage. This cost information varies from state to state and the following need to be considered when utilizing this data to develop cost estimates:
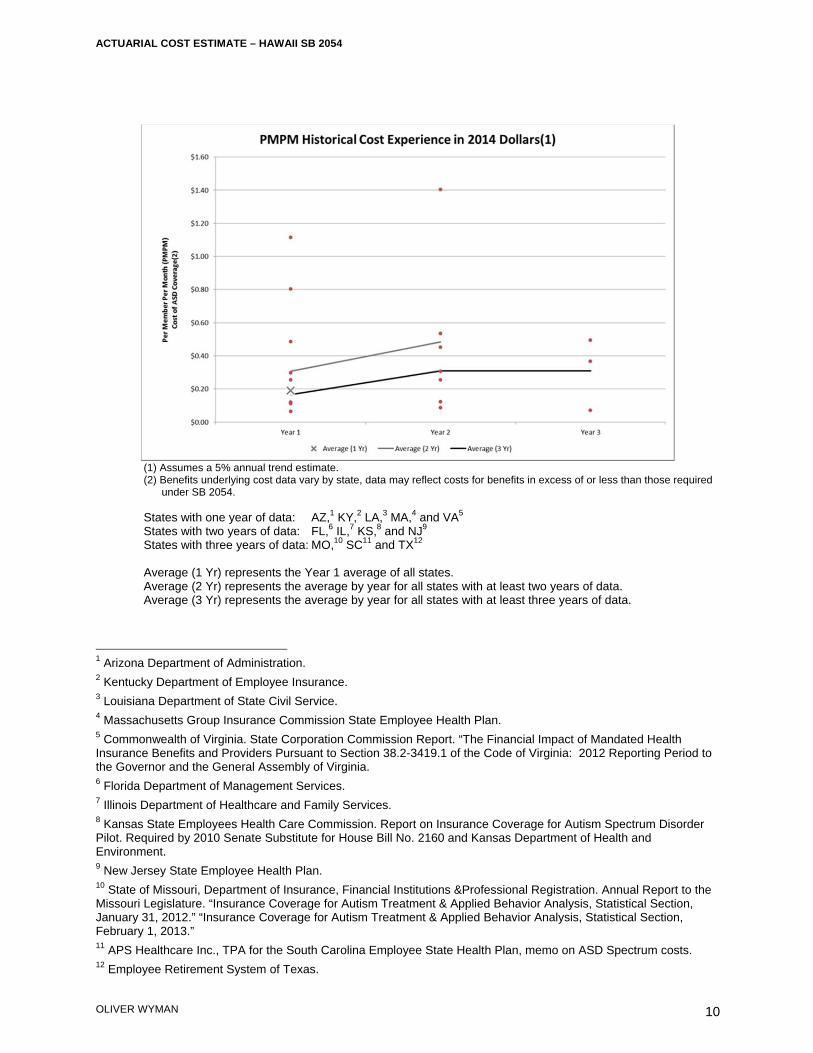
1. Time Period for Cost Data- note that we would anticipate costs for the services subject to SB 2054 to increase over time, due to expectations of increased provider capacity and awareness of treatment options following the passage of autism insurance legislation. Also, since costs of services generally increase over time due to medical cost inflation, older cost data should be trended forward to the projection period to be on a consistent basis.
ACTUARIAL COST ESTIMATE – HAWAII SB 2054
OLIVER WYMAN
9
2. Underlying Services in Cost Data- The cost data reflects different types of costs for autism services (e.g., ABA only, incremental, and total ASD costs) and collection procedures, both of which need to be considered when comparing historical costs in other states to the projected cost impact of SB 2054. For instance the data for Massachusetts and New Jersey (highest data points) includes all costs for services associated with ASD codes of 299.xx which would overstate the cost impact of the law since certain services would have been provided to individuals with ASD prior to the passage of the autism legislation.
Relevant historical cost data is shown in the table that follows:
ACTUARIAL COST ESTIMATE – HAWAII SB 2054
OLIVER WYMAN
10
(1) Assumes a 5% annual trend estimate. (2) Benefits underlying cost data vary by state, data may reflect costs for benefits in excess of or less than those required
under SB 2054. States with one year of data: AZ,1 KY,2 LA,3 MA,4 and VA5 States with two years of data: FL,6 IL,7 KS,8 and NJ9 States with three years of data: MO,10 SC11 and TX12 Average (1 Yr) represents the Year 1 average of all states. Average (2 Yr) represents the average by year for all states with at least two years of data. Average (3 Yr) represents the average by year for all states with at least three years of data.
1 Arizona Department of Administration. 2 Kentucky Department of Employee Insurance. 3 Louisiana Department of State Civil Service. 4 Massachusetts Group Insurance Commission State Employee Health Plan. 5 Commonwealth of Virginia. State Corporation Commission Report. “The Financial Impact of Mandated Health Insurance Benefits and Providers Pursuant to Section 38.2-3419.1 of the Code of Virginia: 2012 Reporting Period to the Governor and the General Assembly of Virginia. 6 Florida Department of Management Services. 7 Illinois Department of Healthcare and Family Services. 8 Kansas State Employees Health Care Commission. Report on Insurance Coverage for Autism Spectrum Disorder Pilot. Required by 2010 Senate Substitute for House Bill No. 2160 and Kansas Department of Health and Environment. 9 New Jersey State Employee Health Plan. 10 State of Missouri, Department of Insurance, Financial Institutions &Professional Registration. Annual Report to the Missouri Legislature. “Insurance Coverage for Autism Treatment & Applied Behavior Analysis, Statistical Section, January 31, 2012.” “Insurance Coverage for Autism Treatment & Applied Behavior Analysis, Statistical Section, February 1, 2013.” 11 APS Healthcare Inc., TPA for the South Carolina Employee State Health Plan, memo on ASD Spectrum costs. 12 Employee Retirement System of Texas.

ACTUARIAL COST ESTIMATE – HAWAII SB 2054
OLIVER WYMAN
11
General Modeling Process The modeling process employed to develop our cost estimates was as follows:
1. A treated prevalence estimate for Hawaii was developed based on the Center for Disease Control and Prevention’s (CDC) Mortality and Morbidity Weekly Report (MMWR) on national autism prevalence dated March 30, 2012.
2. Prevalence rates by acuity of the disorder (i.e., Severe, Moderate, and Mild) were estimated separately based on a National Health Statistics Report dated March 20, 2013. The modeling considers the acuity of the disorder since the diagnosis patterns and service utilization could reasonably be expected to vary based on the severity of ASD. In addition, beginning in 2014, coding for ASD is moving from using diagnostic subtypes (largely ASD, PDD-NOS and Asperger’s Syndrome), to an ASD diagnosis with additional descriptors based on the degree to impairment relative to certain criteria based on a revision of the Diagnostic and Statistical Manual of Mental Disorders (DSM), to the now current DSM-V.
3. The percentage of diagnosed children who could be expected to have an ABA program was estimated for each age based on assumptions regarding the percentage of children that would start a program and typical program continuance.
4. A distribution of the number of annual hours for ABA by age was developed based on ABA provider input regarding optimal intensive programming, and an assumption that utilization review by insurers would impact utilization to some degree.
5. Based on the assumed treatment prevalence, likelihood of having an ABA program, assumed distribution of ABA program hours, and estimated ABA program cost per hour of therapy, ABA cost estimates by age were developed.
6. Non-ABA costs were estimated by analyzing actual ASD medical costs and estimating the increase in costs observed in states that passed autism insurance laws requiring benefits similar to SB 2054 benefits.
7. Based on Census demographic data and the cost estimates associated with SB 2054’s coverage of ASD services by age as outlined in 1-6 above, an annual cost per covered person was developed.
8. The cost of services was increased to reflect administrative and other insurer costs or profit charges.
9. The estimated size of the Hawaii covered group insurance market was developed based on Census, Medical Expenditure Panel Survey (MEPS) enrollment and premium information for Hawaii, and Kaiser Family Foundation coverage data. These assumptions are further explained and documented in Section 6.
10. The incremental costs of the ASD services per covered person and as a percentage of premiums were calculated based on the model cost estimates and market data under a range of assumptions to develop “Low,” “Middle,” and “High” cost scenario estimates.
ACTUARIAL COST ESTIMATE – HAWAII SB 2054
OLIVER WYMAN
12
6 Summary of Key Assumptions Key assumptions underlying the cost estimates for the proposed SB 2054 covered benefits are summarized in this section. In order to better illustrate the sensitivity of costs to various assumptions, we developed assumptions for “Low,” “Middle,” and “High” cost scenarios. Appendix 1 further illustrates these assumptions for the “Middle” scenario. Treated Prevalence and Age at Diagnosis The March 30, 2012 MMWR13 report included the following information related to the prevalence of ASD:
1. For 2008, the overall estimated prevalence of ASDs among the 14 ADDM sites was 11.3 per 1,000 (one in 88) children aged 8 years.
2. Among all children meeting the ASD surveillance case definition, approximately 79% had
a previously documented ASD classification. Based on our analysis of the CDC report, including the key items from the report noted above, a reasonable assumption for the treated prevalence of ASDs is 9.0 per 1,000 (11.3 per thousand multiplied by 79%) under the assumption that an indication of ASD in addition to documentation of an ASD would both be necessary to have claims reimbursed by an insurer. In developing our range of cost estimates we assumed treated prevalence would range from 7.2 per 1,000 (Low estimate) to 11.3 per 1,000 (High estimate).
Prevalence by acuity (Severe, Moderate, Mild) of ASD was estimated based on a March 20, 2013 NHCS Report.14 The acuity of ASD impacts the timing of a child’s diagnosis, and the likelihood of undertaking intensive ABA therapies.
13 Centers for Disease Control and Prevention. Morbidity and Mortality Weekly Report. March 30, 2012. Surveillance Summaries / Vol. 61 / No. 3. “Prevalence of Autism Spectrum Disorders — Autism and Developmental Disabilities Monitoring Network, 14 Sites, United States, 2008.” 14 National Health Statistics Reports. Number 65. March 20, 2013. “Changes in Prevalence of Parent-reported Autism Spectrum Disorder in School-aged U.S. Children: 2007 to 2011–2012.” Stephen J. Blumberg, Ph.D., Matthew D. Bramlett, Ph.D., National Center for Health Statistics; Michael D. Kogan, Ph.D., Maternal and Child Health Bureau; Laura A. Schieve, Ph.D., National Center on Birth Defects and Developmental Disabilities; Jessica R. Jones, M.P.H., and Michael C. Lu, M.D., M.P.H., Maternal and Child Health Bureau.
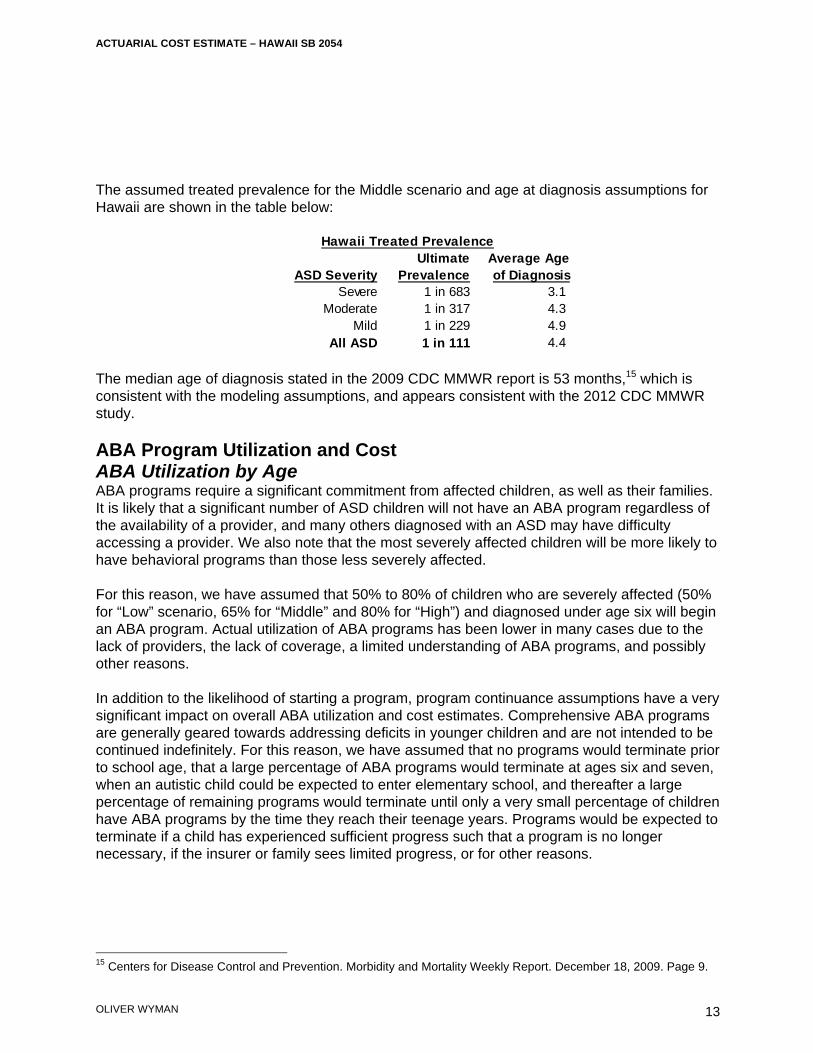
ACTUARIAL COST ESTIMATE – HAWAII SB 2054
OLIVER WYMAN
13
The assumed treated prevalence for the Middle scenario and age at diagnosis assumptions for Hawaii are shown in the table below:
The median age of diagnosis stated in the 2009 CDC MMWR report is 53 months,15 which is consistent with the modeling assumptions, and appears consistent with the 2012 CDC MMWR study. ABA Program Utilization and Cost ABA Utilization by Age ABA programs require a significant commitment from affected children, as well as their families. It is likely that a significant number of ASD children will not have an ABA program regardless of the availability of a provider, and many others diagnosed with an ASD may have difficulty accessing a provider. We also note that the most severely affected children will be more likely to have behavioral programs than those less severely affected. For this reason, we have assumed that 50% to 80% of children who are severely affected (50% for “Low” scenario, 65% for “Middle” and 80% for “High”) and diagnosed under age six will begin an ABA program. Actual utilization of ABA programs has been lower in many cases due to the lack of providers, the lack of coverage, a limited understanding of ABA programs, and possibly other reasons. In addition to the likelihood of starting a program, program continuance assumptions have a very significant impact on overall ABA utilization and cost estimates. Comprehensive ABA programs are generally geared towards addressing deficits in younger children and are not intended to be continued indefinitely. For this reason, we have assumed that no programs would terminate prior to school age, that a large percentage of ABA programs would terminate at ages six and seven, when an autistic child could be expected to enter elementary school, and thereafter a large percentage of remaining programs would terminate until only a very small percentage of children have ABA programs by the time they reach their teenage years. Programs would be expected to terminate if a child has experienced sufficient progress such that a program is no longer necessary, if the insurer or family sees limited progress, or for other reasons.
15 Centers for Disease Control and Prevention. Morbidity and Mortality Weekly Report. December 18, 2009. Page 9.
Ultimate Average AgeASD Severity Prevalence of Diagnosis
Severe 1 in 683 3.1 Moderate 1 in 317 4.3
Mild 1 in 229 4.9 All ASD 1 in 111 4.4
Hawaii Treated Prevalence
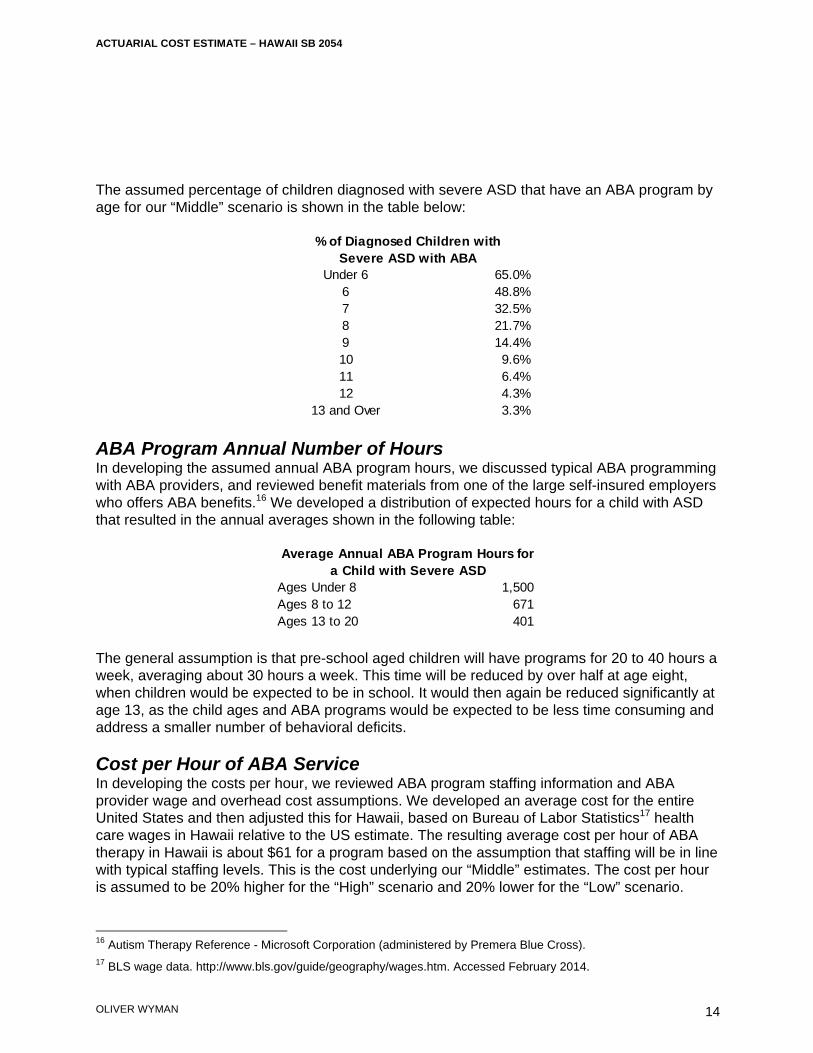
ACTUARIAL COST ESTIMATE – HAWAII SB 2054
OLIVER WYMAN
14
The assumed percentage of children diagnosed with severe ASD that have an ABA program by age for our “Middle” scenario is shown in the table below:
ABA Program Annual Number of Hours In developing the assumed annual ABA program hours, we discussed typical ABA programming with ABA providers, and reviewed benefit materials from one of the large self-insured employers who offers ABA benefits.16 We developed a distribution of expected hours for a child with ASD that resulted in the annual averages shown in the following table:
The general assumption is that pre-school aged children will have programs for 20 to 40 hours a week, averaging about 30 hours a week. This time will be reduced by over half at age eight, when children would be expected to be in school. It would then again be reduced significantly at age 13, as the child ages and ABA programs would be expected to be less time consuming and address a smaller number of behavioral deficits. Cost per Hour of ABA Service In developing the costs per hour, we reviewed ABA program staffing information and ABA provider wage and overhead cost assumptions. We developed an average cost for the entire United States and then adjusted this for Hawaii, based on Bureau of Labor Statistics17 health care wages in Hawaii relative to the US estimate. The resulting average cost per hour of ABA therapy in Hawaii is about $61 for a program based on the assumption that staffing will be in line with typical staffing levels. This is the cost underlying our “Middle” estimates. The cost per hour is assumed to be 20% higher for the “High” scenario and 20% lower for the “Low” scenario.
16 Autism Therapy Reference - Microsoft Corporation (administered by Premera Blue Cross). 17 BLS wage data. http://www.bls.gov/guide/geography/wages.htm. Accessed February 2014.
Under 6 65.0%6 48.8%7 32.5%8 21.7%9 14.4%10 9.6%11 6.4%12 4.3%
13 and Over 3.3%
% of Diagnosed Children with Severe ASD with ABA
Ages Under 8 1,500 Ages 8 to 12 671 Ages 13 to 20 401
Average Annual ABA Program Hours for a Child with Severe ASD
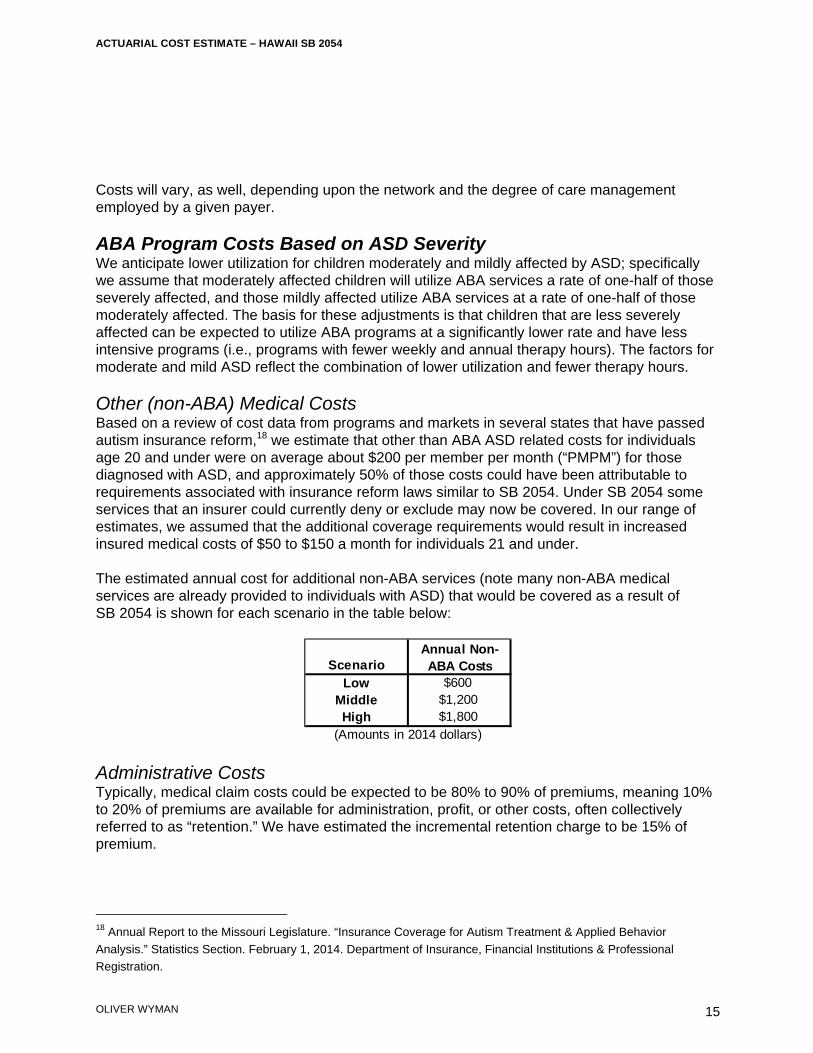
ACTUARIAL COST ESTIMATE – HAWAII SB 2054
OLIVER WYMAN
15
Costs will vary, as well, depending upon the network and the degree of care management employed by a given payer. ABA Program Costs Based on ASD Severity We anticipate lower utilization for children moderately and mildly affected by ASD; specifically we assume that moderately affected children will utilize ABA services a rate of one-half of those severely affected, and those mildly affected utilize ABA services at a rate of one-half of those moderately affected. The basis for these adjustments is that children that are less severely affected can be expected to utilize ABA programs at a significantly lower rate and have less intensive programs (i.e., programs with fewer weekly and annual therapy hours). The factors for moderate and mild ASD reflect the combination of lower utilization and fewer therapy hours. Other (non-ABA) Medical Costs Based on a review of cost data from programs and markets in several states that have passed autism insurance reform,18 we estimate that other than ABA ASD related costs for individuals age 20 and under were on average about $200 per member per month (“PMPM”) for those diagnosed with ASD, and approximately 50% of those costs could have been attributable to requirements associated with insurance reform laws similar to SB 2054. Under SB 2054 some services that an insurer could currently deny or exclude may now be covered. In our range of estimates, we assumed that the additional coverage requirements would result in increased insured medical costs of $50 to $150 a month for individuals 21 and under. The estimated annual cost for additional non-ABA services (note many non-ABA medical services are already provided to individuals with ASD) that would be covered as a result of SB 2054 is shown for each scenario in the table below:
Administrative Costs Typically, medical claim costs could be expected to be 80% to 90% of premiums, meaning 10% to 20% of premiums are available for administration, profit, or other costs, often collectively referred to as “retention.” We have estimated the incremental retention charge to be 15% of premium.
18 Annual Report to the Missouri Legislature. “Insurance Coverage for Autism Treatment & Applied Behavior Analysis.” Statistics Section. February 1, 2014. Department of Insurance, Financial Institutions & Professional Registration.
ScenarioLow $600
Middle $1,200High $1,800
(Amounts in 2014 dollars)
Annual Non-ABA Costs
ACTUARIAL COST ESTIMATE – HAWAII SB 2054
OLIVER WYMAN
16
Hawaii Market Data The MEPS survey provides average premiums, enrollees, offer rates, take-up rates, and self-insured percentages by employer size for healthcare coverage sponsored by privately insured employers. From this data we can estimate the size of the privately insured group market. State-specific premium data for Hawaii was available for 201219, so we trended this data based on average recent employer premium increases provided in the Kaiser Family Foundation HRET20 survey to estimate the 2014 average annual premium per member necessary to compute the cost of SB 2054 benefits as a percentage of annual premiums. As part of our development of premiums and membership estimates, we completed reasonableness tests by reviewing Hawaii insurer regulatory filings to ensure that the premium estimates were not unreasonable.
19 MEPS state survey data. http://www.meps.ahrq.gov/mepsweb/data_stats/state_tables.jsp?regionid=-1&year=2012. Accessed February 2014. 20 Kaiser Family Foundation and Health Research Educational Trust. Employer Health Benefits. 2013 Annual Survey.
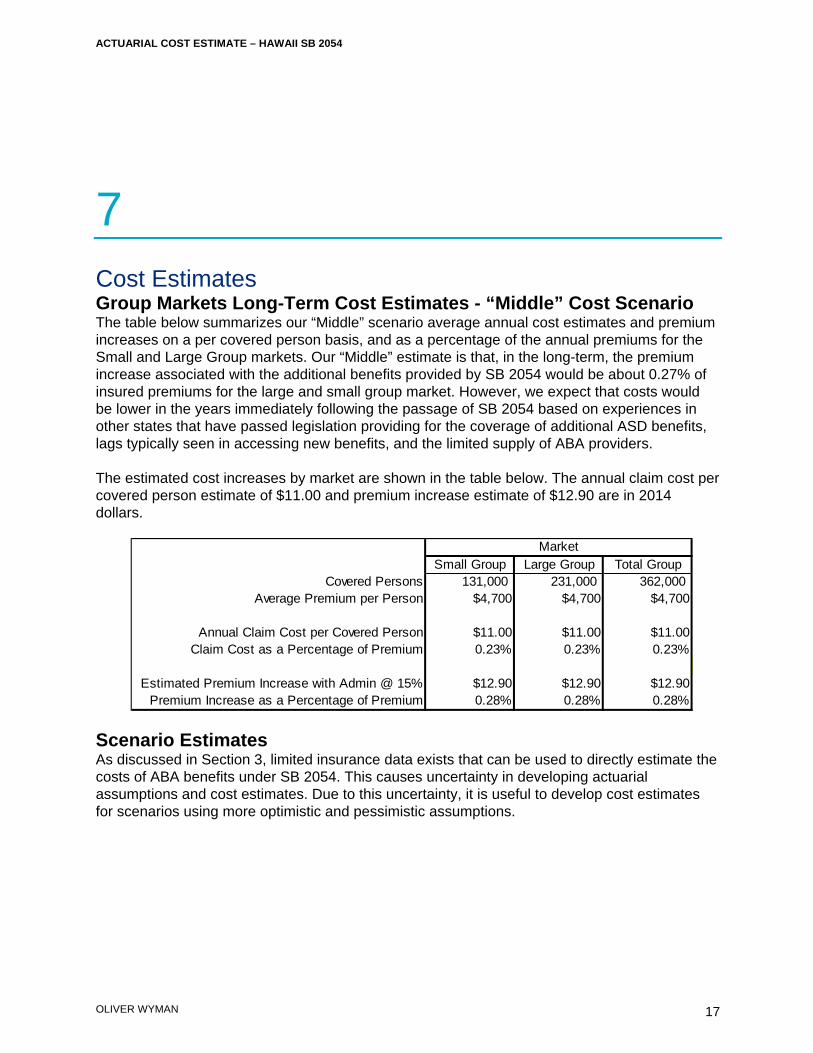
ACTUARIAL COST ESTIMATE – HAWAII SB 2054
OLIVER WYMAN
17
7 Cost Estimates Group Markets Long-Term Cost Estimates - “Middle” Cost Scenario The table below summarizes our “Middle” scenario average annual cost estimates and premium increases on a per covered person basis, and as a percentage of the annual premiums for the Small and Large Group markets. Our “Middle” estimate is that, in the long-term, the premium increase associated with the additional benefits provided by SB 2054 would be about 0.27% of insured premiums for the large and small group market. However, we expect that costs would be lower in the years immediately following the passage of SB 2054 based on experiences in other states that have passed legislation providing for the coverage of additional ASD benefits, lags typically seen in accessing new benefits, and the limited supply of ABA providers. The estimated cost increases by market are shown in the table below. The annual claim cost per covered person estimate of $11.00 and premium increase estimate of $12.90 are in 2014 dollars.
Scenario Estimates As discussed in Section 3, limited insurance data exists that can be used to directly estimate the costs of ABA benefits under SB 2054. This causes uncertainty in developing actuarial assumptions and cost estimates. Due to this uncertainty, it is useful to develop cost estimates for scenarios using more optimistic and pessimistic assumptions.
Small Group Large Group Total GroupCovered Persons 131,000 231,000 362,000
Average Premium per Person $4,700 $4,700 $4,700
Annual Claim Cost per Covered Person $11.00 $11.00 $11.00Claim Cost as a Percentage of Premium 0.23% 0.23% 0.23%
Estimated Premium Increase with Admin @ 15% $12.90 $12.90 $12.90Premium Increase as a Percentage of Premium 0.28% 0.28% 0.28%
Market
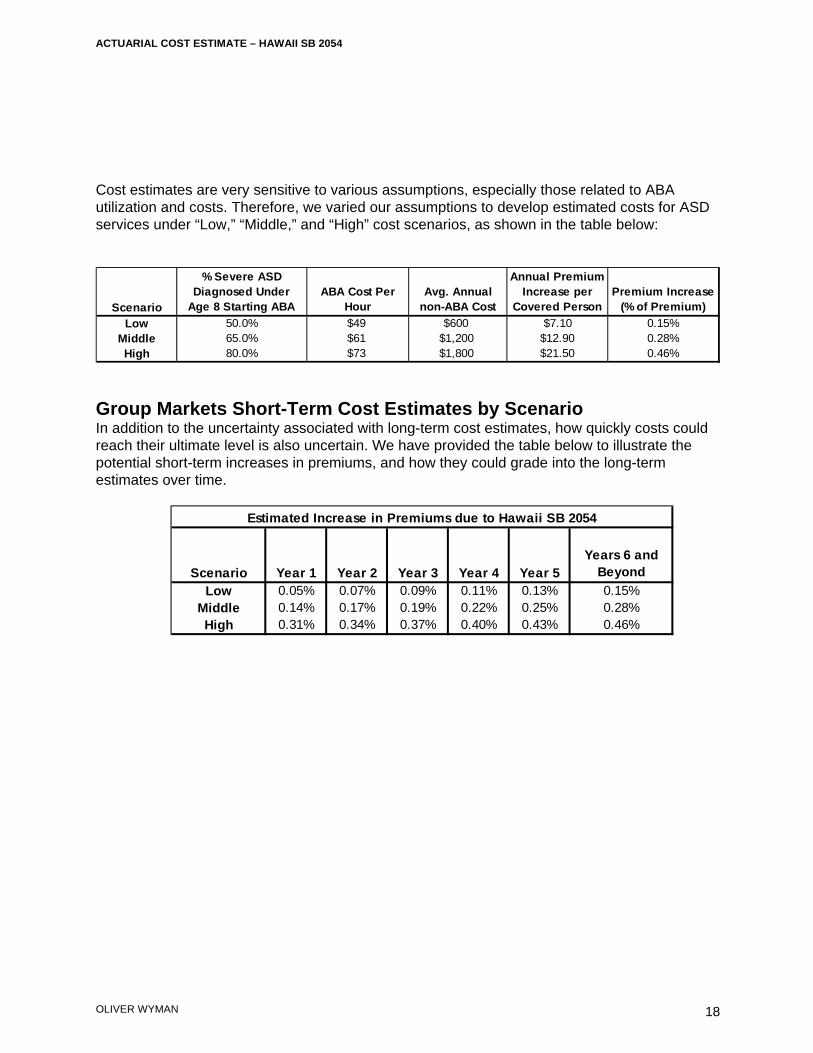
ACTUARIAL COST ESTIMATE – HAWAII SB 2054
OLIVER WYMAN
18
Cost estimates are very sensitive to various assumptions, especially those related to ABA utilization and costs. Therefore, we varied our assumptions to develop estimated costs for ASD services under “Low,” “Middle,” and “High” cost scenarios, as shown in the table below:
Group Markets Short-Term Cost Estimates by Scenario In addition to the uncertainty associated with long-term cost estimates, how quickly costs could reach their ultimate level is also uncertain. We have provided the table below to illustrate the potential short-term increases in premiums, and how they could grade into the long-term estimates over time.
Scenario
% Severe ASD Diagnosed Under
Age 8 Starting ABAABA Cost Per
HourAvg. Annual
non-ABA Cost
Annual Premium Increase per
Covered PersonPremium Increase
(% of Premium)
Low 50.0% $49 $600 $7.10 0.15%Middle 65.0% $61 $1,200 $12.90 0.28%High 80.0% $73 $1,800 $21.50 0.46%
Scenario Year 1 Year 2 Year 3 Year 4 Year 5Years 6 and
Beyond
Low 0.05% 0.07% 0.09% 0.11% 0.13% 0.15%Middle 0.14% 0.17% 0.19% 0.22% 0.25% 0.28%High 0.31% 0.34% 0.37% 0.40% 0.43% 0.46%
Estimated Increase in Premiums due to Hawaii SB 2054
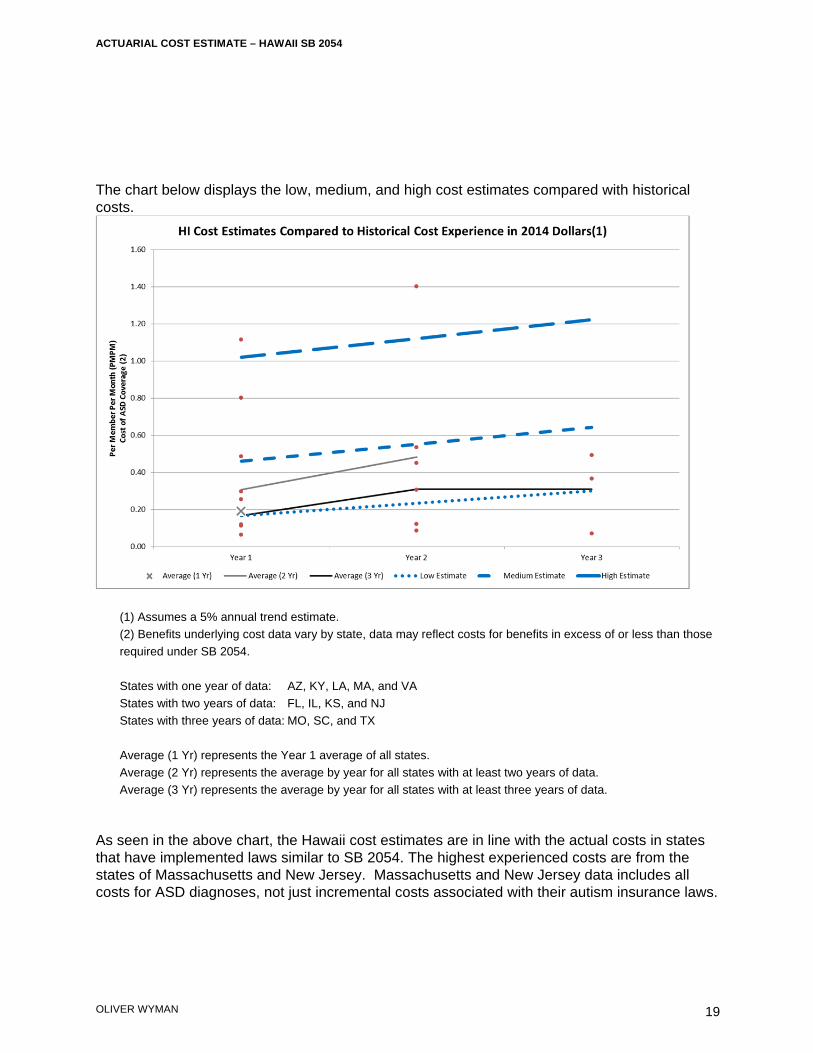
ACTUARIAL COST ESTIMATE – HAWAII SB 2054
OLIVER WYMAN
19
The chart below displays the low, medium, and high cost estimates compared with historical costs.
(1) Assumes a 5% annual trend estimate. (2) Benefits underlying cost data vary by state, data may reflect costs for benefits in excess of or less than those required under SB 2054. States with one year of data: AZ, KY, LA, MA, and VA States with two years of data: FL, IL, KS, and NJ States with three years of data: MO, SC, and TX Average (1 Yr) represents the Year 1 average of all states. Average (2 Yr) represents the average by year for all states with at least two years of data. Average (3 Yr) represents the average by year for all states with at least three years of data.
As seen in the above chart, the Hawaii cost estimates are in line with the actual costs in states that have implemented laws similar to SB 2054. The highest experienced costs are from the states of Massachusetts and New Jersey. Massachusetts and New Jersey data includes all costs for ASD diagnoses, not just incremental costs associated with their autism insurance laws.
ACTUARIAL COST ESTIMATE – HAWAII SB 2054
OLIVER WYMAN
20
Individual Market and State Plan Cost Estimates Currently, average premiums for policies inforce in the Hawaii individual market are lower than those in the group markets. This is likely due to a combination of the impact of underwriting better risks and less rich benefits. Due to the elimination of health status as a rating factor, and benefit requirements under the Affordable Care Act, premiums and claims costs for the individual market may become similar to those in the group market. Some also predict that the individual markets will become unsustainable due to anti-selection by poorer risks, and a lack of younger entrants to subsidize older participants. The individual market will be dynamic over the next several years. While the expectation is that it will be comprised of less healthy risks than those currently insured, which could include autistic children whose costs would increase due to SB 2054, it will also include many older individuals where autism coverage under SB 2054 would have little or no impact upon their costs. Due to the many changes that will occur, it is difficult to determine the overall individual market impact of SB 2054. For now, a reasonable assumption is that SB 2054 would have a similar impact on the individual market premiums as it is expected to have on the group markets.
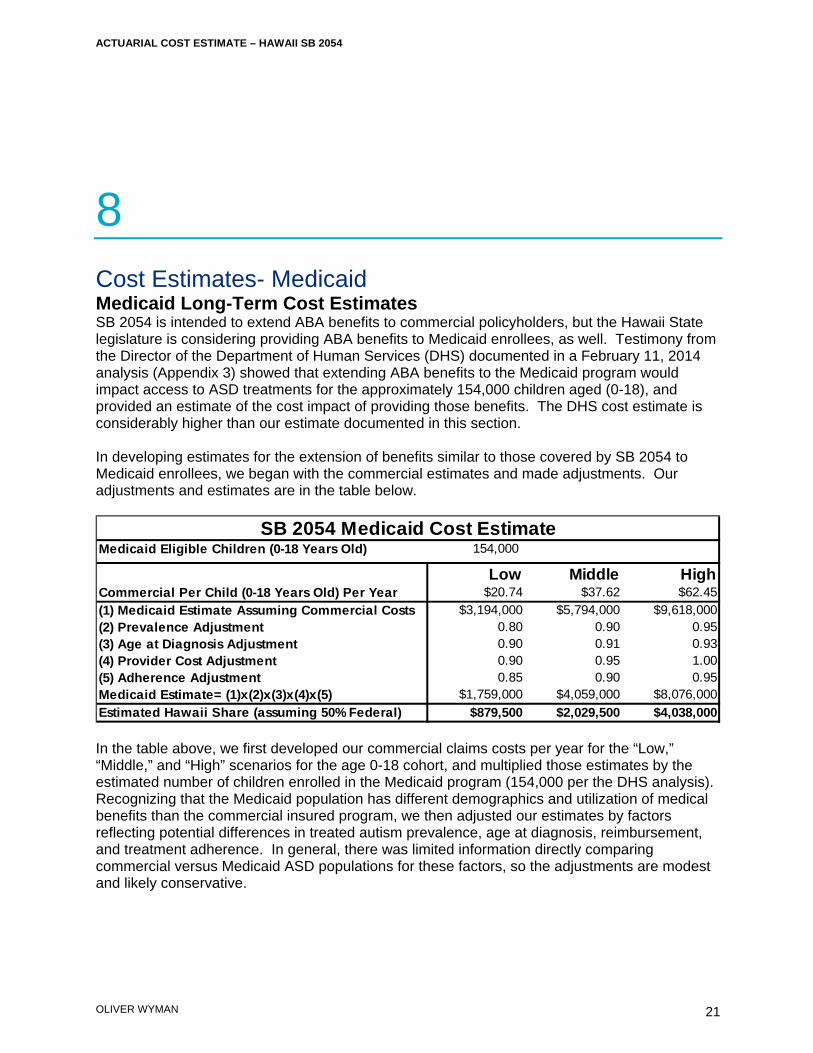
ACTUARIAL COST ESTIMATE – HAWAII SB 2054
OLIVER WYMAN
21
8 Cost Estimates- Medicaid Medicaid Long-Term Cost Estimates SB 2054 is intended to extend ABA benefits to commercial policyholders, but the Hawaii State legislature is considering providing ABA benefits to Medicaid enrollees, as well. Testimony from the Director of the Department of Human Services (DHS) documented in a February 11, 2014 analysis (Appendix 3) showed that extending ABA benefits to the Medicaid program would impact access to ASD treatments for the approximately 154,000 children aged (0-18), and provided an estimate of the cost impact of providing those benefits. The DHS cost estimate is considerably higher than our estimate documented in this section. In developing estimates for the extension of benefits similar to those covered by SB 2054 to Medicaid enrollees, we began with the commercial estimates and made adjustments. Our adjustments and estimates are in the table below.
In the table above, we first developed our commercial claims costs per year for the “Low,” “Middle,” and “High” scenarios for the age 0-18 cohort, and multiplied those estimates by the estimated number of children enrolled in the Medicaid program (154,000 per the DHS analysis). Recognizing that the Medicaid population has different demographics and utilization of medical benefits than the commercial insured program, we then adjusted our estimates by factors reflecting potential differences in treated autism prevalence, age at diagnosis, reimbursement, and treatment adherence. In general, there was limited information directly comparing commercial versus Medicaid ASD populations for these factors, so the adjustments are modest and likely conservative.
Medicaid Eligible Children (0-18 Years Old) 154,000
Low Middle HighCommercial Per Child (0-18 Years Old) Per Year $20.74 $37.62 $62.45(1) Medicaid Estimate Assuming Commercial Costs $3,194,000 $5,794,000 $9,618,000(2) Prevalence Adjustment 0.80 0.90 0.95(3) Age at Diagnosis Adjustment 0.90 0.91 0.93(4) Provider Cost Adjustment 0.90 0.95 1.00(5) Adherence Adjustment 0.85 0.90 0.95Medicaid Estimate= (1)x(2)x(3)x(4)x(5) $1,759,000 $4,059,000 $8,076,000Estimated Hawaii Share (assuming 50% Federal) $879,500 $2,029,500 $4,038,000
SB 2054 Medicaid Cost Estimate
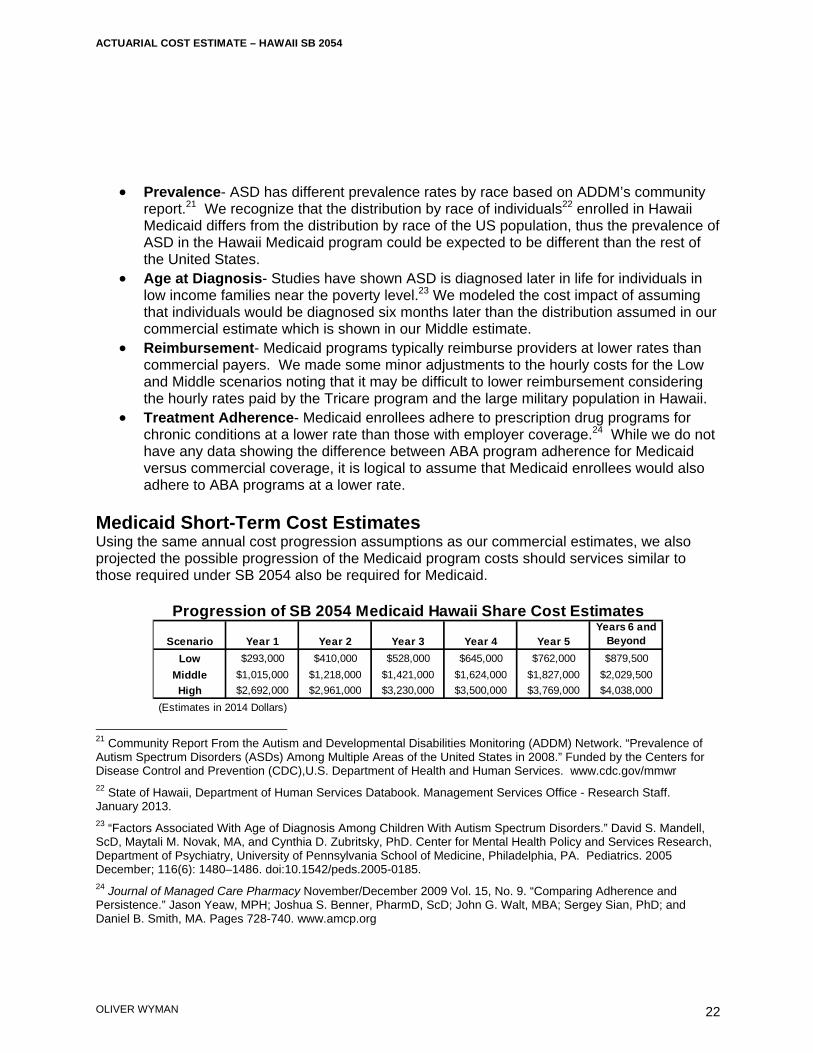
ACTUARIAL COST ESTIMATE – HAWAII SB 2054
OLIVER WYMAN
22
Prevalence- ASD has different prevalence rates by race based on ADDM’s community report.21 We recognize that the distribution by race of individuals22 enrolled in Hawaii Medicaid differs from the distribution by race of the US population, thus the prevalence of ASD in the Hawaii Medicaid program could be expected to be different than the rest of the United States.
Age at Diagnosis- Studies have shown ASD is diagnosed later in life for individuals in low income families near the poverty level.23 We modeled the cost impact of assuming that individuals would be diagnosed six months later than the distribution assumed in our commercial estimate which is shown in our Middle estimate.
Reimbursement- Medicaid programs typically reimburse providers at lower rates than commercial payers. We made some minor adjustments to the hourly costs for the Low and Middle scenarios noting that it may be difficult to lower reimbursement considering the hourly rates paid by the Tricare program and the large military population in Hawaii.
Treatment Adherence- Medicaid enrollees adhere to prescription drug programs for chronic conditions at a lower rate than those with employer coverage.24 While we do not have any data showing the difference between ABA program adherence for Medicaid versus commercial coverage, it is logical to assume that Medicaid enrollees would also adhere to ABA programs at a lower rate.
Medicaid Short-Term Cost Estimates Using the same annual cost progression assumptions as our commercial estimates, we also projected the possible progression of the Medicaid program costs should services similar to those required under SB 2054 also be required for Medicaid.
21 Community Report From the Autism and Developmental Disabilities Monitoring (ADDM) Network. “Prevalence of Autism Spectrum Disorders (ASDs) Among Multiple Areas of the United States in 2008.” Funded by the Centers for Disease Control and Prevention (CDC),U.S. Department of Health and Human Services. www.cdc.gov/mmwr 22 State of Hawaii, Department of Human Services Databook. Management Services Office - Research Staff. January 2013. 23 “Factors Associated With Age of Diagnosis Among Children With Autism Spectrum Disorders.” David S. Mandell, ScD, Maytali M. Novak, MA, and Cynthia D. Zubritsky, PhD. Center for Mental Health Policy and Services Research, Department of Psychiatry, University of Pennsylvania School of Medicine, Philadelphia, PA. Pediatrics. 2005 December; 116(6): 1480–1486. doi:10.1542/peds.2005-0185. 24 Journal of Managed Care Pharmacy November/December 2009 Vol. 15, No. 9. “Comparing Adherence and Persistence.” Jason Yeaw, MPH; Joshua S. Benner, PharmD, ScD; John G. Walt, MBA; Sergey Sian, PhD; and Daniel B. Smith, MA. Pages 728-740. www.amcp.org
Scenario Year 1 Year 2 Year 3 Year 4 Year 5Years 6 and
Beyond
Low $293,000 $410,000 $528,000 $645,000 $762,000 $879,500Middle $1,015,000 $1,218,000 $1,421,000 $1,624,000 $1,827,000 $2,029,500High $2,692,000 $2,961,000 $3,230,000 $3,500,000 $3,769,000 $4,038,000
(Estimates in 2014 Dollars)
Progression of SB 2054 Medicaid Hawaii Share Cost Estimates
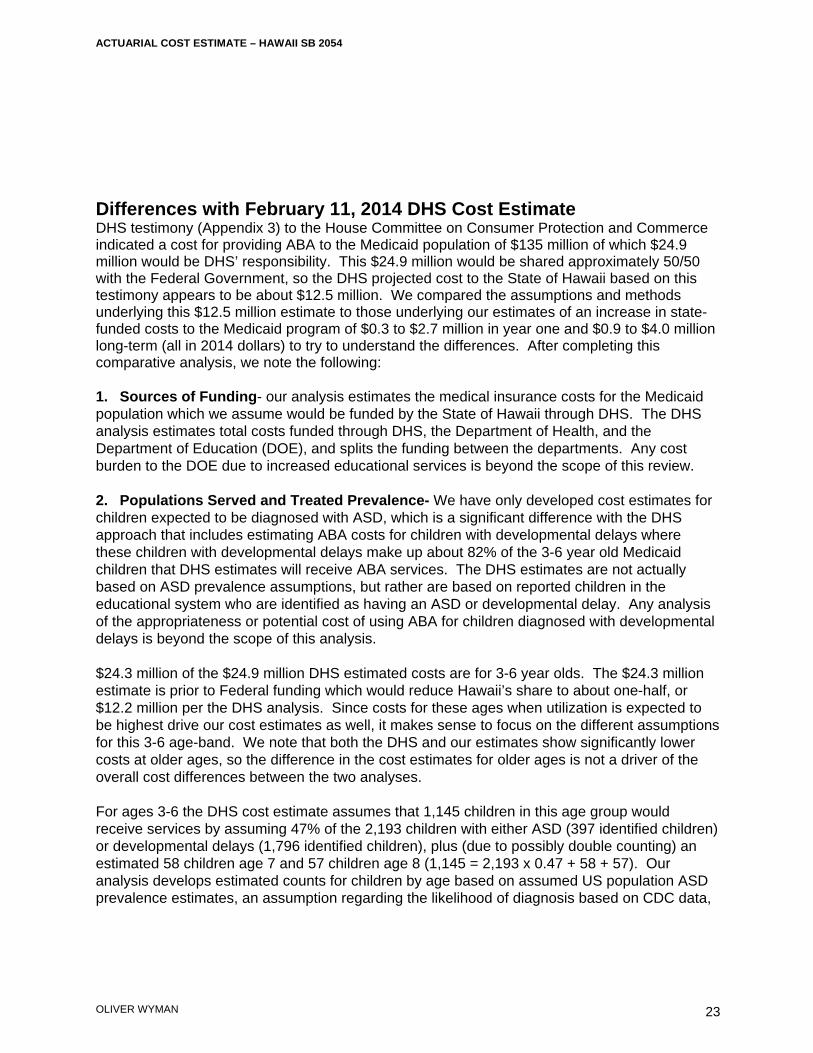
ACTUARIAL COST ESTIMATE – HAWAII SB 2054
OLIVER WYMAN
23
Differences with February 11, 2014 DHS Cost Estimate DHS testimony (Appendix 3) to the House Committee on Consumer Protection and Commerce indicated a cost for providing ABA to the Medicaid population of $135 million of which $24.9 million would be DHS’ responsibility. This $24.9 million would be shared approximately 50/50 with the Federal Government, so the DHS projected cost to the State of Hawaii based on this testimony appears to be about $12.5 million. We compared the assumptions and methods underlying this $12.5 million estimate to those underlying our estimates of an increase in state-funded costs to the Medicaid program of $0.3 to $2.7 million in year one and $0.9 to $4.0 million long-term (all in 2014 dollars) to try to understand the differences. After completing this comparative analysis, we note the following: 1. Sources of Funding- our analysis estimates the medical insurance costs for the Medicaid population which we assume would be funded by the State of Hawaii through DHS. The DHS analysis estimates total costs funded through DHS, the Department of Health, and the Department of Education (DOE), and splits the funding between the departments. Any cost burden to the DOE due to increased educational services is beyond the scope of this review. 2. Populations Served and Treated Prevalence- We have only developed cost estimates for children expected to be diagnosed with ASD, which is a significant difference with the DHS approach that includes estimating ABA costs for children with developmental delays where these children with developmental delays make up about 82% of the 3-6 year old Medicaid children that DHS estimates will receive ABA services. The DHS estimates are not actually based on ASD prevalence assumptions, but rather are based on reported children in the educational system who are identified as having an ASD or developmental delay. Any analysis of the appropriateness or potential cost of using ABA for children diagnosed with developmental delays is beyond the scope of this analysis. $24.3 million of the $24.9 million DHS estimated costs are for 3-6 year olds. The $24.3 million estimate is prior to Federal funding which would reduce Hawaii’s share to about one-half, or $12.2 million per the DHS analysis. Since costs for these ages when utilization is expected to be highest drive our cost estimates as well, it makes sense to focus on the different assumptions for this 3-6 age-band. We note that both the DHS and our estimates show significantly lower costs at older ages, so the difference in the cost estimates for older ages is not a driver of the overall cost differences between the two analyses.
For ages 3-6 the DHS cost estimate assumes that 1,145 children in this age group would receive services by assuming 47% of the 2,193 children with either ASD (397 identified children) or developmental delays (1,796 identified children), plus (due to possibly double counting) an estimated 58 children age 7 and 57 children age 8 (1,145 = 2,193 x 0.47 + 58 + 57). Our analysis develops estimated counts for children by age based on assumed US population ASD prevalence estimates, an assumption regarding the likelihood of diagnosis based on CDC data,
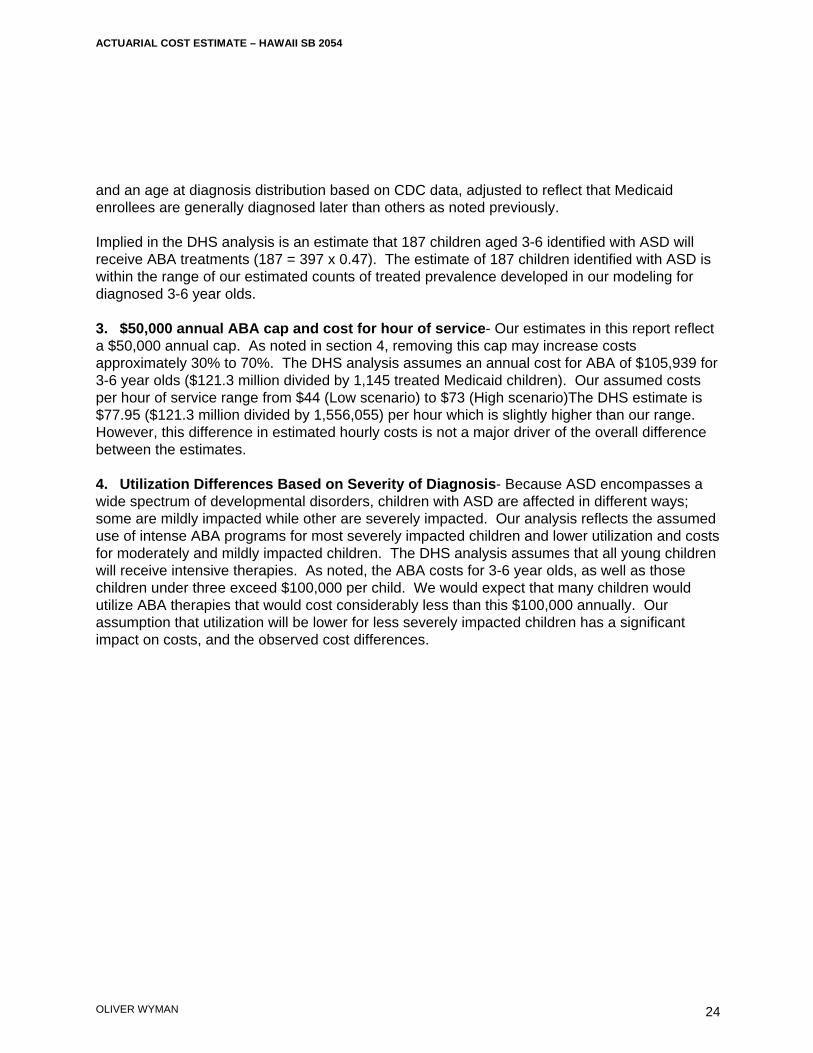
ACTUARIAL COST ESTIMATE – HAWAII SB 2054
OLIVER WYMAN
24
and an age at diagnosis distribution based on CDC data, adjusted to reflect that Medicaid enrollees are generally diagnosed later than others as noted previously. Implied in the DHS analysis is an estimate that 187 children aged 3-6 identified with ASD will receive ABA treatments (187 = 397 x 0.47). The estimate of 187 children identified with ASD is within the range of our estimated counts of treated prevalence developed in our modeling for diagnosed 3-6 year olds. 3. $50,000 annual ABA cap and cost for hour of service- Our estimates in this report reflect a $50,000 annual cap. As noted in section 4, removing this cap may increase costs approximately 30% to 70%. The DHS analysis assumes an annual cost for ABA of $105,939 for 3-6 year olds ($121.3 million divided by 1,145 treated Medicaid children). Our assumed costs per hour of service range from $44 (Low scenario) to $73 (High scenario)The DHS estimate is $77.95 ($121.3 million divided by 1,556,055) per hour which is slightly higher than our range. However, this difference in estimated hourly costs is not a major driver of the overall difference between the estimates. 4. Utilization Differences Based on Severity of Diagnosis- Because ASD encompasses a wide spectrum of developmental disorders, children with ASD are affected in different ways; some are mildly impacted while other are severely impacted. Our analysis reflects the assumed use of intense ABA programs for most severely impacted children and lower utilization and costs for moderately and mildly impacted children. The DHS analysis assumes that all young children will receive intensive therapies. As noted, the ABA costs for 3-6 year olds, as well as those children under three exceed $100,000 per child. We would expect that many children would utilize ABA therapies that would cost considerably less than this $100,000 annually. Our assumption that utilization will be lower for less severely impacted children has a significant impact on costs, and the observed cost differences.
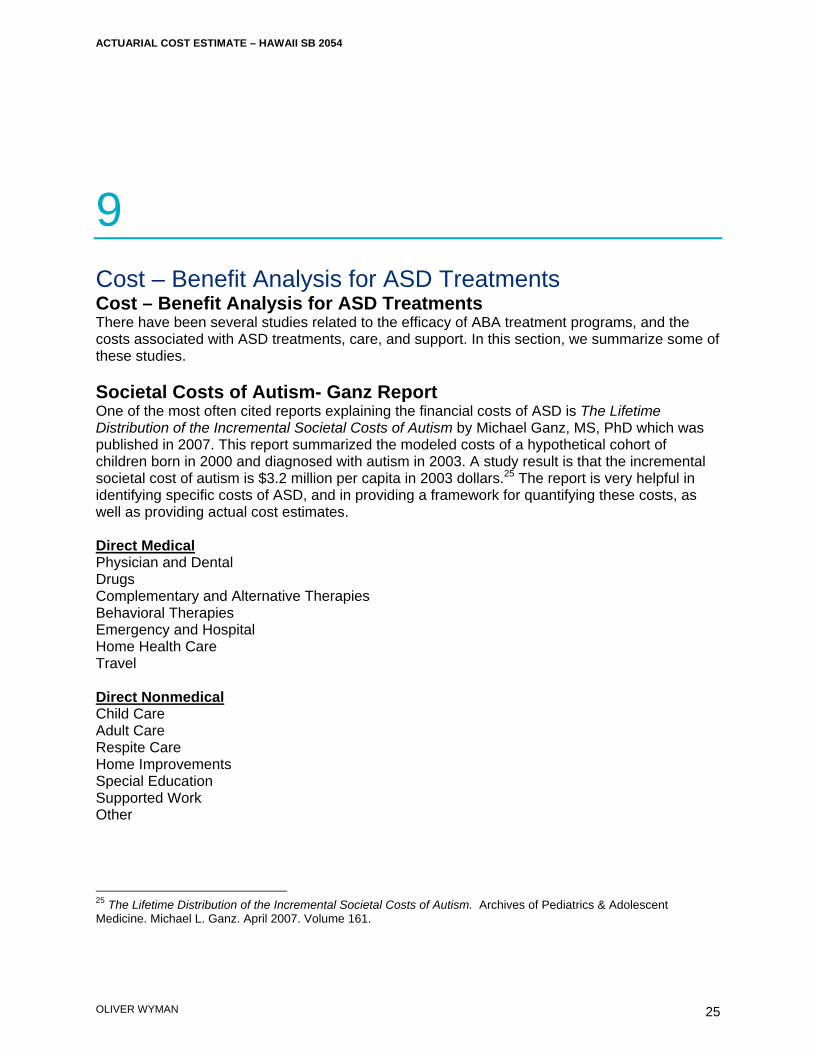
ACTUARIAL COST ESTIMATE – HAWAII SB 2054
OLIVER WYMAN
25
9 Cost – Benefit Analysis for ASD Treatments Cost – Benefit Analysis for ASD Treatments There have been several studies related to the efficacy of ABA treatment programs, and the costs associated with ASD treatments, care, and support. In this section, we summarize some of these studies. Societal Costs of Autism- Ganz Report One of the most often cited reports explaining the financial costs of ASD is The Lifetime Distribution of the Incremental Societal Costs of Autism by Michael Ganz, MS, PhD which was published in 2007. This report summarized the modeled costs of a hypothetical cohort of children born in 2000 and diagnosed with autism in 2003. A study result is that the incremental societal cost of autism is $3.2 million per capita in 2003 dollars.25 The report is very helpful in identifying specific costs of ASD, and in providing a framework for quantifying these costs, as well as providing actual cost estimates. Direct Medical Physician and Dental Drugs Complementary and Alternative Therapies Behavioral Therapies Emergency and Hospital Home Health Care Travel Direct Nonmedical Child Care Adult Care Respite Care Home Improvements Special Education Supported Work Other
25 The Lifetime Distribution of the Incremental Societal Costs of Autism. Archives of Pediatrics & Adolescent Medicine. Michael L. Ganz. April 2007. Volume 161.
ACTUARIAL COST ESTIMATE – HAWAII SB 2054
OLIVER WYMAN
26
Indirect Own Indirect- lost productivity and lower wages Not Own Indirect - lost productivity and lower wages of others (typically family) Cost Savings to State and Local Governments The Ganz study is probably the most comprehensive in terms of assessing the breadth of the financial costs associated with caring for individuals with ASD. Several other studies have attempted more limited quantifications of costs and savings to governments associated with providing early intensive behavioral interventions (EIBI) or ABA programs for young children. In summary, the studies quantify the costs of EIBI, assume success rates associated with EIBI based on efficacy studies, and then assume cost savings to educational and other government financed programs, like Medicaid, associated with these treatments. Virginia’s independent Joint Legislative Audit and Review Commission (JLARC) issued a report in August 2009: Report of the Joint Legislative Audit and Review Commission To the Governor and The General Assembly of Virginia - Assessment of Services For Virginians With Autism Spectrum Disorders. As part of this report, JLARC reviewed several studies related to the efficacy of EIBI, and potential cost savings to State and Local governments associated with effective EIBI treatments. The JLARC report outlines their assessment of the cost savings associated with EIBI as follows26: “A study published in a national journal found that Pennsylvania could save an average of $187,000 to $203,000 on each child who received three years of EIBI relative to one who received special education services until age 22. The Pennsylvania study also suggested that cost savings would likely continue to accrue after children exit the school system. The study found that the state could save from $656,000 to $1.1 million per child if expenditures up to age 55 are included. Another study published in a national journal found that Texas could save an average of $208,500 in education costs for each student who received three years of EIBI relative to a student who received 18 years of special education from ages four to 22. Applied to the estimated 10,000 children with ASDs in Texas, it was estimated that the state could save almost $2.1 billion by implementing intensive treatment programs.
By applying the methodology used in the Pennsylvania and Texas studies to Virginia-related data, JLARC staff estimate that the Commonwealth could save approximately $137,400 in special education costs per student with an ASD if EIBI was consistently provided. In fact, the analysis indicates that Virginia could realize savings as long as at least 42 percent of students with ASDs who received EIBI make moderate improvements (require less intensive services and fewer supports), which is a substantially more conservative outcome than the outcomes reported in the research literature.”
26 Report of the Joint Legislative Audit and Review Commission To the Governor and The General Assembly of Virginia - Assessment of Services For Virginians With Autism Spectrum Disorders. Page 15. http://jlarc.virginia.gov/reports/Rpt388.pdf. Accessed December 2009.
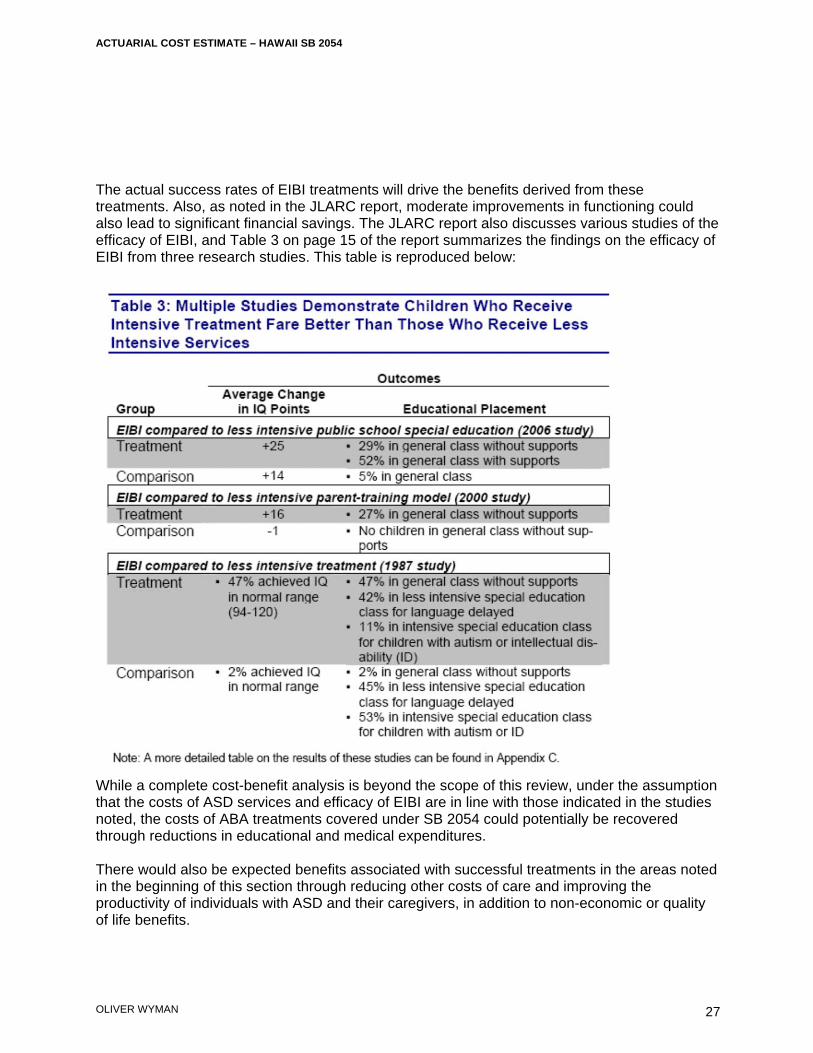
ACTUARIAL COST ESTIMATE – HAWAII SB 2054
OLIVER WYMAN
27
The actual success rates of EIBI treatments will drive the benefits derived from these treatments. Also, as noted in the JLARC report, moderate improvements in functioning could also lead to significant financial savings. The JLARC report also discusses various studies of the efficacy of EIBI, and Table 3 on page 15 of the report summarizes the findings on the efficacy of EIBI from three research studies. This table is reproduced below:
While a complete cost-benefit analysis is beyond the scope of this review, under the assumption that the costs of ASD services and efficacy of EIBI are in line with those indicated in the studies noted, the costs of ABA treatments covered under SB 2054 could potentially be recovered through reductions in educational and medical expenditures. There would also be expected benefits associated with successful treatments in the areas noted in the beginning of this section through reducing other costs of care and improving the productivity of individuals with ASD and their caregivers, in addition to non-economic or quality of life benefits.
ACTUARIAL COST ESTIMATE – HAWAII SB 2054
OLIVER WYMAN
28
Appendix 1 Cost Assumptions – Illustrative Exhibits

State Hawaii Key Assumptions:
Mandate Market Ultimate Average Age Under 6 65.0%Individual No ASD Severity Prevalence of Diagnosis 6 48.8%Small Group Yes Severe 1 in 683 3.1 7 32.5%Large Group Yes Moderate 1 in 317 4.3 8 21.7%Self-Insured (ERISA) No Mild 1 in 229 4.9 9 14.4%
10 9.6%All ASD 1 in 111 4.4 11 6.4%
12 4.3%13 and Over 3.3%
State and Local Govt No
Age Limits for Autism BenefitsMinimum None 0Maximum 20 20
Ultimate Average AgeAdditional Annual Medical Costs for Non ABA Services ASD Severity Prevalence of Diagnosis
Under 21 1,200$ per person diagnosed w/ ASD Severe 1 in 683 3.1 Moderate 1 in 317 4.3 Ages Under 8 1,500
Mild 1 in 229 4.9 Ages 8 to 12 671 Annual Limits by Covered Service All ASD 1 in 111 4.4 Ages 13 to 20 401
Hours Limit Max Hours Dollar Limit Max $sABA No - Yes $50,000 Cost per ABA Hour: $61.06
Average hourly provider cost of ABA Program: $61
Coverage Estimates Costs Excluding Administrative Expense Premium Increase including Admin @ 15%
Market
Number ofPersons Covered
Premium(Per Person)
TotalPremium Costs
Costs (% of
Premium)
Cost(Per Covered
Person)Incremental
PremiumPremium Increase
%Annual Increase per
Covered Person
Small Group 1 131,000 $4,700 $615,700,000 $1,441,000 0.23% $11.00 $1,695,000 0.28% $12.90Large Group 1 231,000 $4,700 $1,085,700,000 $2,541,000 0.23% $11.00 $2,989,000 0.28% $12.90
Total 1 362,000 $4,700 $1,701,400,000 $3,982,000 0.23% $11.00 $4,685,000 0.28% $12.90
Average Annual ABA Program Hours for a Child with Severe ASD
EXHIBIT I - SUMMARY OF SB 2054 "MIDDLE" SCENARIO ASSUMPTIONS AND COSTS
United States Treated Prevalence
Hawaii Treated Prevalence
% of Diagnosed Children with Severe ASD with ABA
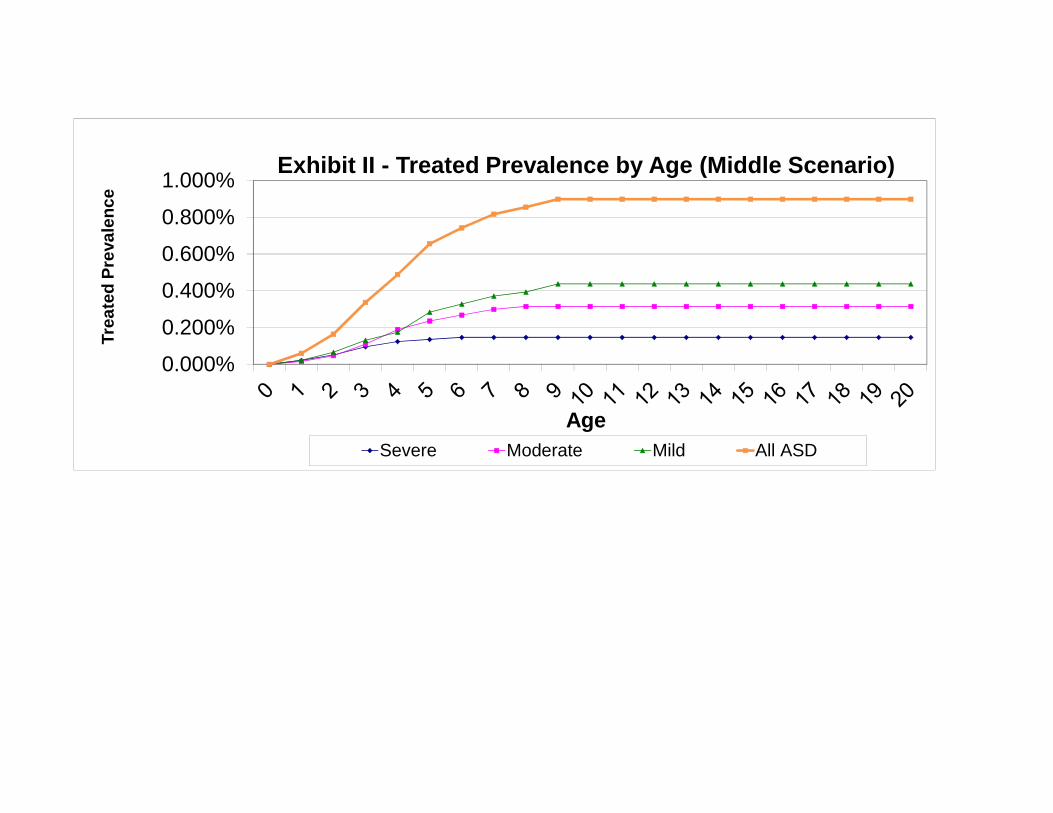
0.000%
0.200%
0.400%
0.600%
0.800%
1.000%
Tre
ate
d P
reva
len
ce
Age
Exhibit II - Treated Prevalence by Age (Middle Scenario)
Severe Moderate Mild All ASD
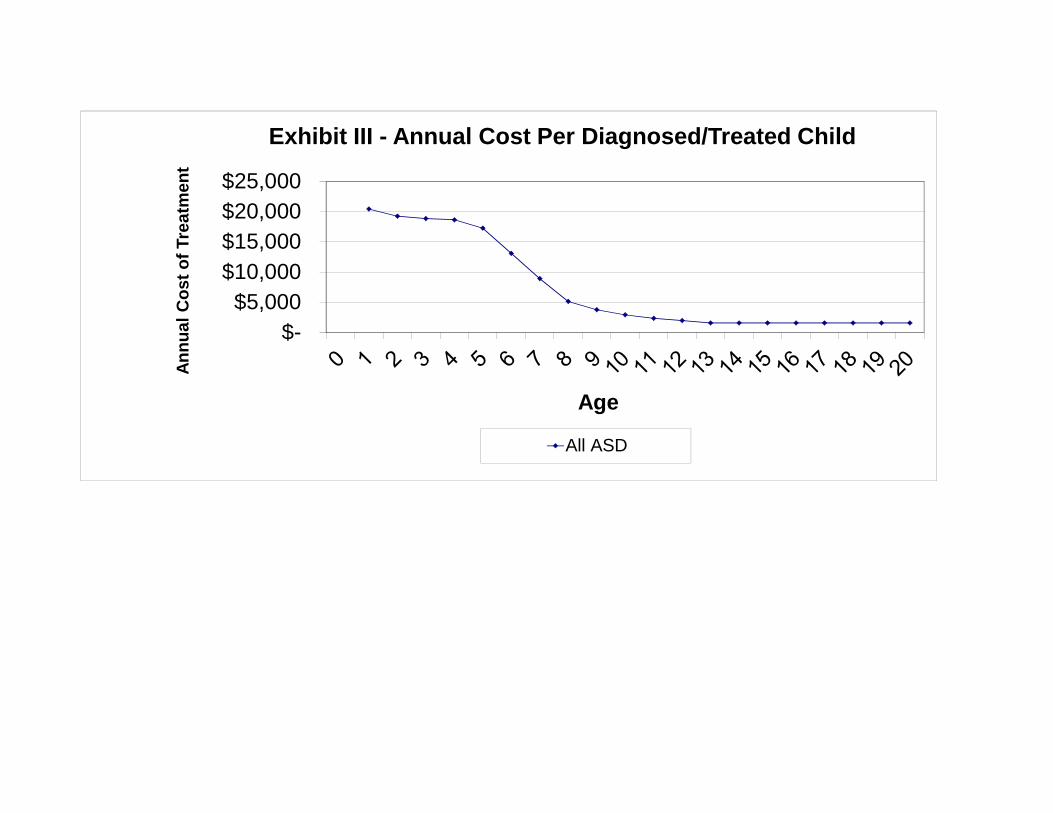
$- $5,000
$10,000 $15,000 $20,000 $25,000
An
nu
al
Co
st
of
Tre
atm
ent
Age
Exhibit III - Annual Cost Per Diagnosed/Treated Child
All ASD
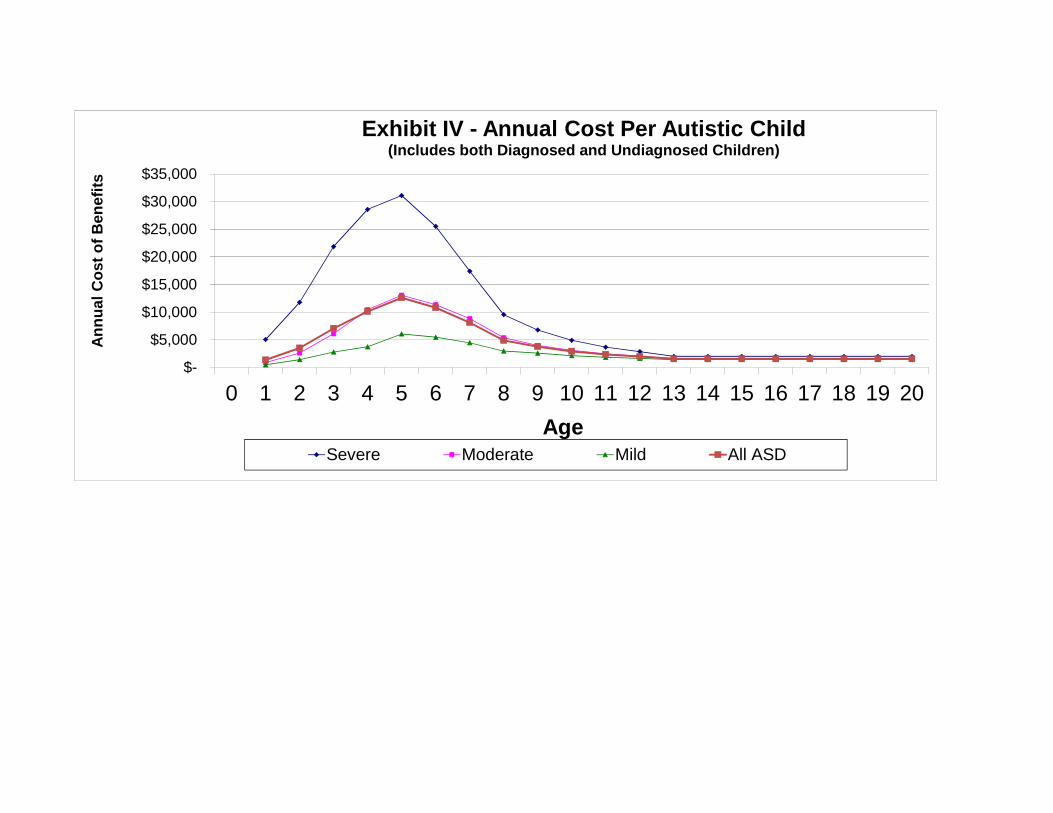
$-
$5,000
$10,000
$15,000
$20,000
$25,000
$30,000
$35,000
0 1 2 3 4 5 6 7 8 9 10 11 12 13 14 15 16 17 18 19 20
An
nu
al C
ost
of
Ben
efit
s
Age
Exhibit IV - Annual Cost Per Autistic Child (Includes both Diagnosed and Undiagnosed Children)
Severe Moderate Mild All ASD
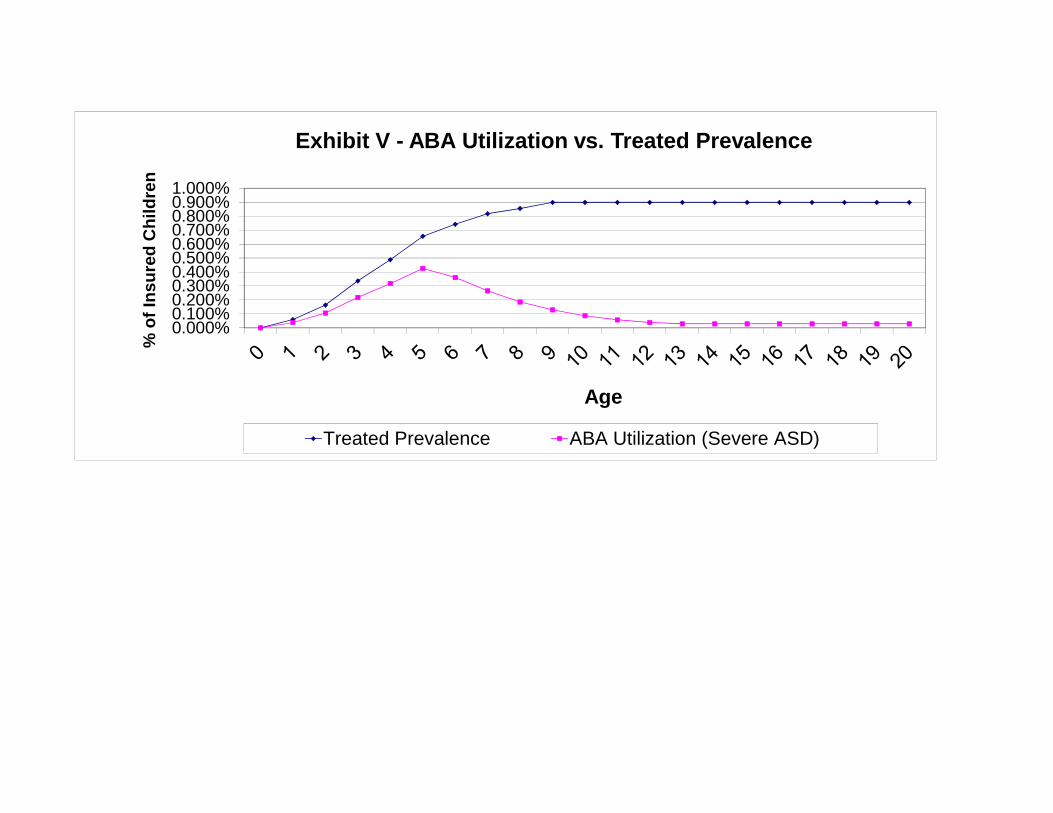
0.000%0.100%0.200%0.300%0.400%0.500%0.600%0.700%0.800%0.900%1.000%
% o
f In
su
red
Ch
ild
ren
Age
Exhibit V - ABA Utilization vs. Treated Prevalence
Treated Prevalence ABA Utilization (Severe ASD)
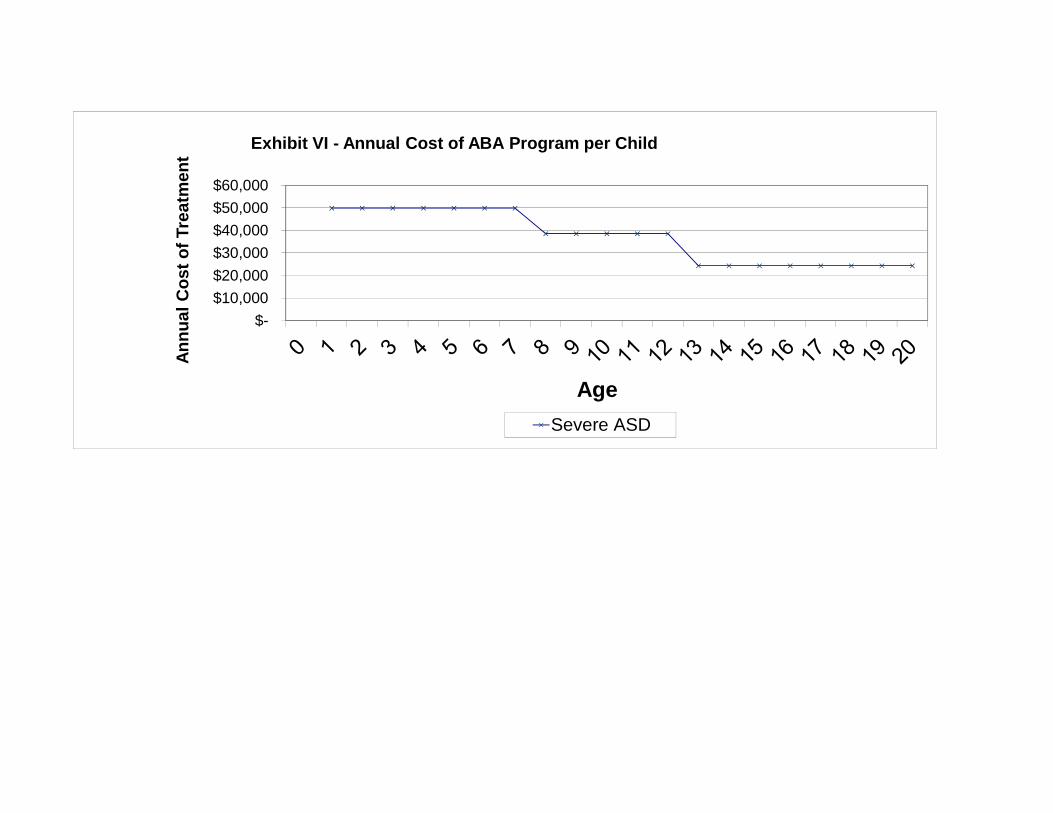
$- $10,000 $20,000 $30,000 $40,000 $50,000 $60,000
An
nu
al
Co
st
of
Tre
atm
ent
Age
Exhibit VI - Annual Cost of ABA Program per Child
Severe ASD
ACTUARIAL COST ESTIMATE – HAWAII SB 2054
OLIVER WYMAN
29
Appendix 2 Senate Bill 2054 SD1 Text
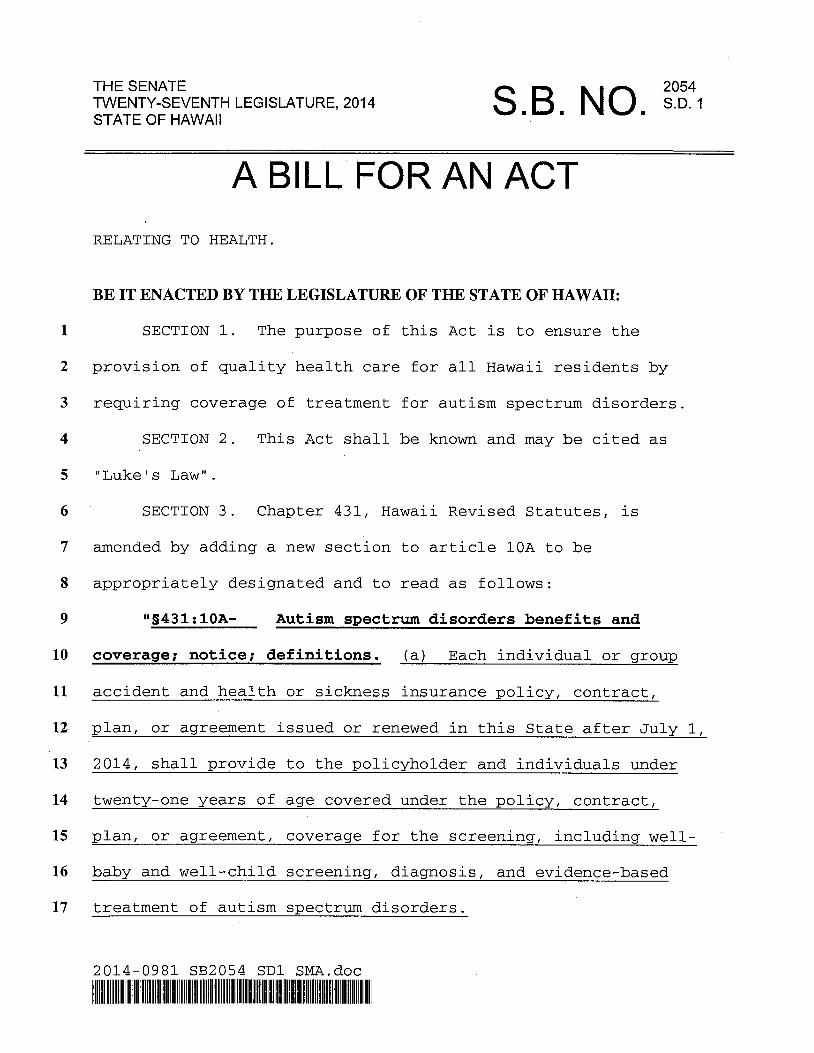
1
2
3
4
5
6
7
8
9
10
11
12
13
14
15
16
17
THE SENATE
STATE OF HAWAII TWENTY-SEVENTH LEGISLATURE, 201 4
2054 S.B. NO. s.D.~
A BILL FOR AN ACT RELATING TO HEALTH.
BE IT ENACTED BY THE LEGISLATURE OF THE STATE OF HAWAII:
SECTION 1. The purpose of this Act is to ensure the
provision of quality health care for all Hawaii residents by
requiring coverage of treatment for autism spectrum disorders.
SECTION 2. This Act shall be known and may be cited as
"Luke s Law" . SECTION 3. Chapter 431, Hawaii Revised Statutes, is
amended by adding a new section to article 1OA to be
appropriately designated and to read as follows:
"L431:lOA- Autism spectrum disorders benefits and
coverage; notice; definitions. (a) Each individual or group
accident and health or sickness insurance policy, contract,
plan, or agreement issued or renewed in this State after July 1,
2014, shall provide to the policyholder and individuals under
twenty-one years of age covered under the policy, contract,
plan, or agreement, coverage for the screening, including well-
baby and well-child screening, diagnosis, and evidence-based
treatment of autism spectrum disorders.
2014-0981 SB2054 SD1 SMA.doc
I111111 lllll11111 lllll Ill1 0111 lllll lllll lllll Ill1 llllllll Ill1 Ill Ill1 llill111111111 llllllll Ill Ill1 UII 11111111 1111 Oil Ill lllllll Illill Ill1 Ill 1111
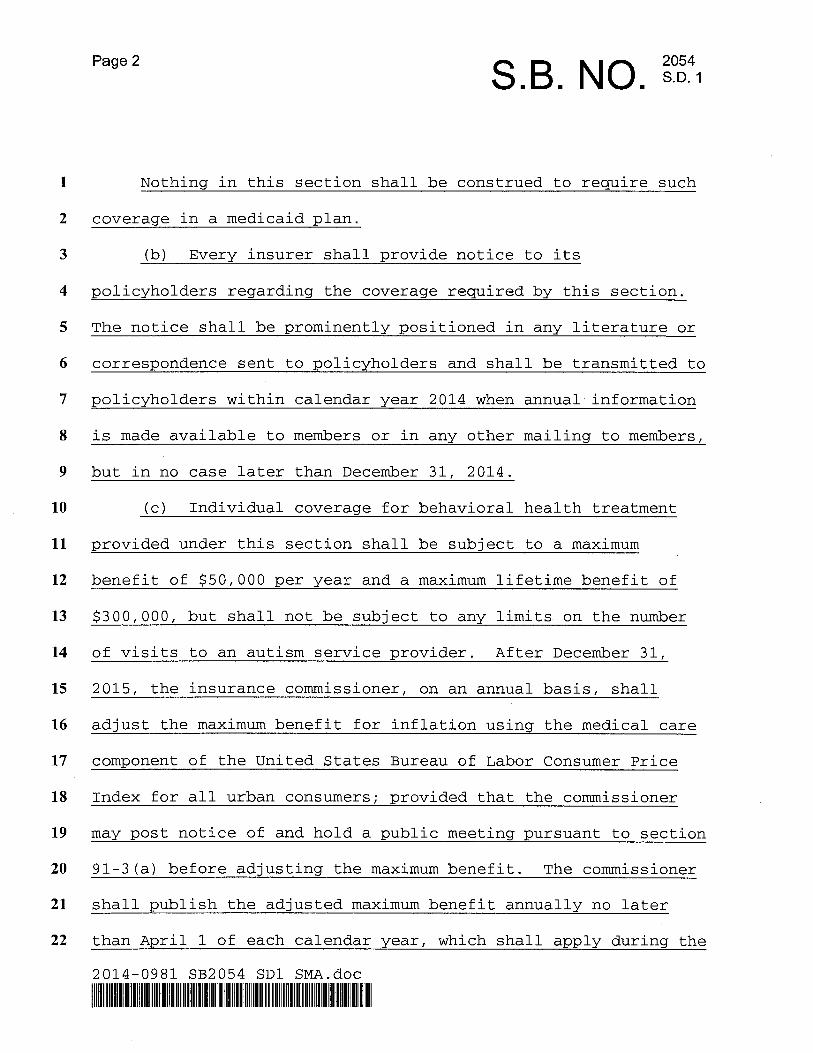
Page 2 2054 S.B. NO. S-D-I
1
2
3
4
5
6
7
8
9
Nothing in this section shall be construed to require such
coverage in a medicaid plan.
(b) Every insurer shall Drovi.de notice to its
policyholders regarding the coverage required by this section.
The notice shall be prominently positioned in any literature or
correspondence sent to policyholders and shall be transmitted to
policyholders within calendar year 2014 when annual information
is made available to members or in any other mailing to members,
but in no case later than December 31, 2014.
10 (c) Individual coveraae for behavioral health treatment
11
12
13
14
15
16
17
18
19
20
22
provided under this section shall be subject to a maximum
benefit of $50,000 per year and a maximum lifetime benefit of
$300,000, but shall not be subject to any limits on the number
of visits to an autism service provider. After December 31,
2015, the insurance commissioner, on an annual basis, shall
adjust the maximum benefit for inflation using the medical care
component of the United States Bureau of Labor Consumer Price
Index for all urban consumers; provided that the commissioner
may post notice of and hold a public meeting pursuant to section
91-3(a) before adjusting the maximum benefit. The commissioner
shall publish the adjusted maximum benefit annually no later
than April 1 of each calendar year, which shall apply during the
2014-0981 SB2054 SD1 SMA.doc
lllllllllllllllllllllllllllllllll llllll,llll~llllllllllllllllllllllllllllllllllllllll1111111111111 IIllllllllllll~~IIIlllllllllllll
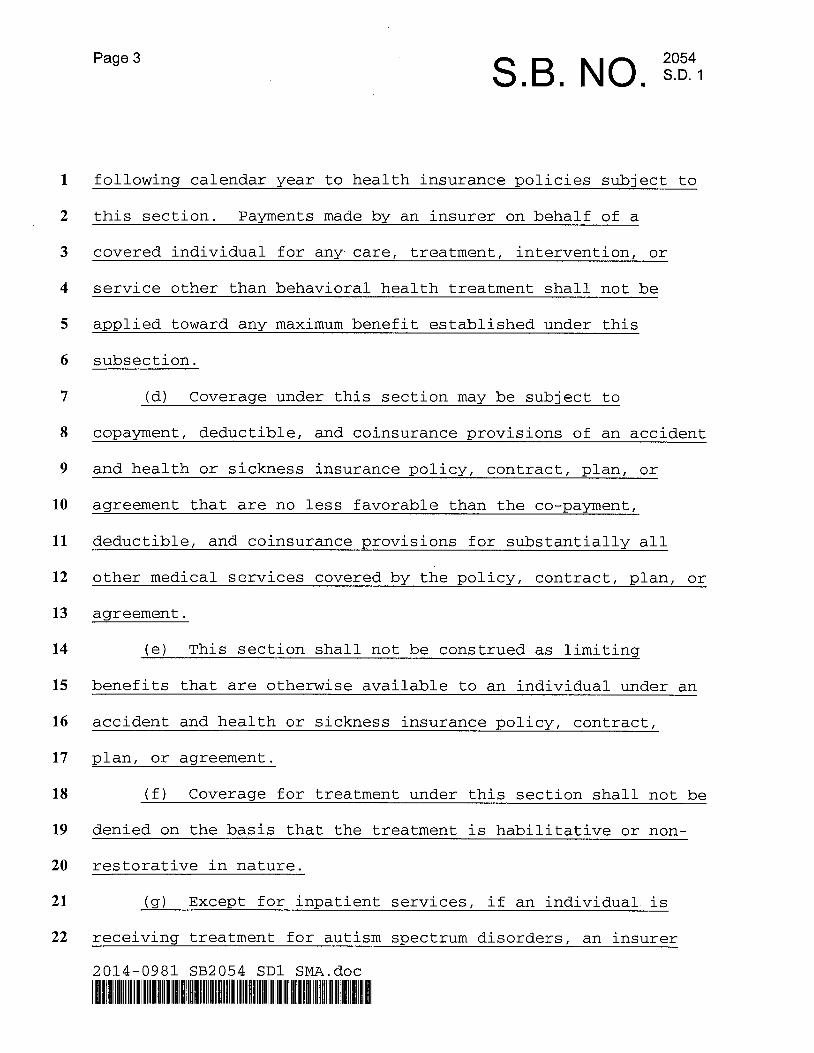
Page 3 2054 S.B. NO. s . D . ~
4
5
6
7
8
9
10
11
12
13
14
15
16
17
18
19
20
22
following calendar year to health insurance policies subject to
this section. Pavments made bv an insurer on behalf of a
covered individual for any. care, treatment, intervention, or
service other than behavioral health treatment shall not be
applied toward any maximum benefit established under this
subsection.
(d) Coverage under this section may be subject to
copayment, deductible, and coinsurance provisions of an accident
and health or sickness insurance policy, contract, plan, or
agreement that are no less favorable than the co-payment,
deductible, and coinsurance provisions for substantially all
other medical services covered by the policy, contract, plan, or
agreement . (e) This section shall not be construed as limiting
benefits that are otherwise available to an individual under an
accident and health or sickness insurance policy, contract,
.alan, or acrreement.
(f) Coverage for treatment under this section shall not be
denied on the basis that the treatment is habilitative or non-
restorative in nature.
(9) Except for inpatient services, if an individual is
receiving treatment for autism spectrum disorders, an insurer
2014-0981 SB2054 SD1 SMA.doc
llllllllllllllll I llrlllllllllllllllllllllllllllllllllllllllllllllllll I 11111111111111 lllll Alrllllllllllllllllllll lllllllllllllillll
Page 4 2054 S.B. NO. s . D . ~
1
2
3
4
5
6
7
8
9
10
11
12
13
14
15
16
17
18
19
20
21
22
may request a review of that treatment. The cost of obtaining
anv review shall be borne bv the insurer.
(h) This section shall not be construed as reducing any
obligation to provide services to an individual under an
individualized family service plan, an individualized education
program, or an individualized service plan.
(i) Nothing in this section shall apply to accident-only,
specified disease, hospital indemnity, qualified health plans as
defined in Section 1301 of the Patient Protection and Affordable
Care Act, medicare supplement, disability income, long-term
care, or other limited benefit hospital insurance policies.
( j ) Insurers shall include in their network of approved
autism service providers only those providers who have cleared
criminal background checks as determined by the insurer.
(k) Insurers shall include at least as many board-
certified behavior analysts in their provider network as there
are qualified licensed psychologists in their network of
approved providers of applied behavior analysis.
(1) If an individual has been diagnosed as having an
autism spectrum disorder, then that individual shall not be
required to undergo repeat evaluation upon publication of a
subsequent edition of the Diagnostic and Statistical Manual of
2014-0981 SB2054 SD1 SMA.doc
lllllll lllIlll1111111111111111 lllll lllllllllllllllllllllllllllllllllllllllll lllllllllIl1l1 I lllllllllllll1111111l1111 I llllllHlllllllllllllI
Page 5 2054 S.B. NO.
1
2
3
4
5
6
7
8
9
10
11
12
13
14
15
16
17
18
19
20
21
Mental Disorders to remain eligible for coverage under this
section.
(m) Coverage for applied behavior analysis shall include
the services of the personnel who work under the supervision of
the board certified behavior analyst or the licensed
psychologist overseeing the program.
(n) As used in this section, unless the context clearly
reauires otherwise:
"Applied behavior analysis" means the design,
implementation, and evaluation of environmental modifications,
using behavioral stimuli and consequences, to produce socially
significant improvement in human behavior, including the use of
direct observation, measurement, and functional analysis of the
relationship between environment and behavior. The practice of
applied behavior analysis expressly excludes psychological
testing, diagnosis of a mental or physical disorder,
neuropsychology, psychotherapy, cognitive therapy, sex therapy,
psychoanalysis, hypnotherapy, and long-term counseling as
treatment modalities.
"Autism service provider" means any person, entity, or
group that provides treatment for autism spectrum disorders.
2014-0981 SB2054 SDI SMA.doc
Page 6 2054 S.B. NO. s . D . ~
1
2
3
4
5
6
7
8
9
10
11
12
13
14
15
16
17
18
19
20
21
"Autism spectrum disorders" means any of the pervasive
develoDmenta1 disorders or autism sDectrum disorders as defined
by the most recent edition of the Diagnostic and Statistical
Manual of Mental Disorders.
"Behavioral health treatment" means evidence based
counseling and treatment programs, including applied behavior
analysis, that are:
(1)
(2)
Necessarv to develox>, maintain, or restore, to the
maximum extent practicable, the functioning of an
individual; and
Provided or supervised by a board-certified behavior
analyst or by a licensed psychologist so long as the
services performed are commensurate with the
psychologist's formal university training and
supervised experience.
"Board certified behavioral analvst" means a behavior
analyst credentialed by the Behavior Analyst Certification Board
as a board certified analyst.
"Diagnosis of autism spectrum disorders" means medically
necessary assessments, evaluations, or tests conducted to
diagnose whether an individual has an autism spectrum disorder.
2014-0981 SB2054 SDI SMA.doc
llllllll llllllllllllllllllllllllll1111 I 1l1l11111111ll11111111l11111111111lllllllllllllllllllllllllllllllllllllillllllllllllllll
Page 7 2054 S.B. NO. s . D . ~
1
2
3
4
5
6
7
8
9
10
11
12
13
14
15
16
17
18
19
20
21
22
"Pharmacy care" means medications prescribed by a licensed
physician or nurse practitioner and any health-related services
that are deemed medically necessary to determine the need or
effectiveness of the medications.
"Psychiatric care" means direct or consultative services
provided by a licensed psychiatrist.
"Psychological care" means direct or consultative services
Drovided bv a licensed mvcholoaist.
"Therapeutic care" means services provided by licensed
speech pathologists, registered occupational therapists,
licensed social workers, licensed clinical social workers, or
licensed physical therapists.
"Treatment for autism spectrum disorders" includes the
followina care Drescribed or ordered for an individual with an
autism spectrum disorder by a licensed physician, psychiatrist,
psychologist, licensed clinical social worker, or nurse
practitioner if the care is determined to be medically
necessary:
- (1) Behavioral health treatment;
- (2) Pharmacy care;
- (3 ) Psychiatric care;
- (4) Psychological care; and
2014-0981 SB2054 SD1 SMA.doc
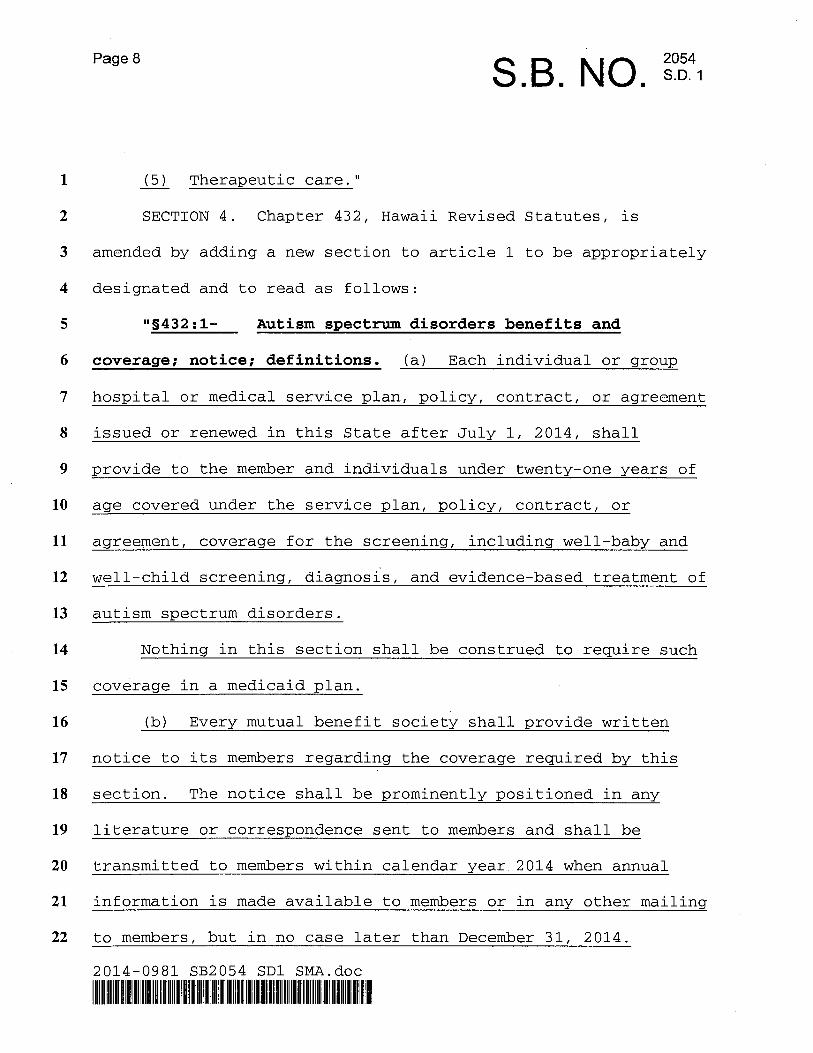
Page 8 2054 S.B. NO. s . D . ~
1
2
3
4
5
6
7
8
9
10
11
12
13
14
15
16
17
18
19
20
21
22
- (5) Therapeutic care. 'I
SECTION 4. Chapter 432, Hawaii Revised Statutes, is
amended by adding a new section to article 1 to be appropriately
designated and to read as follows:
"L432 : 1- Autism snectrum disorders benefits and
coverage; notice; definitions. (a) Each individual or group
hospital or medical service plan, policy, contract, or agreement
issued or renewed in this State after July 1, 2014, shall
provide to the member and individuals under twenty-one years of
age covered under the service plan, policy, contract, or
agreement, coverage for the screening, including well-baby and
well-child screening, diagnosis, and evidence-based treatment of
autism spectrum disorders.
Nothing in this section shall be construed to require such
coverage in a medicaid plan.
(b) Every mutual benefit society shall provide written
notice to its members regarding the coverage required by this
section. The notice shall be prominently positioned in any
literature or correspondence sent to members and shall be
transmitted to members within calendar year 2014 when annual
information is made available to members or in any other mailing
to members, but in no case later than December 31, 2014.
2014-0981 SB2054 SD1 SMA.doc
I Ill I lllllllllllllll I I Illllllllllllllll lllllllll lllllllllllllllll II lllllll1111111111011111111 lllllllllllll lllllllllllll lllllllllllll
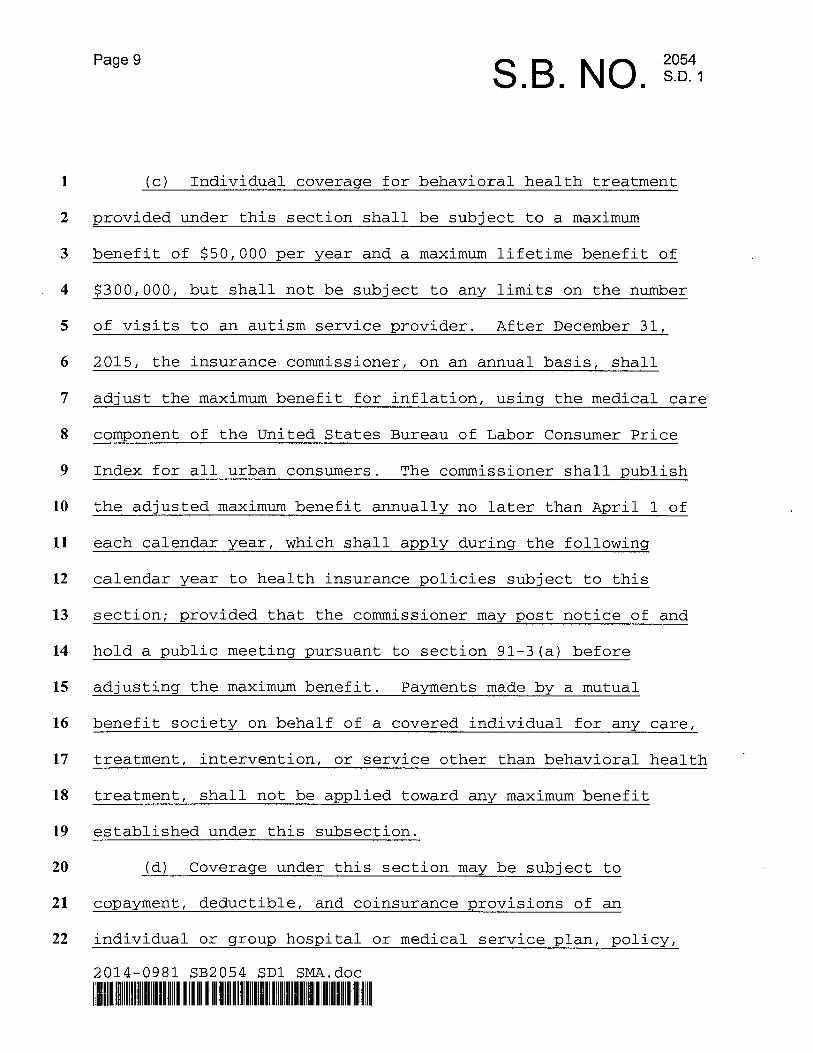
Page 9 2054 S.B. NO. s . D . ~
1
2
3
4
5
6
7
8
9
10
11
12
13
14
15
16
17
18
19
20
21
22
(c) Individual coverage for behavioral health treatment
provided under this section shall be subject to a maximum
benefit of $50,000 per year and a maximum lifetime benefit of
$300,000, but shall not be subject to any limits on the number
of visits to an autism service provider. After December 31,
2015, the insurance commissioner, on an annual basis, shall
adjust the maximum benefit for inflation, using the medical care
component of the United States Bureau of Labor Consumer Price
Index for all urban consumers. The commissioner shall publish
the adjusted maximum benefit annually no later than April 1 of
each calendar year, which shall apply during the following
calendar year to health insurance policies subject to this
section; provided that the commissioner may post notice of and
hold a public meeting pursuant to section 91-3(a) before
adjusting the maximum benefit. Payments made by a mutual
benefit society on behalf of a covered individual for any care,
treatment, intervention, or service other than behavioral health
treatment, shall not be applied toward any maximum benefit
established under this subsection.
(d) Coverage under this section may be subject to
copayment, deductible, and coinsurance provisions of an
individual or group hospital or medical service plan, policy,
2014-0981 SB2054 SD1 SMA.doc
I llllll111 I1111 Ill llll llllll1111lll111 Ill II Ill Ill I I/ II I 111 II I lllll1111 llllllll I IIIII Ill1 llllllll lllll1111 Ill lllllll Ill llilll 18 II
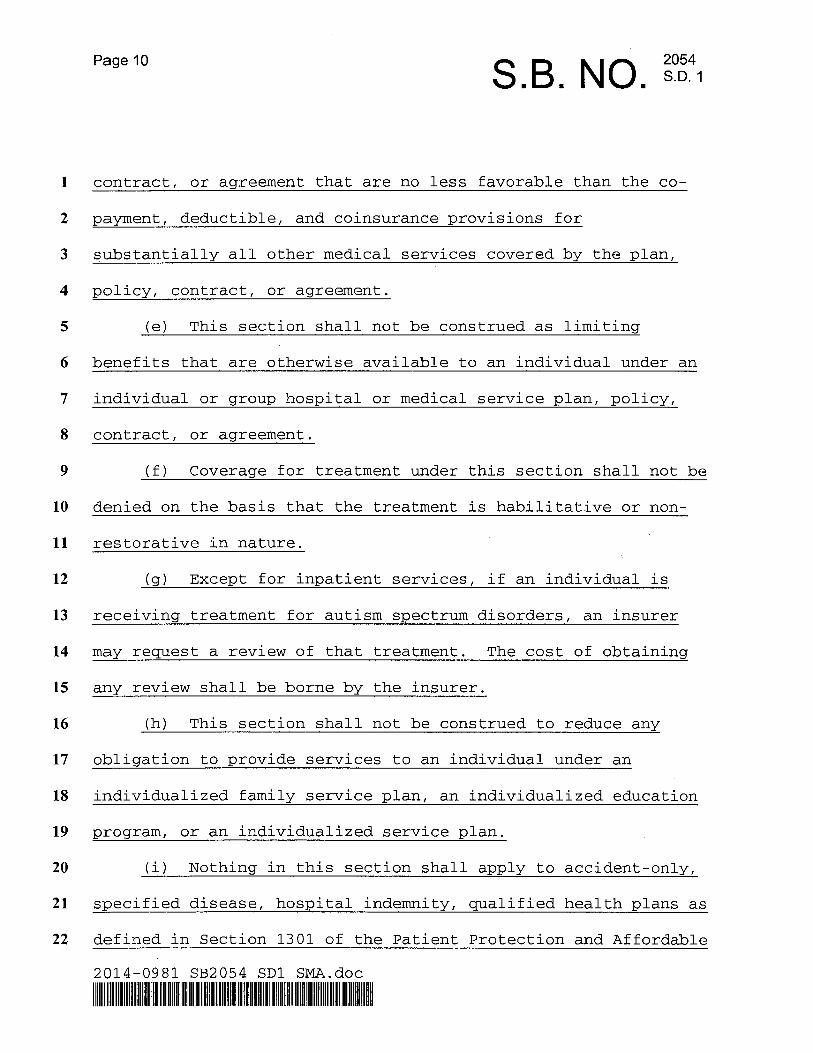
Page 10 2054 S.B. NO. s . D . ~
1
2
3
4
5
6
7
8
9
10
11
12
13
14
15
16
17
18
19
20
21
22
contract, or agreement that are no less favorable than the co-
payment, deductible, and coinsurance provisions for
substantially all other medical services covered by the plan,
policy, contract, or agreement.
(e) This section shall not be construed as limitincr
benefits that are otherwise available to an individual under an
individual or group hospital or medical service plan, policy,
contract, or agreement.
(f) Coverage for treatment under this section shall not be
denied on the basis that the treatment is habilitative or non-
restorative in nature.
(cr) Exce-ot for in-oatient services. if an individual is
receiving treatment for autism spectrum disorders, an insurer
may request a review of that treatment. The cost of obtaining
any review shall be borne by the insurer.
(h) This section shall not be construed to reduce any
obligation to provide services to an individual under an
individualized family service plan, an individualized education
program, or an individualized service plan.
(i) Nothing in this section shall apply to accident-only,
specified disease, hospital indemnity, qualified health plans as
defined in Section 1301 of the Patient Protection and Affordable
2014-0981 SB2054 SD1 SMA.doc
111 lllllllllllllllll IlllllllI llllllllllllll llllllllllllllllllllllllllllllllllllll llllljlllllllllllllllllllllll~ llllllllllllllll
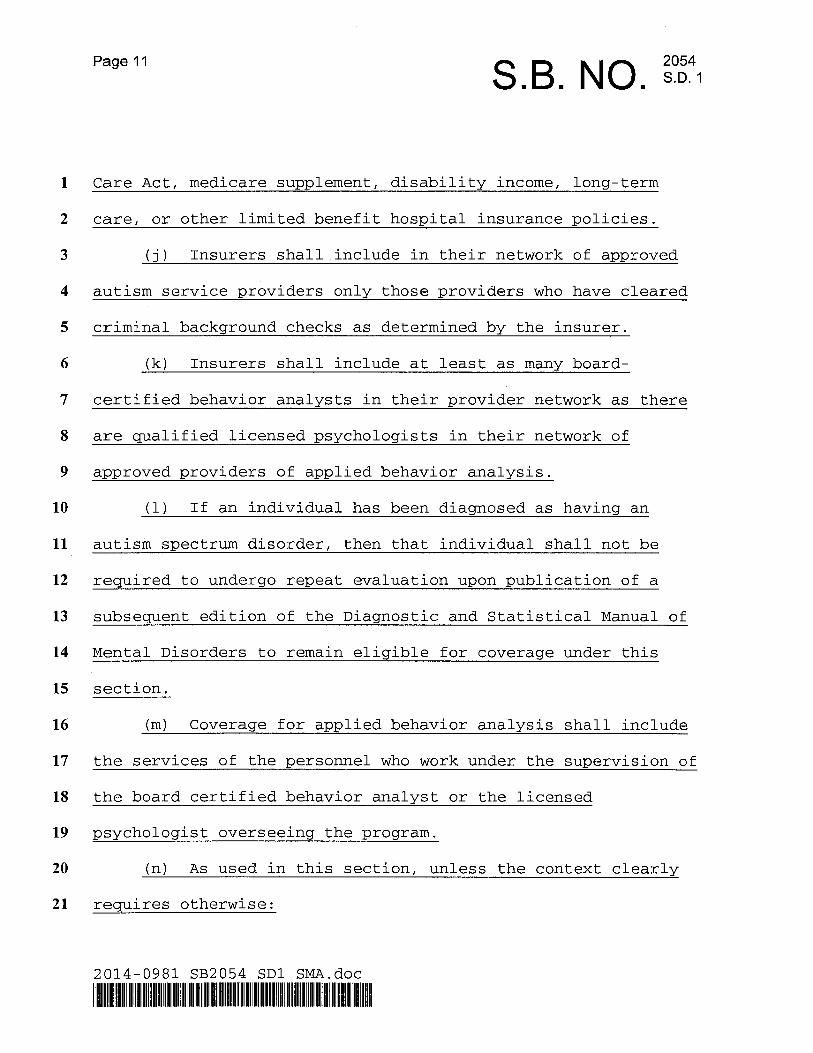
Page 11 2054 S.B. NO. s . D . ~
1
2
3
4
5
6
7
8
9
10
11
12
13
14
15
16
17
18
19
20
21
Care Act, medicare supplement, disability income, long-term
care, or other limited benefit hospital insurance policies.
(i) Insurers shall include in their network of amroved
autism service providers only those providers who have cleared
criminal background checks as determined by the insurer.
(k) Insurers shall include at least as many board-
certified behavior analysts in their provider network as there
are qualified licensed psychologists in their network of
approved providers of applied behavior analysis.
(1) If an individual has been diacrnosed as havincr an
autism spectrum disorder, then that individual shall not be
required to undergo repeat evaluation upon publication of a
subsequent edition of the Diagnostic and Statistical Manual of
Mental Disorders to remain eligible for coverage under this
section.
(m) Coveracre for amlied behavior analvsis shall include
the services of the personnel who work under the supervision of
the board certified behavior analyst or the licensed
psychologist overseeing the program.
(n) As used in this section, unless the context clearly
requires otherwise:
2014-0981 SB2054 SD1 SMA.doc
I111111 1111 II 1111I11l11 llllll lllllll11 lllll I1 I I 1111 111 811 All lllll II B111 I 1l1111 llIl111/ I llllll.1 lllll lllllll I I II lI111l1111 Ill 811

Page 12 2054 S.B. NO. s . D . ~
1
2
3
4
5
6
7
8
9
10
11
12
13
14
15
16
17
18
19
20
"Applied behavior analysis" means the design,
implementation, and evaluation of environmental modifications,
using behavioral stimuli and consequences, to produce socially
significant improvement in human behavior, including the use of
direct observation, measurement, and functional analysis of the
relationship between environment and behavior. The practice of
applied behavior analysis expressly excludes psychological
testing, diagnosis of a mental or physical disorder,
neuropsychology, psychotherapy, cognitive therapy, sex therapy,
psychoanalysis, hypnotherapy, and long-term counseling as
treatment modalities.
"Autism service provider" means any person, entity, or
group that provides treatment for autism spectrum disorders.
"Autism spectrum disorders" means any of the pervasive
developmental disorders or autism spectrum disorders as defined
bv the most recent edition of the Diacrnostic and Statistical
Manual of Mental Disorders.
"Behavioral health treatment" means evidence-based
counseling and treatment programs, including applied behavior
analysis, that are:
2014-0981 SB2054 SDI SMA.doc
111111111~~lllll~lllllllllllllllll lilllllllllllllllllllllllllllllllllll I llllllllilllel llllllllllll Alllllllllllllll llllllllllllllllll

Page 13 2054 S.B. NO. s . D . ~
1
2
3
4
5
6
7
8
9
10
11
12
13
14
15
16
17
18
19
20
21
22
(1)
(2)
Necessary to develop, maintain, or restore, to the
maximum extent practicable, the functioning of an
individual; and
Provided or supervised by a board-certified behavior
analyst or by a licensed psychologist so long as the
services Derformed are commensurate with the
psychologist's formal university training and
suDervised emerience.
"Board certified behavioral analyst" means a behavior
analyst credentialed by the Behavior Analyst Certification Board
as a board certified analyst.
"Diagnosis of autism spectrum disorders" means medically
necessarv assessments, evaluations, or tests conducted to
diagnose whether an individual has an autism spectrum disorder.
"Pharmacy care" means medications prescribed by a licensed
physician or nurse practitioner and any health-related services
that are deemed medically necessary to determine the need or
effectiveness of the medications.
"Psychiatric care" means direct or consultative services
provided by a licensed psychiatrist.
"Psychological care" means direct or consultative services
provided by a licensed psychologist.
2014-0981 SB2054 S D I SMA.doc
I lllllllllllllllllllllllllllllllllllllllllllllllllllllllllllllllll1111111 llllllllllllllllllllll11111111111111 llllllllllllllllllllllllll
Page 14 2054 S.B. NO. s - D . ~
6
7
8
9
10
11
12
13
14
15
16
17
18
19
20
22
"Therapeutic care" means services provided by licensed
speech pathologists, registered occupational therapists,
licensed social workers, licensed clinical social workers, or
licensed physical therapists.
"Treatment for autism sDectrum disorders" includes the
following care prescribed or ordered for an individual with an
autism spectrum disorder by a licensed physician, psychiatrist,
psychologist, licensed clinical social worker, or nurse
practitioner if the care is determined to be medically
necessary:
- (1) Behavioral health treatment;
- (2 ) Pharmacy care;
- (3 ) Psychiatric care;
- (4) Psychological care; and
(5) Therapeutic care. 'I .___
SECTION 5. Section 432D-23, Hawaii Revised Statutes, is
amended to read as follows:
I15432D-23 Required provisions and benefits.
Notwithstanding any provision of law to the contrary, each
policy, contract, plan, or agreement issued in the State after
January 1, 1995, by health maintenance organizations pursuant to
this chapter, shall include benefits provided in sections
2014-0981 SB2054 SD1 SMA.doc
Page 15 2054 S.B. NO. s . D . ~
1
2
3
4
5
6
7
8
9
10
11
12
13
14
15
16
17
18
19
431:lO-212, 431:lOA-115, 431:10A-115.5, 431:10A-116, 431:lOA-
116.2, 431:10A-116.5, 431:10A-116.6, 431:10A-119, 431:10A-120,
431:10A-121, 431:lOA-122, 431:lOA-125, 431:lOA-126, [431:10?&
1 3 9 --A n 2 1 . 1 n ~ 11 ullu L J L . I . u l A 116.2] and 431:lOA- , and chapter 431M.l'
SECTION 6. Notwithstanding section 432D-23, Hawaii Revised
Statutes, the coverage and benefit for autism spectrum disorders
to be provided by a health maintenance organization under
section 5 of this Act shall apply to all policies, contracts,
plans, or agreements issued or renewed in this State by a health
maintenance organization on or after July 1, 2014.
SECTION 7. If any provision of this Act, or the
application thereof to any person or circumstance, is held
invalid, the invalidity does not affect other provisions or
applications of the Act that can be given effect without the
invalid provision or application, and to this end the provisions
of this Act are severable.
SECTION 8. Statutory material to be repealed is bracketed
and stricken. New statutory material is underscored.
SECTION 9. This Act shall take effect on July 1, 2014.
2014-0981 SB2054 SD1 SMA.doc
2054 S.B. NO. s . D . ~
Report Title: Health; Insurance; Mandatory Health Coverage; Autism Spectrum Disorders
Description: Requires health insurers, mutual benefit societies, and health maintenance organizations to provide coverage for autism spectrum disorder treatments. (SD1)
The summary description of legislation appearing on this page is for informational purposes only and is not legislation or evidence of legislative intent.
2014-0981 SB2054 S D 1 SMA-doc
ACTUARIAL COST ESTIMATE – HAWAII SB 2054
OLIVER WYMAN
30
Appendix 3 DHS Cost Testimony
-3*, .P1?NEIL ABERCROMBIE o r ,, PATRICIA MCMANAMAN
GOVERNOR T;";‘;~1‘{,- DIRECTOR
I, ew//;,»‘ gti _ , V _ BARBARA A. YAMASHITA',‘§'g‘§‘.‘Q DEFUTYDIRECTOR
"'3?-‘-/,5cw-~... -ms Q3; ,.,r»;>»
STATE or HAWAIIDEPARTMENT OF HUMAN SERVICES
P. O. Box 339Honolulu, Hawaii 96809-0339
Wm
February 11,2014, 2014
TO: The Honorable Angus L. K. McKelvey, ChairHouse Committee on Consumer protection and Commerce
FROM: Patricia McManaman, Director
SUBJECT: H.B. 2174, H.D. 1 - RELATING TO HEALTH
Hearing: Monday, February 10, 2014; 5:00 p.m.Conference Room 325, State Capitol
PURPOSE: The purpose of this bill is to require health insurers, mutual bene t
societies, and health maintenance organizations to provide coverage for treatment of autism
spectrum disorders subject to a maximum bene t of $50,000 per year and a maximum lifetime
bene t of $300,000. This bill would also exempt the Medicaid plans from the coverage
requirements.
DEPARTMENT’S POSITION: The Department of Human Services (DHS) provides
the following comments for consideration regarding the provision of autism spectrum disorders.
Even though this measure purports to exempt Medicaid plans from providing services for
autism spectrum disorders required by this bill, once these services are established as the
standard of care, these standards will trigger the application of these services to Medicaid
eligible children under the Early & Periodic Screening, Diagnosis & Treatment (EPSDT)
AN EQUAL OPPORTUNITY AGENCY
requirements for the more than 100,000 children in our Medicaid program. Additionally, it
creates health care disparities by virtue of economic class.
Should ABA be covered in Medicaid, the DHS estimates a projected total cost of $135
million to serve children up to age 19 years, ofwhich $24.9 million would be DHS’s cost,
including federal funds.
The Department of Human Services conducted a study, between legislative sessions, on
the cost ofMedicaid coverage of applied behavioral analysis (ABA) to treat autism. While the
population effect size ofABA is unclear, research has focused on children younger than 6 years
of age and as children grow older, ABA treatment hours generally diminish. Should ABA be
covered in Medicaid, the DHS estimates its annual total cost would be $24.3 million to serve
children up to 6 years of age, of which approximately half would be federally funded. This
measure would create a new standard of care and in effect de nes applied behavioral analysis
(ABA) as being medically necessary. These factors would result in Medicaid being required to
cover ABA under Early and Periodic Screening, Diagnosis, and Treatment (EPSDT)
requirements. The Hilopa‘a Project completed a comprehensive analysis that was utilized by the
DHS and is included as an attachment to our testimony.
In Hawaii, the Department of Health (DOH) Early Intervention Program provides
services to Medicaid bene ciaries ages 0-3 years who met eligibility criteria, and the Department
ofEducation (DOE) Special Education program provides services during the school day for
children beginning at age 3 years. The DHS would be responsible for services provided outside
of the school day and for services not covered by DOE. While the DOH and the DOE would be
responsible for funding the state share of the services, DHS would be responsible for accessing
federal matching funds for the DOH and the DOE services for Medicaid quali ed children.
Summary of the potential annual costs of covering ABA in MedicaidAN EQUAL OPPORTUNITY AGENCY
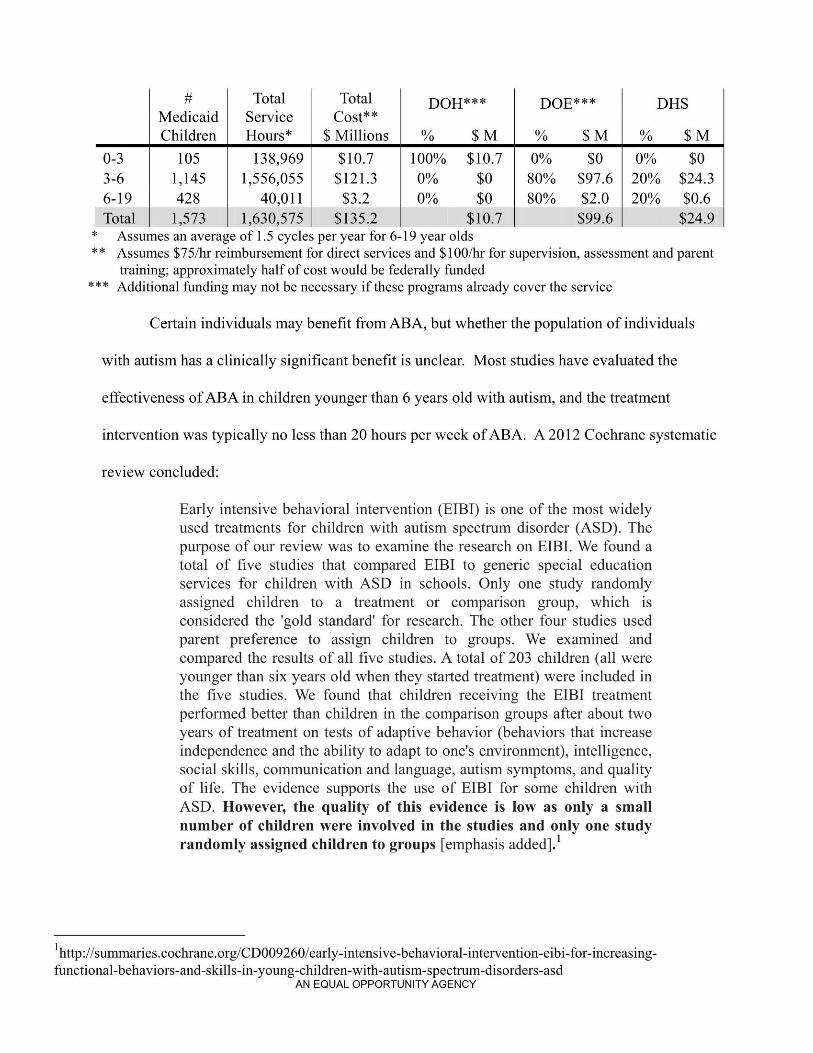
# Total Total DOH*=i=>x< DOE*** DHSMedicaid Service Cost**Children Hours* $ Millions % $ M % $ M % $ M
0-3 105 138,969 $10.7 100% $10.7 0% $0 0% $03-6 1,145 1,556,055 $121.3 0% $0 80% $97.6 20% $24.36-19 428 40,011 $3.2 0% $0 80% $2.0 20% $0.6Total 1,573 1,630,575 $135.2 $10.7 $99.6 $24.9* Assumes an average of 1.5 cycles per year for 6-19 year olds** Assumes $75/hr reimbursement for direct services and $100/hr for supervision, assessment and parent
training; approximately half of cost would be federally funded*** Additional funding may not be necessary if these programs already cover the service
Certain individuals may bene t from ABA, but whether the population of individuals
with autism has a clinically signi cant bene t is unclear. Most studies have evaluated the
effectiveness ofABA in children younger than 6 years old with autism, and the treatment
intervention was typically no less than 20 hours per week ofABA. A 2012 Cochrane systematic
review concluded:
Early intensive behavioral intervention (EIBI) is one of the most widelyused treatments for children with autism spectrum disorder (ASD). Thepurpose of our review was to examine the research on EIBI. We found atotal of ve studies that compared EIBI to generic special educationservices for children with ASD in schools. Only one study randomlyassigned children to a treatment or comparison group, which isconsidered the ‘gold standard‘ for research. The other four studies usedparent preference to assign children to groups. We examined andcompared the results of all ve studies. A total of 203 children (all wereyounger than six years old when they started treatment) were included inthe ve studies. We found that children receiving the EIBI treatmentperformed better than children in the comparison groups after about twoyears of treatment on tests of adaptive behavior (behaviors that increaseindependence and the ability to adapt to one‘s environment), intelligence,social skills, communication and language, autism symptoms, and qualityof life. The evidence supports the use of EIBI for some children withASD. However, the quality of this evidence is low as only a smallnumber of children were involved in the studies and only one studyrandomly assigned children to groups [emphasis added].1
lhttp://summaries.cochrane.org/CD009260/early-intensive-behaviora1-intervention-eibi-for-increasing-functional-behaviors-and-skil1s-in-young-chi1dren-With-autism-spectrum-disorders-asd
AN EQUAL OPPORTUNITY AGENCY
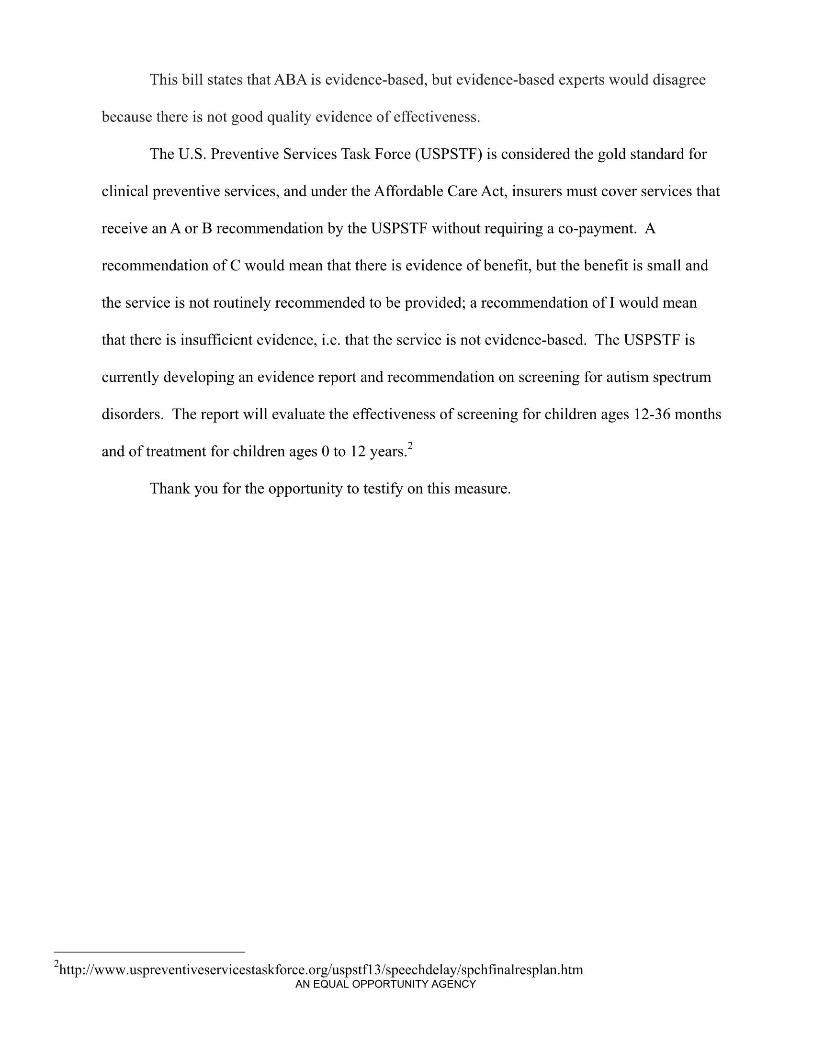
This bill states that ABA is evidence-based, but evidence-based experts would disagree
because there is not good quality evidence of effectiveness.
The U.S. Preventive Services Task Force (USPSTF) is considered the gold standard for
clinical preventive services, and under the Affordable Care Act, insurers must cover services that
receive an A or B recommendation by the USPSTF without requiring a co-payment. A
recommendation of C would mean that there is evidence of bene t, but the bene t is small and
the service is not routinely recommended to be provided; a recommendation of 1 would mean
that there is insufficient evidence, i.e. that the service is not evidence-based. The USPSTF is
currently developing an evidence report and recommendation on screening for autism spectrum
disorders. The report will evaluate the effectiveness of screening for children ages 12-36 months
and of treatment for children ages 0 to 12 years.2
Thank you for the opportunity to testify on this measure.
Zhttp://wwwuspreventiveservicestaskforce.org/uspstfl 3/speechdelay/spch nalresplanhtmAN EQUAL OPPORTUNITY AGENCY
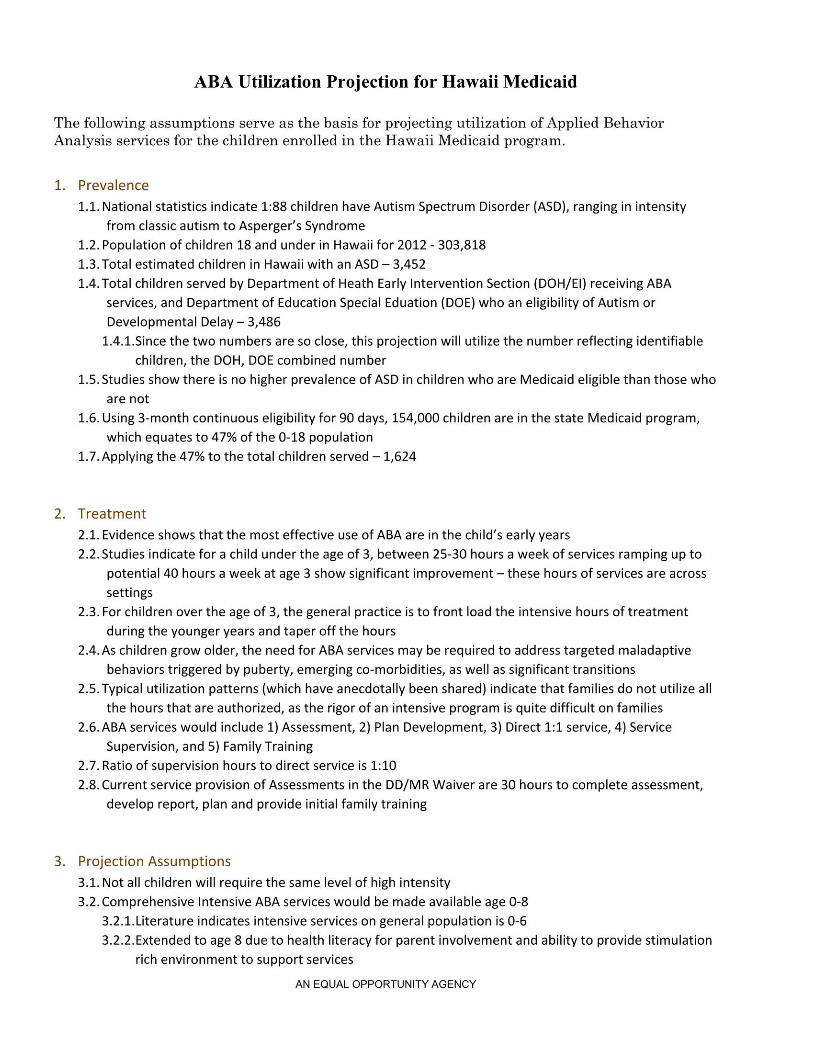
ABA Utilization Projection for Hawaii Medicaid
The following assumptions serve as the basis for projecting utilization of Applied BehaviorAnalysis services for the children enrolled in the Hawaii Medicaid program.
1. Prevalence1.1. National statistics indicate 1:88 children have Autism Spectrum Disorder (ASD), ranging in intensityfrom classic autism to Asperger's Syndrome
1.2. Population of children 18 and under in Hawaii for 2012 - 303,8181.3.Total estimated children in Hawaii with an ASD — 3,452l.4.Total children served by Department of Heath Early Intervention Section (DOH/El) receiving ABA
services, and Department of Education Special Eduation (DOE) who an eligibility of Autism orDevelopmental Delay — 3,4861.4.1.Since the two numbers are so close, this projection will utilize the number reflecting identifiable
children, the DOH, DOE combined number1.5.Studies show there is no higher prevalence of ASD in children who are Medicaid eligible than those who
are not1.6. Using 3-month continuous eligibility for 90 days, 154,000 children are in the state Medicaid program,
which equates to 47% of the 0-18 population1.7. Applying the 47% to the total children served — 1,624
2. Treatment2.1. Evidence shows that the most effective use of ABA are in the child's early years2.2.Studies indicate for a child under the age of 3, between 25-30 hours a week of services ramping up to
potential 40 hours a week at age 3 show significant improvement — these hours of services are acrosssettings
2.3. For children over the age of 3, the general practice is to front load the intensive hours of treatmentduring the younger years and taper off the hours
2.4.As children grow older, the need for ABA services may be required to address targeted maladaptivebehaviors triggered by puberty, emerging co-morbidities, as well as significant transitions
2.5.Typical utilization patterns (which have anecdotally been shared) indicate that families do not utilize allthe hours that are authorized, as the rigor of an intensive program is quite difficult on families
2.6.ABA services would include 1) Assessment, 2) Plan Development, 3) Direct 1:1 service, 4) ServiceSupervision, and 5) Family Training
2.7. Ratio of supervision hours to direct service is 1:102.8. Current service provision of Assessments in the DD/MR Waiver are 30 hours to complete assessment,
develop report, plan and provide initial family training
3. Projection Assumptions3.1. Not all children will require the same level of high intensity3.2. Comprehensive Intensive ABA services would be made available age O-83.2.1.Literature indicates intensive services on general population is O-63.2.2.Extended to age 8 due to health literacy for parent involvement and ability to provide stimulation
rich environment to support services
AN EQUAL OPPORTUNITY AGENCY
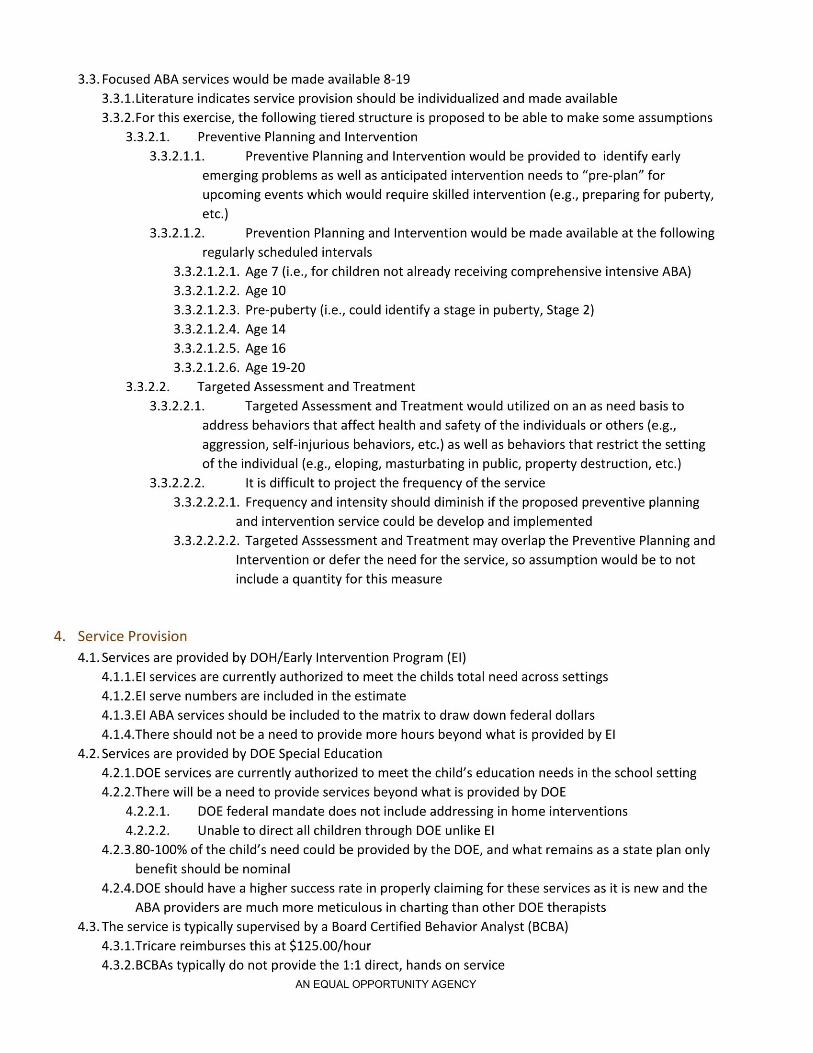
3.3. Focused ABA services would be made available 8-193.3.1.Literature indicates service provision should be individualized and made available3.3.2.For this exercise, the following tiered structure is proposed to be able to make some assumptions3.3.2.1. Preventive Planning and Intervention3.3.2.1.1. Preventive Planning and Intervention would be provided to identify early
emerging problems as well as anticipated intervention needs to ”pre-plan” forupcoming events which would require skilled intervention (e.g., preparing for puberty,etc.)
3.3.2.1.2. Prevention Planning and Intervention would be made available at the followingregularly scheduled intervals
3.3.2.1.2.1. Age 7 (i.e., for children not already receiving comprehensive intensive ABA)3.3.2.1.2.2. Age 103.3.2.123. Pre-puberty (i.e., could identify a stage in puberty, Stage 2)3.3.2.1.2.4. Age 143.3.2.1.2.5. Age 163.3.2.126. Age 19-20
3.3.2.2. Targeted Assessment and Treatment3.3.2.2.1. Targeted Assessment and Treatment would utilized on an as need basis to
address behaviors that affect health and safety of the individuals or others (e.g.,aggression, self-injurious behaviors, etc.) as well as behaviors that restrict the settingof the individual (e.g., eloping, masturbating in public, property destruction, etc.)
3.3.2.2.2. It is difficult to project the frequency of the service3.3.2.2.2.1. Frequency and intensity should diminish if the proposed preventive planning
and intervention service could be develop and implemented3.3.2.2.2.2. Targeted Asssessment and Treatment may overlap the Preventive Planning and
Intervention or defer the need for the service, so assumption would be to notinclude a quantity for this measure
4. Service Provision4.1.Services are provided by DOH/Early Intervention Program (El)4.1.1.El services are currently authorized to meet the childs total need across settings4.1.2.El serve numbers are included in the estimate4.1.3.El ABA services should be included to the matrix to draw down federal dollars4.1.4.There should not be a need to provide more hours beyond what is provided by El
4.2.Services are provided by DOE Special Education4.2.1.DOE services are currently authorized to meet the child's education needs in the school setting4.2.2.There will be a need to provide services beyond what is provided by DOE4.2.2.1. DOE federal mandate does not include addressing in home interventions4.2.2.2. Unable to direct all children through DOE unlike El
4.2.3.80—l0O% ofthe child's need could be provided by the DOE, and what remains as a state plan onlybenefit should be nominal
4.2.4.DOE should have a higher success rate in properly claiming for these services as it is new and theABA providers are much more meticulous in charting than other DOE therapists
4.3.The service is typically supervised by a Board Certified Behavior Analyst (BCBA)4.3.1.Tricare reimburses this at $125.00/hour4.3.2.BCBAs typically do not provide the 1:1 direct, hands on service
AN EQUAL OPPORTUNITY AGENCY
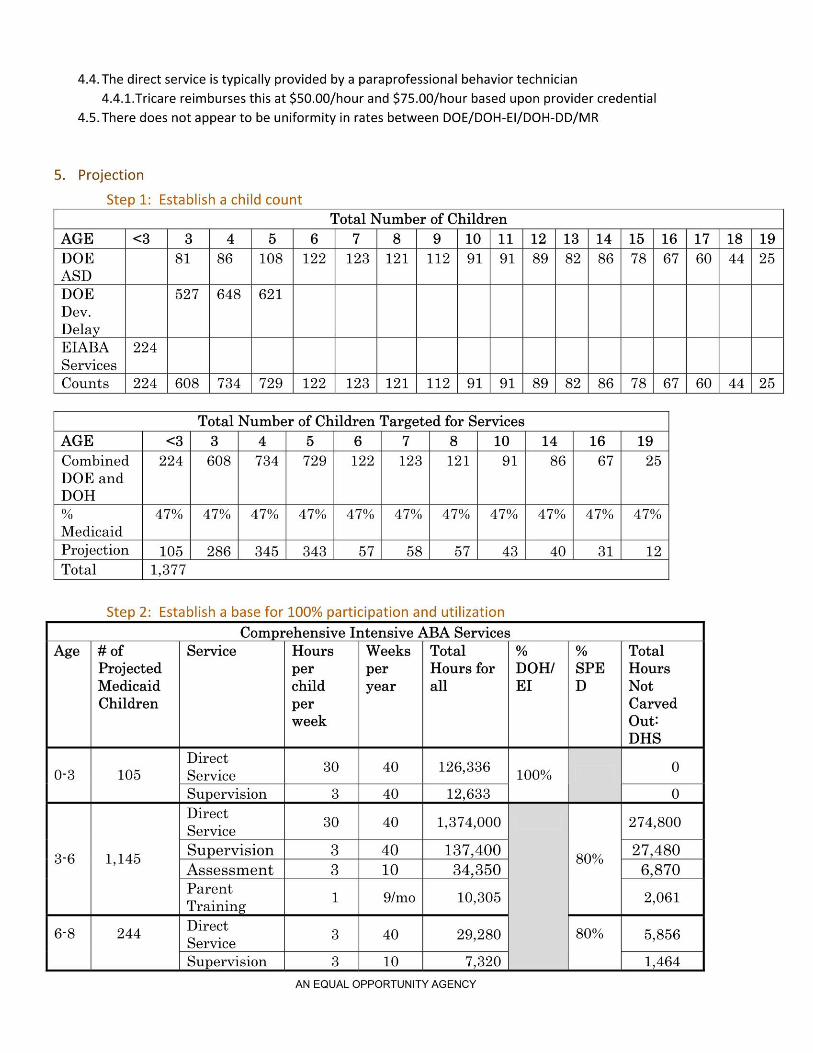
4.4.The direct service is typically provided by a paraprofessional behavior technician4.4.1.Tricare reimburses this at $50.00/hour and $75.00/hour based upon provider credential
4.5.There does not appear to be uniformity in rates between DOE/DOH-El/DOH-DD/MR
5. ProjectionStep 1: Establish a child count
Total Number of ChildrenAGE Z I I I I 7 )5) 9 )10)11|12) I-4 OD I-4 >5 I-' U! I-l U5 I-4 KT I-' CD I-l LO
DOEASD )51)56)105)122
l l\9 Q3Ob <1 Q7 O3 \1 OJO >5>5 [O UT
DOEDev.Delay
527 648 621125) 121)
112 91 91 59
EIABA 224) ) ) )Services
Counts )224 |605 | 754 ) 729 | 122 125) 121) 112) 91) 91) 59) 5IO G)G) <1 CD Q \l G)O wkwk l\D U!
Total Number of Children Targeted for ServicesAGE Aon 0:: in o1 6|7|5|10|14)16 19Combined 224 608 734 729DOE andDOH
122 123 121 91 86 67 25
% 7% 47% 47% 47%Medicaid
Jk 47% 47% 47% 47% 47% 47% 47%
Projection 105) 256) 545) 545 57) 55) 57) 45) 40) 51 12Total 1,377
Step 2: Establish a base for 100% participation and utilizationComprehensive Intensive ABA Services
Age # ofProjectedMedicaidChildren per
week
Service Hours Weeks Totalper per Hours for DOH! SPEchild year all EI D
% % TotalHoursNotCarvedOut!DHS
Direct0-5 105 Service 3° 40 126,556 100%
) Supervision ) 3 )40 12,655 )0
0 IDirect 30Service 40 1,574,000
3_6 1,145Supervision 3 40 157,400Assessment 3 10 34,350ParentTraining 1 9/mo 10,305
80%
274,800
27,4806,870
2,061
6-5 244 Direct 5Service 40 29,250Supervision 3 10 7,320
80% 5,5561,464
AN EQUAL OPPORTUNITY AGENCY
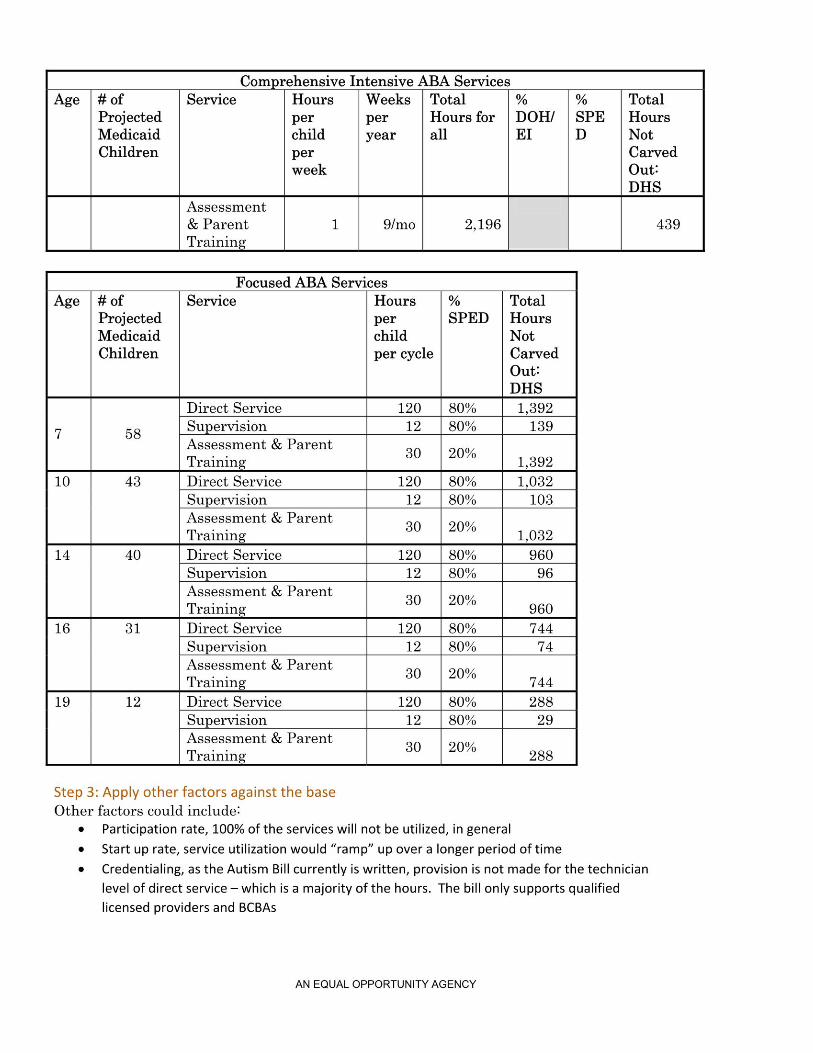
Compgehensive Intensive ABA ServicesAge # of
ProjectedMedicaidChildren
Service Hours Weeks Total
perweek
% %per per Hours for DOHI SPEchild year all EI D
TotalHoursNotCarvedOut?DHS
Assessment& Parent 1 9/moTraining
2,196 439
Focused ABA ServicesAge # of
ProjectedMedicaidChildren
Service Hoursperchildper cycle
%SPED
TotalHoursNotCarvedOutiDHS
7 58
Direct Service 120 80% 1,392Supervision 12 80% 139Assessment & ParentTraining 30 20% 1,592
10 43 Direct Service 120 50% ) 1,052Supervision 12 50% ) 105Assessment & ParentTraining
30 20% 1,03214 40 Direct Service 120 80% 960
Supervision 12 80% 96Assessment & ParentTraining 30 20%
96016 31 Direct Service 120 80% 744
Supervision 12 80% 74Assessment & ParentTraining
30 20%744
19 12 Direct Service 120 80% 288Supervision 12 80% 29Assessment & ParentTraining 30 20% 288
Step 3: Apply other factors against the baseOther factors could includel
¢ Participation rate, 100% of the services will not be utilized, in generalI Start up rate, service utilization would “ramp” up over a longer period of time0 Credentialing, as the Autism Bill currently is written, provision is not made for the technicianlevel of direct service — which is a majority of the hours. The bill only supports qualifiedlicensed providers and BCBAs
AN EQUAL OPPORTUNITY AGENCY
Oliver Wyman Three Logan Square 1717 Arch Street, 10th Floor Philadelphia, PA 19103 1 215 246 1000
State of Hawaii Analysis of Cost of Certain ASD Services Final Report 12/05/14
Appendix E: Detailed Discussion of Applicable ASOPs
Wakely’s review and this report comply with the following applicable ASOPs:
• ASOP No. 5, Incurred Health and Disability Claims • ASOP No. 23, Data Quality • ASOP No. 41, Actuarial Communications
Detailed comments regarding each ASOP follow.
ASOP 5: Incurred Health and Disability Claims This report is consistent with the guidance in ASOP 5 regarding Incurred Health and Disability Claims.
Considerations for Estimating Incurred Claims Wakely considered the impacts of health benefit plan provisions and business practices, economic influences, unique risk characteristics by block of business, legislative requirements, and carve-outs in developing our independent cost projection.
ASOP 23: Data Quality Previous sections of this report document the data sources and reliances. A review of data, limitations and conflicts are discussed below
Process the Actuary Followed to Evaluate the Data Wakely evaluated the information provided by reviewing it for reasonableness. Wakely did not perform an independent audit or otherwise verify the accuracy of the information.
Limitations, Unresolved Concerns or Significant Bias due to Uncertainty about the Data Quality or Defects in the data There are no known limitations, unresolved concerns or significant bias of the actuarial work product due to issues with the quality of the information provided.
Conflicts There were no known conflicts that arose during the course of this review.
ASOP 41: Actuarial Communications This report is consistent with the guidance in ASOP 41 regarding Actuarial Communications.
P a g e | 97