saccharomyces cerevisiae - amazon s3 · saccharomyces cerevisiae is an ideal model for systems...
TRANSCRIPT

Manipulation of Gene Regulatory Network Dynamics Identifies Several Important
Transcription Factors Involved in Regulating the Response to Cold Shock in
Saccharomyces Cerevisiae Conor Keith and Nika Vafadari
Department of BiologyLoyola Marymount University
BIOL 398-05/MATH 388-01May 4, 2017
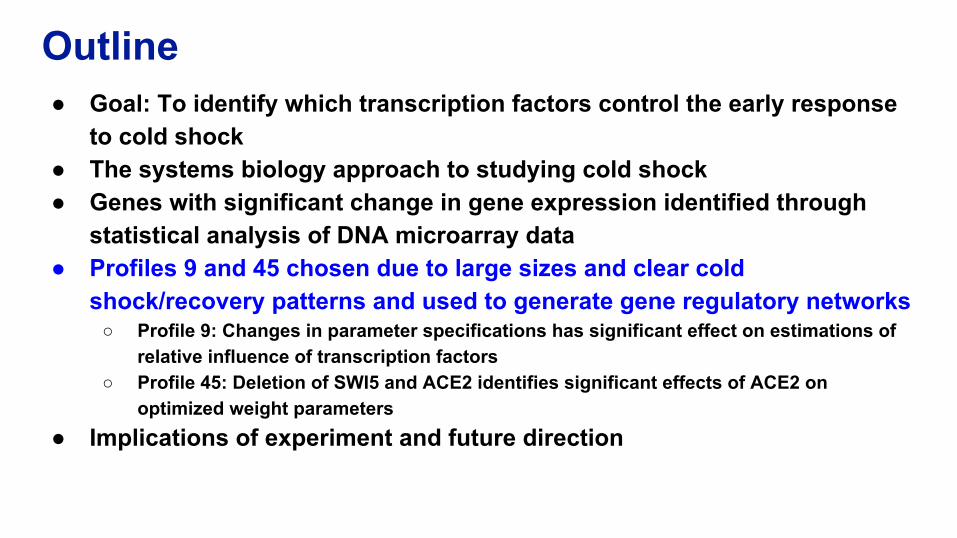
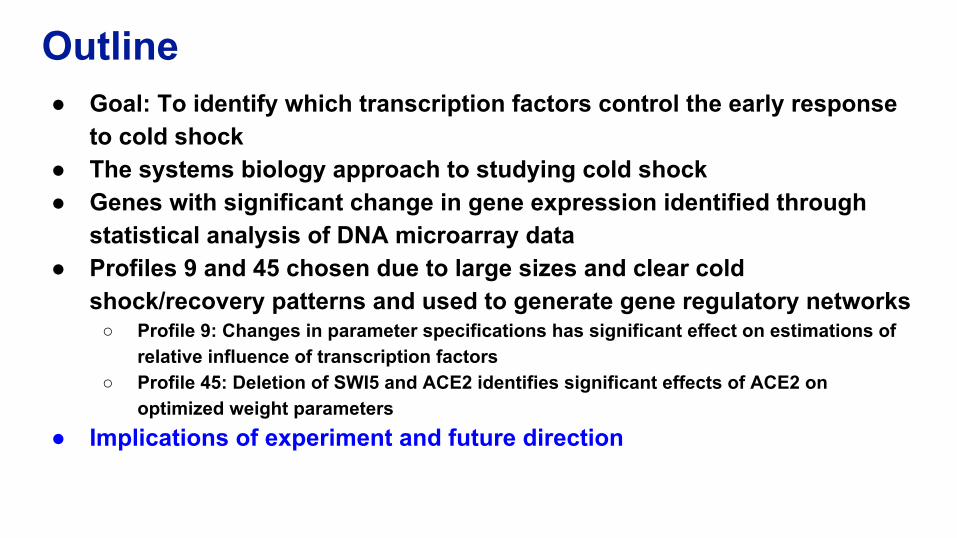
Outline ● Goal: To identify which transcription factors control the early response
to cold shock ● The systems biology approach to studying cold shock● Genes with significant change in gene expression identified through
statistical analysis of DNA microarray data ● Profiles 9 and 45 chosen due to large sizes and clear cold
shock/recovery patterns and used to generate gene regulatory networks○ Profile 9: Changes in parameter specifications has significant effect on estimations of
relative influence of transcription factors ○ Profile 45: Deletion of SWI5 and ACE2 identifies significant effects of ACE2 on
optimized weight parameters● Implications of experiment and future direction
● Saccharomyces cerevisiae is an ideal model for systems biology. ● Yeast respond to environmental stresses (cold shock) by
changing their gene expression. ● Cold shock is not well studied in comparison to heat shock.● The response to cold shock can be divided into an early and late
response.● The complete set of transcription factors responsible for the early
response remain unknown.
Yeast respond to cold shock by changing their gene expression

Goal: Identify which transcription factors control the early response to cold shock
● What are the relative levels of influence of these transcription factors?
● What are the indirect effects of other transcription factors in the gene regulatory network?

Outline ● Goal: To identify which transcription factors control the early response
to cold shock ● The systems biology approach to studying cold shock● Genes with significant change in gene expression identified through
statistical analysis of DNA microarray data ● Profiles 9 and 45 chosen due to large sizes and clear cold
shock/recovery patterns and used to generate gene regulatory networks○ Profile 9: Changes in parameter specifications has significant effect on estimations of
relative influence of transcription factors ○ Profile 45: Deletion of SWI5 and ACE2 identifies significant effects of ACE2 on
optimized weight parameters● Implications of experiment and future direction

Dahlquist, 2017

GRNmap Estimates Parameters With Least Squares Minimization ● Model similar to the version constructed by Vu and Vohradsky. ● Uses sigmoidal production function to model dynamics● The main difference in models is the inclusion of a penalty term in the
mean square error function.● Penalized least squares is popular in genetics and genomics research
where the number of potential predictor variables is very large.● Inclusion of penalty term ensures there is always a unique solution for
the parameters, different from OLS.
Outline ● Goal: To identify which transcription factors control the early response
to cold shock ● The systems biology approach to studying cold shock● Genes with significant change in gene expression identified through
statistical analysis of DNA microarray data ● Profiles 9 and 45 chosen due to large sizes and clear cold
shock/recovery patterns and used to generate gene regulatory networks○ Profile 9: Changes in parameter specifications has significant effect on estimations of
relative influence of transcription factors ○ Profile 45: Deletion of SWI5 and ACE2 identifies significant effects of ACE2 on
optimized weight parameters● Implications of experiment and future direction
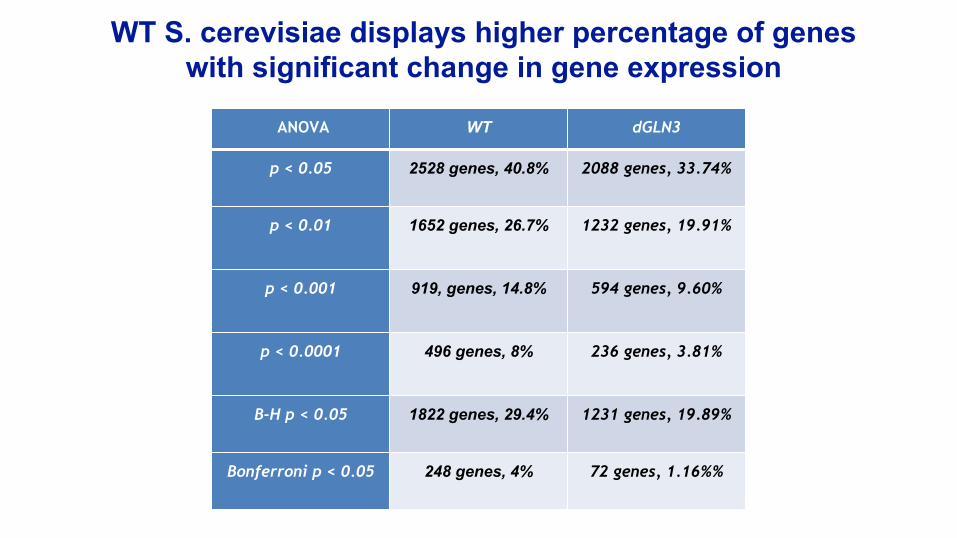
ANOVA WT dGLN3
p < 0.05 2528 genes, 40.8% 2088 genes, 33.74%
p < 0.01 1652 genes, 26.7% 1232 genes, 19.91%
p < 0.001 919, genes, 14.8% 594 genes, 9.60%
p < 0.0001 496 genes, 8% 236 genes, 3.81%
B-H p < 0.05 1822 genes, 29.4% 1231 genes, 19.89%
Bonferroni p < 0.05 248 genes, 4% 72 genes, 1.16%%
WT S. cerevisiae displays higher percentage of genes with significant change in gene expression

Highest percentage of significant genes identified in t60
Outline ● Goal: To identify which transcription factors control the early response
to cold shock ● The systems biology approach to studying cold shock● Genes with significant change in gene expression identified through
statistical analysis of DNA microarray data ● Profiles 9 and 45 chosen due to large sizes and clear cold
shock/recovery patterns and used to generate gene regulatory networks○ Profile 9: Changes in parameter specifications has significant effect on estimations of
relative influence of transcription factors ○ Profile 45: Deletion of SWI5 and ACE2 identifies significant effects of ACE2 on
optimized weight parameters● Implications of experiment and future direction
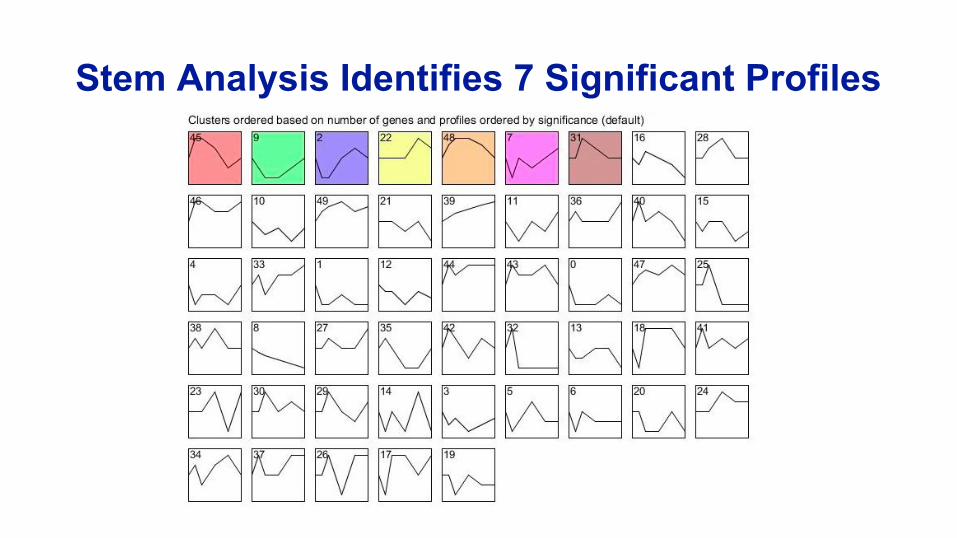
Stem Analysis Identifies 7 Significant Profiles

Profiles 9 and 45 chosen due to large sizes and clear cold shock and recovery patterns
126 genes P-value = 5.6E-32
440 genesP-value = 0.00

Outline ● Goal: To identify which transcription factors control the early response
to cold shock ● The systems biology approach to studying cold shock● Genes with significant change in gene expression identified through
statistical analysis of DNA microarray data ● Profiles 9 and 45 chosen due to large sizes and clear cold
shock/recovery patterns and used to generate gene regulatory networks○ Profile 9: Changes in parameter specifications has significant effect on estimations of
relative influence of transcription factors ○ Profile 45: Deletion of SWI5 and ACE2 identifies significant effects of ACE2 on
optimized weight parameters● Implications of experiment and future direction

Profile 9 gene ontology terms primarily concerned with metabolic processes

6 Out of 17 Transcription Factors in Network Are Statistically Significant

Unweighted Network Consists of 17 Nodes and 17 Edges

Changes in Weight and Direction of Transcription Factor Activity
Initial Run
P and b fixed
P fixed

Significant Increase in LSE/minLSE Ratio with Fixed Parameters P and b
LSE/minLSE = 1.364 LSE/minLSE = 2.021
Estimated Parameters Fixed Parameters

Weights and Direction of Influence for 17 Transcription Factors

Holding Parameters Constant Results in Underestimation of Repression Activity

Holding P Constant Results in Overestimation of of Repression Activity

HSF1 and SIP4 Weights Most Consistently Estimated

Outline ● Goal: To identify which transcription factors control the early response
to cold shock ● The systems biology approach to studying cold shock● Genes with significant change in gene expression identified through
statistical analysis of DNA microarray data ● Profiles 9 and 45 chosen due to large sizes and clear cold
shock/recovery patterns and used to generate gene regulatory networks○ Profile 9: Changes in parameter specifications has significant effect on estimations of
relative influence of transcription factors ○ Profile 45: Deletion of SWI5 and ACE2 identifies significant effects of ACE2 on
optimized weight parameters● Implications of experiment and future direction

894 Gene Ontology (GO) terms associated with
genes that fit profile 45
● 262 significant GO terms identified ○ P-value < 0.05 = 262 (29.31%) ○ Corrected p-value < 0.05 = 33 (3.69%) ‘

Profile 45 gene ontology terms primarily concerned with RNA synthesis and processing
GO Term Definition
RNA 3'-end processing Any process involved in forming the mature 3' end of an RNA molecule
rRNA binding Interacting selectively and noncovalently with ribosomal RNA
snRNA processing Any process involved in the conversion of a primary small nuclear RNA (snRNA) transcript into a mature snRNA molecule
exonucleolytic trimming involved in rRNA processing
Exonucleolytic digestion of a pre-rRNA molecule in the process to generate a mature rRNA molecule
ribosomal large subunit export from nucleus
The directed movement of a ribosomal large subunit from the nucleus into the cytoplasm
Polyadenylation-dependent RNA catabolic process
Chemical reactions/pathways resulting in breakdown of RNA molecule, initiated by polyadenylation at the 3'-end of target RNA

TranscriptionFactor
P-value TranscriptionFactor
P-value
ACE2 5E-15 MSN4 1.51E-07
FKH2 0 PDR1 3.45E-10
GLN3 1.94E-2 STB5 2.22E-11
HAP4 9.07E-2 SWI5 1.18E-09
MCM1 1.39E-08 YHP1 0
MSN2 3E-15 YOX1 0
22 significant genes initially identified in YEASTRACT

Unweighted network comprised of 12 nodes and 17 edges

SWI5 and ACE2 selected for deletion

LSE/minLSE ratio remains constant with deletion of SWI5 and ACE 2
LSE/minLSE =1.448=1.462=1.462
No Deletion SWI5 Deletion ACE2 Deletion
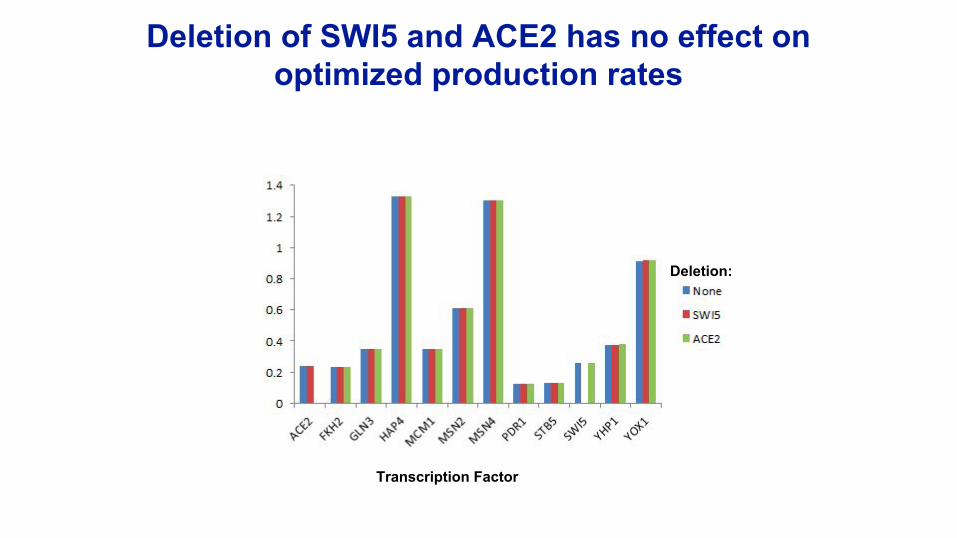
Deletion of SWI5 and ACE2 has no effect on optimized production rates
Deletion:
Transcription Factor

Deletion of SWI5 and ACE2 has no effect on optimized threshold b parameters
Deletion:
Transcription Factor

ACE2 deletion results in changes in optimized weight parameters for multiple connections
Deletion:
Edges
● Increased drastically for edges including SWI5
● Changed sign for edges including YOX1

YOX1 and MCM1 expression varies distinctlybetween WT, dGLN3 and dHAP4 data
Activates 4 target genes: YHP1, YOX1, SWI5, ACE2
-Activated by MCM1 -Repressed by MSN2 (represses 4 target genes)
Outline ● Goal: To identify which transcription factors control the early response
to cold shock ● The systems biology approach to studying cold shock● Genes with significant change in gene expression identified through
statistical analysis of DNA microarray data ● Profiles 9 and 45 chosen due to large sizes and clear cold
shock/recovery patterns and used to generate gene regulatory networks○ Profile 9: Changes in parameter specifications has significant effect on estimations of
relative influence of transcription factors ○ Profile 45: Deletion of SWI5 and ACE2 identifies significant effects of ACE2 on
optimized weight parameters● Implications of experiment and future direction

● Manipulation of parameters ○ HSF1: Consistently estimated as a strong repressor in all three trials ○ SIP4: Consistently estimated as a repressor in all three trials
● Deletion of SWI5 and ACE2 ○ ACE 2: Drastic changes in optimized weight parameters ○ YOX1: Distinct changes in gene expression between WT, dGLN3 and dHAP4○ MCM1: Central activator
● Manipulation of the gene regulatory network dynamics allows for analysis of○ the relative levels of influence of specific transcription factors○ indirect effects of other transcription factors in the gene regulatory network
● Future experimentation could focus on deleting other target genes, such as YOX1, in order to examine indirect relationships with other TFs
Several transcription factors identified as key players in regulating the response to cold shock

Acknowledgements ● We would like to thank Dr. Dahlquist, Dr. Fitzpatrick and the rest of our
classmates.

References
● Dahlquist, Kam D. (2017). GRNmap and GRNsight: Open Source Software for Dynamical Systems Modeling and Visualization of Medium-Scale Gene Regulatory Networks [PowerPoint slides]. Retrieved from http://www.openwetware.org/wiki/Dahlquist.
● Vu, T. T., & Vohradsky, J. (2007). Nonlinear differential equation model for quantification of transcriptional regulation applied to microarray data of Saccharomyces cerevisiae. Nucleic acids research, 35(1), 279-287. doi: 10.1093/nar/gkl1001