second quarter 2016 earnings report - amazon s3 · second quarter 2016 earnings report mexico city,...
TRANSCRIPT

Contacts in Mexico City: Contacts in New York: Francisco Martinez/ Angel Bernal Maria Barona / Juan Carlos Gomez Stolk Investor Relations Officer / Chief Financial Officer i-advize Corporate Communications, Inc. Tel: +52 (55) 5279-8107 / +52 (55) 5279-8109 Tel: +1 (212) 406-3691 / (646) 462-4517 E-mail: [email protected] / [email protected] E-mail: [email protected] / / [email protected]
1
SECONDQUARTER2016EARNINGSREPORT
MexicoCity, July21,2016–Terrafina® (“TERRA”) (BMV:TERRA13),a leadingMexican industrial realestate investment trust (“FIBRA”),externallyadvisedbyPGIMRealEstateanddedicatedtotheacquisition,development,leasingandmanagementofindustrialrealestatepropertiesinMexico,todayannounceditssecondquarter2016(2Q16)earningsresults.ThefiguresinthisreporthavebeenpreparedinaccordancewithInternationalFinancialReportingStandards(“IFRS”).Figurespresentedinthisreportare presented inmillions ofMexican pesos andmillions of U.S. dollars, unless otherwise stated. Additionally, figuresmay vary due to rounding.Terrafina’sfinancialresultsincludedinthisreportareunaudited.Asaresult,thementionedfiguresinthisfinancialreportarepreliminaryfiguresandcouldbeadjustedinthefuture.Thisdocumentmayincludeforward-lookingstatementsthatmayimplyrisksanduncertainties.Termssuchas"estimate","project","plan","believe","expect", "anticipate", "intend", and other similar expressions could be construed as previsions or estimates. Terrafina warns readers thatdeclarationsandestimatesmentioned in thisdocument,or realizedbyTerrafina’smanagement implyrisksanduncertainties thatcouldchange infunctionofvariousfactorsthatareoutofTerrafina’scontrol.FutureexpectationsreflectTerrafina’sjudgmentatthedateofthisdocument.Terrafinareservestherightorobligationtoupdatetheinformationcontainedinthisdocumentorderivedfromthisdocument.Pastorpresentperformanceisnotanindicatortoanticipatefutureperformance.
FinancialandOperatingHighlightsasofJune30,2016
Operating
• AsofJune30,2016,theoccupancyratewas93.2%,a11basispointincreasecomparedtothesecondquarterof2015(2Q15).Additionally,consideringsignedlettersofintent(LOI),occupancyfor2Q16was94.2%.
• Annualizedaverageleasingratepersquarefootat2Q16wasUS$4.88,aUS$0.01decreasecomparedto2Q15.
• For2Q16,Terrafinareportedatotalof30.0millionsquarefeet (msf)ofGrossLeasableArea(GLA)comprisedof208propertiesand215tenants.
• Total leasingactivityfor2Q16reached1.2msf,ofwhich19.9%correspondedtonewleases,67.0%toleaserenewalsand13.1%toearly renewals.LeasingactivitywasmainlyconcentratedintheChihuahua,CiudadJuarez,RamosArizpe,Tijuana,Monterrey,Silao,CuautitlanIzcalliandQueretaromarkets.
• Total developments at June 30, 2016 reached 260,000 square feet ofGLA,whichare expected to contributeUS$1.3milliontoNetOperatingIncome(NOI)forthe2017period.Theexpectedreturnrateforthedevelopmentsthattookplacein2Q16is9.4%*.
*Expectedreturnisnotguaranteed.Finalresultsmayvary.

2
Financial• 2Q16rentalrevenuesreachedUS$32.9million,a4.0%orUS$1.3millionincreasecomparedto2Q15.
• 2Q16NOIwasUS$33.0million,a9.1%orUS$2.8millionincreasecomparedto2Q15.Moreover,theimpliedcaprate
was 9.2%, considering the average share price of US$1.71 (Ps. 30.84) for 2Q16 and an expected NOI of US$133millionfor2016.
• TheNOImarginfor2Q16reached94.3%,a312basispointincreasecomparedto2Q15.• 2Q16EBITDAreachedUS$29.6million,anincreaseof8.7%orUS$2.4millioncomparedto2Q15.
• TheEBITDAmarginfor2Q16was84.3%,a250basispointincreasecomparedto2Q15.• 2Q16adjustedfundsfromoperations(AFFO)reachedUS$19.0million,aUS$0.6milliondecreasecomparedto2Q15.
• TheAFFOmarginfor2Q16was53.9%,a469basispointdecreasecomparedto2Q15.• 2Q16 distributions totaledUS$19.0million.Asa resultof2Q16operations,Terrafinawill distribute Ps.0.5650 per
CBFI(US$0.0313perCBFI)fordistributionscorrespondingtotheJanuary1toJune30,2016period.
• The annualized distribution was US$0.1252; considering the average share price for the quarter of US$1.71(Ps.30.84),Terrafina’sdividendyieldforthequarterwas7.3%.

FiguresindollarsintheIncomeStatementwereconvertedintopesosusingtheaverageexchangeratefortheperiod;fortheBalanceSheettheexchangerateforthecloseoftheperiodwasused.(1)Millionsofsquarefeet.(2)IncludesexpansionsandBuilt-to-Suits(BTS).(3)Occupancyattheendoftheperiod.(4)Indicatestheleaserenewalrateof the leases, includesearly renewals. (5)Excludingaccrued incomeas it isanon-cash item (6)Earningsbefore interest, taxes,depreciationandamortization. (7)CertificadosBursátilesFiduciariosInmobiliarios-RealEstateInvestmentCertificates.FiguresindollarsintheBalanceSheetwereconvertedusingtheclosingexchangerateoftheperiod.(*)Revenuesandexpenseshavebeenadjustedforthecalculationoftheabovementionedmetrics.Pleaserefertothe“2Q16FinancialPerformance"and"Appendices"sectionavailableinthisdocument.Source:PGIMRealEstate–AssetManagement–FundAccounting
3
OperatingandFinancialHighlights
Operating Jun16 Jun15 Var. NumberofDevelopedProperties 208 196 12 GrossLeasableArea(GLA)(msf)
1 30.0 28.3 1.7 NewDevelopments2(msf) 0.20 0.61 -0.40 LandReserves(msf) 6.40 5.74 0.66 OccupancyRate3 93.2% 93.1% 11bps Avg.LeasingRent/SquareFoot(dollars) 4.88 4.89 -0.01 WeightedAverageRemainingLeaseTerm(years) 3.51 3.61 -0.10
RenewalRate4 87.7% 86.2% 150bps
QuarterlyFinancials 2Q16 2Q15 Var. 2Q16 2Q15 Var.
fx 18.0687 15.3162
(millionsofpesosunlessotherwisestated) (millionsofdollarsunlessotherwisestated)
RentalRevenues5 594.9 484.8 22.7%
32.9 31.7 4.0%OtherOperatingIncome 57.7 22.0 162.5% 3.2 1.5 110.4%NetRevenues 661.5 507.8 30.3% 36.6 33.2 10.2%NetOperatingIncome(NOI)* 596.7 463.7 28.7% 33.0 30.3 9.1%NOIMargin 94.3% 91.2% 312bps 94.3% 91.2% 312bpsEBITDA6* 533.2 416.0 28.2% 29.6 27.2 8.7%EBITDAMargin 84.3% 81.8% 250bps
84.3% 81.8% 250bps
FundsfromOperations(FFO)* 372.9 331.4 12.5%
20.7 21.7 -4.5%FFOMargin 59.0% 65.2% -619bps 59.0% 65.2% -619bpsAdjustedFundsfromOperations(AFFO)* 343.3 300.9 14.1% 19.0 19.6 -3.0%AFFOMargin 53.9% 58.6% -469bps 53.9% 58.6% -469bpsDistributions 343.3 300.9 14.1% 19.0 19.6 -3.0%DistributionsperCBFI7 0.5650 0.4956 14.0% 0.0313 0.0323 -3.0%
BalanceSheet Jun16 Mar16 Var. Jun16 Mar16 Var.
fx 18.9113 17.4015
(millionsofpesosunlessotherwisestated) (millionsofdollarsunlessotherwisestated)
Cash&CashEquivalents 4,661.8 4,454.8 4.6% 246.5 256.0 -3.7%InvestmentProperties 31,423.9 28,906.1 8.7% 1,661.6 1,661.1 0.0%LandReserves 827.2 827.2 0.0% 43.7 47.5 -8.0%TotalDebt 13,616.1 12,276.7 10.9% 720.0 705.5 2.1%NetDebt 8,954.4 7,821.8 14.5% 473.5 449.5 5.3%

F
4
CommentbyAlbertoChretin,ChiefExecutiveOfficerandChairmanoftheBoardTerrafina’sresultsremainedstableduringthesecondquarterof2016withthemajorityoftheleasingactivityfocusedinthemarketsofChihuahua,CiudadJuarez,RamosArizpe,Tijuana,Monterrey,Silao,Cuautitlan IzcalliandQueretaro. Intotal,Terrafinaclosed1.2millionsquarefeetofleasingactivityduringthequarter,comprisedof19.9%innewcontracts,67.0% in lease renewals and 13.1% in early renewals. The average annual leasing rentwasUS$4.88 per square foot,reachingUS$4.76persquarefootintheNorthernregion,US$4.93persquarefootintheBajioregionandUS$5.14persquarefootintheCentralregion.Occupancy rate reached 93.2%, a 11 basis point increase compared to the second quarter of 2015. Additionally,includingsignedlettersofintent,occupancyforthequarterwas94.2%.Brokendownbyregion,occupancywas95.6%intheNorthernregion,87.2%intheBajioregionand94.2%intheCentralregion.Lastly,andwithrespecttothemainfinancialindicatorsforthesecondquarter,rentalrevenuesreachedUS$32.9million,NetOperatingRevenuereachedUS$33.0millionandOperatingMarginreached94.3%---generatingUS$19.0millioninAdjustedOperating Funds. Distribution per CBFI reached Ps. 0.5650, orUS$0.0313,which represented an annualizeddistribution of Ps. 2.26 orUS$0.1252 per CBFI, and a 7.3%dividend yield, considering the average CBFI price for thesecondquarterof2016.
AlbertoChretinChiefExecutiveOfficerandChairmanoftheBoard

5
OperatingHighlights
HighlightsbyRegion
(asofJune30,2016) North Bajio Central Total
#Buildings 132 47 29 208
#Tenants 133 46 36 215
GLA(msf) 16.4 7.5 6.1 30.0
NewDevelopments1(msf) 0.0 0.2 0.0 0.2
LandReserves(msf) 3.0 0.1 3.3 6.4
OccupancyRate 95.6% 87.2% 94.2% 93.2%
AverageLeasingRent/SquareFoot(dollars) 4.76 4.93 5.14 4.88
AnnualizedRentalBase% 54.5% 23.8% 21.7% 100.0%
(1)IncludesexpansionsandBuilt-to-Suit(BTS).Source:PGIMRealEstate-AssetManagement
LeasingActivity 2Q16 2Q15 Var.
OperatingPortfolio(msf):
Renewals 0.8 1.2 -0.3
EarlyRenewals 0.2 0.4 -0.3
NewLeases 0.2 0.3 0.0
TotalSquareFeetofLeasesSigned 1.2 1.9 -0.7Source:PGIMRealEstate-AssetManagement
NORTH - BajaCalifornia- Sonora- Chihuahua- Coahuila- NuevoLeón- Tamaulipas- Durango
BAJIO - SanLuisPotosí- Jalisco- Aguascalientes- Guanajuato- Querétaro
CENTRAL - EstadodeMéxico- DistritoFederal- Puebla- Tabasco
Terrafina’soperations2Q16.
30.3%
69.7%
ComposieonbyAssetTypeasof2Q16
(asa%oftotalGLA)
Distribulon Manufacturing

6
OperatingHighlights(continued)OccupancyandRentsbyRegion MaturitiesandRenewalsbyRegion
0
Consolidated
(AsofJune30,2016)
OccupancyRate
Avg.LeasingRent/SquareFoot(dollars) (AsofJune30,2016)
Maturities(numberofcontracts)
%ofTotalMaturities
Renewals(numberofcontracts)
%ofTotal
RenewalsNorth 95.6% 4.76 North 18 75.0% 15 83.3%BajaCalifornia 95.5% 4.72 BajaCalifornia 0 0.0% 0 0.0%Tijuana 95.5% 4.72 Tijuana 0 0.0% 0 0.0%
Sonora 86.3% 4.19 Sonora 0 0.0% 0 0.0%Hermosillo 86.3% 4.19 Hermosillo 0 0.0% 0 0.0%
Chihuahua 95.8% 4.92 Chihuahua 17 70.8% 15 88.2%Chihuahua 95.4% 5.41 Chihuahua 15 62.5% 14 93.3%CiudadJuarez 95.7% 4.52 CiudadJuarez 2 8.3% 1 50.0%Delicias 100.0% 5.59 Delicias 0 0.0% 0 0.0%GomezFarias 100.0% 3.34 GomezFarias 0 0.0% 0 0.0%Camargo 100.0% 3.78 Camargo 0 0.0% 0 0.0%CasasGrandes 100.0% 4.09 CasasGrandes 0 0.0% 0 0.0%
Coahuila 97.9% 4.43 Coahuila 0 0.0% 0 0.0%CiudadAcuña 100.0% 5.87 CiudadAcuña 0 0.0% 0 0.0%Monclova 100.0% 5.26 Monclova 0 0.0% 0 0.0%RamosArizpe 100.0% 4.11 RamosArizpe 0 0.0% 0 0.0%Saltillo 91.0% 5.30 Saltillo 0 0.0% 0 0.0%SanPedrodelasColinas 89.3% 1.00 SanPedrodelasColinas 0 0.0% 0 0.0%Torreon 100.0% 4.10 Torreon 0 0.0% 0 0.0%
NuevoLeon 90.0% 5.04 NuevoLeon 1 4.2% 0 0.0%Apodaca 86.8% 5.79 Apodaca 0 0.0% 0 0.0%Monterrey 91.2% 4.77 Monterrey 1 4.2% 0 0.0%
Tamaulipas 88.6% 4.54 Tamaulipas 0 0.0% 0 0.0%Reynosa 88.6% 4.54 Reynosa 0 0.0% 0 0.0%
Durango 100.0% 3.89 Durango 0 0.0% 0 0.0%Durango 100.0% 4.04 Durango 0 0.0% 0 0.0%GomezPalacio 100.0% 3.05 GomezPalacio 0 0.0% 0 0.0%
Bajio 87.2% 4.93 Bajio 4 16.7% 4 100.0%SanLuisPotosi 87.4% 4.80 SanLuisPotosi 0 0.0% 0 0.0%SanLuisPotosi 87.4% 4.80 SanLuisPotosi 0 0.0% 0 0.0%
Jalisco 100.0% 5.49 Jalisco 1 4.2% 1 100.0%Guadalajara 100.0% 5.49 Guadalajara 1 4.2% 1 100.0%
Aguascalientes 100.0% 4.55 Aguascalientes 0 0.0% 0 0.0%Aguascalientes 100.0% 4.55 Aguascalientes 0 0.0% 0 0.0%
Guanajuato 95.9% 4.91 Guanajuato 0 0.0% 0 0.0%Celaya 100.0% 5.07 Celaya 0 0.0% 0 0.0%Irapuato 86.5% 5.07 Irapuato 0 0.0% 0 0.0%Silao 100.0% 4.78 Silao 0 0.0% 0 0.0%
Queretaro 70.4% 4.87 Queretaro 3 12.5% 3 100.0%Queretaro 70.4% 4.87 Queretaro 3 12.5% 3 100.0%
Central 94.2% 5.14 Central 2 8.3% 1 50.0%EstadodeMexico 93.2% 5.37 EstadodeMexico 1 4.2% 0 0.0%CuautitlanIzcalli 99.4% 5.37 CuautitlanIzcalli 0 0.0% 0 0.0%Toluca 88.8% 5.39 Toluca 1 4.2% 0 0.0%
DistritoFederal 100.0% 8.80 DistritoFederal 1 4.2% 1 100.0%Azcapotzalco 100.0% 8.80 Azcapotzalco 1 4.2% 1 100.0%
Puebla 100.0% 3.07 Puebla 0 0.0% 0 0.0%Puebla 100.0% 3.07 Puebla 0 0.0% 0 0.0%
Tabasco 100.0% 3.82 Tabasco 0 0.0% 0 0.0%Villahermosa 100.0% 3.82 Villahermosa 0 0.0% 0 0.0%
Total 93.2% 4.88 Total 24 100.0% 20 83.3%Source:PGIMRealEstate-AssetManagement
Source:PGIMRealEstate-AssetManagement
*Overthenumberofmaturedleasesinthequarter
7
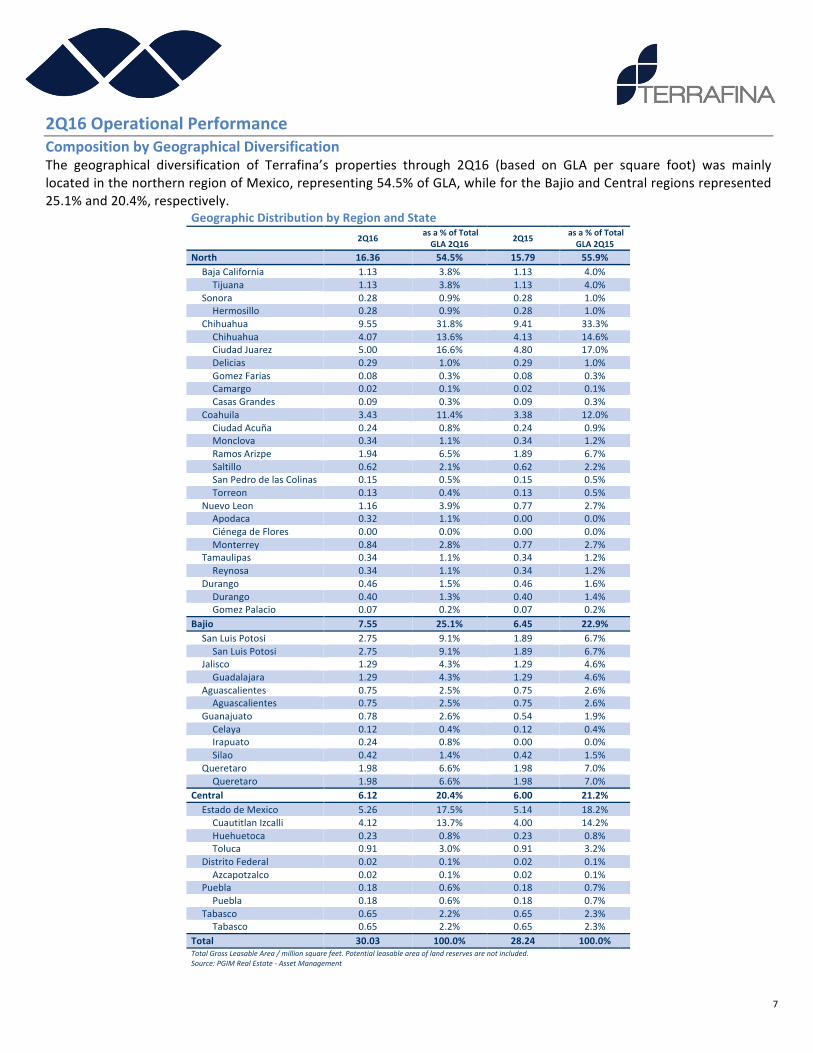
2Q16OperationalPerformanceCompositionbyGeographicalDiversificationThe geographical diversification of Terrafina’s properties through 2Q16 (based on GLA per square foot) was mainlylocatedinthenorthernregionofMexico,representing54.5%ofGLA,whilefortheBajioandCentralregionsrepresented25.1%and20.4%,respectively.
GeographicDistributionbyRegionandState
2Q16 asa%ofTotal
GLA2Q16 2Q15 asa%ofTotalGLA2Q15
North 16.36 54.5% 15.79 55.9%BajaCalifornia 1.13 3.8% 1.13 4.0%Tijuana 1.13 3.8% 1.13 4.0%
Sonora 0.28 0.9% 0.28 1.0%Hermosillo 0.28 0.9% 0.28 1.0%
Chihuahua 9.55 31.8% 9.41 33.3%Chihuahua 4.07 13.6% 4.13 14.6%CiudadJuarez 5.00 16.6% 4.80 17.0%Delicias 0.29 1.0% 0.29 1.0%GomezFarias 0.08 0.3% 0.08 0.3%Camargo 0.02 0.1% 0.02 0.1%CasasGrandes 0.09 0.3% 0.09 0.3%
Coahuila 3.43 11.4% 3.38 12.0%CiudadAcuña 0.24 0.8% 0.24 0.9%Monclova 0.34 1.1% 0.34 1.2%RamosArizpe 1.94 6.5% 1.89 6.7%Saltillo 0.62 2.1% 0.62 2.2%SanPedrodelasColinas 0.15 0.5% 0.15 0.5%Torreon 0.13 0.4% 0.13 0.5%
NuevoLeon 1.16 3.9% 0.77 2.7%Apodaca 0.32 1.1% 0.00 0.0%CiénegadeFlores 0.00 0.0% 0.00 0.0%Monterrey 0.84 2.8% 0.77 2.7%
Tamaulipas 0.34 1.1% 0.34 1.2%Reynosa 0.34 1.1% 0.34 1.2%
Durango 0.46 1.5% 0.46 1.6%Durango 0.40 1.3% 0.40 1.4%GomezPalacio 0.07 0.2% 0.07 0.2%
Bajio 7.55 25.1% 6.45 22.9%SanLuisPotosi 2.75 9.1% 1.89 6.7%SanLuisPotosi 2.75 9.1% 1.89 6.7%
Jalisco 1.29 4.3% 1.29 4.6%Guadalajara 1.29 4.3% 1.29 4.6%
Aguascalientes 0.75 2.5% 0.75 2.6%Aguascalientes 0.75 2.5% 0.75 2.6%
Guanajuato 0.78 2.6% 0.54 1.9%Celaya 0.12 0.4% 0.12 0.4%Irapuato 0.24 0.8% 0.00 0.0%Silao 0.42 1.4% 0.42 1.5%
Queretaro 1.98 6.6% 1.98 7.0%Queretaro 1.98 6.6% 1.98 7.0%
Central 6.12 20.4% 6.00 21.2%EstadodeMexico 5.26 17.5% 5.14 18.2%CuautitlanIzcalli 4.12 13.7% 4.00 14.2%Huehuetoca 0.23 0.8% 0.23 0.8%Toluca 0.91 3.0% 0.91 3.2%
DistritoFederal 0.02 0.1% 0.02 0.1%Azcapotzalco 0.02 0.1% 0.02 0.1%
Puebla 0.18 0.6% 0.18 0.7%Puebla 0.18 0.6% 0.18 0.7%
Tabasco 0.65 2.2% 0.65 2.3%Tabasco 0.65 2.2% 0.65 2.3%
Total 30.03 100.0% 28.24 100.0%TotalGrossLeasableArea/millionsquarefeet.Potentialleasableareaoflandreservesarenotincluded.
Source:PGIMRealEstate-AssetManagement

8
CompositionbyAssetTypeAttheendof2Q16,30.3%ofTerrafina’stotalportfolioconsistedofdistributionandlogisticspropertiesand69.7%weremanufacturingproperties.
CompositionbySectorAsofJune30,2016,tenantdiversificationbyindustrialsectorwasasfollows:
IndustrialSectorDiversification
2Q16 2Q15 Var.
Automotive 30.8% 28.0% 276bps
Industrialproperties 19.1% 20.7% -165bps
Consumergoods 18.4% 16.4% 201bps
LogisticsandTrade 10.0% 11.3% -130bps
Aviation 9.4% 10.2% -73bps
Non-durableconsumergoods 6.0% 7.3% -136bps
Electronics 6.4% 6.1% 27bps
Total 100.0% 100.0% Source:PGIMRealEstate-AssetManagement
30.8%
19.1%18.4%
10.0%
9.4%6.0%6.4%
DiversificaeonbySectorasof2Q16(asa%ofleasedGLA)
AutomolveIndustrialproperlesConsumergoodsLogislcsandTradeAvialonNon-durableconsumergoodsElectronics
CompositionbyAssetType
2Q16 2Q15 Var.
Distribution 30.3% 29.0% 128bps
Manufacturing 69.7% 71.0% -128bpsSource:PGIMRealEstate-PortfolioManagement
30.3%
69.7%
ComposieonbyAssetTypeasof2Q16
(asa%oftotalGLA)
Distribulon Manufacturing
9
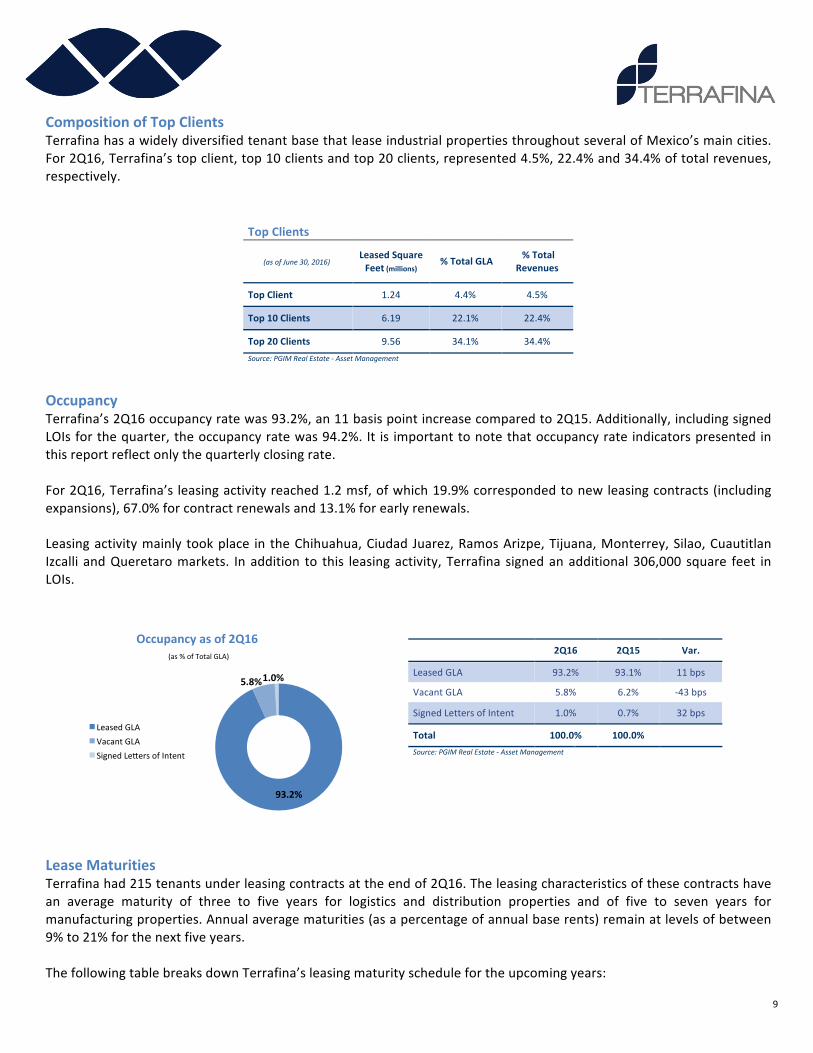
CompositionofTopClientsTerrafinahasawidelydiversifiedtenantbasethatleaseindustrialpropertiesthroughoutseveralofMexico’smaincities.For2Q16,Terrafina’stopclient,top10clientsandtop20clients,represented4.5%,22.4%and34.4%oftotalrevenues,respectively.
TopClients
(asofJune30,2016) LeasedSquareFeet(millions)
%TotalGLA %TotalRevenues
TopClient 1.24 4.4% 4.5%
Top10Clients 6.19 22.1% 22.4%
Top20Clients 9.56 34.1% 34.4%Source:PGIMRealEstate-AssetManagement
OccupancyTerrafina’s2Q16occupancyratewas93.2%,an11basispointincreasecomparedto2Q15.Additionally,includingsignedLOIsforthequarter,theoccupancyratewas94.2%.It is importanttonotethatoccupancyrateindicatorspresentedinthisreportreflectonlythequarterlyclosingrate.For2Q16,Terrafina’s leasingactivityreached1.2msf,ofwhich19.9%correspondedtonewleasingcontracts(includingexpansions),67.0%forcontractrenewalsand13.1%forearlyrenewals.
Leasingactivitymainly tookplace in theChihuahua,CiudadJuarez,RamosArizpe,Tijuana,Monterrey,Silao,CuautitlanIzcalli andQueretaromarkets. Inaddition to this leasingactivity, Terrafina signedanadditional306,000 square feet inLOIs.
LeaseMaturitiesTerrafinahad215tenantsunderleasingcontractsattheendof2Q16.Theleasingcharacteristicsofthesecontractshavean average maturity of three to five years for logistics and distribution properties and of five to seven years formanufacturingproperties.Annualaveragematurities(asapercentageofannualbaserents)remainatlevelsofbetween9%to21%forthenextfiveyears.ThefollowingtablebreaksdownTerrafina’sleasingmaturityschedulefortheupcomingyears:
93.2%
5.8%1.0%
Occupancyasof2Q16(as%ofTotalGLA)
LeasedGLAVacantGLASignedLeoersofIntent
2Q16 2Q15 Var.
LeasedGLA 93.2% 93.1% 11bps
VacantGLA 5.8% 6.2% -43bps
SignedLettersofIntent 1.0% 0.7% 32bps
Total 100.0% 100.0%
Source:PGIMRealEstate-AssetManagement

10
Annual
BaseRent(millionsofdollars)
%ofTotal OccupiedSq.Ft(millions) %ofTotal
2016 8.8 6.5% 2.01 7.2%2017 18.4 13.5% 3.85 13.8%2018 18.7 13.7% 3.81 13.6%2019 27.1 19.8% 5.67 20.2%2020 28.2 20.6% 5.59 20.0%Thereafter 35.4 25.9% 7.06 25.2%Source:PGIMRealEstate–AssetManagement
CapitalDeploymentNewDevelopmentsIn2Q16,Terrafina signed260,000square feet innewcontracts.Thesenewdevelopmentsweredistributedas follows:38.8%inthenorthernregionand61.2%intheBajioregion.These new developments will contribute US$1.3 million to 2017 NOI, with a 9.4% estimated development yield,consideringthetotalexpectedinvestmentforUS$13.5million
((1)NetOperatingIncomeforthenexttwelvemonths.(2)ProformaNOIdividedbythetotalexpectedinvestment.Source:PGIMRealEstate–AssetManagement
January-June2016
SquareFeet(millions)TotalExpectedInvestment
(millionsofpesos)
TotalExpectedInvestment3
(millionsofdollars)
CostperSquareFeet
(dollars)
%PayingRentby
EndofthePeriod
North 0.10 88.5 4.9 48.50 0.0%
Bajio 0.16 156.1 8.6 54.31 0.0%
Central 0.00 0.0 0.0 0.00 0.0%
Total 0.26 244.6 13.5 102.82 0.0%
ProformaNOI1(millionsofdollars) 1.3
EstimatedStabilizedYield2 9.4%
ProjectsUnderDevelopment 2Q16 2Q15
DevelopedProperties 99.3% 97.8%
PropertiesUnderDevelopment 0.7% 2.2%
Total 100.0% 100.0%
Source:PGIMRealEstate-PortfolioManagement
11
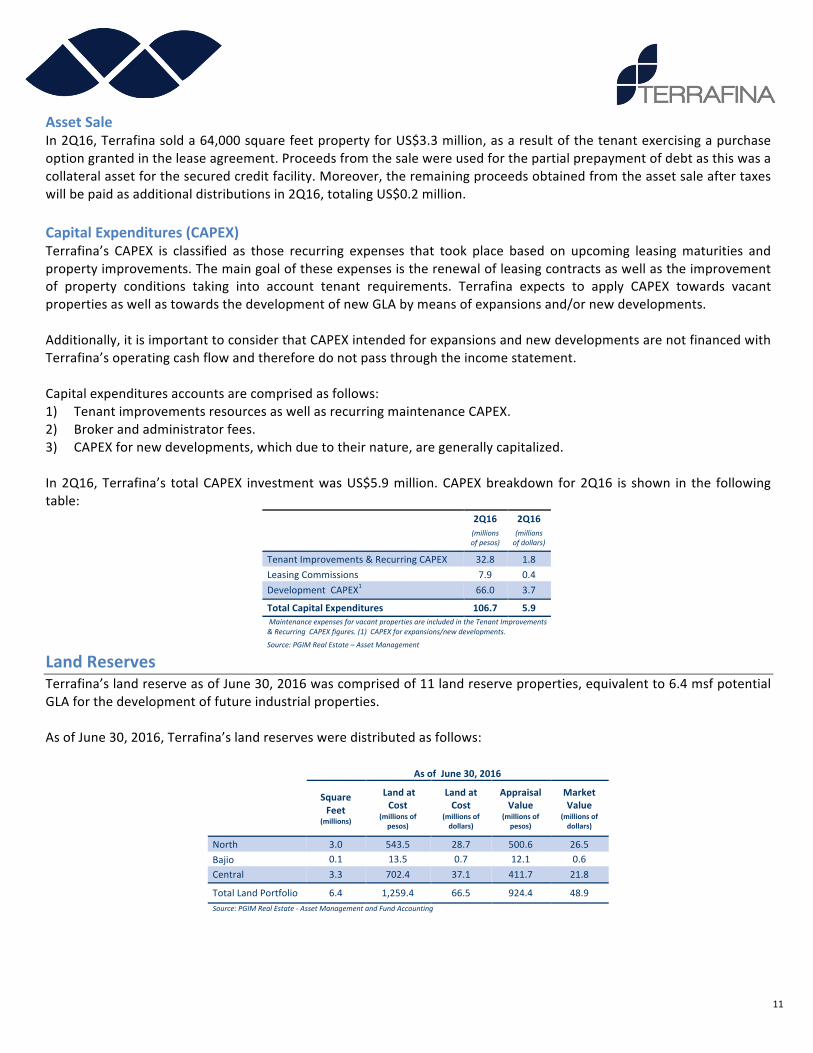
AssetSaleIn2Q16,Terrafinasolda64,000squarefeetpropertyforUS$3.3million,asaresultofthetenantexercisingapurchaseoptiongrantedintheleaseagreement.Proceedsfromthesalewereusedforthepartialprepaymentofdebtasthiswasacollateralassetforthesecuredcreditfacility.Moreover,theremainingproceedsobtainedfromtheassetsaleaftertaxeswillbepaidasadditionaldistributionsin2Q16,totalingUS$0.2million.CapitalExpenditures(CAPEX)Terrafina’s CAPEX is classified as those recurring expenses that took place based on upcoming leasingmaturities andpropertyimprovements.Themaingoaloftheseexpensesistherenewalofleasingcontractsaswellastheimprovementof property conditions taking into account tenant requirements. Terrafina expects to apply CAPEX towards vacantpropertiesaswellastowardsthedevelopmentofnewGLAbymeansofexpansionsand/ornewdevelopments.
Additionally,itisimportanttoconsiderthatCAPEXintendedforexpansionsandnewdevelopmentsarenotfinancedwithTerrafina’soperatingcashflowandthereforedonotpassthroughtheincomestatement.
Capitalexpendituresaccountsarecomprisedasfollows:1) TenantimprovementsresourcesaswellasrecurringmaintenanceCAPEX.2) Brokerandadministratorfees.3) CAPEXfornewdevelopments,whichduetotheirnature,aregenerallycapitalized.In2Q16,Terrafina’s totalCAPEX investmentwasUS$5.9million.CAPEXbreakdown for2Q16 is shown in the followingtable:
2Q16 2Q16
(millionsofpesos)
(millionsofdollars)
TenantImprovements&RecurringCAPEX 32.8 1.8LeasingCommissions 7.9 0.4DevelopmentCAPEX1 66.0 3.7
TotalCapitalExpenditures 106.7 5.9MaintenanceexpensesforvacantpropertiesareincludedintheTenantImprovements&RecurringCAPEXfigures.(1)CAPEXforexpansions/newdevelopments.
Source:PGIMRealEstate–AssetManagement
LandReservesTerrafina’slandreserveasofJune30,2016wascomprisedof11landreserveproperties,equivalentto6.4msfpotentialGLAforthedevelopmentoffutureindustrialproperties.AsofJune30,2016,Terrafina’slandreservesweredistributedasfollows:
AsofJune30,2016
SquareFeet
(millions)
LandatCost
(millionsofpesos)
LandatCost
(millionsofdollars)
AppraisalValue
(millionsofpesos)
MarketValue
(millionsofdollars)
North 3.0 543.5 28.7 500.6 26.5Bajio 0.1 13.5 0.7 12.1 0.6Central 3.3 702.4 37.1 411.7 21.8
TotalLandPortfolio 6.4 1,259.4 66.5 924.4 48.9Source:PGIMRealEstate-AssetManagementandFundAccounting

12
2Q16FinancialPerformanceFinancialResultsandCalculationsTerrafina’s2Q16financialresultsarepresentedinMexicanpesosandU.S.dollars.Figuresontheincomestatementforeach period were converted to dollars using the average exchange rate for 2Q16, while for the balance sheet, theexchangerateatthecloseofJune30,2016wasapplied.Terrafina has in place best accounting practices for measuring the FIBRA’s (REIT) performance results by providingrelevant metrics to the financial community. Throughout the following financial performance section, additionalcalculations are available. It is important to note that these metrics must not be considered individually to evaluateTerrafina’sresults.ItisrecommendedtousethemincombinationwithotherInternationalFinancialReportingStandardsmetricstomeasuretheCompany’sperformance.Terrafina presents in this earnings report additional metrics such as Net Operating Income (NOI), Earnings BeforeInterests, Taxes, Depreciation and Amortization (EBITDA), Funds from Operations (FFO), and Adjusted Funds fromOperations(AFFO).Eachbreakdowncalculationisavailableinthisdocument.
Inaddition,TerrafinarecommendsreviewingtheAppendicesasareferenceoftheintegrationofdifferentitemsof
Terrafina’sfinancialstatement.Thisinformationisavailableinthelastsectionofthisdocument.
Pastperformanceisnotaguaranteeorreliableindicatoroffutureresults.

13
RentalRevenuesIn2Q16,Terrafina’srentalrevenuesreachedUS$32.9million,a4.0%orUS$1.3millionincreasecomparedto2Q15.Rentalrevenuesdonotincludeaccruedrevenues,astheseareanon-cashitem.OtherOperatingIncomeIn2Q16,otheroperatingincometotaledUS$3.2million,a110.4%orUS$1.7millionincreasecomparedto2Q15.Other operating income primarily stems from leasing contract deposits and refunds from triple-net leases. ExpensesreimbursabletoTerrafinaprimarilyincludeelectricity,propertytaxes,insurancecostsandmaintenance.
NetrevenuesreachedUS$36.6millionin2Q16,anincreaseofUS$3.4million,or10.2%comparedto2Q15.
2Q16 2Q15 Var.% 2Q16 2Q15 Var.%
(millionsofpesos) 0 (millionsofdollars) 0
RentalRevenue 594.9 484.8 22.7% 32.9 31.7 4.0%
AccruedIncome1 8.9 0.9 843.4% 0.5 0.1 727.5%
OtherOperatingRevenues 57.7 22.0 162.5% 3.2 1.5 110.4%
ReimbursableExpensesasRevenues2 35.6 23.8 49.3% 2.0 1.6 27.7%
ReimbursableTenantImprovements 6.3 3.2 99.1% 0.3 0.2 62.8%
Othernon-cashincome 15.8 -5.1 -411.7% 0.8 -0.3 -428.0%
NetRevenue 661.5 507.8 30.3% 36.6 33.2 10.2%(1)Straightlinerentadjustment;non-cashitem.(2)TriplenetleasesexpensesreimbursedtoTerrafinafromitstenants.
Source:PGIMRealEstate-FundAccounting
Foradditionalinformationregardingtherevenuebreakdownusedtocalculateadditionalmetricspresentedinthisearningsreport,pleaserefertoAppendix1inthelastsectionofthisdocument.
RealEstateExpensesIn2Q16,realestateexpensestotaledUS$5.8million,adecreaseofUS$2.3million,or28.8%comparedto2Q15.Theseexpenseswereprimarilyduetorepairsandmaintenance,utilitycosts,commissionsandtaxandinsuranceexpenses.It is important to differentiate between expenses that are directly related to the operation and those that are forindustrialportfoliomaintenance;thoseusedintheNOIcalculationaretheindustrialportfoliomaintenancecosts.
Theremainderoftheaccountsincludedinrealestateexpensesareconsiderednon-recurringexpensesandareusedtocalculateEBITDAandAFFO.
Foradditionalinformationregardingtherealestateexpensesbreakdown,pleaserefertoAppendix2inthelastsectionofthisdocument.
14
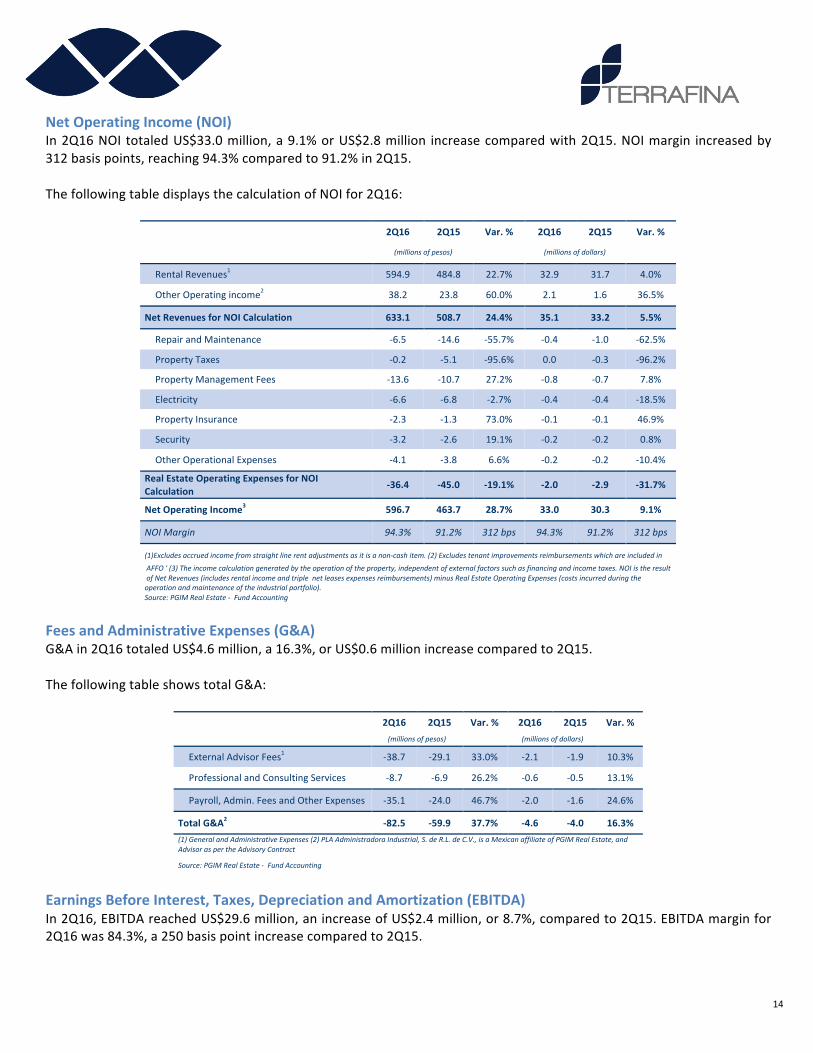
NetOperatingIncome(NOI)In2Q16NOItotaledUS$33.0million,a9.1%orUS$2.8million increasecomparedwith2Q15.NOImargin increasedby312basispoints,reaching94.3%comparedto91.2%in2Q15.ThefollowingtabledisplaysthecalculationofNOIfor2Q16:
2Q16 2Q15 Var.% 2Q16 2Q15 Var.%
(millionsofpesos) 0 (millionsofdollars) 0
RentalRevenues1 594.9 484.8 22.7% 32.9 31.7 4.0%
OtherOperatingincome2 38.2 23.8 60.0% 2.1 1.6 36.5%
NetRevenuesforNOICalculation 633.1 508.7 24.4% 35.1 33.2 5.5%
RepairandMaintenance -6.5 -14.6 -55.7% -0.4 -1.0 -62.5%
PropertyTaxes -0.2 -5.1 -95.6% 0.0 -0.3 -96.2%
PropertyManagementFees -13.6 -10.7 27.2% -0.8 -0.7 7.8%
Electricity -6.6 -6.8 -2.7% -0.4 -0.4 -18.5%
PropertyInsurance -2.3 -1.3 73.0% -0.1 -0.1 46.9%
Security -3.2 -2.6 19.1% -0.2 -0.2 0.8%
OtherOperationalExpenses -4.1 -3.8 6.6% -0.2 -0.2 -10.4%
RealEstateOperatingExpensesforNOICalculation
-36.4 -45.0 -19.1% -2.0 -2.9 -31.7%
NetOperatingIncome3 596.7 463.7 28.7% 33.0 30.3 9.1%
NOIMargin 94.3% 91.2% 312bps 94.3% 91.2% 312bps
(1)Excludesaccruedincomefromstraightlinerentadjustmentsasitisanon-cashitem.(2)Excludestenantimprovementsreimbursementswhichareincludedin
AFFO'(3)Theincomecalculationgeneratedbytheoperationoftheproperty,independentofexternalfactorssuchasfinancingandincometaxes.NOIistheresultofNetRevenues(includesrentalincomeandtriplenetleasesexpensesreimbursements)minusRealEstateOperatingExpenses(costsincurredduringtheoperationandmaintenanceoftheindustrialportfolio).Source:PGIMRealEstate-FundAccounting
FeesandAdministrativeExpenses(G&A)G&Ain2Q16totaledUS$4.6million,a16.3%,orUS$0.6millionincreasecomparedto2Q15.
ThefollowingtableshowstotalG&A:
2Q16 2Q15 Var.% 2Q16 2Q15 Var.%
(millionsofpesos) 0 (millionsofdollars) 0
ExternalAdvisorFees1 -38.7 -29.1 33.0% -2.1 -1.9 10.3%
ProfessionalandConsultingServices -8.7 -6.9 26.2% -0.6 -0.5 13.1%
Payroll,Admin.FeesandOtherExpenses -35.1 -24.0 46.7% -2.0 -1.6 24.6%
TotalG&A2 -82.5 -59.9 37.7% -4.6 -4.0 16.3%(1)GeneralandAdministrativeExpenses(2)PLAAdministradoraIndustrial,S.deR.L.deC.V.,isaMexicanaffiliateofPGIMRealEstate,andAdvisoraspertheAdvisoryContract
Source:PGIMRealEstate-FundAccounting
EarningsBeforeInterest,Taxes,DepreciationandAmortization(EBITDA)In2Q16,EBITDAreachedUS$29.6million,anincreaseofUS$2.4million,or8.7%,comparedto2Q15.EBITDAmarginfor2Q16was84.3%,a250basispointincreasecomparedto2Q15.

15
ThefollowingshowstheEBITDAcalculationfor2Q16:
2Q16 2Q15 Var.% 2Q16 2Q15 Var.%
(millionsofpesos) 0 (millionsofdollars) 0
RentalRevenues1 594.9 484.8 22.7% 32.9 31.7 4.0%
OtherOperatingincome2 38.2 23.8 60.0% 2.1 1.6 36.5%
RealEstateExpensesforEBITDACalculation -39.4 -47.3 -16.8% -2.2 -3.1 -29.7%
RealEstateOperatingExpensesforNOICalculation -36.4 -45.0 -19.1% -2.0 -2.9 -31.7%
Advertising -0.4 -0.8 -53.2% 0.0 -0.1 -59.8%
Admin.PropertyInsuranceExpenses -0.9 -0.8 23.3% -0.1 0.0 4.4%
OtherAdmin.RealEstateExpenses -1.6 -0.7 136.3% -0.1 0.0 100.5%
FeesandAdmin.Expenses -60.5 -45.4 33.3% -3.3 -3.0 12.7%
ExternalAdvisorFees -38.7 -29.1 33.0% -2.1 -1.9 10.3%
Legal,Admin.andOtherProfessionalFees -12.0 -10.6 13.0% -0.7 -0.7 0.9%
TrusteeFees -1.4 -1.0 34.3% -0.1 -0.1 13.9%
Payroll -6.7 -3.3 100.5% -0.4 -0.2 71.5%
OtherExpenses -1.8 -1.4 29.3% -0.1 -0.1 12.7%
EBITDA3 533.2 416.0 28.2% 29.6 27.2 8.7%
EBITDAMargin 84.3% 81.8% 250bps 84.3% 81.8% 250bps(1)Excludesaccruedincomefromstraightlinerentadjustmentsasitisanon-cashitem.(2)ExcludestenantimprovementsreimbursementswhichisincludedinAFFOcalculation.(3)Earningsbeforeinterest,taxes,depreciationandamortizationSource:PGIMRealEstate-FundAccounting
ForadditionalinformationregardingthecommissionsandadministrativeexpensesbreakdownusedforthecalculationofEBITDAandAFFO,pleaserefertoAppendix4locatedinthelastsectionofthisdocument.
FinancingCostsIn2Q16,financingcoststotaledUS$9.6million,anincreaseof73.4%orUS$4.1millioncomparedto2Q15.
2Q16 2Q15 Var.% 2Q16 2Q15 Var.%
(millionsofpesos) 0 (millionsofdollars) 0
InterestPaid -160.4 -108.6 47.7% -8.9 -7.1 25.2%
BorrowingExpenses
-14.1 -0.2 8336.6% -0.8 0.0 6908.9%
Recurring -1.1 -0.2 544.4% -0.1 0.0 460.5%
NonRecurring -13.1 0.0 - -0.7 0.0 -
InterestIncome 1.2 24.1 -95.2% 0.1 1.6 -96.0%
Total -173.4 -84.6 104.8% -9.6 -5.5 73.4%Source:PGIMRealEstate-FundAccounting

16
FundsfromOperations(FFO)/AdjustedFundsfromOperations(AFFO)In2Q16,Terrafina’sFFOdecreasedbyUS$1.0million,or4.5%comparedto2Q15,reachingUS$20.7million.FFOmarginwas59.0%,a619basispointdecreasecomparedto2Q15.Additionally,TerrafinareportedanAFFOofUS$19.0million,adecreaseofUS$0.6million,or3.0%comparedto2Q15.AFFOmarginwas53.9%,adecreaseof469basispointsversus2Q15.
2Q16 2Q15 Var.% 2Q16 2Q15 Var.%
(millionsofpesos) 0 (millionsofdollars) 0
EBITDA 533.2 416.0 28.2% 29.6 27.2 8.7%FinanceCost1 -160.3 -84.6 89.4% -8.9 -5.5 60.7%FundsfromOperations(FFO) 372.9 331.3 12.5% 20.7 21.7 -4.5%FFOMargin 59.0% 65.2% -619bps 59.0% 65.2% -619bpsTenantImprovements -20.1 -17.4 15.6% -1.1 -1.1 -0.5%LeasingCommissions -7.9 -9.2 -14.6% -0.4 -0.6 -26.5%OtherNonRecurringExpenses2 -5.2 -3.8 36.8% -0.3 -0.3 -10.6%NetProfitfromAssetSale 3.6 0.0 - 0.2 0.0 -AdjustedFundsfromOperations(AFFO) 343.3 300.9 14.1% 19.0 19.6 -3.0%AFFOMargin 53.9% 58.6% -469bps 53.9% 58.6% -469bps(1)NetOperationalInterestExpensescomprisedbyinterestpaid,recurringborrowingexpensesandinterestincome.(2)Relatedexpensestoacquisitions,legalandother.Source:PGIMRealEstate-FundAccounting
ComprehensiveIncomeComprehensiveIncomefor2Q16reachedUS$97.6million,comparedtoUS$25.3millionin2Q15.
ThefollowingtablepresentsthecalculationofComprehensiveIncomefor2Q16:
2Q16 2Q15 Var.% 2Q16 2Q15 Var.%
(millionsofpesos) 0 (millionsofdollars) 0
NetRevenues 661.5 507.8 30.3% 36.6 33.2 10.2%
RealEstateExpenses -104.3 -124.3 -16.1% -5.8 -8.1 -28.8%
FeesandOtherExpenses -82.5 -59.9 37.7% -4.5 -4.0 14.4%
Gain(Loss)fromSalesofRealEstateProperties 9.4 0.0 - 0.5 0.0 -
NetIncome(Loss)fromFairValueAdjustmentonInvestmentProperties -24.9 -78.6 - -1.3 -5.1 -NetIncome(Loss)fromFairValueAdjustmentonDerivativeFinancialInstruments 0.0 0.0 - 0.0 0.0 -
NetIncome(Loss)fromFairValueAdjustmentonBorrowings -324.1 -215.8 50.2% -17.4 -14.1 23.4%
NetIncome(Loss)fromFairValueAdjustmentonLoansReceivable 1.7 - - 0.1 - -
NetIncome(Loss)fromFairValueAdjustmentonBankInvestment 0.0 7.4 - 0.0 0.5 -
ForeignExchangeGain(loss) -50.1 -69.3 -27.6% -2.6 -4.5 -42.0%
OperatingProfit 86.5 -32.6 -365.0% 5.5 -2.1 -361.2%
FinancialIncome 1.2 24.1 -95.2% 0.1 1.6 -96.0%
FinancialExpenses -174.5 -108.7 60.5% -9.6 -7.1 35.8%
NetFinancialCost -173.4 -84.6 104.8% -9.6 -5.5 73.4%
ShareofProfitfromEquityAccountedInvestments 2.6 - - 0.1 - -
NetProfit(Loss) -84.3 -117.3 -28.1% -3.9 -7.6 -48.8%
ItemsReclassifiedafterNetProfit(Loss)-CurrencyTranslationAdjustments 1,833.8 503.9 263.9% 101.5 32.9 208.5%
ComprehensiveIncome 1,749.5 386.6 352.5% 97.6 25.3 286.4%Source:PGIMRealEstate-FundAccounting

17
DistributionsperCBFIsIn2Q16,TerrafinadistributedUS$19.0million,orUS$0.0313perCBFI.Terrafina’s2Q16,1Q16,2Q15distributionsarepresentedinthefollowingtable:
(millionsofpesosunlessotherwisestated) 2Q16 1Q16 2Q15 Var.4
TotalOutstandingCBFIs1(millionsofCBFIs) 607.5 607.5 607.2 0.1%
CBFIPrice2 30.84 29.39 30.53 1.0%
Distributions 343.3 300.8 300.9 14.1%
DistributionsPerCBFI 0.5650 0.4951 0.4956 14.0%
FXRateUSD/MXN(averageclosingperiod) 18.07 18.07 15.32 18.0%
Distributions(milliondollars) 19.0 16.6 19.6 -3.0%
DistributionsPerCBFI(dollars) 0.0313 0.0273 0.0323 -3.0%
AnnualizedDistributionYield3 7.3% 6.7% 6.5% 83bps(1)In1Q16,334,187CBFIswereaddedaspartofTerrafina´scompensationplan.(2)Averageclosingpricefortheperiod.(3)AnnualizeddistributionpersharedividedbytheaverageCBFIpriceofthequarter.Quarterlydistributionyieldcalculationhasbeenannualized.(4)2Q16comparedto2Q15.
Source:PGIMRealEstate-FundAccounting
TotalDebtAs of June 30, 2016, Terrafina’s total debt reachedUS$720.0million. The average cost of Terrafina’s long-termdebt,whichisU.S.dollar-denominated,was4.94%.Additionally,itisimportanttonotethatTerrafina’svariableinterestrateloansarehedgedwithinterestratecapsandfixedrateoptions.
(asofJune30,2016)
Currency millionsofpesos
millionsofdollars
InterestRate Terms Maturity Extension
Option
LongTermDebt
Citibank1 Dollars 0.0 0.0 Libor+2.40% InterestOnly Aug2018 Aug2019
BRE2,3 Dollars 5,113.4 270.4 Libor+3.75% Interest+Principal Sep2018 Sep2020
MetLife4 Dollars 419.6 22.2 5.09% Interest+Principal Nov2016 -
SeniorNotes Dollars 8,083.1 427.4 5.3% InterestOnly Nov2022 -
TotalDebt 13,616.1 720.0
NetCash 4,661.8 246.5
NetDebt 8,954.4 473.5 (1)Unsecuredsyndicatedloanfacilitywithsevenbanks.(2)Securedsyndicatedloanfacilitywithfourbanks.(3)One-yearinterestonlygraceperiod.4)DebtassumedfromportfolioacquisitionclosedinNovember2015.Source:PGIMRealEstate-FundAccountingandCapitalMarkets
37.6%
62.4%
InterestRateBreakdown(asofJune30,2016)
VariableRate FixedRate
18
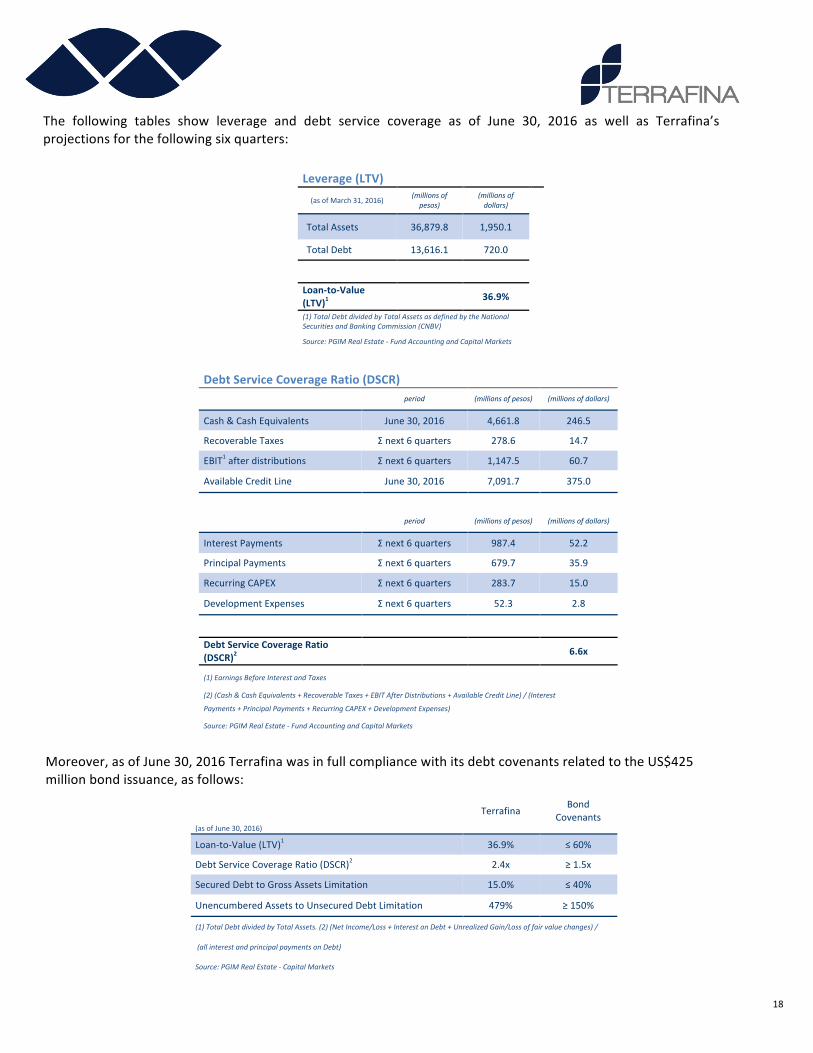
The following tables show leverage and debt service coverage as of June 30, 2016 as well as Terrafina’sprojectionsforthefollowingsixquarters:
Leverage(LTV) (asofMarch31,2016)
(millionsofpesos)
(millionsofdollars)
TotalAssets 36,879.8 1,950.1
TotalDebt 13,616.1 720.0
Loan-to-Value(LTV)1 36.9%
(1)TotalDebtdividedbyTotalAssetsasdefinedbytheNationalSecuritiesandBankingCommission(CNBV)Source:PGIMRealEstate-FundAccountingandCapitalMarkets
DebtServiceCoverageRatio(DSCR)
period (millionsofpesos) (millionsofdollars)
Cash&CashEquivalents June30,2016 4,661.8 246.5
RecoverableTaxes Σnext6quarters 278.6 14.7
EBIT1afterdistributions Σnext6quarters 1,147.5 60.7
AvailableCreditLine June30,2016 7,091.7 375.0
period (millionsofpesos) (millionsofdollars)
InterestPayments Σnext6quarters 987.4 52.2
PrincipalPayments Σnext6quarters 679.7 35.9
RecurringCAPEX Σnext6quarters 283.7 15.0
DevelopmentExpenses Σnext6quarters 52.3 2.8
DebtServiceCoverageRatio
(DSCR)2 6.6x
(1)EarningsBeforeInterestandTaxes
(2)(Cash&CashEquivalents+RecoverableTaxes+EBITAfterDistributions+AvailableCreditLine)/(Interest
Payments+PrincipalPayments+RecurringCAPEX+DevelopmentExpenses)
Source:PGIMRealEstate-FundAccountingandCapitalMarkets
Moreover,asofJune30,2016TerrafinawasinfullcompliancewithitsdebtcovenantsrelatedtotheUS$425millionbondissuance,asfollows:
(asofJune30,2016)
TerrafinaBond
Covenants
Loan-to-Value(LTV)1 36.9% ≤60%
DebtServiceCoverageRatio(DSCR)2 2.4x ≥1.5x
SecuredDebttoGrossAssetsLimitation 15.0% ≤40%
UnencumberedAssetstoUnsecuredDebtLimitation 479% ≥150%
(1)TotalDebtdividedbyTotalAssets.(2)(NetIncome/Loss+InterestonDebt+UnrealizedGain/Lossoffairvaluechanges)/
(allinterestandprincipalpaymentsonDebt)
Source:PGIMRealEstate-CapitalMarkets

19
AnalystCoverageThefollowingisalistofbanksandinstitutionsthatregularlypublishresearchreportsonTerrafina:- Barclays- BBVABancomer- BofAML- BTGPactual- BX+- CitiBanamex- CreditSuisse- GBM- HSBC- Interacciones- Invex- ItaúBBA- JPMorgan- Monex- MorganStanley- NAUSecurities- Scotiabank- UBS- Vector

20
AboutTerrafinaTerrafina (BMV:TERRA13) is a Mexican real estate investment trust formed primarily to acquire, develop, lease andmanage industrial real estate properties in Mexico. Terrafina’s portfolio consists of attractive, strategically locatedwarehousesandotherlightmanufacturingpropertiesthroughouttheCentral,BajioandNorthernregionsofMexico.Itisinternallymanagedbyhighlyqualifiedindustryspecialists,andexternallyadvisedbyPGIMRealEstate.Terrafina owns 219 real estate properties, including 208 developed industrial facilities with a collective GLA ofapproximately30.0millionsquarefeetand11landreserveparcels,designedtopreservetheorganicgrowthcapabilityoftheportfolio.Terrafina’s objective is to provide attractive risk-adjusted returns for the holders of its certificates through stabledistributionsandcapitalappreciations.Terrafinaaimstoachievethisobjective throughasuccessfulperformanceof itsindustrialrealestateandcomplementaryproperties,strategicacquisitions,accesstoahighlevelofinstitutionalsupport,andtoitsmanagementandcorporategovernancestructure.Formoreinformation,pleasevisitwww.terrafina.mxPGIMRealEstatePGIMReal Estate is the real estate investment business of PGIM Inc., the global investmentmanagement business ofPrudentialFinancial, Inc. (NYSE:PRU). Redefining therealestate investing landscapesince1970,PGIMRealEstatehasprofessionals in 18 cities in theAmericas, EuropeandAsiaPacificwithdeep local knowledgeandexpertise, andgrossassets undermanagement of $65.4 billion ($48.3 billion net) as ofMarch 31, 2016. PGIMReal Estate’s tenured teamofferstoitsglobalclientbaseabroadrangeofrealestateinvestmentvehiclesthatspantherisk-returnspectrumacrosscore, core plus, value-add, debt, securities, and specialized investment strategies. For more information, visitwww.pgimrealestate.com.AboutPrudentialFinancial,Inc.PrudentialFinancial,Inc.(NYSE:PRU),afinancialservicesleaderwithmorethan$1trillionofassetsundermanagementasofMarch31,2016,hasoperationsintheUnitedStates,Asia,Europe,andLatinAmerica.Prudential’sdiverseandtalentedemployees are committed to helping individual and institutional customers grow and protect their wealth through avariety of products and services, including life insurance, annuities, retirement-related services, mutual funds andinvestment management. In the U.S., Prudential’s iconic Rock symbol has stood for strength, stability, expertise andinnovationformorethanacentury.Formoreinformation,pleasevisitwww.news.prudential.comForwardLookingStatementsThisdocumentmayincludeforward-lookingstatementsthatmayimplyrisksanduncertainties.Termssuchas"estimate","project", "plan", "believe", "expect", "anticipate", "intend", and other similar expressions could be construed asprevisionsorestimates.Terrafinawarnsreadersthatdeclarationsandestimatesmentionedinthisdocument,orrealizedbyTerrafina’smanagementimplyrisksanduncertaintiesthatcouldchangeinfunctionofvariousfactorsthatareoutofTerrafina’scontrol.FutureexpectationsreflectTerrafina’sjudgmentatthedateofthisdocument.Terrafinareservestherightorobligationtoupdatetheinformationcontainedinthisdocumentorderivedfromthisdocument.Pastorpresentperformanceisnotanindicatortoanticipatefutureperformance.

21
ConferenceCall
(BMV:TERRA13)Cordiallyinvitesyoutoparticipateinits
SecondQuarter2016Results
Friday,July22,201611:00a.m.EasternTime10:00a.m.CentralTime
PresentingforTerrafina:
AlbertoChretin,ChiefExecutiveOfficerAngelBernal,ChiefFinancialOfficer
***
Toaccessthecall,pleasedial:fromwithintheU.S.1-800-311-9404fromoutsidetheU.S.1-334-323-7224
ConferenceIDNumber:34974
AudioWebcastLink:https://www.webcaster4.com/Webcast/Page/1111/15701
ConferenceReplay
WillbeprovidedforyourcallDial1-877-919-4059or1-334-323-0140tolisten
Passcode:81881298

22
AppendixAppendix1–RevenuesTerrafina’srevenuesaremainlyclassifiedasrentalrevenuesandotheroperatingreimbursablerevenues.Additionally,thereareaccountingrevenuesthatmustberegisteredaccordingwithIFRS;howevertheseareconsiderednon-cashitemsandthereforeareexcludedinsomecalculations.ReimbursabletenantimprovementsareincludedinthetenantimprovementexpensesfortheAFFOcalculation.
Revenues
2Q16 2Q15 2Q16 2Q15
(millionsofpesos) (millionsofdollars)
NOIcalculation RentalRevenue 594.9 484.8 32.9 31.7
NonCash AccruedIncome1 8.9 0.9 0.5 0.1
OtherOperatingRevenues 57.7 22.0 3.2 1.5
NOIcalculation ReimbursableExpensesasRevenues2 35.6 23.8 2.0 1.6
AFFOcalculation ReimbursableTenantImprovements 6.3 3.2 0.3 0.2
NonCash Othernon-cashincome 15.8 -5.1 0.8 -0.3
NetRevenue 661.5 507.8 36.6 33.2
NOIcalculation ShareofProfitfromEquityAccountedInvestments 2.6 - 0.1 -
(1)Straightlinerentadjustment.(2)TriplenetleasesexpensesreimbursedtoTerrafinafromitstenants.
Source:PGIMRealEstate-FundAccounting

23
Appendix2–RealEstateExpensesReal estate expenses are comprised of recurring figures relatedwith the operation (used for theNetOperating Profitcalculation) as well as non-recurring figures used for metric calculations such as Earnings Before Interests, Taxes,DepreciationandAmortization(EBITDA),FundsfromOperations(FFO),AdjustedFundsfromOperations(AFFO).Thefollowingtablepresentstherealestateexpenses’breakdown,whichareusedforthecalculationofseveralmetrics.
2Q16 2Q15 2Q16 2Q15
(millionsofpesos) (millionsofdollars)
RepairandMaintenance -32.9 -35.2 -1.8 -2.3
NOIcalculation Recurring -6.5 -14.6 -0.4 -1.0
AFFOcalculation NonRecurring -26.5 -20.6 -1.5 -1.3
PropertyTaxes -19.7 -32.9 -1.1 -2.2
NOIcalculation Operating -0.2 -5.1 0.0 -0.3
NonCash NonOperating -19.5 -27.8 -1.1 -1.8
NOIcalculation PropertyManagementFees -13.6 -10.7 -0.8 -0.7
NOIcalculation Electricity -6.6 -6.8 -0.4 -0.4
AFFOcalculation BrokersFees -7.9 -9.2 -0.4 -0.6
PropertyInsurance -3.2 -2.1 -0.2 -0.1
NOIcalculation Operating -2.3 -1.3 -0.1 -0.1EBITDA
calculation Administrative -0.9 -0.8 -0.1 0.0
NOIcalculation Security -3.2 -2.6 -0.2 -0.2EBITDA
calculation Advertising -0.4 -0.8 0.0 -0.1
OtherExpenses -20.3 -4.5 -1.1 -0.3
NOIcalculation OperationalRelated -4.1 -3.8 -0.2 -0.2
NonCash NonOperationalRelated -14.6 0.0 -0.8 0.0EBITDA
calculation Administrative -1.6 -0.7 -0.1 -1.2
NonCash BadDebtExpense 3.5 -18.4 0.2 -0.1
NonCash TransactionExpense - -0.9 - -0.1
TotalRealEstateExpenses -104.3 -124.3 -5.8 -8.1
Source:PGIMRealEstate-FundAccounting

24
Appendix3–FeesandAdministrativeExpensesFeesandadministrativeexpenses include figuresused formetric calculations suchasEarningsbefore Interests, Taxes,DepreciationandAmortization(EBITDA),FundsfromOperations(FFO),AdjustedFundsfromOperations(AFFO).Terrafina’sfeesandadministrativeexpensesbreakdownisavailableinthefollowingtableandindicatesthefiguresusedforthecalculationofthesemetrics:
FeesandAdministrativeExpenses
2Q16 2Q15 2Q16 2Q15
(millionsofpesos) (millionsofdollars)
EBITDAcalculation ExternalAdvisorFees -38.7 -29.1 -2.1 -1.9
LegalFees -4.9 -2.6 -0.3 -0.2
EBITDAcalculation Recurring -1.4 -0.6 -0.1 0.0
AFFOcalculation NonRecurring -3.5 -1.9 -0.2 -0.2
OtherProfessionalFees -3.8 -3.3 -0.3 -0.2
EBITDAcalculation Recurring -2.1 -1.4 -0.2 -0.1
AFFOcalculation NonRecurring -1.7 -1.9 -0.1 -0.1
AdministrativeFees -25.3 -19.3 -1.4 -1.3
EBITDAcalculation Recurring -8.5 -8.5 -0.5 -0.6NonOperational
related NonRecurring -16.7 -10.7 -0.9 -0.7
EBITDAcalculation Payroll -6.7 -3.3 -0.4 -0.2
EBITDAcalculation TrusteeFees -1.4 -1.0 -0.1 -0.1
EBITDAcalculation OtherExpenses -1.8 -1.4 -0.1 -0.1
TotalFeesandAdmin.Expenses
-82.5 -59.9 -4.5 -4.0
Source:PGIMRealEstate-FundAccounting

25
Appendix4–ReconciliationReconciliationofNetProfit(Loss)toFFO,EBITDAandNOI
2Q16 2Q15 2Q16 2Q15
(millionsofpesos) (millionsofdollars)
ComprehensiveIncome(Loss) 1,749.5 386.6 96.8 25.2Add(deduct)CurrencyTranslationAdjustment:
CurrencyTranslationAdjustment -1,833.8 -503.9 -101.5 -32.9
Add(deduct)CostofFinancingAdjustment: NonRecurringBorrowingExpenses 13.1 0.0 0.7 0.0
Add(deduct)Non-CashAdjustment: ForeignExchangeAdjustments 50.1 69.3 2.8 4.5FairValueAdjustmentonBankInvestment 0.0 -7.4 0.0 -0.5FairValueAdjustmentonBorrowings 324.1 215.8 17.9 14.1FairValueAdjustmentonDerivativeFinancialInstruments 0.0 0.0 0.0 0.0FairValueAdjustmentonLoansReceivable -1.7 0.0 -0.1 0.0FairValueAdjustmentonInvestmentProperties 24.9 78.6 1.4 5.1Gain(Loss)fromSalesofRealEstateProperties -9.4 0.0 -0.5 0.0
Add(deduct)ExpensesAdjustment: NonRecurringRepairandMaintenance 26.5 20.6 1.5 1.3NonOperatingPropertyTaxes 19.5 27.8 1.1 1.8BrokersFees 7.9 9.2 0.4 0.6BadDebtExpense -3.5 18.4 -0.2 1.2OtherNonOperationalRelatedExpenses 14.6 0.0 0.8 0.0TransactionExpenses 0.0 0.9 0.0 0.1NonRecurringLegalFees 3.5 1.9 0.2 0.1NonRecurringOtherProfessionalFees 1.7 1.9 0.1 0.1
Add(deduct)RevenuesAdjustment: AccruedIncome -8.9 -0.9 -0.5 -0.1OtherNon-CashIncome -15.8 5.1 -0.9 0.3ReimbursableTenantImprovements -6.3 -3.2 -0.3 -0.2
Add(deduct)NonOperationalAdministrativeFees NonOperationalAdministrativeFees 16.7 10.7 0.9 0.7
FFO 372.9 331.4 20.7 21.7Add(deduct)CostofFinancingAdjustment: InterestPaid 160.4 108.6 8.9 7.1RecurringBorrowingExpenses 1.1 0.2 0.1 0.0InterestIncome -1.2 -24.1 -0.1 -1.6EBITDA 533.2 416.0 29.6 27.2
Add(deduct)ExpensesAdjustment: ExternalAdvisorFees 38.7 29.1 2.1 1.9RecurringLegalFees 1.4 0.6 0.0 0.0RecurringOtherProfessionalFees 2.1 1.4 0.1 0.1AdministrativeFees 8.5 8.5 0.5 0.6Payroll 6.7 3.3 0.4 0.2TrusteeFees 1.4 1.0 0.1 0.1OtherExpenses 1.8 1.4 0.1 0.1Advertising 0.4 0.8 0.0 0.1AdministrativePropertyinsurance 0.9 0.8 0.1 0.0OtherAdministrativeExpenses 1.6 0.7 0.1 0.0
NOI 596.7 463.7 33.0 30.3Add(deduct)ExpensesAdjustment: RecurringRepairandMaintenance 6.5 14.6 0.4 1.0OperatingPropertyTaxes 0.2 5.1 0.0 0.3PropertyManagementFees 13.6 10.7 0.8 0.7Electricity 6.6 6.8 0.4 0.4OperatingPropertyInsurance 2.3 1.3 0.1 0.1Security 3.2 2.6 0.2 0.2OtherOperationalExpenses 4.1 3.8 0.2 0.2
Add(deduct)RevenuesAdjustment: OtherNon-CashIncome 15.8 -5.1 0.9 -0.3AccruedIncome 8.9 0.9 0.5 0.1ReimbursableTenantImprovements 6.3 3.2 0.3 0.2ShareofProfitfromEquityAccountedInvestments -2.6 0.0 -0.1 0.0
NetRevenue 661.5 507.8 36.6 33.2
26
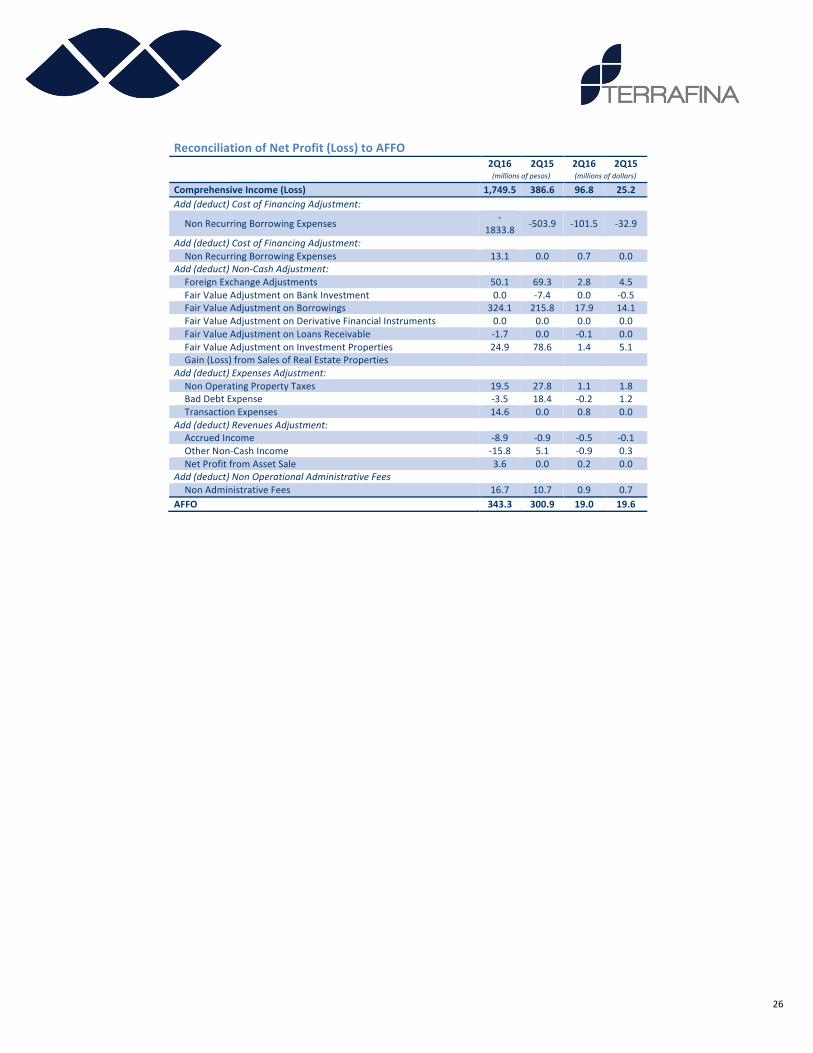
ReconciliationofNetProfit(Loss)toAFFO
2Q16 2Q15 2Q16 2Q15
(millionsofpesos) (millionsofdollars)
ComprehensiveIncome(Loss) 1,749.5 386.6 96.8 25.2Add(deduct)CostofFinancingAdjustment:
NonRecurringBorrowingExpenses -1833.8 -503.9 -101.5 -32.9
Add(deduct)CostofFinancingAdjustment: NonRecurringBorrowingExpenses 13.1 0.0 0.7 0.0
Add(deduct)Non-CashAdjustment: ForeignExchangeAdjustments 50.1 69.3 2.8 4.5FairValueAdjustmentonBankInvestment 0.0 -7.4 0.0 -0.5FairValueAdjustmentonBorrowings 324.1 215.8 17.9 14.1FairValueAdjustmentonDerivativeFinancialInstruments 0.0 0.0 0.0 0.0FairValueAdjustmentonLoansReceivable -1.7 0.0 -0.1 0.0FairValueAdjustmentonInvestmentProperties 24.9 78.6 1.4 5.1Gain(Loss)fromSalesofRealEstateProperties
Add(deduct)ExpensesAdjustment: NonOperatingPropertyTaxes 19.5 27.8 1.1 1.8BadDebtExpense -3.5 18.4 -0.2 1.2TransactionExpenses 14.6 0.0 0.8 0.0
Add(deduct)RevenuesAdjustment: AccruedIncome -8.9 -0.9 -0.5 -0.1OtherNon-CashIncome -15.8 5.1 -0.9 0.3NetProfitfromAssetSale 3.6 0.0 0.2 0.0
Add(deduct)NonOperationalAdministrativeFees NonAdministrativeFees 16.7 10.7 0.9 0.7
AFFO 343.3 300.9 19.0 19.6

27
Appendix5-CapRateCalculationTerrafinasubtractscashandlandreservesbookvalueforthecapratecalculation.ImpliedcaprateandunderNAV(NetAssetValue)calculationareshowninthefollowingtables:
ImpliedCapRate
QuarterlyAveragePrice(dollars)¹ 1.71
(x)CBFIs(millionshares) 607.5
(=)MarketCapitalization 1,037.0
(+)TotalDebt 720.0
(-)Cash 246.5
(=)EnterpriseValue 1,510.5
(-)Landreserve 66.5
(=)ImpliedOperatingRealEstateValue 1,445.1
NetOperatingIncome(NOI)2016e 133.0
ImpliedCapRate 9.2%
Figuresexpressedinmillionsofdollarsunlessotherwisestated.
(1)2Q16averagesharepriceofPs.30.84;andaverageexchangerateofPs.18.0687.
CapRateCalculationwithNAV
(+)InvestmentProperties(excludinglandbank) 1,595.1
(+)Land 66.5
(+)Cash 246.5
(-)TotalDebtandLiabilities 750.0
(=)NAV1 1,158.2
(/)CBFIs(millionshares) 607.5
(=)NAVperCBFI(dollars) 1.9
CBFIPrice(NAVcalculation) 1.91
(x)CBFIs(millionshares) 607.5
(=)MarketCap 1158.2
(+)TotalDebtandLiabilities 750.0
(-)Cash 246.5
(=)EnterpriseValue 1,661.6
(-)Landbank 66.5
(=)ImpliedOperatingRealEstateValue 1,595.1
NetOperatingIncome(NOI)2016e 133.0
ImpliedCapRate 8.3%Figuresexpressedinmillionsofdollarsunlessotherwisestated.

28
FinancialStatements
IncomeStatement
2Q16 2Q15
(thousandpesos)
Rentalrevenues
$603,782 $485,754
Otheroperatingincome
57,673 22,040
Realestateoperatingexpenses
(104,266) (124,307)
Feesandotherexpenses
(82,494) (59,900)
Realizedgainfromdisposalofinvestmentproperties
9,361 -
Netgain(loss)fromfairvalueadjustmentoninvestmentproperties
(24,917) (215,798)
Netgain(loss)fromfairvalueadjustmentonborrowings
(324,133) 7,383
Netgain(loss)fromfairvalueadjustmentonloansreceivable
1,669 -
Net(loss)gainunrealizedfromfairvalueonderivativefinancialinstruments
(17) (78,550)
NetIncome(loss)fromfairvalueadjustmentonbankinvestments
- (2)
Foreignexchange(loss)gain
(50,143) (69,263)
Operatingprofit 86,515 (32,643)
Financeincome
1,154 24,118
Financecost
(174,514) (108,747)
Financecost-net (173,360) (84,629)
Shareofprofitfromequityaccountedinvestments
2,557 -
NetProfitfortheperiod (84,288) (117,272)
Itemsthatmaybesubsequentlyreclassifiedtoprofitorloss-currencytranslationdifferences
1,833,812 503,884
TotalComprehensiveincomefortheperiod 1,749,524 386,612

29
FinancialStatements
BalanceSheet Jun-30-16 Mar-31-16(thousandsofpesos)
Assets Non-currentassets
Investmentproperties $31,423,870 $28,906,052(Cost:30/06/2016-Ps.30,387,451;31/03/2016-Ps.27,934,385) Investmentsaccountedusingequitymethod 128,484
119,200
Derivativefinancialinstruments 28
42Loanreceivable 2,399 -(Cost:30/06/2016-Ps.38,524;31/03/2016-Ps.-)
Currentassets Otherassets 74,340 75,051Loanreceivable 38,913
-
(Cost:30/06/2016-Ps.1,096;31/03/2016-Ps.-)
Recoverabletaxes 278,570 353,179Prepaidexpenses 5,039 7,430Acquisitionprepayment - 4,224Deferredchargesandaccruedincome 144,214 123,846Accountsreceivable 56,001
72,831
(Netofallowancefordoubtfulaccounts:30/06/2016-Ps.131,032;31/03/2016-Ps.124,089) Restrictedcash 66,162 59,705
Cashandcashequivalents 4,661,752 4,454,832
Totalassets 36,879,772
34,176,392
NetassetsattributabletoInvestors Contributions,net 15,109,335
15,227,911
Retainedearnings -
261,556Currencytranslationadjustment 7,587,022
5,753,210
Totalnetassets(NetEquity) 22,696,357 21,242,677
Liabilities
Non-currentliabilities
Borrowings 13,042,077 11,793,832(Cost:30/06/2016-$12,996,264;31/03/2016-$12,054,158)
Tenantdeposits 157,887
136,070
Accountspayable 40,142
49,783Currentliabilities Tradeandotherpayables 307,515 393,253Borrowings 574,046 482,840
(Cost:30/06/2016-Ps.574,046,31/03/2016-Ps.482,840)
Tenantdeposits 61,748
77,937
Totalliabilities(excludingnetassetsattributabletotheInvestors) 14,183,415 12,933,715
Totalnetassetsandliabilities 36,879,772
34,176,392

30
FinancialStatements
CashFlowStatement Jun-16
(thousandsofpesos)
Cashflowsfromoperatingactivities(Loss)profitfortheperiod $251,787
Adjustments:Netloss(gain)unrealizedfromfairvalueadjustmentoninvestmentproperties 15,165
Netloss(gain)unrealizedfromfairvalueadjustmentonborrowings 247,237Netloss(gain)unrealizedfromfairvalueadjustmentonloansreceivable (1,669)Netloss(gain)unrealizedfromfairvalueadjustmentonderivativefinancialinstruments (10)Realizedgainfromdisposalofinvestmentproperties (9,361)
Baddebtexpense 12,614
Interestexpense 321,055
Interestincomeonbankaccounts (1,541)
Shareofprofitfromequityaccountedinvestments (19,811)
Decrease(increase)deferredrentsreceivable (32,320)
Decrease(increase)inrestrictedcash (8,119)
Decrease(increase)inaccountsreceivable (2,143)
Decrease(increase)inrecoverabletaxes 51,134
Decrease(increase)inprepaidexpenses 4,873
Decrease(increase)inotherassets 18,420
Decrease(increase)intenantdeposits 20,343
(Decrease)inaccountspayable (7,480)
Netcash(usedin)generatedfromoperatingactivities 860,174
CashflowsfrominvestingactivitiesAcquisitionssofinvestmentproperties (17,707)
Improvementsofinvestmentproperties (166,560)
Proceedsfromdispositionsofinvestmentproperties 60,046
Acquisitionprepayment 4,177
Interestincomeonbankaccounts 1,541
Investmentsinjointventure 3,292
Loansreceivabledeposit (37,705)
Loansreceivablepayment 93
Netcash(usedin)generatedfrominvestingactivities (152,823)
CashflowsfromfinancingactivitiesPrincipalpaymentsonborrowings (55,189)
Interestexpense (321,055)
Distributionstoinvestors (576,588)
ProceedsfromCBFI,netofissuingcost 5,013
Netcash(usedin)generatedfromfinancingactivities (947,819)
Net(decrease)incashandcashequivalents (240,468)
Cashandcashequivalentsatthebeginningoftheperiod 4,467,863
Exchangeeffectsoncashandcashequivalents 434,357
Cashandcashequivalentsattheendoftheperiod $4,661,752

31
FinancialStatements AttributabletoInvestors
StatementofChangesinEquity Netcontributions
Currencytranslationadjustment
Retainedearnings Netassets
(thousandsofpesos) BalanceatJanuary1,2015 $15,227,911 $5,519,448 $201,212 $20,948,571Equitycontributions,netofissuingcost 5,013 - - $5,013DistributionstoInvestors (123,589) - (452,999) (576,588)ComprehensiveIncome Netlossoftheperiod - - 251,787 251,787OtherComprehensiveIncome CurrencyTranslation - 2,067,574 - 2,067,574TotalComprehensive(loss)income - 2,067,574 251,787 2,319,361
NetAssetsasofJune30,2016 $15,227,911 $7,587,022 $261,556 $22,696,357