september hong kong jewellery & gem fair 2017 · pdf filetotal number of online survey...
TRANSCRIPT

September Hong Kong
Jewellery & Gem Fair 2017
0

1

Survey Summary
Total number of exhibitor 3,695
Total number of collected onsite survey 2,458
Onsite survey response rate 66.52% [2,458/3,695]
Total number of online survey successfully sent out 3,568
Total number of collected online survey 274
Overall survey response rate 7.67% [274/3,568]
Total number of collected survey (onsite + online) 2,577
(excl.155 duplicated)
Overall response rate 69.74% [2,577/3,695]
2

• Amongst all theme pavilion at HKCEC, “Silver Jewellery” and “Hong Kong Pavilion” has the most exhibitors.
• Amongst all theme pavilion at AWE, “Gemstones Pavilion” has the most exhibitors.
No. of respondents skipped: 201 No. of respondents skipped: 108
CEC Number of Respondents: 1,284 Number of Respondents: 984AWE
Exhibitors in Theme Pavilions or Group Pavilions
1%
2%
2%
3%
3%
3%
4%
4%
5%
6%
8%
8%
16%
22%
22%
0% 5% 10% 15% 20% 25%
Bridal Jewellery Pavilion
Fei Cui Gallery
Jewellery Accessories
Pearl Jewellery
Designer Arena
International Premier Pavilion
Antique & Vintage Jewellery
Other Finished Jewellery
Fine Design Pavilion
CORE PavilionCORE
Asian Fine Jewellery
Packaging, Tools & Equipment
International Fine Jewellery
Hong Kong Pavilion
Silver Jewellery
7%
16%
30%
47%
0% 20% 40%
Fine Gem Pavilion
Pearls Pavilion
Diamond Pavilion
Gemstones Pavilion
3

• Amongst all group pavilion at HKCEC, “Hong Kong Pavilion” has the most exhibitors.
• Amongst all group pavilion at AWE, “Thailand” has the most exhibitors.
No. of respondents skipped: 201 No. of respondents skipped: 108
CEC Number of Respondents: 1,284 Number of Respondents: 984AWE
Exhibitors in Theme Pavilions or Group Pavilions
0.5%
1%
1%
1%
2%
2%
3%
3%
3%
4%
4%
4%
7%
8%
11%
0% 5% 10% 15%
South Africa
Colombia
Israel
Sri Lanka
Germany
Brazil
USA
Italy
Taiwan
Belgium
India
China
Japan
Hong Kong
Thailand
0.1%
0.1%
0.3%
0.4%
0.4%
1%
1%
1%
1%
1%
1%
1%
2%
4%
6%
10%
10%
36%
0% 10% 20% 30% 40%
Portugal
Russia
France
South Africa
Singapore
Spain
Poland
Turkey
USA
Germany
India
Korea
Taiwan
Italy
Japan
China
Thailand
Hong Kong Pavilion
4

• Manufacturer/Supplier, Importer and Exporter were the top three business nature among exhibitors.
No. of respondents skipped: 56 No. of respondents skipped: 40
2017 Number of Respondents: 2,521 Number of Respondents: 2,4392016
Exhibitors’ nature of business(es)
5
0.3%
0.6%
0.8%
1.1%
0.7%
0.4%
0.8%
1.5%
8.7%
14.4%
19.6%
41.5%53.5%
71.8%
0.04%
0.1%
0.3%
0.6%
0.7%
0.2%
0.5%
1.9%
8.1%
13.4%
22.5%
42.7%
52.6%
72.6%
0% 20% 40% 60% 80%
Publication
Department / Chain Store
Gift Shop
Mail Order House / E-Tailer
Gem Laboratory / Gemologist
Private Jewellery Collector
Jewellery Trade Association
Retailer
Buying Agent
Jewellery Designer
Wholesaler
Exporter
Importer
Manufacturer/Supplier
2017
2016

• The September Fair was well established and have satisfactory exhibitor loyalty. This year, over 90% were returning
exhibitor while 9% were first-time exhibitor. In order to maintain good quality service to exhibitors, we should ensure
the repeated exhibitors and the first-time exhibitors this year will be properly served again in next edition.
No. of respondents skipped: 208 No. of respondents skipped: 178
2017 Number of Respondents: 2,369 Number of Respondents: 2,3012016
Is your company a first-time participant in this exhibition?
8%[179]
92%[2,148]
2016
First-time Repeated
9%[224]
91%[2,145]
2017
First-time Repeated
6

CSAT 2017
5.55CSAT2016
5.71
• The satisfaction level among exhibitors was not as high as visitors. There was also a 0.16% drop comparing to 2016.
This may due to the air conditioning issue at AWE which pulled down the overall satisfaction rate.
• More than half of the exhibitors (53%) gave rating 6-10 in 2017.
No. of respondents skipped: 53 No. of respondents skipped: 40
2017 Number of Respondents: 2,524 Number of Respondents: 2,4392016
Overall, how would you rate your satisfaction with your experience at September Hong Kong Jewellery & Gem Fair?(0 = Extremely dissatisfied; 10 = Extremely satisfied)
2% [51]3% [73]
4% [103]
8% [184]
8%[193]
21%[501]
15% [373]17%[412]
14% [346]
4% [109]
4% [94]
3% [84] 3% [86]
5%[125]
8% [213] 8%[196]
20%[500]
15% [366]
16% [392] 14% [351]
4% [101]
4% [110]
0%
5%
10%
15%
20%
25%
0 1 2 3 4 5 6 7 8 9 10
20162017
7

Satisfaction rating by exhibitors - Breakdown of the responses between First-time exhibitor and repeated exhibitor(0 = Extremely dissatisfied, 10 = Extremely satisfied)
• The customer satisfaction of returning exhibitors was slightly higher than that of first-time exhibitors. 52% of returning
visitors gave rating 6-10, while 53% of the first-time exhibitors gave rating 6–10.
Response Count:521
CSAT 2017
[First-time exhibitors]
5.40
Response Count:1070
CSAT 2017
[Repeated exhibitors]
5.56
8

How did you learn about this exhibition?
• The top 3 channels were “Organiser’s email”, “Word of mouth / Referral from industry friend” and “Advertisement”. Most exhibitors learn
about the September show from organizer’s email.
• A 13% drop in “Search Engine” was recorded. Managing SEO or using Google adwords may help to bring the percentage up again.
No. of respondents skipped: 364 No. of respondents skipped: 95
2017 Number of Respondents: 2,213 Number of Respondents: 3,3892016
9
2%
19%
4%
7%
12%
14%
16%
12%
23%
4%
6%
6%
8%
16%
22%
25%
30%
38%
0% 10% 20% 30% 40%
Social Media
Search Engine
At other exhibitions
Other (please specify):
Organiser’s printed mail
Organiser’s website
Advertisement
Word of mouth / Referral from industry friend
Organiser’s email
2017
2016

How did you learn about this exhibition?- Types of Advertisement
• Despite of a 11% decrease from 2016, “Trade publications” was still the top source of advertisement this year. Mass media
ranked the second with a 3% drop comparing to 2016.
• Outdoor promotion is still the least effective out of the three.
2017 Number of Respondents: 523 Number of Respondents: 4362016
14%
30%
73%
11%
27%
62%
0% 20% 40% 60% 80%
Outdoor
Mass media
Trade publications
2017
2016
10

How did you learn about this exhibition?- Search Engine
• Google remains a more dominant search engine in 2017.
2017 Number of Respondents: 252 Number of Respondents: 1142016
3%
2%
5%
22%
84%
1%
3%
6%
16%
74%
0% 20% 40% 60% 80% 100%
Sogou
Bing
Baidu
Yahoo
2017
2016
11

How did you learn about this exhibition?- Online Platform
• Same as last year, most exhibitors still learn the September show from HKTDC.com.
2017 Number of Respondents: 2,604 Number of Respondents: 1,6932016
1%
2%
4%
8%
17%
48%
66%
1%
2%
3%
6%
14%
32%
43%
0% 10% 20% 30% 40% 50% 60% 70%
Polygon.net
BlueNile.com
Globalsources.com
Others
Alibaba.com
JewelleryNetAsia.com
HKTDC.com
2017
2016
12

18%[426]
82%[1,960]
2017
User
Non-user
Did you use the fairs’ mobile app “Mobile Buyer Guide”?
How well did the MOBILE APP meet your needs
How likely would you be to recommend this MOBILE
APP to other attendees of the event?
• More promotion for the mobile app is required as there were only 18% of the exhibitors are using the app.
2017 Number of Respondents: 2,386 Number of Respondents: 2,2852016
16%[364]
84%[1,921]
2016
User
Non-user
13% [46]
19% [69]
48% [174]
10% [36] 11% [41]
13% [54]
22% [92] 44% [183]
12% [49] 12% [50]
0%
20%
40%
60%
5 4 3 2 1
2017
2016
16% [59]26% [93]
46% [164]
13% [48]13% [45]
13% [47]21% [75]
44% [159]
12% [42] 10% [35]0%
20%
40%
60%
5 4 3 2 1
2017
2016
Average rating 2017
3.12
Average rating 2016
3.12
Average rating 20173.18
Average rating 2016
3.16
22

Reason(s) for respondents who did not download the mobile app - Based on exhibitors who did not download the mobile app
• More promotion for the mobile app is required as over 60% of the Q6 respondents does not aware of the mobile app.
2017 Number of Respondents: 1,496 Number of Respondents: 8392016
4%
7%
7%
10%
28%
61%
3%
7%
9%
11%
27%
61%
0% 20% 40% 60% 80%
No mobile device / mobile device didn’t work with app
Technical problems using the app
Too difficult to download / install the app
Other
Not worth the effort to install the app
Not aware there was a mobile app
2017
2016
No. of respondents skipped: 1,081 No. of respondents skipped: 548
14

To what extents have your objectives for exhibiting this exhibition being achieved?(N/A ; 1 = Did not achieve at all ; 5 = Fully achieved)
• Exhibitors found that their objectives in “Collect market information” and “Consolidate contacts with buyers/business
partners” was well achieved, followed by “Find new buyers”.
2017 Number of Respondents: 2,282
No. of respondents skipped: 295Response Count
2,012
2,047
2,008
2,031
2,089
1,983
2,2362%
30%
9%
13%
15%
6%
6%
15%
19%
16%
10%
9%
7%
7%
25%
19%
26%
17%
17%
17%
14%
34%
21%
32%
33%
33%
39%
35%
17%
8%
14%
19%
19%
23%
27%
6%
3%
5%
7%
7%
8%
10%
0% 20% 40% 60% 80% 100%
Find new buyers
Find franchisers partners / agents
Explore new markets
Launch new products
Brand-building
Collect market information
Consolidate contacts with buyers/ business partners
N/A 1 2 3 4 5
15
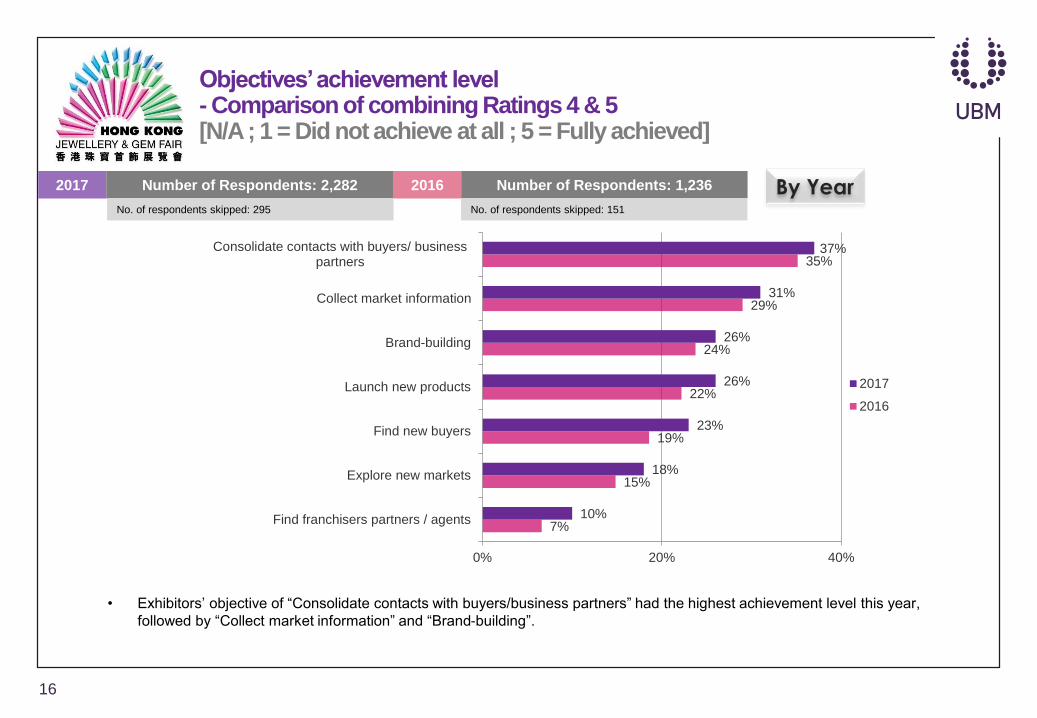
Objectives’ achievement level- Comparison of combining Ratings 4 & 5[N/A ; 1 = Did not achieve at all ; 5 = Fully achieved]
• Exhibitors’ objective of “Consolidate contacts with buyers/business partners” had the highest achievement level this year,
followed by “Collect market information” and “Brand-building”.
2017 Number of Respondents: 2,282 Number of Respondents: 1,2362016
7%
15%
19%
22%
24%
29%
35%
10%
18%
23%
26%
26%
31%
37%
0% 20% 40%
Find franchisers partners / agents
Explore new markets
Find new buyers
Launch new products
Brand-building
Collect market information
Consolidate contacts with buyers/ businesspartners
2017
2016
By YearNo. of respondents skipped: 295 No. of respondents skipped: 151
16

Objectives’ achievement level- Comparison of combining Ratings 4 & 5[N/A ; 1 = Did not achieve at all ; 5 = Fully achieved]
• Both HKCEC and AWE shares the highest achievement level on “Consolidate contacts with buyers/ business partners” with
39% and 35% respectively.
• “Collect market information” is the only achievement level which AWE is higher than HKCEC.
By Venue
9%
16%
22%
25%
18%
34%
35%
11%
20%
23%
27%
31%
29%
39%
0% 20% 40%
Find franchisers partners / agents
Explore new markets
Find new buyers
Brand-building
Launch new products
Collect market information
Consolidate contacts with buyers/ business partners
CEC
AWE
CEC Number of Respondents: 1,346 Number of Respondents: 936AWE
No. of respondents skipped: 139 No. of respondents skipped: 156
17
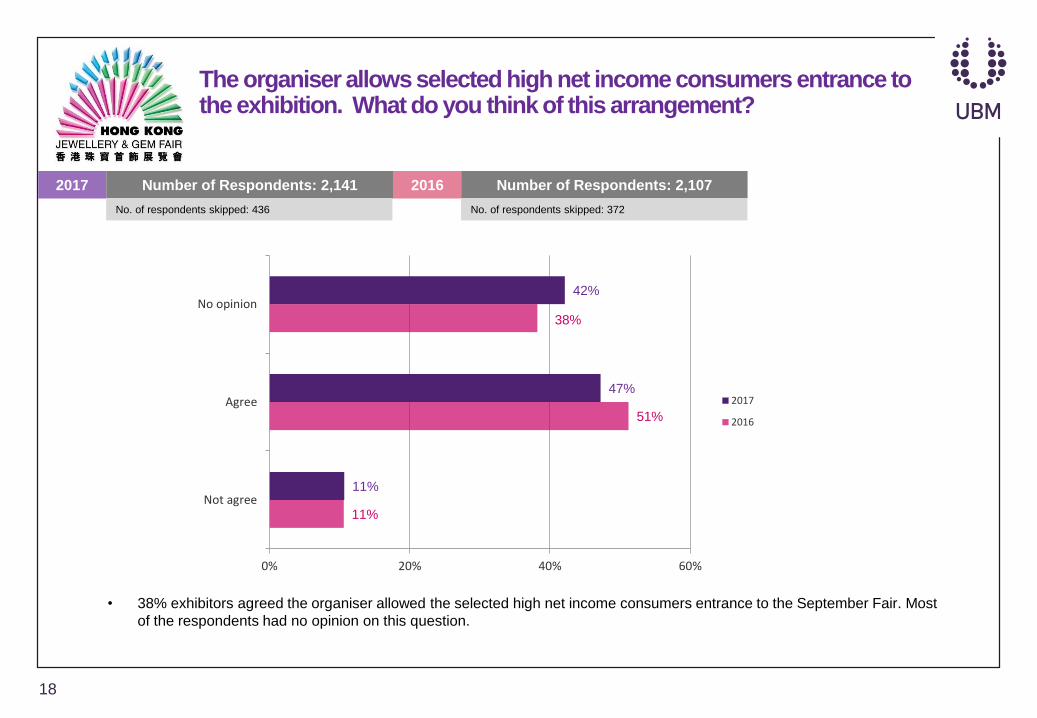
The organiser allows selected high net income consumers entrance to the exhibition. What do you think of this arrangement?
• 38% exhibitors agreed the organiser allowed the selected high net income consumers entrance to the September Fair. Most
of the respondents had no opinion on this question.
2017 Number of Respondents: 2,141 Number of Respondents: 2,1072016
No. of respondents skipped: 436 No. of respondents skipped: 372
18
11%
51%
38%
11%
47%
42%
0% 20% 40% 60%
Not agree
Agree
No opinion
2017
2016

To what extent are you satisfied with the fair in the following aspects?[N/A ; 1 = Did not achieve at all ; 5 = Fully achieved]
• “Move-in and move-out arrangement” with 90% rating 2-5 is the aspect which exhibitors are most satisfied with. Followed by
Pre-show service of organiser with 89% rating 2-5.
2017 Number of Respondents: 2,266
Response Count
2,097
2,056
2,108
2,144
2,149
2,142
2,189
2,210
2,174
No. of respondents skipped: 311
10%
14%
10%
8%
10%
16%
6%
4%
5%
20%
25%
23%
14%
13%
15%
14%
10%
11%
40%
36%
40%
39%
38%
34%
37%
34%
40%
22%
20%
21%
27%
27%
25%
27%
24%
30%
6%
5%
5%
9%
9%
8%
8%
9%
9%
2%
1%
1%
4%
3%
3%
6%
18%
5%
0% 10% 20% 30% 40% 50% 60% 70% 80% 90% 100%
Business opportunities
Visitor traffic
Visitor quality
Pre-show service of organiser
Onsite service of organiser
Facilities and services of the exhibition centre
Official stand contractor(s)
Official forwarding agent(s)
Move-in and move-out arrangement
1 2 3 4 5 N/A
19
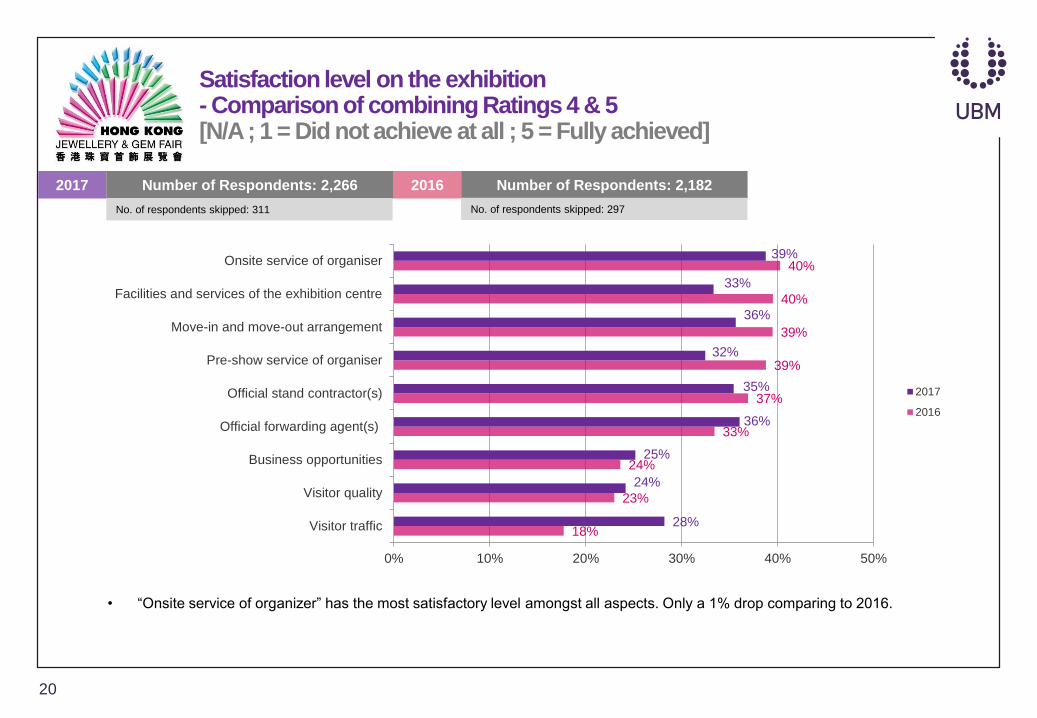
Satisfaction level on the exhibition- Comparison of combining Ratings 4 & 5[N/A ; 1 = Did not achieve at all ; 5 = Fully achieved]
• “Onsite service of organizer” has the most satisfactory level amongst all aspects. Only a 1% drop comparing to 2016.
2017 Number of Respondents: 2,266 Number of Respondents: 2,1822016
18%
23%
24%
33%
37%
39%
39%
40%
40%
28%
24%
25%
36%
35%
32%
36%
33%
39%
0% 10% 20% 30% 40% 50%
Visitor traffic
Visitor quality
Business opportunities
Official forwarding agent(s)
Official stand contractor(s)
Pre-show service of organiser
Move-in and move-out arrangement
Facilities and services of the exhibition centre
Onsite service of organiser
2017
2016
No. of respondents skipped: 311 No. of respondents skipped: 297
20

What are your plans for participating in this exhibition next year?
• Over 85% of the
respondents will participate
again in next edition.
2017 Number of Respondents: 2,198 Number of Respondents: 2,1872016
No. of respondents skipped: 379 No. of respondents skipped: 292
86%
86%
13%
14%
1%
1%
60% 80% 100%
2017
2016
Will participate
May participate
Will not participate
Preferences between booth sizes [Based on exhibitors who will participate the next edition]
17%
79%
4%
18%
76%
6%
0%
20%
40%
60%
80%
100%
Larger booth Same booth size Smaller booth size
2017
2016
• Most of the respondents
(79%) are looking for a booth
of same size as 2017.
21