hong kong jewellery sector
TRANSCRIPT

DISCLOSURE APPENDIX CONTAINS ANALYST CERTIFICATIONS AND THE STATUS OF NON-US ANALYSTS. U.S. Disclosure: Credit Suisse does and seeks to do business with companies covered in its research reports. As a result, investors should be aware that the Firm may have a conflict of interest that could affect the objectivity of this report. Investors should consider this report as only a single factor in making their investment decision.
CREDIT SUISSE SECURITIES RESEARCH & ANALYTICS BEYOND INFORMATION®
Client-Driven Solutions, Insights, and Access
17 April 2012 Asia Pacific/Hong Kong
Equity Research Luxury Goods
Hong Kong Jewellery Sector SECTOR FORECAST
Gold rush is over Figure 1: YoY % change in gold price
-10
0
10
20
30
40
50
60
70
01-Apr 01-Jun 01-Aug 01-Oct 01-Dec 01-Feb
FY3/11 FY3/12 FY3/13E
(%)
Source: DataStream, Credit Suisse estimates
■ SSSG to worsen in the September quarter: Gold price has lost its upward momentum since 3Q11. With expectation of QE3 eased while Indian physical demand remains sluggish, we believe a rally similar to that in 2011 is very unlikely. That said, jewellers will face tougher SSSG in the next few months, when gold price may register YoY decline. For jewellers that do not hedge against their gold price exposure; margins are likely to deteriorate significantly with profitability to be dragged down even more.
■ More pressure on Hong Kong business: As a more matured market, sales growth in Hong Kong is more dependent on SSSG than POS expansion, which is the opposite case in China. With decelerating mainland Chinese visitation growth, jewellers that do not have major and fast growing direct retail exposure in China would see higher risk of earnings decline.
■ Downgrading Luk Fook (0590.HK) to UNDERPERFORM, prefer Chow Tai Fook: On the back of the above factors, we expect Luk Fook to register negative earnings growth in 1HFY3/13, which is going to drive further de-rating, despite its absolute valuation remaining not excessive. On the other hand, we prefer Chow Tai Fook for its bigger and fast expanding direct retail exposure in China along with its full gold price hedging strategy. These should provide more stable and sustainable earnings growth. Nevertheless, its relatively high valuation does not warrant an Outperform rating yet.
Research Analysts
Gabriel Chan, CFA 852 2101 6523
Isis Wong 852 2101 7109

17 April 2012
Hong Kong Jewellery Sector 2
Focus charts Figure 2: YoY % change in gold price Figure 3: Gold historical price and forecast
-20
-10
0
10
20
30
40
50
60
70
0 1-Ap r 01-Jun 01-A ug 0 1-Oct 01-Dec 0 1-Feb
FY3/11 FY 3/1 2 FY3/13E
(% )
0
200
400
600
800
1,000
1,200
1,400
1,600
1,800
2,000
2006 2007 2008 2009 2010 2011 2012 2013
Gold (Spot) Quarterly avg. forecast
(US$/ ounce)
Source: DataStream, Credit Suisse estimates Source: DataStream, Credit Suisse estimates
Figure 4: 3-month changes in gold price Figure 5: Sales versus rental rate growth
-15
-10
-5
0
5
10
15
20
25
A pr-10 Jun-10 Aug-1 0 O ct-10 Dec-10 Feb -11
FY3/11 FY 3/1 2 FY3/13
(% )
-40
-20
0
20
40
60
80
1Q02 1Q03 1Q04 1Q05 1Q06 1Q07 1Q08 1Q09 1Q10 1Q11 1Q12
(%)
Overall prime Premium prime
High-street Jewellery & watches sales growth
Source: DataStream, Credit Suisse estimates Source: Jones Lang LaSalle, CEIC, Credit Suisse estimates
Figure 6: Mainland Chinese visitation to Hong Kong Figure 7: Hong Kong retail contribution to overall revenue
0
500 ,000
1,000 ,000
1,500 ,000
2,000 ,000
2,500 ,000
3,000 ,000
3,500 ,000
Jan-08 Jul-08 Jan -09 Ju l-09 Jan-10 Jul-10 Jan-11 Jul-11 Jan -12
-20
-10
0
10
20
30
40
50
60(% )
Mainland Ch inese visitation YoY % chg
20
30
40
50
60
70
80
Chow Tai Fook Chow Sang Sang Luk Fook
(%)
% of retail sales from HK - FY11
Source: CEIC Source: Company data

17 April 2012
Hong Kong Jewellery Sector 3
Gold rush is over SSSG to worsen in the September quarter Gold price has lost its upward momentum since 3Q11. With expectation of QE3 eased while Indian physical demand remains sluggish, we believe a rally similar to that in 2011 is very unlikely. That said, jewellers will face even tougher same-store-sales-growth (SSSG), particularly in the September quarter, when gold price may register YoY decline. Credit Suisse’s gold price forecast of US$1,810/ ounce in 3Q11, implies YoY change in gold price may drop from current +15% to as much as -5% in September. That said, jewellers would require 20% additional volume growth to offset the impact.
Margin set to decline On the other hand, for jewellers that do not hedge much against their gold price exposure—such as Luk Fook (0590.HK, HK$21.45, UNDERPERFORM [V], TP HK$17.70)—margins are likely to deteriorate significantly as exceptional profit from realized gold holding inventory gain, through higher gross margin, would no longer exist if gold price remains subdued. Even with 100% gold price hedging such as Chow Tai Fook (1929.HK, HK$11.94, NEUTRAL [V], TP HK$12.70)—whose gross margin should remain stable despite changes in gold price—the lower ASP would still result in negative operating leverage.
More pressure on Hong Kong businesses As a more matured market, sales growth in Hong Kong is much more depended on SSSG, rather than point-of-sales (POS) expansion, which is the opposite case in China. With decelerating mainland Chinese visitation growth along with subdued local consumer confidence, jewellers’ sale volume growth in Hong Kong is likely to lag behind that in China. That said, jewellers that do not have scalable and fast-growing direct retail exposure in China, such as Luk Fook, again, could be under extra pressure to maintain their revenue growth trend.
We prefer Chow Tai Fook over Luk Fook In our view, Luk Fook, among the three major listed Hong Kong jewellers, would experience the highest pressure to maintain its earnings growth momentum. Given the lack of exceptional profit from realised gold inventory holding gain, (which accounted for about 20% of its net profit in 1HFY3/12), as well as its relatively small direct retail exposure in China, (which accounted for about 6% of its total revenue in FY3/12), Luk Fook may struggle to see positive earnings growth in 1HFY3/13. We have revised downwards our FY3/12–14 EPS forecast for Luk Fook by 7–25%, and downgrade the stock to UNDERPEFFORM with a new target price of HK$17.70, which is based on 8x FY3/13 P/E (or 0.85x PEG).
On the other hand, we prefer Chow Tai Fook for its bigger and fast expanding China direct retail exposure along with its full gold price hedging strategy. These, combined with its better brand recognition should offer more stable and sustainable earnings growth. As such, we believe Chow Tai Fook deserves to trade at a valuation premium over Luk Fook. Nevertheless, we see limited near-term catalysts to get Chow Tai Fook re-rate from its current valuation of 14x FY3/14 P/E, especially when its peers are undergoing a de-rating. We therefore maintain our NEUTRAL rating on Chow Tai Fook, with a new target price of HK$12.70, which is based on 15x FY3/13 P/E (or 0.44x PEG).
Gold price may register YoY decline in the September quarter, adding pressure on SSSG
Subdued gold price putting pressure on gross and operating margins
Decelerating Chinese visitation growth and escalating rental cost put additional pressure on Hong Kong retail business
Luk Fook may experience YoY decline in 1HFY3/13 earnings
Fast POS expansion in China should help Chow Tai Fook sustain a stable earnings growth

17 April 2012
Hong Kong Jewellery Sector 4
Figure 8: Valuation comp of HK Jewellery sector Mkt Credit Pot. P/S P/E CY10-13
Cap Price Suisse TP up/down
(x) (x) EPS CAGR
Company Ticker US( mn) (l.c.) Rating (l.c.) (%) CY11 CY12 CY13 CY11 CY12 CY13 (%) PEG (x)
CHOW SANG SANG 0116.HK 1,744 20.00 NOT RATED n.a. n.a. 0.8 0.6 0.6 12.4 10.5 8.8 24.9 0.4
Chow Tai Fook 1929.HK 15,383 11.94 NEUTRAL 12.70 6.4 0.3 0.2 0.2 19.6 14.9 11.1 44.4 0.3
Emp Wat & Jew 0887.HK 1,047 1.21 NOT RATED n.a. n.a. 1.4 1.1 0.9 12.5 10.9 8.6 80.0 0.1
Luk Fook 0590.HK 1,628 21.45 UNDERPERFORM 17.70 -17.5 0.2 0.1 0.1 9.6 9.5 8.5 17.6 0.5
Oriental Watch 0398.HK 256 3.48 NOT RATED n.a. n.a. 0.5 0.4 0.3 7.2 6.0 5.2 12.5 0.5
Sector average 0.4 0.3 0.2 17.5 13.1 10.0 42.0 0.4
Source: Company data, Credit Suisse estimates, I/B/E/S estimates for uncovered companies
17 April 2012
Hong Kong Jewellery Sector 5
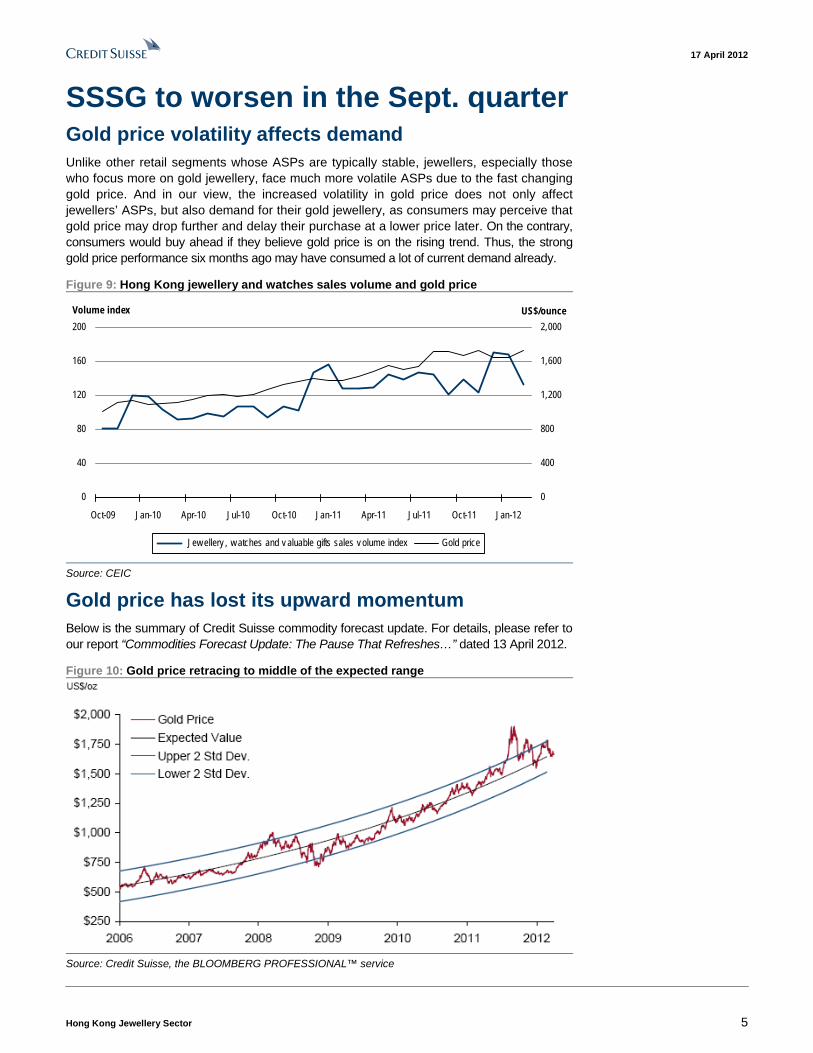
SSSG to worsen in the Sept. quarter Gold price volatility affects demand Unlike other retail segments whose ASPs are typically stable, jewellers, especially those who focus more on gold jewellery, face much more volatile ASPs due to the fast changing gold price. And in our view, the increased volatility in gold price does not only affect jewellers’ ASPs, but also demand for their gold jewellery, as consumers may perceive that gold price may drop further and delay their purchase at a lower price later. On the contrary, consumers would buy ahead if they believe gold price is on the rising trend. Thus, the strong gold price performance six months ago may have consumed a lot of current demand already.
Figure 9: Hong Kong jewellery and watches sales volume and gold price
0
40
80
120
160
200
Oct-09 Jan-10 Apr-10 Jul-10 Oct-10 Jan-11 Apr-11 Jul-11 Oct-11 Jan-12
Volume index
0
400
800
1,200
1,600
2,000
US$/ounce
Jew ellery , w atches and v aluable gifts sales v olume index Gold price
Source: CEIC
Gold price has lost its upward momentum Below is the summary of Credit Suisse commodity forecast update. For details, please refer to our report “Commodities Forecast Update: The Pause That Refreshes…” dated 13 April 2012.
Figure 10: Gold price retracing to middle of the expected range
Source: Credit Suisse, the BLOOMBERG PROFESSIONAL™ service

17 April 2012
Hong Kong Jewellery Sector 6
Gold price has recently fallen back into the middle of its longer-term trend, as expectations of further monetary easing by the US Federal Reserve have diminished. Meanwhile physical demand from India has been slack. We expect Indian buying to pick up as we move into 2H12 but the market is likely to remain far more attuned to the US monetary policy. A slowdown scare for the US that raises expectations of QE again would be bullish, whereas changing guidance on interest rates by the FOMC members would have highly bearish potential.
On balance, we think there is enough uncertainty about the pace of US economic recovery (as well as other macro and geopolitical risks) to keep gold supported until markets renew their focus on the US federal debt in 4Q12 (likely good for gold) but note that the downside risks to our forecasts have increased. We remain less bullish than market consensus and expect consensus to move towards our position.
Credit Suisse projects gold price to experience modest increase from current level and peak at US$1,920/ ounce in 1Q13, and then decline to US$1,660/ ounce in 4Q13.
Figure 11: Gold—historical price and forecast
0
200
400
600
800
1,000
1,200
1,400
1,600
1,800
2,000
2006 2007 2008 2009 2010 2011 2012 2013
Gold (Spot) Quarterly avg. forecast
(US$/ ounce)
Source: Credit Suisse, the BLOOMBERG PROFESSIONAL™ service
Expectations of further monetary easing by the US Federal Reserve have diminished
Credit Suisse expects gold price to peak at US$1,920/ounce in 1Q13

17 April 2012
Hong Kong Jewellery Sector 7
Tough SSSG comparison ahead Hong Kong and China jewellers, especially those who have a high percentage or revenue generated from gold jewellery, had benefited a lot from the strong gold price appreciation in 1Q and 3QCY12, when gold price, on an average, was up 48% YoY and 38% YoY, respectively.
However, with gold price losing its momentum since September 2011, jewellers are facing the opposite situation, with SSSG being dragged down on both lower ASPs as well as softening demand.
The impact is likely to be most significant in the coming September quarter. Based on Credit Suisse’s gold price forecast of US$1,810/ ounce in 3Q11, YoY change in gold price will drop from currently +15% to as much as -5%. That said, jewellers would require 20% additional volume growth to offset the impact.
Figure 12: YoY change in gold price—base case scenario
-20
-10
0
10
20
30
40
50
60
70
01-Apr 01-Jun 01-Aug 01-Oct 01-Dec 01-Feb
FY3/11 FY3/12 FY3/13E
(%)
Source: DataStream, Credit Suisse estimates
However, if we assume gold price to stay at the current level in the next 12 months, YoY change in gold price would drop from the current level of about +15% to -12%, and stay at negative territory most of the time from August 2012 onwards.
Figure 13: YoY change in gold price—assuming gold price to stay flat
-20
-10
0
10
20
30
40
50
60
01-Apr 01-Jun 01-Aug 01-Oct 01-Dec 01-Feb
FY3/11 FY3/12 FY3/13
(%)
Source: DataStream, Credit Suisse estimates
SSSG started to decelerate together with weakening of gold price

17 April 2012
Hong Kong Jewellery Sector 8
Margin set to decline Two ways that margin could be affected There are two ways that jewellers’ profitability may be affected by changes in gold price, which in our view, could only be partially hedged.
Realised inventory holding gain/loss through gross profit line
Like all other retailers, jewellers need to keep certain inventory. For jewellers, their typical finished good inventory turnover days are about three months for gold jewellery, and six months or even longer for gem-set jewellery.
As jewellers normally price their gold jewellery mark-to-market the spot price of gold, thus, their gross margin would include the realised inventory holding gain or loss.
The normal retail mark-up of gold jewellery is 10%. Thus, if gold price three months ago stood at US$1,000/ounce and stays the same, the jeweller would sell the product containing one ounce of gold at US$1,100, and earn a 10% gross margin.
However, if spot price of gold has risen to US$1,100/ ounce, based on the typical mark-up of 10%, the jeweller would sell the same product for US$1,210. Hence, based on the original cost of US$1,000, the jeweller would earn a gross profit of US$210, representing a gross margin of 21%.
On the contrary, if spot price of gold has fallen to US$900/ ounce, the jeweller would sell the product at US$990, and incur a gross loss of US$10, implying a gross margin of -1%.
Nevertheless, jewellers can hedge against such margin volatility by short-selling gold in the open markets, or enter into gold loans with banks. Among the major Hong Kong listed jewellers, namely Chow Tai Fook, Chow Sang Sang and Luk Fook, they are hedging against the gold inventory at 100%, ~40% and ~20%, respectively.
Thus, among the above jewellers, Luk Fook gained most from the gold price appreciation last year. We actually estimated that about 20% of its 1HFY3/12 net profit came from the realised gold inventory gain. However, this also means that among the three jewellers, Luk Fook will suffer the most from the weakening of gold price. Even though it is relatively easy for Luk Fook to enter into additional hedging for its gold position, it still represents a significant decline in its gross margin for gold product from an exceptionally high level last year, to a fully hedged level of 10%, if gold price were to drop further.
Figure 14: 3-month changes in gold price (based on CS projection)
-15
-10
-5
0
5
10
15
20
25
Apr-10 Jun-10 Aug-10 Oct-10 Dec-10 Feb-11
FY3/11 FY3/12 FY3/13
(%)
Source: DataStream, Credit Suisse estimates
Luk Fook’s gross margin is set to decline on the absence of realised gold inventory holding gains
17 April 2012
Hong Kong Jewellery Sector 9
Figure 14 shows 3-month changes in gold price, with FY3/13, based on our in-house gold price assumptions. It suggests that jewellers who do not hedge against gold price volatility may have experienced significant margin deterioration from September to December 2011.
And even with some relative improvement since December onwards, their overall gross margin between April and November 2012, would still very likely to be below that during the same period last year.
Negative operating leverage
While jewellers can hedge against volatility in their gross margin by entering into gold price hedging, pressure on operating margin due to negative operating leverage is difficult to defend.
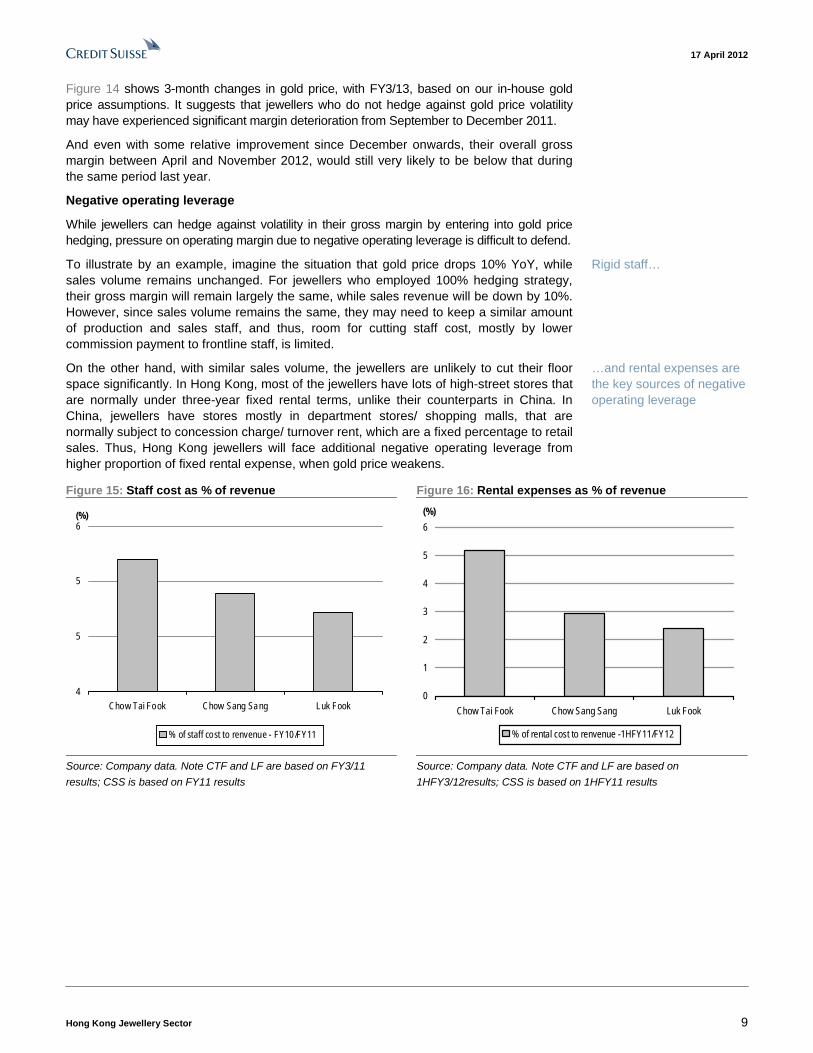
To illustrate by an example, imagine the situation that gold price drops 10% YoY, while sales volume remains unchanged. For jewellers who employed 100% hedging strategy, their gross margin will remain largely the same, while sales revenue will be down by 10%. However, since sales volume remains the same, they may need to keep a similar amount of production and sales staff, and thus, room for cutting staff cost, mostly by lower commission payment to frontline staff, is limited.
On the other hand, with similar sales volume, the jewellers are unlikely to cut their floor space significantly. In Hong Kong, most of the jewellers have lots of high-street stores that are normally under three-year fixed rental terms, unlike their counterparts in China. In China, jewellers have stores mostly in department stores/ shopping malls, that are normally subject to concession charge/ turnover rent, which are a fixed percentage to retail sales. Thus, Hong Kong jewellers will face additional negative operating leverage from higher proportion of fixed rental expense, when gold price weakens.
Figure 15: Staff cost as % of revenue Figure 16: Rental expenses as % of revenue
4
5
5
6
Chow Tai Fook Chow Sang Sang Luk Fook
(%)
% of staff cost to renvenue - FY10/FY11
0
1
2
3
4
5
6
Chow Tai Fook Chow Sang Sang Luk Fook
(%)
% of rental cost to renvenue -1HFY11/FY12
Source: Company data. Note CTF and LF are based on FY3/11
results; CSS is based on FY11 results
Source: Company data. Note CTF and LF are based on
1HFY3/12results; CSS is based on 1HFY11 results
Rigid staff…
…and rental expenses are the key sources of negative operating leverage

17 April 2012
Hong Kong Jewellery Sector 10
More pressure on HK businesses Comparing jewellers’ operations in Hong Kong and China, we believe Hong Kong jewellers would find it more difficult to sustain their robust earnings growth. Being a more matured market, revenue growth in Hong Kong is mostly depended on SSSG, while in China, jewellers could still drive top-line growth via opening new stores, particularly in tier 3–4 cities, where penetration is relatively low.
Figure 17: Store expansion plans Chow Tai Fook Chow Sang Sang Luk Fook
FY3/11 FY3/12E FY3/13E FY11 FY12E FY13E FY3/11 FY3/12E FY3/13E
Hong Kong & Macau (self-operated only) 82 94 102 56 n.a. n.a. 38 42 45
Mainland China
- self-operated 883 1,030 1,155 232 244 n.a. 39 57 69
- franchise 391 480 565 0 0 n.a. 618 718 818
Sub-total 1,274 1,510 1,720 232 244 n.a. 657 775 887
Total 1,356 1,604 1,822 288 302 n.a. 695 817 932
Source: Company data, Credit Suisse estimates
Decelerating mainland Chinese visitation growth As mentioned in the previous section, we believe SSSG of both Hong Kong and China stores would be subject to similar impact from the weakening gold price. However, stores in Hong Kong may face additional pressure with SSSG being dragged down even further on the back of decelerating mainland Chinese visitation growth.
Figure 18: Mainland Chinese visitation to Hong Kong
0
500,000
1,000,000
1,500,000
2,000,000
2,500,000
3,000,000
3,500,000
Jan-08 Jul-08 Jan-09 Jul-09 Jan-10 Jul-10 Jan-11 Jul-11 Jan-12
-20
-10
0
10
20
30
40
50
60(%)
Mainland Chinese visitation YoY % chg
Source: CEIC
In our view, there are two major reasons behind the decelerating visitation growth and why the trend may sustain going forward.
Competition from other shopping destinations
Firstly, in our view, many mainland Chinese people have visited Hong Kong before, and without much non-shopping attractions to support repeated visits, shopping became the primary reason to visit Hong Kong. However, with the continuous increase in general income level, some mainland Chinese may prefer to visit other locations that may satisfy both their shopping and sightseeing requirements.
Chinese people are travelling to other locations

17 April 2012
Hong Kong Jewellery Sector 11
Figure 19: Mainland Chinese visitation growth
-60
-40
-20
0
20
40
60
80
100
1Q05 3Q05 1Q06 3Q06 1Q07 3Q07 1Q08 3Q08 1Q09 3Q09 1Q10 3Q10 1Q11 3Q11
Korea HK Japan Macau Singapore
(%)
Source: DICJ
We also interviewed some European brands, and it is interesting to hear their comments on businesses in their home countries. A lot of them do not consider Europe a matured market. Rather, they are seeing growth rate picking up on the back of the robust sales growth to travellers. According to some of the brands, nowadays, about 50% revenue generated in their home markets represent sales to travellers, who are predominantly mainland Chinese and Russians.
Weakening RMB exchange rate
Secondly, the strong RMB exchange rate against the Hong Kong dollar had also made shopping in Hong Kong more economical. However, with this trend starting to lose pace since October 2011, attractiveness from pricing standpoint faded gradually.
Figure 20: RMB/ HK$ exchange rate
1.00
1.05
1.10
1.15
1.20
1.25
Jan-08 Jan-09 Jan-10 Jan-11 Jan-12
RMB/HK$
Source: Company data, Credit Suisse estimates
Escalating rental pressure As mentioned earlier, the predominately fixed rental structure in Hong Kong along with the escalating retail rental is exerting additional pressures on retailers’ operating margin, and
Europe is not considered a “matured market” by European brands

17 April 2012
Hong Kong Jewellery Sector 12
jewellers are no exception. For further details, please refer to our report, “Hong Kong Retail Sector—Rental cycle is catching up”, dated 04 January 2012.
Figure 21: HK jewellery and watch sales growth versus retail rental rate growth
-40
-20
0
20
40
60
80
1Q02 1Q03 1Q04 1Q05 1Q06 1Q07 1Q08 1Q09 1Q10 1Q11 1Q12
(%)
Overall prime Premium prime High-street Jewellery & watches sales growth
Source: Jones Lang LaSalle, CEIC, Credit Suisse estimates; Note: 1Q12 jewellery and watch sales growth
figure is based on January and February combined figures
Rental cycle is still catching up
Given the typical Hong Kong retail lease structure of three-year fixed terms, the retail cycle normally runs ahead of the rental cycle by 9–12 months, as landlords refer to current sales performance as benchmarks for setting new rental rates. While overall Hong Kong retail sales growth started decelerating in September 2011, and even more so for the jewellery and watch segments, the speed of rental rate growth shows no sign of decelerating. That said, rental pressure is building up.
Note that retail sales growth has been outpacing rental rate growth since 1Q09, which rarely happened over the past ten years, suggesting that landlords had underestimated the growth potential. Hence, we expect lots of catching up by the rental rate and this explains the significant rental hikes recorded, particularly in popular tourist districts. Historically, the rental rate growth has outpaced retail sales growth, and we believe this cycle is no exception.
Influx of foreign brands exaggerated the issues
On the other hand, the influx of foreign brands into Hong Kong also propels the rental hike further. In our view, some of these brands are opening flagship stores in Hong Kong as a stepping stone to penetrate into China in future. Thus, profitability of their Hong Kong operation is not the ultimate focus.
We believe some of the newcomers are treating the high rental expenses, more or less, as one-off advertising expenses, rather than a recurring operating cost item. Given such, they are not yet driving up the overall retail rental rate in Hong Kong, but at the same time, displacing the local brands from the prime locations.
Rising investment demands for retail real estates
Furthermore, the negative interest rate environment, has prompted more people to invest in real estate in Hong Kong. However, with uncertainty about future supply growth and policy risks, the residential segment has become less attractive and therefore, we see
Influx of foreign brands is driving up rental rate…
…and forcing out some local brands from prime locations

17 April 2012
Hong Kong Jewellery Sector 13
more and more real estate investors are now interested in the retail segment, and that has been speeding up the current trend of rental hike, in our view.
Luk Fook generates most of its revenue and operating profit from Hong Kong operations Among the three major Hong Kong listed jewellers, Luk Fook generates most of its revenue and operating profit from Hong Kong. In our view, this represents higher earnings downside risks.
Figure 22: HK retail contribution to overall revenue Figure 23: HK retail contribution to overall operating profit
20
30
40
50
60
70
80
Chow Tai Fook Chow Sang Sang Luk Fook
(%)
% of retail sales from HK - FY11
40
45
50
55
60
Chow Tai Fook Luk Fook
(%)
% of operating profit from HK - 1HFY3/12
Source: Company data, Credit Suisse estimates Source: Company data, Credit Suisse estimates

17 April 2012
Hong Kong Jewellery Sector 14
We prefer Chow Tai Fook over Luk Fook Based on the above analysis, we believe most of the Hong Kong listed jewellers would face downside earnings risks on slower revenue growth and rising margin pressure. And among the three, Luk Fook seems to be the one being most affected, on the back of its highest revenue contribution from Hong Kong retail business along with its lowest gold price hedging strategy.
Figure 24: Operation comparison in 1HFY3/12 Chow Tai Fook Chow Sang Sang Luk Fook
% of gold hedging 100 ~40 ~20
% of retail revenue from HK retail 44.1 46.4 74.0
% of operating profit from HK retail 51.0 n.a. 67.7
Rental cost as a % of retail revenue 6.6 3.4 3.9
Source: Company data. Note for Chow Sang Sang, data refer to 1HCY11
Our conclusion has actually been reflected in their share price performance, in which, Luk Fook experienced the worst performance YTD among the three major listed jewellers.
Figure 25: Share price performance comparison
60
80
100
120
140
Jan-12 Feb-12 Mar-12 Apr-12
Chow Sang Sang Chow Tai Fook Luk Fook
Source: DataStream
Luk Fook—pressure from both earnings cut and valuation de-rating In our view, Luk Fook’s downward share price performance has been led by both lower earnings expectation as well as valuation de-rating.
Given the lack of exceptional profit from gold price appreciation, (which accounted for about 20% of its net profit in 1HFY3/12), as well as its relatively small direct retail exposure in China, (which accounted for about 6% of its total revenue in FY3/12), Luk Fook may struggle to see positive earnings growth in 1HFY3/13. We revise our FY3/12–14 EPS forecast downwards for Luk Fook by 7–25%.
On the other hand, it is its business model—which is dependent on Hong Kong retail sales—that limits its ability to sustain a stable earnings growth. Further, its relatively loose gold price hedging strategy has also increased its earnings volatility. Thus, it is not
Revising down FY3/12-14 EPS forecast by 7-25%

17 April 2012
Hong Kong Jewellery Sector 15
unreasonable for Luk Fook to witness further valuation de-rating until its SSSG stabilises, which we believe will happen in 3QFY3/13.
Based on the above, we downgraded the stock to UNDERPERFORM with a new target price of HK$17.7, which is based on 8x FY3/13 P/E (or 0.85x PEG).
Figure 26 shows our sensitivity analysis on our target price range for Luk Fook based on different Hong Kong retail revenue and target FY3/13 P/E multiple. At the worst case scenario, if Hong Kong retail sales growth drops 10% YoY, and valuation multiple contracts to 6x FY3/13 P/E, share price of Luk Fook would drop to HK$10.50.
Figure 26: Sensitivity analysis—target price based on different Hong Kong retail sales
growth and target multiple assumptions FY3/13 retail sales growth in Hong Kong (%)
Luk Fook’s target price (HK$) -10 0 10 20 30
6 10.5 11.9 13.3 14.7 16.1
7 12.3 13.9 15.5 17.1 18.8
8 14.0 15.9 17.7 19.6 21.4
9 15.8 17.9 19.9 22.0 24.1
FY3/13 target P/E multiple (x)
10 17.5 19.8 22.2 24.5 26.8
Source: Credit Suisse estimates
Chow Tai Fook—POS expansion in China to sustain earnings growth On the other hand, we prefer Chow Tai Fook for its bigger and fast expanding China direct retail exposure along with its full gold price hedging strategy. These combined with its better brand recognition should offer more stable and sustainable earnings growth, and as such, Chow Tai Fook deserves to trade at a valuation premium over Luk Fook.
Nevertheless, we see limited near-term catalysts to get Chow Tai Fook re-rate from its current valuation of 14x FY3/14 P/E, especially when its peers are undergoing a de-rating.
We therefore maintain our NEUTRAL rating on Chow Tai Fook, with a new target price of HK$12.70, which is based on 15x FY3/13 P/E (or 0.44x PEG).

17 April 2012
Hong Kong Jewellery Sector 16
Asia Pacific / Hong Kong Luxury Goods
Chow Tai Fook Jewellery Group Limited (1929.HK / 1929 HK)
DECREASE TARGET PRICE
POS expansion to sustain earnings growth ■ Revising down FY3/12–14 EPS forecast by 3–9%: The fast decelerating
industry growth and the sluggish outlook on gold price, have prompted us to cut our FY3/12–14 earnings forecast by 3–9%. In our view, the stock lacks near-term catalysts as SSSG may decelerate further in 2QFY3/13.
■ Best-in-class brand recognition: Chow Tai Fook is a leading jeweller in China as well as in Hong Kong and Macau, with market shares of 12.6% and 20.1% in 2010, respectively. Its leading market shares in both the markets have been growing, and we expect them to grow further in future. It has an over 80-year history of operations, together with what we believe is the largest and most extensive retail network in the Greater China region of 1,506 POS as at 30 September 2011, creating a strong brand recognition.
■ Fast expanding POS network: Chow Tai Fook has been aggressively expanding POS network in China over the years. We project its POS to rise from 1,274 as at end of FY3/11 to 1,510 in FY3/12 and further increase to 1,720 in FY3/13. In our view, the fast store expansion and the ramping up of the recently opened stores should help sustain a relatively strong and more stable earnings growth, compared to its listed peers. On the other hand, its 100% gold price hedging strategy also eliminates fluctuations in profit margin.
■ Maintain NEUTRAL: While we believe Chow Tai Fook deserves to trade at a valuation premium over Luk Fook, we see limited near-term catalysts to get Chow Tai Fook re-rate from its current valuation of 14x FY3/14 P/E, especially when its peers are undergoing a de-rating and SSSG is likely to decelerate further in 2QFY3/13. We therefore maintain our NEUTRAL rating on Chow Tai Fook, with a new target price of HK$12.70, which is based on 15x FY3/13 P/E (or 0.44x PEG).
Share price performance
10
12
14
16
Dec-11
60
80
100
120Price (LHS) Rebased Rel (RHS)
The price relative chart measures performance against the MSCI CHINA F IDX which closed at 5988.1 on 17/04/12 On 17/04/12 the spot exchange rate was HK$7.76/US$1
Performance Over 1M 3M 12M Absolute (%) -6.3 -16.3 — Relative (%) -2.7 -20.7 —
Financial and valuation metrics
Year 3/11A 3/12E 3/13E 3/14E Revenue (HK$ mn) 35,042.5 55,912.6 77,788.8 107,191.7 EBITDA (HK$ mn) 4,893.9 8,732.8 11,820.2 16,278.7 EBIT (HK$ mn) 4,639.2 8,389.5 11,375.8 15,722.8 Net profit (HK$ mn) 3,537.6 6,299.2 8,428.6 11,503.3 EPS (CS adj.) (HK$) 0.40 0.68 0.84 1.15 Change from previous EPS (%) n.a. -3.2 -8.9 -7.0 Consensus EPS (HK$) n.a. 0.64 0.86 1.13 EPS growth (%) 65.4 72.2 23.9 36.5 P/E (x) 30.2 17.5 14.2 10.4 Dividend yield (%) 0.3 4.8 0.6 1.4 EV/EBITDA (x) 24.6 13.8 10.0 7.3 P/B (x) 9.5 3.9 3.2 2.5 ROE (%) 36.4 31.8 25.8 27.2 Net debt/equity (%) 10.3 4.8 net cash 0.3
Source: Company data, Thomson Reuters, Credit Suisse estimates.
*Stock ratings are relative to the relevant country benchmark. ¹Target price is for 12 months. [V] = Stock considered volatile (see Disclosure Appendix).
Research Analysts
Gabriel Chan, CFA 852 2101 6523
Rating NEUTRAL* [V] Price (17 Apr 12, HK$) 11.94 Target price (HK$) (from 15.72) 12.70¹ Chg to TP (%) 6.4 Market cap. (HK$ mn) 119,400 Enterprise value (HK$ mn) 120,789 Number of shares (mn) 10,000.00 Free float (%) 10.7 52-week price range 15.1 - 11.8

17 April 2012
Hong Kong Jewellery Sector 17
Chow Tai Fook Jewellery Group Limited 1929.HK / 1929 HK Price (17 Apr 12): HK$11.94, Rating:: NEUTRAL, Target Price: HK$12.70, Analyst: Gabriel Chan
Target price scenario Scenario TP %Up/Dwn Assumptions Upside 15.2 27.3 FY13E P/E of 18x Central Case 12.7 6.37 FY13E P/E of 15x Downside 10.1 (15.4) FY13E P/E of 12x
Key earnings drivers 3/11A 3/12E 3/13E 3/14E # of self-owned shops 965 1,124 1,257 1,354 # of franchisee shops 393.0 484.0 571.0 646.0 Revenue growth — 24.6 52.8 59.6 Gross margin (%) — — — — 28.3 29.5 29.4 29.3
Income statement (HK$ mn) 3/11A 3/12E 3/13E 3/14E Sales revenue 35,043 55,913 77,789 107,192 Cost of goods sold 25,115 39,437 54,925 75,784 SG&A — — — — Other operating exp./(inc.) 5,034 7,742 11,044 15,128 EBITDA 4,894 8,733 11,820 16,279 Depreciation & amortisation 254.7 343.3 444.4 555.9 EBIT 4,639 8,389 11,376 15,723 Net interest expense/(inc.) 102.2 177.0 250.4 316.9 Non-operating inc./(exp.) 70.3 71.9 107.4 155.9 Associates/JV (4.7) — — — Recurring PBT 4,603 8,284 11,233 15,562 Exceptionals/extraordinaries 17.2 — — — Taxes 947 1,740 2,471 3,579 Profit after tax 3,673 6,545 8,762 11,983 Other after tax income — — — — Minority interests 134.9 245.4 332.9 479.3 Preferred dividends — — — — Reported net profit 3,538 6,299 8,429 11,503 Analyst adjustments — — — — Net profit (Credit Suisse) 3,538 6,299 8,429 11,503
Cash flow (HK$ mn) 3/11A 3/12E 3/13E 3/14E EBIT 4,639 8,389 11,376 15,723 Net interest — — — — Tax paid (730) (353) (1,740) (2,471) Working capital (4,266) (17,867) (5,892) (12,438) Other cash & non-cash items 243.1 343.3 444.4 555.9 Operating cash flow (114) (9,488) 4,188 1,370 Capex (823.9) (587.1) (777.9) (857.5) Free cash flow to the firm (937) (10,075) 3,410 512 Disposals of fixed assets — — — — Acquisitions — — — — Divestments 2.4 — — — Associate investments — — — — Other investment/(outflows) 3.0 — — — Investing cash flow (818.5) (587.1) (777.9) (857.5) Equity raised 23 15,258 — — Dividends paid (309) (5,259) (699) (1,686) Net borrowings 4,463 4,537 2,751 3,457 Other financing cash flow 236.2 (105.1) (143.0) (161.0) Financing cash flow 4,413 14,430 1,909 1,610 Total cash flow 3,481 4,355 5,320 2,122 Adjustments — — — — Net change in cash 3,481 4,355 5,320 2,122
Balance sheet (HK$ mn) 3/11A 3/12E 3/13E 3/14E Cash & cash equivalents 5,605 9,960 15,280 17,402 Current receivables 1,632 2,235 3,113 4,342 Inventories 17,101 28,279 35,005 47,164 Other current assets 3,025 3,169 3,693 5,031 Current assets 27,363 43,643 57,090 73,940 Property, plant & equip. 1,165 1,409 1,743 2,044 Investments 45.2 45.2 45.2 45.2 Intangibles 156.3 156.3 156.3 156.3 Other non-current assets 319.0 447.7 583.0 768.0 Total assets 29,049 45,701 59,617 76,954 Accounts payable 10,048 3,533 4,915 6,773 Short-term debt 6,813 11,349 14,101 17,557 Current provisions — — — — Other current liabilities 353 1,740 2,471 3,579 Current liabilities 17,213 16,622 21,487 27,910 Long-term debt — — — — Non-current provisions 162.6 164.2 165.9 167.5 Other non-current liab. — — — — Total liabilities 17,376 16,786 21,653 28,078 Shareholders' equity 11,307 28,303 37,020 47,452 Minority interests 366 611 944 1,424 Total liabilities & equity 29,049 45,701 59,617 76,954
Per share data 3/11A 3/12E 3/13E 3/14E Shares (wtd avg.) (mn) 8,950 9,257 10,000 10,000 EPS (Credit Suisse) 0.40 0.68 0.84 1.15 DPS (HK$) 0.03 0.57 0.07 0.17 BVPS (HK$) 1.26 3.06 3.70 4.75 Operating CFPS (HK$) (0.01) (1.02) 0.42 0.14
Key ratios and valuation 3/11A 3/12E 3/13E 3/14E Growth(%) Sales revenue 52.8 59.6 39.1 37.8 EBIT 72.1 80.8 35.6 38.2 Net profit 65.4 78.1 33.8 36.5 EPS 65.4 72.2 23.9 36.5 Margins (%) EBITDA 14.0 15.6 15.2 15.2 EBIT 13.2 15.0 14.6 14.7 Pre-tax profit 13.1 14.8 14.4 14.5 Net profit 10.1 11.3 10.8 10.7 Valuation metrics (x) P/E 30.2 17.5 14.2 10.4 P/B 9.5 3.9 3.2 2.5 Dividend yield (%) 0.29 4.76 0.59 1.41 P/CF (942) (12) 29 87 EV/sales 3.44 2.16 1.52 1.12 EV/EBITDA 24.6 13.8 10.0 7.3 EV/EBIT 26.0 14.4 10.4 7.6 ROE analysis (%) ROE 36.4 31.8 25.8 27.2 ROIC 49.1 42.4 37.4 40.2 Asset turnover (x) 1.21 1.22 1.30 1.39 Interest burden (x) 0.99 0.99 0.99 0.99 Tax burden (x) 0.79 0.79 0.78 0.77 Financial leverage (x) 2.49 1.58 1.57 1.57 Credit ratios Net debt/equity (%) 10.3 4.8 (3.1) 0.3 Net debt/EBITDA (x) 0.25 0.16 (0.10) — Interest cover (x) 45.4 47.4 45.4 49.6
Source: Company data, Thomson Reuters, Credit Suisse estimates.
12MF P/E multiple
02468
10
1214161820
Jan-12 Feb-12 Mar-12
12MF P/B multiple
0.0
0.5
1.0
1.5
2.0
2.5
3.0
3.5
4.0
4.5
Jan-12 Feb-12 Mar-12
Source: IBES

17 April 2012
Hong Kong Jewellery Sector 18
Asia Pacific / Hong Kong Luxury Goods
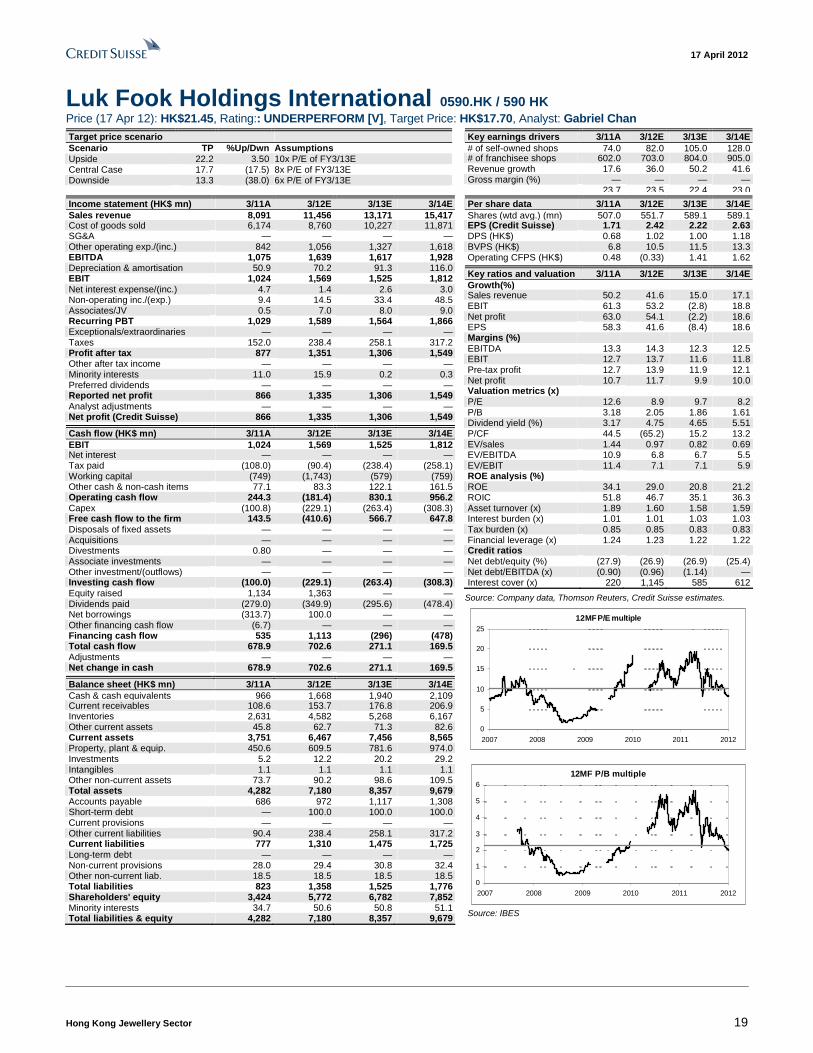
Luk Fook Holdings International (0590.HK / 590 HK)
DOWNGRADE RATING
Most impacted from weakened gold price ■ Downgrade to UNDERPERFORM: We downgrade Luk Fook from
Outperform to UNDERPERFORM with a target price cut to HK$17.70 from HK$37.80, as we believe the weakened gold price would have the most negative impact on Luk Fook, compared to its listed peers. We further believe the company may struggle to see positive earnings growth in 1HFY3/13, with SSSG likely to decelerate further in 2QFY3/13.
■ Gross margin set to deteriorate: Luk Fook benefited a lot from the realised gold inventory holding gain in 1HFY3/12, which as per our estimate accounted for almost 20% of its net profit during the period. With gold price unlikely to repeat the stronger upward trend as in the same period last year, Luk Fook’s gross margin for gold product is set to normalize.
■ Most focused on Hong Kong business: Among the major Hong Kong listed jewellers, Luk Fook has most of its revenue and profit generated from Hong Kong retail operation, which we believe is subject to higher pressure on the back of decelerating mainland Chinese visitation growth. On the other hand, the escalating retail rental, versus the softening SSSG presents additional pressure on operating margin.
■ De-rating may continue: Share price of Luk Fook has dropped by about 30% over the last few months on the back of weakened outlook. However, given its loose gold price hedging strategy as well as higher earnings concentration from Hong Kong retail operation, it is set to witness the most downside earnings pressure, and may result in YoY decline in 1HFY3/13 earnings. Therefore, we believe de-rating pressure may linger on until SSSG stabilises in 3QFY3/13. We revise our FY3/12–14 EPS forecast down for Luk Fook by 7–25%, and downgrade the stock to UNDERPERFORM with a new target price of HK$17.70, which is based on 8x FY3/13 P/E (or 0.85x PEG).
Share price performance
0
20
40
60
Apr-10 Aug-10 Dec-10 Apr-11 Aug-11 Dec-11
0
200
400
600Price (LHS) Rebased Rel (RHS)
The price relative chart measures performance against the HANG SENG INDEX which closed at 20562.31 on 17/04/12 On 17/04/12 the spot exchange rate was HK$7.76/US$1
Performance Over 1M 3M 12M Absolute (%) -21.3 -34.3 -23.7 Relative (%) -18.5 -37.4 -7.8
Financial and valuation metrics
Year 3/11A 3/12E 3/13E 3/14E Revenue (HK$ mn) 8,091.1 11,455.9 13,170.7 15,417.0 EBITDA (HK$ mn) 1,074.9 1,639.1 1,616.7 1,927.6 EBIT (HK$ mn) 1,024.0 1,568.9 1,525.4 1,811.6 Net profit (HK$ mn) 866.2 1,334.8 1,305.8 1,548.6 EPS (CS adj.) (HK$) 1.71 2.42 2.22 2.63 Change from previous EPS (%) n.a. -7.1 -23.8 -25.1 Consensus EPS (HK$) n.a. 2.38 2.59 3.01 EPS growth (%) 58.3 41.6 -8.4 18.6 P/E (x) 12.6 8.9 9.7 8.2 Dividend yield (%) 3.2 4.8 4.7 5.5 EV/EBITDA (x) 10.9 6.8 6.7 5.5 P/B (x) 3.2 2.1 1.9 1.6 ROE (%) 34.1 29.0 20.8 21.2 Net debt/equity (%) net cash net cash net cash net cash
Source: Company data, Thomson Reuters, Credit Suisse estimates.
*Stock ratings are relative to the relevant country benchmark. ¹Target price is for 12 months. [V] = Stock considered volatile (see Disclosure Appendix).
Research Analysts
Gabriel Chan, CFA 852 2101 6523
Rating (from Outperform) UNDERPERFORM* [V] Price (17 Apr 12, HK$) 21.45 Target price (HK$) (from 37.80) 17.70¹ Chg to TP (%) -17.5 Market cap. (HK$ mn) 12,636 Enterprise value (HK$ mn) 11,068 Number of shares (mn) 589.11 Free float (%) 54.7 52-week price range 44.8 - 19.4
17 April 2012
Hong Kong Jewellery Sector 19
Luk Fook Holdings International 0590.HK / 590 HK Price (17 Apr 12): HK$21.45, Rating:: UNDERPERFORM [V], Target Price: HK$17.70, Analyst: Gabriel Chan
Target price scenario Scenario TP %Up/Dwn Assumptions Upside 22.2 3.50 10x P/E of FY3/13E Central Case 17.7 (17.5) 8x P/E of FY3/13E Downside 13.3 (38.0) 6x P/E of FY3/13E
Key earnings drivers 3/11A 3/12E 3/13E 3/14E # of self-owned shops 74.0 82.0 105.0 128.0 # of franchisee shops 602.0 703.0 804.0 905.0 Revenue growth 17.6 36.0 50.2 41.6 Gross margin (%) — — — — 23.7 23.5 22.4 23.0
Income statement (HK$ mn) 3/11A 3/12E 3/13E 3/14E Sales revenue 8,091 11,456 13,171 15,417 Cost of goods sold 6,174 8,760 10,227 11,871 SG&A — — — — Other operating exp./(inc.) 842 1,056 1,327 1,618 EBITDA 1,075 1,639 1,617 1,928 Depreciation & amortisation 50.9 70.2 91.3 116.0 EBIT 1,024 1,569 1,525 1,812 Net interest expense/(inc.) 4.7 1.4 2.6 3.0 Non-operating inc./(exp.) 9.4 14.5 33.4 48.5 Associates/JV 0.5 7.0 8.0 9.0 Recurring PBT 1,029 1,589 1,564 1,866 Exceptionals/extraordinaries — — — — Taxes 152.0 238.4 258.1 317.2 Profit after tax 877 1,351 1,306 1,549 Other after tax income — — — — Minority interests 11.0 15.9 0.2 0.3 Preferred dividends — — — — Reported net profit 866 1,335 1,306 1,549 Analyst adjustments — — — — Net profit (Credit Suisse) 866 1,335 1,306 1,549
Cash flow (HK$ mn) 3/11A 3/12E 3/13E 3/14E EBIT 1,024 1,569 1,525 1,812 Net interest — — — — Tax paid (108.0) (90.4) (238.4) (258.1) Working capital (749) (1,743) (579) (759) Other cash & non-cash items 77.1 83.3 122.1 161.5 Operating cash flow 244.3 (181.4) 830.1 956.2 Capex (100.8) (229.1) (263.4) (308.3) Free cash flow to the firm 143.5 (410.6) 566.7 647.8 Disposals of fixed assets — — — — Acquisitions — — — — Divestments 0.80 — — — Associate investments — — — — Other investment/(outflows) — — — — Investing cash flow (100.0) (229.1) (263.4) (308.3) Equity raised 1,134 1,363 — — Dividends paid (279.0) (349.9) (295.6) (478.4) Net borrowings (313.7) 100.0 — — Other financing cash flow (6.7) — — — Financing cash flow 535 1,113 (296) (478) Total cash flow 678.9 702.6 271.1 169.5 Adjustments — — — — Net change in cash 678.9 702.6 271.1 169.5
Balance sheet (HK$ mn) 3/11A 3/12E 3/13E 3/14E Cash & cash equivalents 966 1,668 1,940 2,109 Current receivables 108.6 153.7 176.8 206.9 Inventories 2,631 4,582 5,268 6,167 Other current assets 45.8 62.7 71.3 82.6 Current assets 3,751 6,467 7,456 8,565 Property, plant & equip. 450.6 609.5 781.6 974.0 Investments 5.2 12.2 20.2 29.2 Intangibles 1.1 1.1 1.1 1.1 Other non-current assets 73.7 90.2 98.6 109.5 Total assets 4,282 7,180 8,357 9,679 Accounts payable 686 972 1,117 1,308 Short-term debt — 100.0 100.0 100.0 Current provisions — — — — Other current liabilities 90.4 238.4 258.1 317.2 Current liabilities 777 1,310 1,475 1,725 Long-term debt — — — — Non-current provisions 28.0 29.4 30.8 32.4 Other non-current liab. 18.5 18.5 18.5 18.5 Total liabilities 823 1,358 1,525 1,776 Shareholders' equity 3,424 5,772 6,782 7,852 Minority interests 34.7 50.6 50.8 51.1 Total liabilities & equity 4,282 7,180 8,357 9,679
Per share data 3/11A 3/12E 3/13E 3/14E Shares (wtd avg.) (mn) 507.0 551.7 589.1 589.1 EPS (Credit Suisse) 1.71 2.42 2.22 2.63 DPS (HK$) 0.68 1.02 1.00 1.18 BVPS (HK$) 6.8 10.5 11.5 13.3 Operating CFPS (HK$) 0.48 (0.33) 1.41 1.62
Key ratios and valuation 3/11A 3/12E 3/13E 3/14E Growth(%) Sales revenue 50.2 41.6 15.0 17.1 EBIT 61.3 53.2 (2.8) 18.8 Net profit 63.0 54.1 (2.2) 18.6 EPS 58.3 41.6 (8.4) 18.6 Margins (%) EBITDA 13.3 14.3 12.3 12.5 EBIT 12.7 13.7 11.6 11.8 Pre-tax profit 12.7 13.9 11.9 12.1 Net profit 10.7 11.7 9.9 10.0 Valuation metrics (x) P/E 12.6 8.9 9.7 8.2 P/B 3.18 2.05 1.86 1.61 Dividend yield (%) 3.17 4.75 4.65 5.51 P/CF 44.5 (65.2) 15.2 13.2 EV/sales 1.44 0.97 0.82 0.69 EV/EBITDA 10.9 6.8 6.7 5.5 EV/EBIT 11.4 7.1 7.1 5.9 ROE analysis (%) ROE 34.1 29.0 20.8 21.2 ROIC 51.8 46.7 35.1 36.3 Asset turnover (x) 1.89 1.60 1.58 1.59 Interest burden (x) 1.01 1.01 1.03 1.03 Tax burden (x) 0.85 0.85 0.83 0.83 Financial leverage (x) 1.24 1.23 1.22 1.22 Credit ratios Net debt/equity (%) (27.9) (26.9) (26.9) (25.4) Net debt/EBITDA (x) (0.90) (0.96) (1.14) — Interest cover (x) 220 1,145 585 612
Source: Company data, Thomson Reuters, Credit Suisse estimates.
12MF P/E multiple
0
5
10
15
20
25
2007 2008 2009 2010 2011 2012
12MF P/B multiple
0
1
2
3
4
5
6
2007 2008 2009 2010 2011 2012
Source: IBES

17 April 2012
Hong Kong Jewellery Sector 20
Companies Mentioned (Price as of 17 Apr 12) Chow Sang Sang (0116.HK, HK$20.00, NOT RATED) Chow Tai Fook Jewellery Group Limited (1929.HK, HK$11.94, NEUTRAL [V], TP HK$12.70) Luk Fook Holdings International (0590.HK, HK$21.45, UNDERPERFORM [V], TP HK$17.70)
Disclosure Appendix Important Global Disclosures Gabriel Chan, CFA & Isis Wong each certify, with respect to the companies or securities that he or she analyzes, that (1) the views expressed in this report accurately reflect his or her personal views about all of the subject companies and securities and (2) no part of his or her compensation was, is or will be directly or indirectly related to the specific recommendations or views expressed in this report.
See the Companies Mentioned section for full company names. 3-Year Price, Target Price and Rating Change History Chart for 1929.HK 1929.HK Closing
Price Target
Price
Initiation/ Date (HK$) (HK$) Rating Assumption 2-Feb-12 13.84 15.72 N X
16
2-Feb-12
N
11
12
13
14
15
16
17
18-A
pr-09
18-Jun
-09
18-A
ug-09
18-O
ct-09
18-Dec
-09
18-Feb-1
0
18-Apr-
10
18-Jun
-10
18-A
ug-10
18-Oct-
10
18-Dec-1
0
18-Feb-1
1
18-Apr-1
1
18-Jun
-11
18-A
ug-11
18-Oct-
11
18-D
ec-11
18-Feb-1
2
Closing Price Target Price Initiation/Assumption Rating
HK$
O=Outperform; N=Neutral; U=Underperform; R=Restricted; NR=Not Rated; NC=Not Covered
3-Year Price, Target Price and Rating Change History Chart for 0590.HK 0590.HK Closing
Price Target
Price
Initiation/ Date (HK$) (HK$) Rating Assumption 5-Jan-11 26.95 33.8 O X 21-Apr-11 29 35 30-Jun-11 37.75 45 2-Aug-11 43.7 51.75 27-Sep-11 25.3 35 29-Nov-11 30.15 37.8
34 35
45
52
3538
5-Jan-11
O
2
12
22
32
42
52
18-A
pr-09
18-Jun
-09
18-A
ug-09
18-O
ct-09
18-Dec
-09
18-Feb-1
0
18-Apr-
10
18-Jun
-10
18-A
ug-10
18-Oct-
10
18-Dec-1
0
18-Feb-1
1
18-Apr-1
1
18-Jun
-11
18-A
ug-11
18-Oct-
11
18-D
ec-11
18-Feb-1
2
Closing Price Target Price Initiation/Assumption Rating
HK$
O=Outperform; N=Neutral; U=Underperform; R=Restricted; NR=Not Rated; NC=Not Covered
The analyst(s) responsible for preparing this research report received compensation that is based upon various factors including Credit Suisse's total revenues, a portion of which are generated by Credit Suisse's investment banking activities. Analysts’ stock ratings are defined as follows: Outperform (O): The stock’s total return is expected to outperform the relevant benchmark* by at least 10-15% (or more, depending on perceived risk) over the next 12 months. Neutral (N): The stock’s total return is expected to be in line with the relevant benchmark* (range of ±10-15%) over the next 12 months. Underperform (U): The stock’s total return is expected to underperform the relevant benchmark* by 10-15% or more over the next 12 months. *Relevant benchmark by region: As of 29th May 2009, Australia, New Zealand, U.S. and Canadian ratings are based on (1) a stock’s absolute total return potential to its current share price and (2) the relative attractiveness of a stock’s total return potential within an analyst’s coverage universe**, with Outperforms representing the most attractive, Neutrals the less attractive, and Underperforms the least attractive investment opportunities. Some U.S. and Canadian ratings may fall outside the absolute total return ranges defined above, depending on market conditions and industry factors. For Latin American, Japanese, and non-Japan Asia stocks, ratings are based on a stock’s total return relative to the average total return of the relevant country or regional benchmark; for European stocks, ratings are based on a stock’s total return relative to the analyst's coverage universe**. For Australian and New Zealand stocks, 12-month rolling yield is incorporated in the absolute total return calculation and a 15% and a

17 April 2012
Hong Kong Jewellery Sector 21
7.5% threshold replace the 10-15% level in the Outperform and Underperform stock rating definitions, respectively. The 15% and 7.5% thresholds replace the +10-15% and -10-15% levels in the Neutral stock rating definition, respectively. **An analyst's coverage universe consists of all companies covered by the analyst within the relevant sector. Restricted (R): In certain circumstances, Credit Suisse policy and/or applicable law and regulations preclude certain types of communications, including an investment recommendation, during the course of Credit Suisse's engagement in an investment banking transaction and in certain other circumstances. Volatility Indicator [V]: A stock is defined as volatile if the stock price has moved up or down by 20% or more in a month in at least 8 of the past 24 months or the analyst expects significant volatility going forward.
Analysts’ coverage universe weightings are distinct from analysts’ stock ratings and are based on the expected performance of an analyst’s coverage universe* versus the relevant broad market benchmark**: Overweight: Industry expected to outperform the relevant broad market benchmark over the next 12 months. Market Weight: Industry expected to perform in-line with the relevant broad market benchmark over the next 12 months. Underweight: Industry expected to underperform the relevant broad market benchmark over the next 12 months. *An analyst’s coverage universe consists of all companies covered by the analyst within the relevant sector. **The broad market benchmark is based on the expected return of the local market index (e.g., the S&P 500 in the U.S.) over the next 12 months. Credit Suisse’s distribution of stock ratings (and banking clients) is:
Global Ratings Distribution Outperform/Buy* 46% (59% banking clients) Neutral/Hold* 42% (58% banking clients) Underperform/Sell* 10% (51% banking clients) Restricted 2%
*For purposes of the NYSE and NASD ratings distribution disclosure requirements, our stock ratings of Outperform, Neutral, and Underperform most closely correspond to Buy, Hold, and Sell, respectively; however, the meanings are not the same, as our stock ratings are determined on a relative basis. (Please refer to definitions above.) An investor's decision to buy or sell a security should be based on investment objectives, current holdings, and other individual factors.
Credit Suisse’s policy is to update research reports as it deems appropriate, based on developments with the subject company, the sector or the market that may have a material impact on the research views or opinions stated herein.
Credit Suisse's policy is only to publish investment research that is impartial, independent, clear, fair and not misleading. For more detail please refer to Credit Suisse's Policies for Managing Conflicts of Interest in connection with Investment Research: http://www.csfb.com/research-and-analytics/disclaimer/managing_conflicts_disclaimer.html
Credit Suisse does not provide any tax advice. Any statement herein regarding any US federal tax is not intended or written to be used, and cannot be used, by any taxpayer for the purposes of avoiding any penalties.
See the Companies Mentioned section for full company names. Price Target: (12 months) for (1929.HK) Method: Our target price of HK$12.70 was set by applying FY3/13 P/E of 15x which is a premium of 35-40% to peers' CY12 P/E given its strong earnings quality and brand recognition. Risks: Key risks to our target price of HK$12.70 for CTF include: (1) slowdown in the retail market in the Greater China region; (2) higher-than-expected increase in rental costs; (3) slowdown in travel flow; and (4) failure to uphold product control and monitor sales through franchisees. Price Target: (12 months) for (0590.HK) Method: Our TP of HK$17.70 for Luk Fook is based on 8x FY3/13 P/E (price-to-earnings ratio), translating to PEG of 0.85x. Our valuation target also implies 10% discount to major Chinese high-end retailers as well as more volatile earnings as compared to peers given its lower gold hedging ratio. Risks: Risks that could cause the share price to diverge from our HK$17.70 target price for Luk Fook Holdings International include: a dramatic increase in the price of gold, the launch of QE3, or other macro factors which would boost demand for gold. Please refer to the firm's disclosure website at www.credit-suisse.com/researchdisclosures for the definitions of abbreviations typically used in the target price method and risk sections.
See the Companies Mentioned section for full company names. The subject company (1929.HK) currently is, or was during the 12-month period preceding the date of distribution of this report, a client of Credit Suisse. Credit Suisse provided investment banking services to the subject company (1929.HK) within the past 12 months. Credit Suisse has managed or co-managed a public offering of securities for the subject company (1929.HK) within the past 12 months. Credit Suisse has received investment banking related compensation from the subject company (1929.HK) within the past 12 months. Credit Suisse expects to receive or intends to seek investment banking related compensation from the subject company (1929.HK, 0590.HK) within the next 3 months. Important Regional Disclosures Singapore recipients should contact a Singapore financial adviser for any matters arising from this research report.
The analyst(s) involved in the preparation of this report have not visited the material operations of the subject company (1929.HK, 0590.HK) within the past 12 months.

17 April 2012
Hong Kong Jewellery Sector 22
Restrictions on certain Canadian securities are indicated by the following abbreviations: NVS--Non-Voting shares; RVS--Restricted Voting Shares; SVS--Subordinate Voting Shares. Individuals receiving this report from a Canadian investment dealer that is not affiliated with Credit Suisse should be advised that this report may not contain regulatory disclosures the non-affiliated Canadian investment dealer would be required to make if this were its own report. For Credit Suisse Securities (Canada), Inc.'s policies and procedures regarding the dissemination of equity research, please visit http://www.csfb.com/legal_terms/canada_research_policy.shtml.
As of the date of this report, Credit Suisse acts as a market maker or liquidity provider in the equities securities that are the subject of this report.
Principal is not guaranteed in the case of equities because equity prices are variable. Commission is the commission rate or the amount agreed with a customer when setting up an account or at anytime after that. Taiwanese Disclosures: This research report is for reference only. Investors should carefully consider their own investment risk. Investment results are the responsibility of the individual investor. Reports may not be reprinted without permission of CS. Reports written by Taiwan-based analysts on non-Taiwan listed companies are not considered recommendations to buy or sell securities under Taiwan Stock Exchange Operational Regulations Governing Securities Firms Recommending Trades in Securities to Customers. To the extent this is a report authored in whole or in part by a non-U.S. analyst and is made available in the U.S., the following are important disclosures regarding any non-U.S. analyst contributors: The non-U.S. research analysts listed below (if any) are not registered/qualified as research analysts with FINRA. The non-U.S. research analysts listed below may not be associated persons of CSSU and therefore may not be subject to the NASD Rule 2711 and NYSE Rule 472 restrictions on communications with a subject company, public appearances and trading securities held by a research analyst account. • Gabriel Chan, CFA, non-U.S. analyst, is a research analyst employed by Credit Suisse (Hong Kong) Limited. • Isis Wong, non-U.S. analyst, is a research analyst employed by Credit Suisse (Hong Kong) Limited. For Credit Suisse disclosure information on other companies mentioned in this report, please visit the website at www.credit-suisse.com/researchdisclosures or call +1 (877) 291-2683. Disclaimers continue on next page.

17 April 2012 Asia Pacific / Hong Kong
Equity Research
CS0602.doc
This report is not directed to, or intended for distribution to or use by, any person or entity who is a citizen or resident of or located in any locality, state, country or other jurisdiction where such distribution, publication, availability or use would be contrary to law or regulation or which would subject Credit Suisse AG, the Swiss bank, or its subsidiaries or its affiliates (“CS”) to any registration or licensing requirement within such jurisdiction. All material presented in this report, unless specifically indicated otherwise, is under copyright to CS. None of the material, nor its content, nor any copy of it, may be altered in any way, transmitted to, copied or distributed to any other party, without the prior express written permission of CS. All trademarks, service marks and logos used in this report are trademarks or service marks or registered trademarks or service marks of CS or its affiliates. The information, tools and material presented in this report are provided to you for information purposes only and are not to be used or considered as an offer or the solicitation of an offer to sell or to buy or subscribe for securities or other financial instruments. CS may not have taken any steps to ensure that the securities referred to in this report are suitable for any particular investor. CS will not treat recipients as its customers by virtue of their receiving the report. The investments or services contained or referred to in this report may not be suitable for you and it is recommended that you consult an independent investment advisor if you are in doubt about such investments or investment services. Nothing in this report constitutes investment, legal, accounting or tax advice or a representation that any investment or strategy is suitable or appropriate to your individual circumstances or otherwise constitutes a personal recommendation to you. CS does not offer advice on the tax consequences of investment and you are advised to contact an independent tax adviser. Please note in particular that the bases and levels of taxation may change. CS believes the information and opinions in the Disclosure Appendix of this report are accurate and complete. Information and opinions presented in the other sections of the report were obtained or derived from sources CS believes are reliable, but CS makes no representations as to their accuracy or completeness. Additional information is available upon request. CS accepts no liability for loss arising from the use of the material presented in this report, except that this exclusion of liability does not apply to the extent that liability arises under specific statutes or regulations applicable to CS. This report is not to be relied upon in substitution for the exercise of independent judgment. CS may have issued, and may in the future issue, a trading call regarding this security. Trading calls are short term trading opportunities based on market events and catalysts, while stock ratings reflect investment recommendations based on expected total return over a 12-month period as defined in the disclosure section. Because trading calls and stock ratings reflect different assumptions and analytical methods, trading calls may differ directionally from the stock rating. In addition, CS may have issued, and may in the future issue, other reports that are inconsistent with, and reach different conclusions from, the information presented in this report. Those reports reflect the different assumptions, views and analytical methods of the analysts who prepared them and CS is under no obligation to ensure that such other reports are brought to the attention of any recipient of this report. CS is involved in many businesses that relate to companies mentioned in this report. These businesses include specialized trading, risk arbitrage, market making, and other proprietary trading. Past performance should not be taken as an indication or guarantee of future performance, and no representation or warranty, express or implied, is made regarding future performance. Information, opinions and estimates contained in this report reflect a judgement at its original date of publication by CS and are subject to change without notice. The price, value of and income from any of the securities or financial instruments mentioned in this report can fall as well as rise. The value of securities and financial instruments is subject to exchange rate fluctuation that may have a positive or adverse effect on the price or income of such securities or financial instruments. Investors in securities such as ADR’s, the values of which are influenced by currency volatility, effectively assume this risk. Structured securities are complex instruments, typically involve a high degree of risk and are intended for sale only to sophisticated investors who are capable of understanding and assuming the risks involved. The market value of any structured security may be affected by changes in economic, financial and political factors (including, but not limited to, spot and forward interest and exchange rates), time to maturity, market conditions and volatility, and the credit quality of any issuer or reference issuer. Any investor interested in purchasing a structured product should conduct their own investigation and analysis of the product and consult with their own professional advisers as to the risks involved in making such a purchase. Some investments discussed in this report have a high level of volatility. High volatility investments may experience sudden and large falls in their value causing losses when that investment is realised. Those losses may equal your original investment. Indeed, in the case of some investments the potential losses may exceed the amount of initial investment, in such circumstances you may be required to pay more money to support those losses. Income yields from investments may fluctuate and, in consequence, initial capital paid to make the investment may be used as part of that income yield. Some investments may not be readily realisable and it may be difficult to sell or realise those investments, similarly it may prove difficult for you to obtain reliable information about the value, or risks, to which such an investment is exposed. This report may provide the addresses of, or contain hyperlinks to, websites. Except to the extent to which the report refers to website material of CS, CS has not reviewed the linked site and takes no responsibility for the content contained therein. Such address or hyperlink (including addresses or hyperlinks to CS’s own website material) is provided solely for your convenience and information and the content of the linked site does not in any way form part of this document. Accessing such website or following such link through this report or CS’s website shall be at your own risk. This report is issued and distributed in Europe (except Switzerland) by Credit Suisse Securities (Europe) Limited, One Cabot Square, London E14 4QJ, England, which is regulated in the United Kingdom by The Financial Services Authority (“FSA”). This report is being distributed in Germany by Credit Suisse Securities (Europe) Limited Niederlassung Frankfurt am Main regulated by the Bundesanstalt fuer Finanzdienstleistungsaufsicht ("BaFin"). This report is being distributed in the United States by Credit Suisse Securities (USA) LLC ; in Switzerland by Credit Suisse AG; in Canada by Credit Suisse Securities (Canada), Inc.; in Brazil by Banco de Investimentos Credit Suisse (Brasil) S.A. or its affiliates; in Mexico by Banco Credit Suisse (México), S.A. (transactions related to the securities mentioned in this report will only be effected in compliance with applicable regulation); in Japan by Credit Suisse Securities (Japan) Limited, Financial Instrument Firm, Director-General of Kanto Local Finance Bureau (Kinsho) No. 66, a member of Japan Securities Dealers Association, The Financial Futures Association of Japan, Japan Securities Investment Advisers Association, Type II Financial Instruments Firms Association; elsewhere in Asia/Pacific by whichever of the following is the appropriately authorised entity in the relevant jurisdiction: Credit Suisse (Hong Kong) Limited, Credit Suisse Equities (Australia) Limited , Credit Suisse Securities (Thailand) Limited, Credit Suisse Securities (Malaysia) Sdn Bhd, Credit Suisse AG, Singapore Branch, Credit Suisse Securities (India) Private Limited regulated by the Securities and Exchange Board of India (registration Nos. INB230970637; INF230970637; INB010970631; INF010970631), having registered address at 9th Floor, Ceejay House,Dr.A.B. Road, Worli, Mumbai - 18, India, T- +91-22 6777 3777, Credit Suisse Securities (Europe) Limited, Seoul Branch, Credit Suisse AG, Taipei Securities Branch, PT Credit Suisse Securities Indonesia, Credit Suisse Securities (Philippines ) Inc., and elsewhere in the world by the relevant authorised affiliate of the above. Research on Taiwanese securities produced by Credit Suisse AG, Taipei Securities Branch has been prepared by a registered Senior Business Person. Research provided to residents of Malaysia is authorised by the Head of Research for Credit Suisse Securities (Malaysia) Sdn. Bhd., to whom they should direct any queries on +603 2723 2020. In jurisdictions where CS is not already registered or licensed to trade in securities, transactions will only be effected in accordance with applicable securities legislation, which will vary from jurisdiction to jurisdiction and may require that the trade be made in accordance with applicable exemptions from registration or licensing requirements. Non-U.S. customers wishing to effect a transaction should contact a CS entity in their local jurisdiction unless governing law permits otherwise. U.S. customers wishing to effect a transaction should do so only by contacting a representative at Credit Suisse Securities (USA) LLC in the U.S. Please note that this report was originally prepared and issued by CS for distribution to their market professional and institutional investor customers. Recipients who are not market professional or institutional investor customers of CS should seek the advice of their independent financial advisor prior to taking any investment decision based on this report or for any necessary explanation of its contents. This research may relate to investments or services of a person outside of the UK or to other matters which are not regulated by the FSA or in respect of which the protections of the FSA for private customers and/or the UK compensation scheme may not be available, and further details as to where this may be the case are available upon request in respect of this report. Any Nielsen Media Research material contained in this report represents Nielsen Media Research's estimates and does not represent facts. NMR has neither reviewed nor approved this report and/or any of the statements made herein. If this report is being distributed by a financial institution other than Credit Suisse AG, or its affiliates, that financial institution is solely responsible for distribution. Clients of that institution should contact that institution to effect a transaction in the securities mentioned in this report or require further information. This report does not constitute investment advice by Credit Suisse to the clients of the distributing financial institution, and neither Credit Suisse AG, its affiliates, and their respective officers, directors and employees accept any liability whatsoever for any direct or consequential loss arising from their use of this report or its content. Copyright 2012 CREDIT SUISSE AG and/or its affiliates. All rights reserved.
CREDIT SUISSE (Hong Kong) Limited Asia/Pacific: +852 2101-6000