sequential synchronous circuit analysis
TRANSCRIPT

Sequential Synchronous Circuit Analysis
General Model• Current State at time (t) is stored in an array of flip-flops.• Next State at time (t+1) is a Boolean function of State and
Inputs.• Outputs at time (t) are a Boolean function of State(t) and
(Mealy) of Inputs (t).
Combina-tionalLogic
Inputs
StateNextState
Outputs
Storage Elements
CLK

Example 1: Analysis
Input: x(t) Output: y(t) State: (A(t), B(t)) What is the Output
Function?
What is the Next State Function?
y(t) = x(t)(B(t) + A(t))
C
D Q
Q
C
D Q
Q'
y
x A
A
B
CP
Next State
Output
B
A(t+1) = A(t)x(t) + B(t)x(t)B(t+1) = A(t)x(t)

State Table Characteristics
State table – a multiple variable table with the following four sections:• Present State – the values of the state variables for
each allowed state.• Input – the input combinations allowed.• Next-state – the value of the state at time (t+1) based
on the present state and the input.• Output – the value of the output as a function of the
present state and (Mealy) the input. From the viewpoint of a truth table:
• the inputs are Input, Present State• and the outputs are Output, Next State

Example 1: Alternate State Table
A+ = A x + B xB+ = A xy = x (B + A)
The time sequence of inputs, outputs, and flip-flop states can be enumerated in a state table (sometimes called transition table).
A(t+1) = A(t) x(t) + B(t) x(t)B(t+1) = A(t) x(t)y(t) = x(t) (B(t) + A(t))
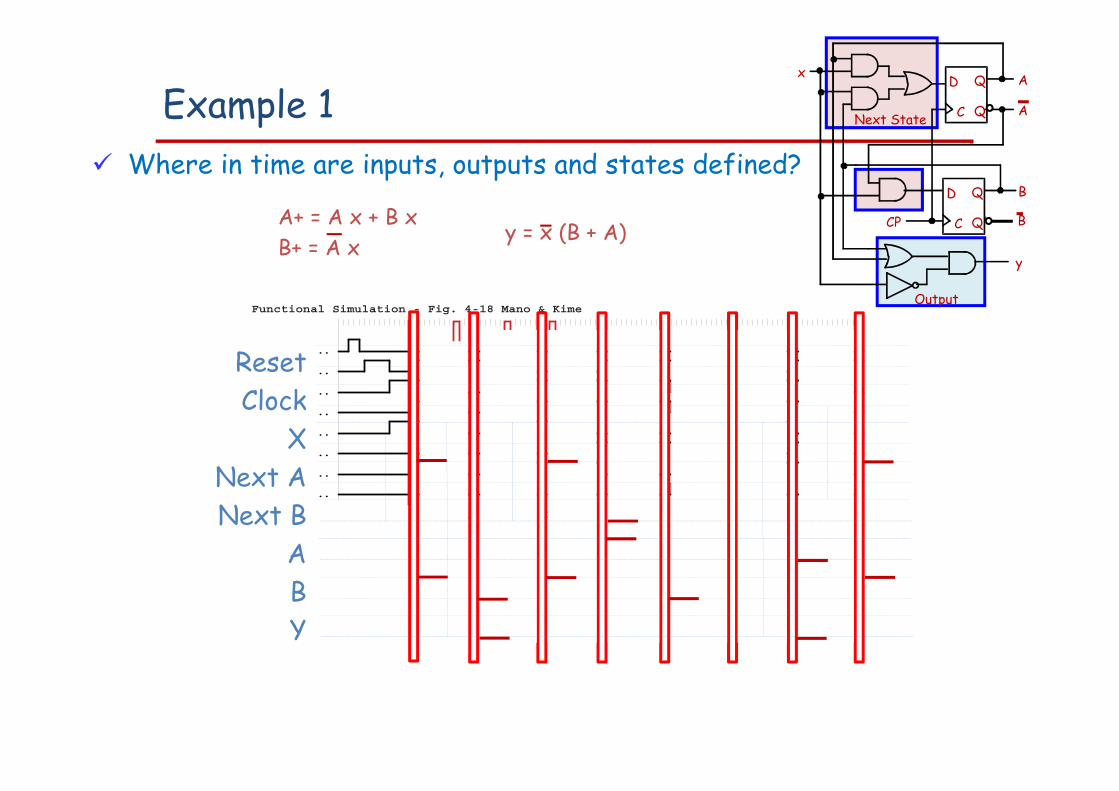
Example 1 Where in time are inputs, outputs and states defined?
0.0 53ns 106ns 159ns 212ns 265ns 318ns 371ns 424ns 477ns 530ns
l RESET..........
l CLOCK..........
l X..............
l NA.............
l NB.............
l A..............
l B..............
l Y..............
l
i
Functional Simulation - Fig. 4-18 Mano & Kime
t t+1 t+2 t+3
A+ = A x + B xB+ = A x
y = x (B + A)
ResetClock
XNext ANext B
ABY
C
D Q
Q
C
D Q
Q'
y
x A
A
B
CP
Next State
Output
B

State Diagrams
The sequential circuit function can be represented in graphical form as a state diagram with the following components:• A circle with the state name in it for each state• A directed arc from the Present State to the Next State for
each state transition• A label on each directed arc with the Input values which causes
the state transition, and• A label:
On each circle with the output value produced: Moore type
or On each directed arc with the output value produced:Mealy type.

Example 1: State Diagram
Diagram getsconfusing forlarge circuits
For small circuits,usually easier tounderstand thanthe state table
A B0 0
0 1 1 1
1 0
0/11/0
1/01/0
0/1
0/1
1/0
0/0
1/0 : means input x = 1output y = 0
A+ = A x + B xB+ = A xy = x (B + A)
Mealy

8
Analysis with JK Flip-Flops
JA = B KA = B xJB = x KB = Ax + Ax = A x
Moore

9
Analysis with JK Flip-Flop The circuit can be specified by the flip-flop input equations:
JA = B KA = B xJB = x KB = Ax + Ax = A x

10
Analysis with JK Flip-Flops
A+ = JA + KAB+ = JB + KB
Substituting the values of JA and KA from the input equations, we obtain the state equation for A:
A = BA + (Bx)A = AB + AB +Ax The state equation provides the bit values for the column under
next state of A in the state table. Similarly, the state equation for flip-flop B can be derived from the characteristic equation by substituting the values of JB and KB:
B = xB + (A x)B = Bx + ABx + ABx
JA = B KA = B xJB = x KB = Ax + Ax = A x

11
Analysis with JK Flip-Flops The state diagram of the sequential circuit is:
A = BA + (Bx)A = AB + AB +Ax
B = xB + (A x)B = Bx + ABx + ABx
Moore

12
Analysis With T Flip-Flops Characteristic equation:
Q = T Q
TA = B xTB = x
y = A B
Moore

13
Analysis With T Flip-Flops Consider the previous sequential circuit. It has two flip-flops A
and B, one input x, and one output y. It can be described algebraically by two input equations and an output equation:
TA = B xTB = x y = A B
A=(Bx)A+(Bx)A
=AB+Ax+ABxB=xB

14
Analysis With T Flip-Flops Characteristic equation:
Q(t + 1) = T Q00/0 : means state is 00
and output is 0

Sequential Circuit Analysis
Initialization: reset to (0, 0, 0)
Equations: A = B CB = B C + B CC = A C
Z = AClockReset
D
QC
Q
R
D
QC
Q
R
D
QC
Q
R
A
B
C
Z
Moore

Example 2: State Table
A B C A’ B’ C’ Z0 0 00 0 10 1 00 1 11 0 01 0 11 1 01 1 1
(t+1)
0 0 10 1 00 1 11 0 00 0 00 1 00 1 01 0 0
00001111
(t)
A = B CB = B C + B CC = A C
Z = A
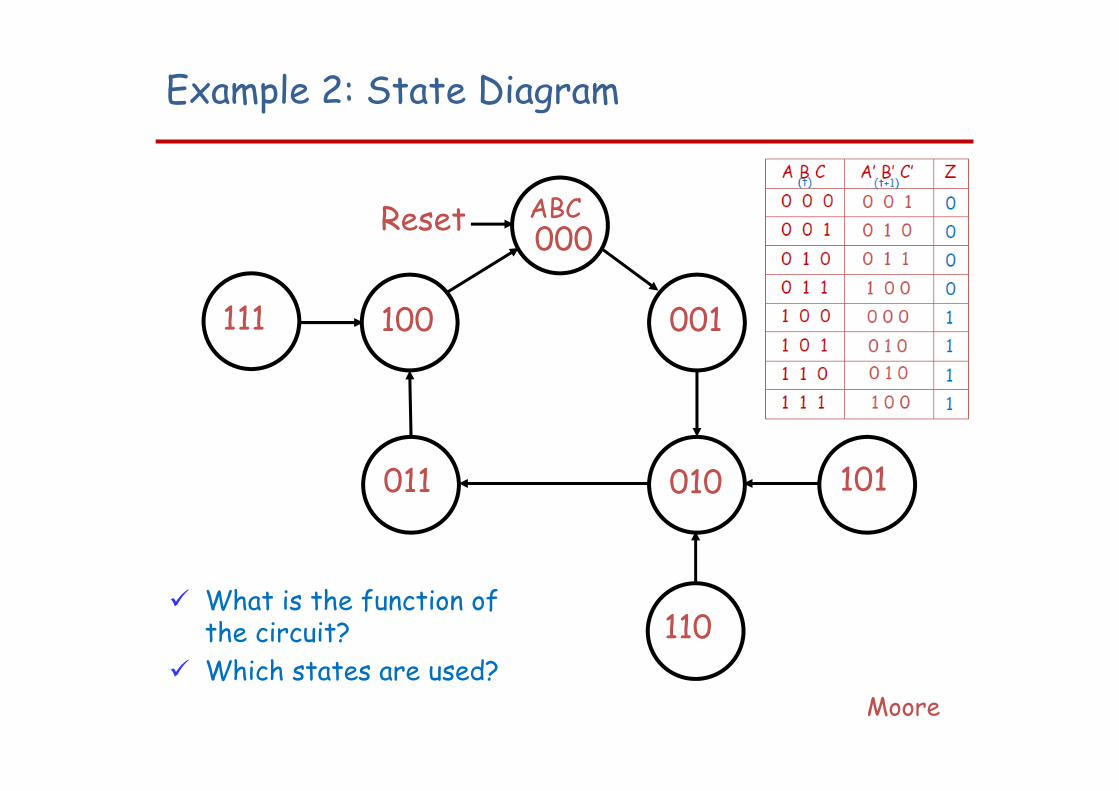
What is the function ofthe circuit?
Which states are used?
000
011 010
001100
101
110
111
Reset ABC
Example 2: State Diagram
Moore

Analysis with D Flip-Flop
The circuit we want to analyze is described by the input equation
DA = A x y
The DA symbol implies a D flip-flop with output A. The x and y variables are the inputs to the circuit. No output equations are given, so the output is implied to come from the output of the flip-flop.
Moore

Analysis with D Flip-Flop The binary numbers under A x y are listed from 000 through 111.
The next state values are obtained from the state equation DA = A x y
The state diagram consists of two circles-one for each state
Equivalent State Definitions
Two states are equivalent if their response for each possible input sequence is an identical output sequence.
Alternatively, two states are equivalent if their outputs produced for each input symbol is identical and their next states for each input symbol are the same or equivalent.
Two states that are not equivalent are distinguishable

Equivalent State Example
For states S3 and S2,• the output for input
0 is 1 and input 1 is 0,and
• the next state for input0 is S0 and for input1 is S2.
• states S3 and S2 are equivalent. S2 S3
1/00/1
1/0
0
S0/0 S1
1/0
0/1
1/0
0/1

Equivalent State Example
Replacing S3 and S2by a single state givesstate diagram:
Examining the new diagram,states S1 and S2 are equivalent since• their outputs for input
0 is 1 and input 1 is 0,and
• their next state for input0 is S0 and for input1 is S2,
Replacing S1 and S2 by asingle state gives statediagram:
S2
1/0
0/0
S0 S1
1/0
0/1
1/0
0/1
0/0
S0 S1
1/0
0/1
1/0
S2 S3
1/00/1
1/0
0
S0/0 S1
1/0
0/1
1/0
0/1

Moore and Mealy Models
Sequential Circuits or Sequential Machines are also called Finite State Machines (FSMs).
Two formal models exist:
Moore Model• Named after E.F. Moore • Outputs are a function
ONLY of states• Usually specified on the
states.
Mealy Model• Named after G. H. Mealy• Outputs are a function of
inputs AND states• Usually specified on the
state transition arcs.

Moore and Mealy Example Diagrams & Tables
Mealy Model State Diagrammaps inputs and state to outputs
Moore Model State Diagram maps states to outputs
0 1
x=1/o=1
x=1/o=0
x=0/o=0
x=0/o=0
1/0 2/1
x=1x=1
x=0
x=0
x=1
x=0
0/0
Present State
Next Statex=0 x=1
Outputx=0 x=1
0 0 1 0 01 0 1 0 1
Present State
Next Statex=0 x=1
Output
0 0 1 01 0 2 02 0 2 1
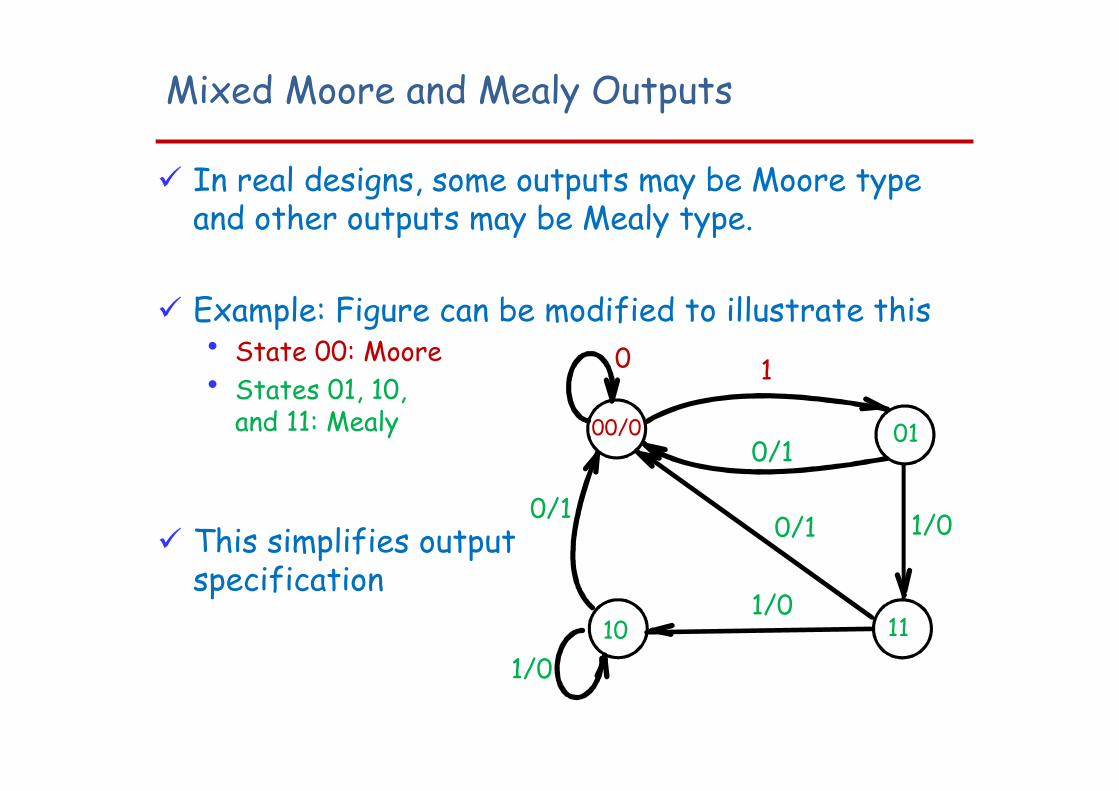
Mixed Moore and Mealy Outputs
In real designs, some outputs may be Moore type and other outputs may be Mealy type.
Example: Figure can be modified to illustrate this• State 00: Moore• States 01, 10,
and 11: Mealy
This simplifies outputspecification
10 11
1/00/1
1/0
0
00/0 01
1/0
0/1
1
0/1

26
State Reduction
state a a b c d e f f g f g a
input 0 1 0 1 0 1 1 0 1 0 0 output 0 0 0 0 0 1 1 0 1 0 0
Example : next state
t0 t1 t2 t3 …

State Reduction We now proceed to reduce the number of states for this example.
First, we need the state table; it is more convenient to apply procedures for state reduction using a table rather than a diagram. The state table of the circuit is listed in Table 5-6 and is obtained directly from the state diagram.

28
State Reduction States g and e are two such states: they both go to states a and f
and have outputs of 0 and 1 for x=0 and x=1, respectively. Therefore, states g and e are equivalent and one of these states can be removed. The procedure of removing a state and replacing it by its equivalent is demonstrated in Table 5-7. The row with present g is removed and state g is replaced by state e each time it occurs in the next-state columns.

29
State Reduction Present state f now has next states e and f and outputs
0 and 1 for x=0 and x=1, respectively. The same next states and outputs appear in the row with present state d. Therefore, states f and d are equivalent and state f can be removed and replaced by d. The final reduced table is shown in Table 5-8. The state diagram for the reduced table consists of only five states.

30
State Reduction
state a a b c d e f f g f g a
input 0 1 0 1 0 1 1 0 1 0 0 output 0 0 0 0 0 1 1 0 1 0 0
Example :
state a a b c d e d d e d e a
output 0 0 0 0 0 1 1 0 1 0 0
(e, g) e
(d, f) d

31
State Assignment
pseudo