shared control of natupat, resources (scor)publications.iwmi.org/pdf/h_20851i.pdf · shared control...
TRANSCRIPT

SHARED CONTROL OF NATUPAT, RESOURCES (SCOR)
SCQR PROGRE 1sf Quarter
1994
I n terna t i o n a1 I r ri gn t ion Man a g e men t 111s t i t 11 t c ( I I hiI I ) Sri L a n k a C o u n t r y Programme
107, H a v e l o c k Road, Colombo 5 , Sr-i 1 ~ ; ~ n k : ~ -__
SCOR seeks to inciease the users' share of control o f natural resources in seiecled walersheds throuati partnerships betweon
the slate and users that contribute t o greater pruduclion wl i i le c o n s e r v ~ n y the ,natural iesources b s e . SCOR will promote
integrated planning for the usc of land and i v a t e r resources ir? two pi lot wulars l ieds wit l i spread c l f c c t s to otl>c! arcas. T i l e SCOR project is a ~ ~ l l a h ~ r a t i v e E f f o r t of t he G o v c r n m e n l o f Sr! ILanko. the Ur1ili.d States Agonc.y 101 htcmi l l ion i i l Devrlnpinevt (USAID) and the IIMI.

1.
2.
3 .
4 .
5.
6.
I.
8.
9.
~ 0 .
CONTENTS
Page
1 Introduction
Progreys by S t r a t e v i r . and performance indicators in summary
1
4 Progress by major output indicators
8 Progress under major interventions
12 Detailed physical progress by watersheds by activities
2 2 Elaboration of specific events of performance
Major Inputs Training Group Formation User Grants Host Country Contribution Re search
22 22 2 3 28
30 28
Spatial Aspects of Performance 32
Financial Progress 36
Major issues to be resolved 36

.-
Table 1
Table 2
Table 3
Table 4
Table 5
Table 6
Table '7
Table 8
Table 9
Table 10
Table 11
Table 12
LIST OF TABLES
Progress by strategic level i.ndicators
Progress by Program outcome level indicators
Progress by major output indicators
Training of resources users - First Quarter 1994
Resoilrce User Groups Database Hurcluwewa watershed
Group formation, Group activit i.es and the current directions of SCOR activities-Huruluwewa
Resource user g r o u p s Database Upper Nilwala watershed
Group formations, Group activities and the current directions of SCOR act iv it ies-N i lwa la
User Gran t s - Nilwala watershed
Summary report on Host Country Contribution 25.10.93 - 31.04.94
Current status of research a s zi: 3lst March 1994
B u d a e t versus ac t .ua l expenditure for 1st Quarter 1994
page
2
5
7
2 3
2 4
25
26
27
28
29
1 0
37

? a
LIST O F FIGURES
Figure 1
Figure 2
Map 1
Map 2
Map 3
Map 4
Budget versus expenditure by major categories - SCOR Project 1st Quarter 1994
38
Tot71 A i i r i r r e t versus expenditure 39 by major categories - SCOR Project June '93 to March ' 9 4
LIST OF MAPS Resource user groups location and 33 activity status-March 1994
Aninkanda model production and 34a conservation area - Terrain and Drainage
AniKkanda model production and 34b conservation area - Land use
Area of slope greater than 45% 35 Aninkanda model production and conservation area

Figure 1
Figure 2
Map 1
Map 2
Map 3
Map 4
LIST OF FIGURES
Budget versus expenditure by major categories - SCOR Project 1st Quarter 1994
38
T n t i l Riidrrrt v e r s u s expenditure 39 by major categories - SCOR Project June '93 to March '94
LIST OF MAPS
Resource user groups location and 33 activity status-March 1994
Aninkanda model production and 34a conservation area - Terrain and Drainage
AniRkanda model production and 34b conservation area - Land use
Area of slope greater than 45% 35 Aninkanda model production and conservation area

1. Introduction
Shared Control of Natural Resources project (SCOR) commenced its field activities during the last week of October, 1993. The last quarter of 1993 marked the efforts of initializing action with building rapport, awareness creation, and detailed activity planning followed by several start-up activities. This report presents the physical and financial progress achieved by the SCOR project during the first quarter ending on March 31st, 1994.
This presentation of SCOR progress characterizes the current status of the performance of the project in a summary form using a, set of strategic and performance level indicatois and a form;?t that gives details by activities. Reference is given to relevant documents that are available in report form to give details of the process and quality of achievement in respect of major events of performance. Such documents can be made available for reference on request from the two pilot watershed project offices.
The structure of the progress reporting in this report is of four levels of aggregation. At the highest level of
in the most summary form. The next level is the programme outcome level that gives more details of output and possible effects. The third level presents a set of indicators allowing a quick look on direct outputs realized. The fourth level is the lowest level of data presentation by activity with remarks explaining the figures there in, referring to documents that carry further details of the activity and process involved.
aggregat ion, progress is reported by strategic l e v e l indicators
2. Progress in summary by strategic and performance indicators
2.1 Progress by strategic indicators
The strategic indicators characterize realizable effects of the interventions within the project period in relation to broad strategic objectives within which the project is placed by the sponsoring agency. The three strategic objectives are,
Sol . Economic Growth, S 0 2 . Environment, and S 0 3 . Democracy.
SCOR project generates output that relates to all the three objectives although it is specifically categorised under the environment objective.
The life of project target (LOP TARGET) relates to the target set for the first phase of two years since the current agreement covers only the first phase.
Table 1 presents the progress by strategic level indicators
- 1 -

Table I
PROGRESS BY STRATEGIC LEVEL INDICATOR
0 2 # of targeted hectares under improved prduction & wmem tian tehuiques throu& jointmana~ment
01 9E.ofvalueofaugetedin~s~entsbyrhere~uroes users on environmentallysoundpxluction p r a c h ~ ~
# of tar&eted resource- user orgmimtions enjqing user rights &rough slate-user parhership under replatozyprwaiure or organizational &mge
0 3
0 3 # ofpdky/prdure ororgmizational changes exacted and realized to increase shared Lwntrol
~ ........ ........ ............... ............... ,>:.:.:.:.:.:. ........ ........ ....... ........ ....... ............. .2 ............... ............... .:.:.:.:.:.:.:; .:,>:.:.:.:.:. ........ _L
hec
%
#
#
(.............
92 0
92 0
92 0
92 0
LLYL
3,030
1039
20
6
.....
__y
65
16
4511503
1304r
16/20
LOP TARGET = Life of Project Target (First phase of two years). TBD = To Be Determined.
- 2 -

c
Explanatory Notes for Table 1
so? # ofpl iq/proadiire or orgartimtional chaigesewcte and r d i e z c d ro mcreasx shored mntrol
- : : : .......... ........ Gy;: ........ ................ ...... ........... ;xm-W* .>: ............... €*p@.$ :.:... ................. ye-wA:::::
45/5w ... _-
16
13
- &lb, 1 . 1 ~ . 2b. 2 d . rb ---- _I
development, stredmcs and tank ecosystems in Humlwnva
' h e x arc. exi;ting organizations participating in thedecision making provss of the Watenhcd Rcsourccs Management Committee WRW) which enjop the right to approved
SCORworL plan and to sanction u w r g n n h o s e r g n n k
York is in progres to prepare. necessary documents to bc submitted to the. Ministry of Lands
- 3 -

2 . 2 Progress by program outcome level indicators
These indicators characterize the activity status in the context of the direct output and realizable effects in the short run. The program outcome level indicators are categorized under the relevant strategic level indicators. The indicators are reproduced separately to give the details by watershed together with remarks that describe the activity status in greater detail. The reference number of the activity as it appears on the activity plan is also given to relate progress in much more details in respect of the planned output, location and target set for the year.
Table 2 presents the progress by program outcome level indicators.
3 . Progress by major output indicators
Table 3 presents the progress by major promised output in a summary form. The indicators directly relate to the output as indicated on page 21 to 2 4 in the SCOR technical report.
- 4 -
Table 2 PROGRIiSS BY PROGRAM OUTCOME LEVElJ., INDICATOR
i02.PO1 #of targetedhectares underproduaion with land and water conservation pmctkm
i02.PO2 #of resources usergroup engagedm production and conservatbn pradicas
;02 .P03 56 of area covered byioterventjonsforprodu~i~ andprotection m the modelsub-waters6eds
i02.PO4 #of resources users trained m organization and resou~ce use planniug and management
;O2.P05 #of offi&h txawedin localleewIp1anning, usei group formation, supportand collaboration
iO2.PO6 # of land leasinghsufruct process facilitaing commerdal activity
iO2.POl # ofhedares of trgetedarea mvered byagreements between GSL & Local usergroups
;02 .P08 #of targetedfmm househokis usmg improved environmental tediniques (hrmulative)
iOl.PO1 #ofnewcommsrcialactivjties suppxted bylinking to markets, prondmg wit6 matchmg p u t s or orgnniatjoo
iOl.PO2 #ofsmallgxants made fo usergroups io invest into conmon usergroup nssesis
i03.PO1 #of resources userorganizstions involved m
pIannhg isking joint responsibilityfor mnnagcment of land and water resour~ps
503.P02 # o f user organizations confened with legalstatus andpowrs
SO3903 #of NGOs andp-te sector apncies providmrp rec6nical managerial m d commercial mformation f( userpoum
- 5 -
__ m .......... ............ ....... ...... ... ....... 9M ............. ...... ...... ...... ....... ...... ....... ....... ...... ...... II
...... ...... ...... ......
hec.
#
%
#
#
#
bee
#
#
#
#
#
#
- -
___L
92 0
Y i u
92 0
92 0
92 0
,2 0
92 0
92 0
92 0
92 0
92 0
9 2 0
92 n
- 3.000
i j G
100%
600
80
52
3000
4000
50
152
20
2c
€
_ly
65
94
'BD
1683
49
1191
11
11
1€
1t
- 4511500
.941150
1102/600
49/80
117
1191/1500
11/50
11/50
18/20
16RO
218

Explanatory Notes for Table 2
19/75 s02.PO2 P ofrrswrces iisxrgroupr engaged in prduction and mnxmaD'onpmcUas I
SOZ.PO3 ? ? of KCB cotered by inrrrvenfions for production nnd protection i n thhp modelstrh-watersheds
45175 8.1
i I
S02.PO6
SOZ.PO7
S02.PO8
S0I.POI
SOI.PO2
SO3.POI
/ j SO?.POZ
I / " !!
Ii
;I
il ' CO~.I 'O?
!' I #
7/25
11/75
/ l0
110
1
I 12d. 3b. 3c.3d.4~.
1012/300
23/30
NP
545
4/25
175
16/10
1611 0
1
T B I D I
NP I
- 6 -
omesteadS2 ha, in channel&steams and tank bundsand ha s i n tank ecosystems in huruliwea
.1.1.3.2.2
.1.3.1,1.2.1.2,
.4.1. 2.1, 2.2.1
.3,24.1,2.4.2 x u r m Groupdatatbasc.
.5.3.2.4,4.1, 4.3
8 trpes of production and protection activities in Hurulu b, ma and 15 m s of activite in Nilwala watershed.
atcrshed and 1510 in Huruliwewa watershed. (386%)
rant Dstabasc
raining dambase hisexcludes initial awarenesaeatan on SCOR i' roup database
ant database
.2, 1.5,
.5
ot planned for the. quarter
of families in poiips undertaking -me production and
mmercial activitics ran 'ng from floriculhuc, apiculhtre, k marketing, Kihrl t recg marketing, Cou rope sacks king, seed paddy production, C.ollecting of ME oil,
for seed paddy production, plant niirsarics in
13 existing organizations motivated by SCOR intervention de a dccision to atltivatc OFCC, while having the tank full
ater, in order to CO~SCNC water. They alm agreed to a ay rotation of water. 3 Organizations from feeder canal cd the. deckion making proccss of the WRMT. refers to the. 16 cxistin organizations in Hiiruluweara
members of the legal& constihited organizations. have the authority to a p p r m the SCOR workplqn for
watershed and to sanction user grants upto the limit of
oncrvation activity.
c

Tizble PRORESS BY MAJOR OUTPUT INDICATORS
1 5
... I
minor tanks Training of officials in lma1 level planning, user goup formation, support and ollaboration Total
. . 2 # of representatives of user groups tmined 3 # of User Organizations 4 Representatives of User Organizations trained
5 # of Sub-user councils 6 Representatives of User Sub-counds/counds trained 7 N of md! Rants mad? to user goups to invest into
common user goup assests 8 # of user orgbnizations conferred with legal stam and
powers
16 1
\. 1
# of NGOs and other private sector oqnizations providing technical managerial and conunzrdd information to user goups
i
~
I ............. ........................ ........................ >:.:Eflp<*: ..
%$?@: ............ ............ ............ ........................ ............ ............ - 150 600
20 75
2 8
150
20
10
2
5c
2 5c
8(
I
.____
__ - D F a
:m<: ........... ......... $&& ..........
r . ......... ..1_L
94 317 16 69
13
16
7
2
77
~ . -~
2.8, 297 (N). 20 (3 W.0 'sting organizations j20 s includes representatives of
xisting organizations
8.7 in Niiwala watershed
<O.O ese are existingorganizations artidparing in decision making
WRMT that has authoriy 1 nferred to approve the SCOR ork plan and to approve user ants upto Rs.25.000igant.
70.0 Sale of medicinal herbs with ?rospecs of production and procesing cut flower, Kithul trecle, milk marketing, sale of Jlants are g i g developed as viable commeraal opportinities
4.0 6 Plant nurseries and 4 seed paddyprduction for sale in
ilwala watershed
d u r a l change for the p n l f usufrut rights is being planne F I
87.5 rainins of officers on initial b m R activities only
25.0 b T D G helps Nilwala resources sers on feasibility of a mi-hudio power project. olonibo tiade Chambeis help: cointnunity in Huruluv. ewa
bn the feasihilini of proczssinl: -_ k a i n and oil extraction from s( ..........
A' -.'a
- 7 -

,’
4 . Physical Progress under Major Interventions
HURULUWEWA WATERSHED
4.1 Stabilization of Chena and Encroached State Lands
The approach adopted under this intervention during the first quarter was to increase awareness among the resources users in the chena and encroached state lands, on the need and advantages of conservation farming for production, and protection of the resources base. During the first quarter, 1252 resources users were trained in conservation farming and resources use planning. Sixteen hectares have been put under conservation techniques. Seven demonstrations have been carried out..
Action has been initiated for conservation of channels and streams as targeted on half a kilometre of a channel and 114 the of a kilometre of a stream.
4 . 2 Regenerate Tank Eco-system
Work has been initiated in 4 tanks for the restoration of gasgommana, perahana,and kattakaduwa preceded by awareness creation. 50 resources users were trained during the quarter with 4 relevant government officials and a group of school children.
4 . 3 Integrated water management
A major breakthrough under this intervention is the action initiated to launch a major action programme in the Mahaweli feeder canal area and to bring all the farmer organizations in the feeder canal area and the area. up to Illukwewa in the drainage area under one umbrella organization for integrated water management in the Huruluwewa watershed. Nine existing organizations have been bxought under the programme of capacity building during the quarter.
As targeted, a dialogue has been initiated by the relevant group that include the irrigation engineer of Huruluwewa and the Mahaweli officials with a view to include Huruluwewa officials in Mahaweli Water Panel.
A participatory resources use napping exercise was designed and carried out in the 24 mile long feeder canal area to update the resource use information in a much elaborate manner that involves plot level data collection and mapping that had never been undertaken for this area. The Divisional secretaries, Irrigation engineers, and Divisional officers of the Department of Agriculture and Agrarian Services and their field staff, joined to do the survey and mapping work supported by the farmers of the area who provided valuable information, prepared food for the working teams enthusiastically expecting results. A computerized database will be created with maps using SCOR GIS that would make information available for resources use planning and monitoring and evaluation of implemented programmes.
- 8 -

The third major action taken is to undertake seasonal planning for Yala cultivation in the Huruluwewa command. The Project Management Committee was provided with information on the water balance in Huruluwewa scheme, the problems associated with rice farming in all the fields of the command, and the advantages of cultivating other field crops in I0 % of the command. The committee consisting of representatives of farmer organizations agreed on the suggestion having realized the benefits. The difficult task of making soya seed available has been undertaken.
Measurements of water flow are taken at 20 points in the feeder canal, command area, and in Yan Oya to assess the present rates of water use and quality of irrig-ti-.? management.
4 . 4 Sharing resources for improved homestead
The strategy under this intervention is to inculcate the understanding of the concept of production and protection introducing commercial activities that raise income while conserving the resources base. Four commercialized plant nurseries have been established ahead of target and work on 15 model homesteads had been started. Work has been initiated on the establishment of a fruit village with linkages to market.
A major breakthrough under this intervention is the activity that has been initiated to form a production company and a processing plant for medicinal herbs. This activity is expected to open more commercial opportunities for homestead development since the negotiated business has already been linked to a promised market leading to a forward contract.
An elaborate arrangement has been put in place for farm data collection as a regular activity using volunteers. A wide range of fields are covered including data pertaining to all types of inputs going in to production and protection activity in selected locations. Information extracted from time to time will be used for implementation and evaluations.
4 . 5 Ground Water Development and Management
A research activity to gain knowledge on ground water as a resources that would directly influence programme development and implementation was designed and now under operation.
A group of data collectors including volunteers supported by the SCOR team has started the systematic collection of data on water table fluctuations to assess availability and rechargeability of ground water as planned. Five manual rain gauges have been installed to measure daily rainfall. Rainfall data are collected by school children on voluntary basis, a division of labour noteworthy under SCOR concepts.
- 9 -

,
4.6 Land Consolidation in Minor Tanks
Initial work has been undertaken in Mahameegaswewa, Padikaramadua and Kokawewa, three selected tanks for the intervention. Detailed questionnaires have been prepared.
4 . 7 Integrated Planning and Coordination
Basic data collection and establishment of contacts with the relevant agencies has been undertaken as for the background work for planning of activities under this intervention. Issues of the use of water and land resources in the feeder canal area and the command and drainage have been addressed at coordinating meetings.
Work on a design to plan for the long term promised output under this intervention has been undertaken.
4 . 8 Organizing user groups/organizations/sub-councils and councils for production, protection and related services
During the quarter, 29 user groups have been formed for animal husbandry, homestead and conservation farming, horticulture, and cultivation under agro wells. Preliminary discussions have been successfully completed with DFCC, Bank of Ceylon, Paddy marketing board, Colombo Trade Chambers, and Plenty Canada to organize support to the user groups and organizations.
NILWALA WATERSHED
4 . 9 Shared management of Land and Water Resources
Targets set for this quarter under this intervention includes establishing plant nurseries, raising plants, formation of groups for raising plants, identification of stream reservations for protection and initiating action leading to the required procedural change to grant usufruct rights to resources users. Nine user groups were formed, 6 nurseries established, and 14,000 plants were raised during the quarter. The targeted 19 kilometres of stream reservations had been identified and mapped ahead of target,.
A user group formed for the pianning of the mini hydro power project collected relevant data requested by the supporting NGQ (ITDG) for the designing of the project. One of the most noteworthy achievements during the first quarter is the participatory resources use mapping by plots for the two model production and conservation area of Millawa and Aninkanda. This activity will add to the information system that will be used by many in planning resources management in the respective areas. Computerization will be undertaken to make the data available to much larger group in a usable manner.
A manual was a l s o prepared for the resources users on Nursery management. This could be used in both watersheds.
- 10 -

4.10 Sharing resources for improving homesteads
Twelve user groups were formed ahead of target under this intervention during the first quarter. This activity includes 5 groups for homestead development, 1 for bee keeping, 2 for floriculture and 4 for cattle stock improvement. At present 7 groups are engaged in anthurium plants raising as a lower layer cash crop that involves no tilling avoiding disturbing the soil. Market links have been identified both in Colombo and Matara. Forty users were trained in anthurium cultivation and 500 good quality plants have been procured by user groups while orders have been placed for a further 1500.
Awareness creation continued on value adding opportunities for primary products during the quarter.
4.11 Improve tea paddy culture
Study of the tea and paddy production and productivity, and the inter relationship between tea paddy culture in the context of sticking a balance between production and protection is envisaged under this intervention. Identification of locations for productivity improvements was targeted for the first quarter. Three locations out of four were identified during the quarter.
A much noteworthy achievement under this intervention is the rehabilitation and improvement of a totally abandoned minor irrigation system by Annasidola Resources User Group assisted by the SCOR team. This is a very good case of the catallzing process of the project where collective work resulted in the revival of a water use mechanism which was not in use for the past 10 years, and subsequently put into good use with subsequent financial support of the relevant government agency for continued improvement. Detailed information of this case is available in a document prepared by the Nilwala Team.
Four seed paddy production units have been established covering 10 hectares, ahead of target out of a planned total of 19 hectares. They were supported with user grants for the initial work with plans to organize as commercial ventures. Six user groups were formed for improving.paddy culture and now are active on such work farmers never undertook earlier in this area in producing their own seed, due to the limited attention they paid for paddy in the expansion of tea.
- 11 -

,'
4 . 1 2 Organize groups for improved production, protection, marketing and related services
The tasks undertaken under this intervention are related to collection of information on marketing that will be placed in the hands of user groups. The output will be realized during the second quarter.
Eleven user groups have been supported with user grants amounting to Rs.77,000 for activities on procurement of plants and establishment of nurseries.
4.13 Integrated planning and coordination
The initial activity under this intervention was to form watershed resource management sub-groups and create awareness on SCOR themes. Four working groups were formed chaired by the relevant Divisional secretaries. The groups are meeting to discuss issues under SCOR themes. With this background preparatory work the designing of tasks under this intervention i s in progress.
5. Detailed physical progress by watersheds by activities
This section of the report presents the detailed physical progress of Huruluwewa and Nilwala watersheds by activities. The activities are the same as appeared in the SCOR work plan. In respect of Nilwala watershed, few activities which were not undertaken during the quarter do not appear in this report.
- 1 2 -

S C O R P R O J E C T - H U R U L U W E W A QUARTERLY PHYSICAL PROGRESS
% LOCATION
ODATB OF 5% TARGK
K K U W . , D . W . E W
T16 >We', XRW. ED hm. Mu'. EIL H S l SILK. cn
491 24
15 S
16 L
O S k
025 k
02s t
I
28 263
4 59
9
I_
RO- 15% CBLEVE- gaSs A R m MaMs
3 b
3 b 6 b
I -
m 9 17 1s.n
4m
l -
0 4
1W
93 26
44 4
- 13 -

LOCATION
h l n b n R m b m W n u
- 14 -

~~
LOCATION
4
18
21
I4
-
89
2w
4.0)
65
11
119
- 1 5 -

OUTPUT MAJOR XNrEKVENTTION ACrrYITlES
1 I
G R O U N D W A T E R D E W W P I ~ J Z M A N A G E m
LOCATION
. . f Aim01 Pmdactioo A Hal&.
- 16 -
'.

CHIEVE- m POX X I ' 9 4
29
2
i n
'RO- KESS B
REMhRKs ~
29
- 11 -

SCOR lNlLWALA1 WORK PLAN :PROGRESS 1st QUARTER 1004
herbnlmcdicmc Bcci honcy 1
- i a -

SCOR (NILWALA I WORK PLAN : PROGRESS 1st QUARTER 1994
1 I I wart ul pmgcu
- 19 -

SCOR (NILWALA I WORK PLAN PROGRESS 151 (IUARTER 1884
OUTPUT
- LOCATION
P !
IW
- 2 0 -

- 21 -

4'
6. Elaboration of specific events of performance.
A provincial steering committee meeting was conducted with a 100% participation of the members and the participation of 3 representatives specially invited for the meeting.
The national steering committee (NSC) members visited areas of intervention in the Huruluwewa watershed and conducted the committee meeting at Palugaswewa Divisional Secretariat with 90% participation of the member agencies. This was a special event where the members of the NSC could get first hand information on the complex issues associated with the water use in the feeder canal area and the model areas of production and conservation
presentation of the participatory resources survey work by plots of Padikaramaduwa Tank settlement followed by a discussion with the farmers highlighted the issues and aspiration of the resources users of the area.
The single issue that came up from watershed team to PSC and NSC was the absence of a mechanism to issue usufruct rights to resources users who protect the road, stream or canal reservation with long term tree planting and bank protection activity. The existing provisions do not permit the issue of such use rights on a longer term basis although there exist many instances of encroachment on reservations that go unnoticed. The NSC accepted the need, and deliberated that SCOR team continue discussions with the Ministry of lands in articulating a mechanism to address the issue.
by observation as well as discussions with the farmers. A
I. Major Inputs
(a) Training
Achievements under training of users and officers had exceeded the targets at a rate far more than expected. This is due to the particular character of the training component of the SCOR project where much informal training takes place at field level on site, involving larger number of resources users than the direct output targeted in the Plan. Training is a continuous activity in disseminating knowledge, sharing information, and passi.ng s k i . 1 1 ~ to recipients in five major areas of organization, leadership and group dynamics, Resources use planning, Sustainable practices, and Marketing.
The total number of resource users reached by the SCOR team for training including initial interaction of awareness creation during the quarter is 2670. This figure indicates the number of training opportunities used by the resources users under SCOR project since there could have been instances where the same person may have received two opportunities to get training on different subjects. This is an accepted situation under the SCOR project since t.raining is trnated as a continuous activity to strengthen the capacity of the resources users in resources management.
- 22 -

- .
SUBJECT AREA
SCOR will provide review papers on the status of training time to time classifying training by all the major subject areas and user groups.
The total number of resources users trained under the project under major areas of focus is given in Table 4.
Training of officers on local level planning, group formation and support and collaboration is planned from the second quarters onwards. Training of officers during the first quarters was basically on SCOR concepts and specific activity such as conservation farming. The total number of officers trained is 49 during the first quarter ( 2 3 in Huruluwewa and 26 in Nilwala), and the total up to the end of first quarter is 77 (38 in Huruluwewa and 39 in Nilwala).
Table 4
Hurulu Nilwla Total Wewa 1Qrt. Tcdate
_ _ _ - - . TRAINING OF RESOURCES USERS - FIRST QUARTER 1994
I I I I I ,I
1. Resources use
I PI-9 2. Organization and
Financial Management
3. Marketing I Sub total I
4. Awareness creation on SCOR Concepts
1275 126 1401 1923
936 97 1033 1458
12 12 38
2211 235 2446 3419
224 224 2338
I I TOTAL 2435 235 2670 5757 Source: Training Database.
The total financial input during the quarter on training and workshops is Rs.220,353 out of a target of Rs.367,500 marking a 60% use of the allocation.
(b) Group formation
By the end of the first quarter, 94 new u s e r groups had been formed in the two watersheds and were engaged in various activities of production and protection planning. The groups are in their initial stages of growing to maturity. Arrangements have been made to make periodic assessment of growth of the groups. Table 5,6,7, and 8 present information of groups of Huruluwawa and Nilwala watersheds respectively.
Databases have been created to store data collected from groups on group status and their activity status. A set of general criteria has been developed to assess the group maturity status using the information extracted from the databases maintained.
Map 1 presents a sample example of this arrangement
- 23 -

Table 5 .:
INTERNATIONAL. IRRIGATION MANAGEMENT INSTITUTE SCOR PROJECT-HURULUWEWA
RESOURCE USER GROPUS DATABASE
- 2 4

Table 6
Group Formation, Group Activities and the Current Direction of SCOR Activities
'(May, 1994) Huruluwewa Watershed
1 Homestead Horticulture .- .. . __
- 2 5 -

. .
- 1 2 3 4 5 6 7 8 9
10 11 12 13 14 15 161 17. I a i 19! 20 I 21 1 22 ! 23 24 25 1 26 j
27 ~
28 29 30 j
31 32 I
33 : 34 35 36
Table7 c RESOURCEUSERGROUPSDATABASE UPPER NILWALA WATERSHED
iROUP # )TYPEi # OF I FEMALE1 MALE 1 MEMBERS/ i
1 I
406 1 4051 2 4041 3 4031 4 4021 5
3271 8
3251 8 324( 9
10
323 12 3221 8 321 3
401 ! 7
3263 9
320 31 9 317 31 6 31 5 305 304 301 104
101A 101 102 105 106 107 108 1 G9 110 223
12 7
11 6 6 3
10 13 11 7 6 6
11 6 '
11; 11 1 1 , 3 '
I
14, 220; 15 '
2002: 13: 37.rv0202 ~
3a 203 ~
39 222 i 40 210 ~
41 204, 42 rvo2001 43 224 44 225 I
226 1 45 r--
7 16 8 8 7
10 6 6 6
I
-_
15 ; 19 11 31 31 10 8
10 10 10 72 11 7 8 7
11 10 10 14 13 12 23 33 10 10 1c 1 1 1: 1 c 1: 1c 1C 1 c 1 C I ( 5: 1( 1 (
I
12 I 10 1
81 1 2 :,
1 0 :
-~ ~~ .
- 26 -
-EMALE %
0
0 10 0 0 0 0 0 0 0
82 0 0 0 0 0
a4
70 I o i 0 ; 8 j O !
0 : 100 I
O ! I
01 0
100 i 1 0 : 85 i 70 80 j
O i 01
20 1
1 3 ' 01 0 ' O i a 01 0 81 0 :
# OF 1 LOCATION '/ :AMILIES j j
11 ! lllukpitiya 'I 31 1 lllukpit&a l l 1;
31 1 lllukpitiya / I :I 10 i Horagala il
8 I L Millawa ( i
10 1 L: Millawa 11 10 i U. Millawa !! 10 1 L. Millawa 72 L. Millawa I I 1 polgasmula
!I
'I
I! ii 8 1 U. Millawa i !
7 j Millawa 11 1 Millawa 10 i U. Millawa i t 10 U. Millawa I I 4 1 polgasmula I 3 1 polgasmula i ; I 2 ~ polgasmula 23 U. Millawa 33 1 U. Millawa 10 ~ Polgahahena 'i
10 1 Polgahahena I 0 i Polgahahena 11 I Millagahahene j ; 13 i Wijanagama :I
I o ~ Wijanagarna ' 13 I Wijanagama i '
10 1 Nagoda 10 j Kukundeniya 10 ! Kukundeniya 10 1 Mugunamulla 10 ~ Bodeniya 45 i Kotapola Noithi/ 10 Hingurupan I
I 0 ~ Olakumbura 7 : Bateredda
12 1 Boralukanda "
10 ~ Olakumbura ' I
8 I Thenipita 12 I Bodeniya 1 0 j Bodeniya 9 1 Bodeniya
7 I . L. Millawa
,I

Table 8
Group formation, group activities and the current direction of sco4 activi:ic::
(April,l994) Nilwala Watershed
/I TYPE OF ACTIVIW - i I -..___
i!TKitul and vinigar production 2 Tea land conservation 3 Home gardenning 4 small tea land conservation
I i 5 Stream conservation with nursary li 6 Stream reservation conservation 11 7 Plant nursary I 8 Milk Production 11 9 Paddy land users 10 seed paddy production
11 1 Flower growers I 12 Soil conservation
'1 I 3 farmer organization 11 14 Minor export crops (1 15 Leaf sacks production /I 16 Agricuitural production and marketing I T - S m - 1 ,
# OF iROUPS
1 1 4 1 1 8 5 5
1 10 ,I
- 2 1 -

(c) User Grants
SCOR project negotiated with Peoples Bank and Bank of Ceylon, the two State Banks, for making arrangements to receive grants awarded to user groups and organizations as deposits, use them as collateral, and issue loans four or five times more than the deposited amount, based on mini-projects appraised and submitted to them by such groups and organizations. The two banks have designed the procedures to be adopted in issuing loans under this arrangement. Final arrangements are expected to be in place soon so that the US$ 141,000 allocation for user grants can be effectively utilized to make several times larger allocation of local funds available for a much larger number of resources user groups.
The Target set for the year 1995 for user grants is Rs.2 million out of an allocation of Rs. 7 million for the two year period for both watersheds. The amount awarded as small grants to user groups during the first quarter amounts to Rs.77,000. These grants were issued by Nilwala watershed office. Table 9 provides summary information on those grants.
SCOR will monitor the actual amount granted by the banks as well as the amount invested by recipient users on production and protection activities of resources.
No of Purpose Grants to Groups
4 saed Paddy Enterprise
8 Plant Nursery Establishment
1 Model Stream Garden Development
Total _ _ 13
Table 9 USER GRANTS - NILWALA WATERSHED
Amount Granted Rs . 41,000
30,500
5,500
77,000 __
(d) Host Country Contribution (HCC)
P.s required by USAID, arrangements were made to monitor the Host Country Contribution for SCOR project. The following three areas and the targets were set based on the Donor agency intimation of the expected Grantee resources for the SCOR project for the initial two year period.
1. Value of time spent by farm households on project activities and investment of labor and capital in land and water conservation by farmers. Target US$ 416,000 (US$Z.5 rnillion/6).
- 28 -

2. Sub grants from PL480 Title 111 local currencies. Target US$ 83,300 (US$500,000/6).
Description
3. Salaries Of Sri Lankan officials prorated for the amount of time Spent on project activities. Target US$ 22,500. (US$135/6).
Nilwala
The current arrangement is to collect data on the items possible at this early stage of the project in relation to the HCC by way of government staff time and resources provided, any in kind contribution of resources users and their time on SCOR related activities, and the value of sub grants. Arrangements have been made to collect data on farm investnients at the time the effects are visible of such investments.
Table 10 presents the HCC up to the end of the first quarter based on information extracted from the databases maintained by the two watershed offices.
Contribution of NGOs, groups, farm households, and individuals by way of time/labour, and materials supplied
Value of conserved capital assets
Value of sub Grants
Gbvt. officers contribution
-
T a b l e 10
Number of
persons
1,382
0
- 0
701
2,083
SUMMARY REPORT ON HOST COUNTRY CONTRIBUTION (HCC) 25.10.93 - 31.04.94
241.163
0
77,000
60,636
378,799 -
Huruluwewa
0 O 1
Total Number of
persons -
2,873
0
0
856
3.729
Total HCC
( R s . 1
589,651
0 _-___
77 .ooc 125,399
792,OSC __I_
- 29 -

. ' (e) Research
The research component of SCOR project has been designed to generate knowledge on topics of great research interest in relation to land and water resource management in watersheds. useful as input to the articulation of watershed resources management models while supplementing the implementation process.
Much of the research designing work and the preparation of the terms of reference on research topics, and negotiations with research Institutions took place during the quarter. Continuous dialogue is maintained with the two universities and the other agencies who are assigned with the research work. SCOR project .
Such knowledge is expected to be
Table 11 presents the current status of research activity under
Table 11
CURRENT STATUS OF RESEARCH AS AT 31ST MARCH 1994
1. Water Balance
2. Integrated watershed water management
3. Bic-diversity
4 . Desiltation of minor tanks
5. Endemism
6 . Economics of ground water
7. Feasibility and economics of
8. Eco-tourism
9. Vegetation change and
10. Social conflicts and
11. Aqi-business
irrigation
micro irrigation
rainfall
strategies for resolution
TOR prepared & agreed. Contract letter was issued to University of Peradeniya. Field work about to commence.
Draft concept paper prepared, Measurement points identified, Staff gauges installed and daily monitoring is being done.
Contract is under negotiation. - do -
To be initiated next year
To be initizted next year
T@ be initiated next year
Proposal prepared and agreed.
- do -
To be initiated next year
- 30 -

12. Indigenous knowledge and practices
13. Improving the agricultural potential in lower Nilwala watershed
14. Improving Agricultural Potential in Coastal Low- lying areas
Conjunctive Use of Tank and Well Water
15.
16. Planning for Conjunctive Use in Irrisation Rehabilitation 1 1;: Evaluation of Alternative Irrigation Rehabilitation and Modernization Strategies
Reservoir Sedimentation Studies
19. Environmental Impacts of Irrigation
20. Economics of Land and Water I/ Conservation Measures
Other areas of research
Process documentation
Continuous farm record keeping survey
Baseline survey
Action research study on special SCOR interventions in Huruluwewa
-
Proposal is being reviewed.
To be initiate next year
- do -
Concept paper prepared, field work in progress under the name of Agro-well and ~ O U ~ U W U L ~ L -Ady.
To be initiate next year
- do -
Contract negotiation stage
To be initiated next year
Being planned
Contract negotiation is being done
Commenced in several locations in April. Contract issue stage for Nilwala.
Data gathering is being done.
Agreement signed, work assigned.
All research that have bearing on project implementation are in progress.
All research to be initiated next year come under the category of no intervention areas meaning that SCOR will have no plans to carry out interventions under those areas of research.
- 31 -

8 . Spatial Aspects of Performance
Terrain and drainage are two of the most important aspects of landscape under focus in SCOR interventions. Space bound activities are determined in considering how human action changes the status of these two aspects by the way they use land and water resources. Even non-space bound action is directed to effect changes through action on land space. Therefore SCOR makes special effort to focus on the spatial aspects of performance under interventions.
SCOR project uses IDRISI GIS software for the creation of its spatial database to support planning, implementation and monitoring of activities for watershed resources management. Map 1 is an example of indicating locations of user groups and action to mobilize resources users efforts to change the resource use on a particular land area from the current status to SCOR target status. Annex 1 and 2 portraits the SCOR vision of change in a typical landscape profile of the two watersheds.
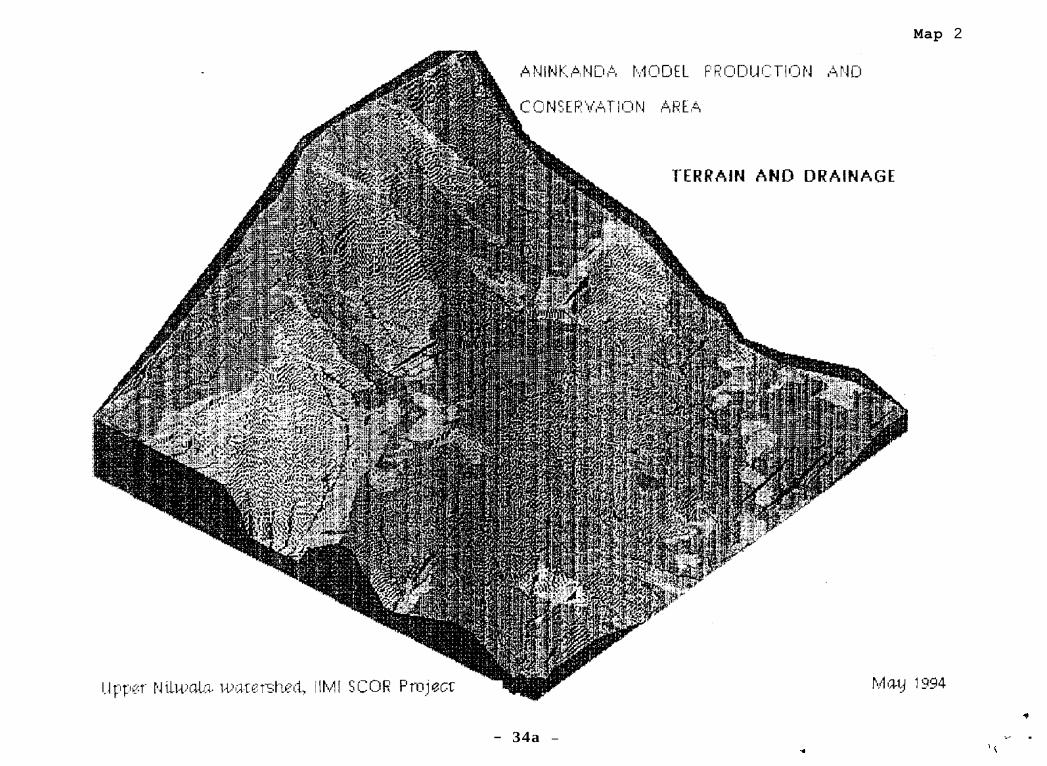
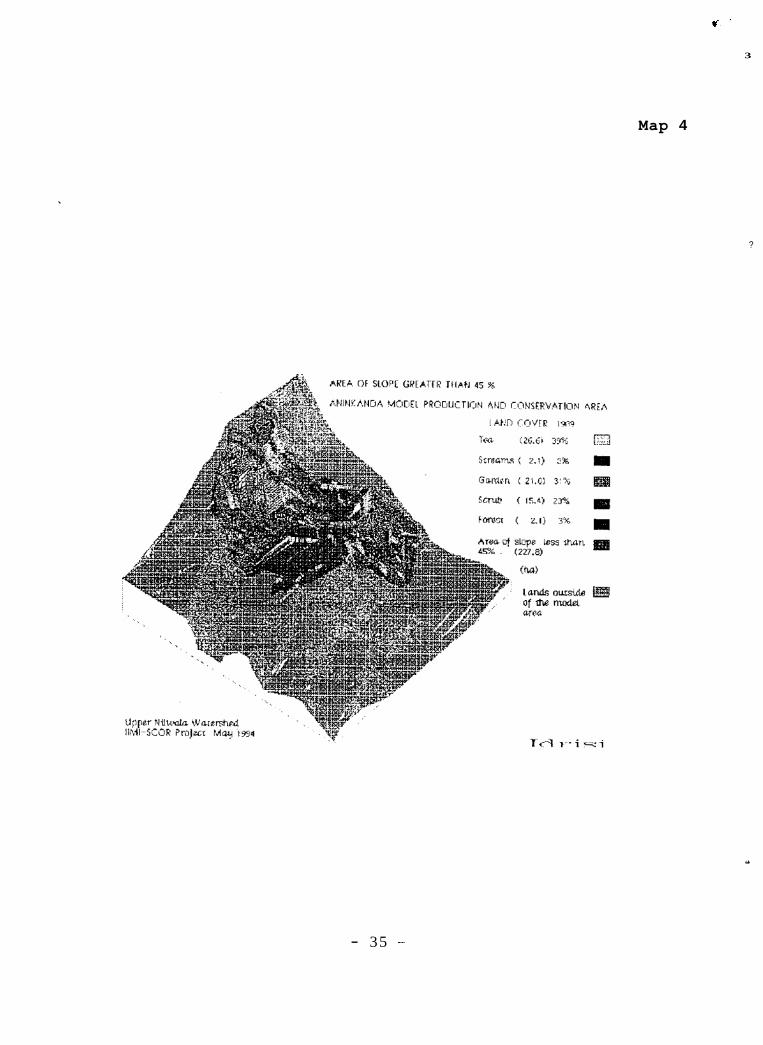
SCOR makes special focus on 4 contiguous areas in the two watersheds for interventions in every plot of land to demonstrate a model watershed resources management intervention. Map 2 presents the three dimensional view of the terrain and drainage pattern of Aninkanda model production and conservation area using a digital elevation model. Map 3 shows the land use of this area with major categories, and extent of each category as it was in 1986, mapped after field checking in 1 9 8 9 at a scale of 1 :10 ,000 .
The digital elevation model was used to create a slope map and isolate the areas that are of slope greater than 4 5 % . The land use map was superimposed to show where such stressed areas occur, and what the land cover is on those areas, with the extent and percentage of extent of each category. This analysis reveals that only 3 % of such area is under forest where as under ideal conditions 97% of this area should be under forest (see map4).
A map prepared from the participatory resources survey and mapping outpilt will be overlaid on this map to identify who owns or occupies such ‘Lands on which land use should be carefully planned. Thus G I s will highlight problem areas, lead to the articulation of action, facilitate, and guide certain types of interventions in the area under focus and make series of maps with the current status and the targeted change with a time plan to realize such targets. These maps will be very useful facilitating monitoring and evaluation.
SCOR GIS will provide monitoring information highlighting the spatial aspects of programme performance of both watersheds.
- 3 2 -

Map 1
RCSOURCLS USER GROUPS
LOCATION AND ACTIVITY $TATUS MllLAWA MOON PRODUCrlUN AND
CONSIRVATION ARtA
March 199c 16 rca w c ~ M o I ) ( I : ~ ~ 8 k'lV.lUGllon G QlVCEGWr. -
3 Srrdam resemarion ?mar lor . 2 Seed. p n u j fam
U F p z r NUwAa wurnshsd, IuMl ScOa Pm
- 3 3 -
- 34a -
Map 2
.̂
t
.* . ‘i

Map 3
- 3 4 b -
U '
3
Map 4
?
- 35 -

9. Financial progress
9.1 Budget versus expenditure by major categories for the quarter
The total expenditure incurred by SCOR during the first quarter is US$ 245,929 (Rs.12,050,521). This marks 84% of fund utilization out of a targeted amount of US$ 293,910 (Rs.14,401,590) (US$ 1 =' Rs. 49.0) Table 12 gives details of budget and expenditure by major items. Two items have expenditure exceeding the budget. In respect of office research and supplies, this is due to the rent paid in advance for the entire period for housing. The excess expenditure recorded under equipment is due to the carry over expenditure from the last quarter.
The lowest level of expenditure is recorded against sub-grants. This is normal since grants are awarded only after appraising a mini-project submitted through user group/organization. Such activities have just been started to form as planned.
Figure 1 presents the financial progress achieved by Percentage by major line items during the quarter.
9.2 Total Budget versus expenditure by major categories
The financial progress achieved during the quarter reflects 31% of resources utilization out of the total project allocation of US$ 2.5 million (Rs.124 million) for the two year period. Figure 2 presents the total expenditure incurred as at end of march 1944 out of the total budget for the first phase of two years of SCOR project.
10. Major issues to be resolved
No major issues were recorded during the quarter that needed national level intervention or beyond except the issue of the absence of mechanisms to issue user rights on road, stream and channel reservations, that could not be resolved locally. Documents are being prepared to be used in the discussions on this issue for a procedural change, with the officials of the Ministry of Lands.
The project is faced with two difficulties that cropped up demanding some additional fur!ding. ?irst, it is the lack of adequate funds to acquire some measuring equipments that are expensive in cost but very effective in collecting and measuring data on indicators that are highly relevant to SCOR output and effect monitoring and evaluation work. Second, few additional office equipments for the head office and the field offices have become necessary to deal with the volume of information that are generated in the process of implementation and research. The project has to live with difficulties during the two years since the needed equipments are additional to project allocations.
- 36 -

Table 12
0 450
USAID - SRI LANRA GRANTNO383 - 0109 - A - 00 - 3413 - 00
BUDGET VERSUS ACTUAL EXPENDITURE FOR IST QTR. 1994
0 2500
I,
0 0
Doscription
Sakries BeniGts a All Int'l
Int'l
0 2050l 549
~
0 0 2500 1,713
4,030 2774 4.503 5,996
1.ooO 0 I
2050
0 2500
4,000 4.500
1,030
0 ' i 01 c i 1 !
1 I/
1 I I I
~ I
16.720 i 12.641 I 16.7iC
ll.5@Ol I l i 11,SOC I I
Workshaps &Traiuing Inr I Local
Other Direct Costs Vehicle Oper. & Main. Oftkcmesearch supp Q ser.
Information & Dirseminatiou
Audit
I Contingeocics
Indirezt costs; Overheads (32%)
0 0
1,037 2773
dAR 1st tr. 1st tr.
1,428
0 2503
4.030 4$X
0 2784
6,705 9,241
01 0 7,500 4,497
12,000 10517 13500 16.01C
i C i 1
c I I O i i i 1
17.355 I 50.160 I ~ 1 . 5 1 5 I I I
4,199 i 54,500 1 4 . 4 3 I I
'0, .. ,
.
L
I
I
~
! i
1
I
I 1 I
/ . J
*
- 3 1 -

Figure 1
..~~ T i n c a m 5 . 4 ' 0.0
BudgetedExp.1stQtr. 24.0 83.1 0.0 Actual Exp. 1st Cnr. 20.4 87.7 0.0
, 85.0 81.5
-
-
BUDGET VERSUS EXPENDITURE BY MAJOR CATEGORIES - SCOR PROJECT
4.6 10.0 4.1 3.0 0.0 1.5 -4.5 2.4 ' 0.0 7.5 ~ 0.0 6.2 7.5 0.0 120 13.5 3.0 0.0 2.9 1 0.0 2.0 45 0.0 10.5 18.0 0.6 0.0 38.3 32.9 60.0 87.6 133.4 18.8 -.
1st Quarter - 1994
100.0
80.0
60.0
40.0 0
ie 20.0 0 2 0.0
-20.0
-40.0
-_ T---- ~ B a l a n c s MBudgeled Exp. 181 Otr. @Actual Exp. 1sI air.
. . . . . . . . . . . . . . . . . . . . . . . . . . .
. . . . . . . . . . . . . . . . . . . . . . . . . . . . . . .
. . . . . . . . . . . . . . . . . . . . . . . . .
~ . ~ . .
TOTAL
. . . . . . . . . . . . . . . . . . . . J
. . . . . .
. . . . . .
. . . . . .
. . . . . .
. . . . . . z . 2 4 5 9 . . . . . . . . . .
. . . . . . . i . . . . . . .
. . . . . . .
. . . . -47.9
- 38 -

Figure 2
TOTAL BUDGET VERSUS EXPENDITURE BY MAJOR CATEGORIES - SCOR PROJECT JUNE '93 TO MARCH '94
TOTAL
K- Total Budget @Total Expenditure
700.0
600.0
h 0 500.0 0
400.0
* 300.0 cn 3 200.0
100.0
0.0
.. ~- - __ .- 157.1 536.7 27.1 49.7 266 41.1 46.1 31.3 74.7 86.2 28.6 25
61.7 266 46.6 84.2 31.3 92.3 148.0 29.2 25 120 0.0 7.5 18.0 0.0 17.7 81.8 0.6 0.0
38.9 18.7 0.0 19.4 0.0 ,i5.5 28.1 0.0 18.2 41.8 21 0.0
Balance
1 : ~ .....
" - 39 -
2,5 00 1 g 2,000 %,,so0 (I)
: 1,000
5 00
/ / 4.3. . . . . . . . . . . . . . . . . . .
. . . . . . . . . . . . . . . .
. . . . . . . .
. . . . . . . . . . . . .
. D
: . - **I I
3 1 (i