sharing knowledge. promoting excellence
TRANSCRIPT
™
Scientific International Journal™Sharing knowledge. Promoting excellence.
Scientific International Journal
Editorial Advisory Board
Lizzette Rojas, PhD, Editor
Norma Cruz, MD Judith González, EdD
Miguel Oppenheimer, MD Juan O. Ramos, ND
Edwina Sánchez, PharmD Flordeliz Serpa, PhD
Axi Díaz, JD Gloria Eva Rolón, JD
Scientific International Journal™ is an
official publication of Non-Profit Evaluation & Resource Center, Inc.
Copyright © 2010 by Non-Profit Evaluation & Resource Center, Inc. All
rights reserved. Authors are fully responsible for data, statements of fact and opinion. Statements by authors do not imply an opinion on the part of the
Editor, the Editorial Advisory Board and the officers. Scientific International
Journal™ assumes no liability or responsibility for any claims, actions, or damages resulting from the publication
of any article.
For advertising rates contact Dr. Lizzette Rojas, Editor, at
Scientific International Journal™605 Condado Street, Suite 712 San Juan, Puerto Rico 00907
Telephones: 787-550-5964 787-464-4644
Cover graphic design: Jonathan Castro
Developed in Puerto Rico.
ISSN 1548-9639 (print)
ISSN 1554-6349 (online)
Featured Articles: EVALUATION MODEL OF THE TURABO MATHEMATICS AND SCIENCE PARTNERSHIP PROJECT 4 Dr. Oscar A. Sáenz and Prof. Mylord Reyes Tosta CARDIOVASCULAR DISEASE PREVENTION: INTERNET RESOURCES FOR A TEACHING UNIT 22 Prof. Aldo T. Marrocco SPANISH TRANSLATION AND CULTURAL ADAPTATION OF THE ADOLESCENT PSYCHOSOCIAL SEIZURE INVENTORY IN PUERTO RICO: IDENTIFICATION OF THE PSYCHOSOCIAL PROBLEMS IN AN EPILEPTIC GROUP 33 Dr. Flordeliz Serpa
Non-Profit Evaluation & Resource Center, Inc. Vol. 7 No. 2 May-August 2010
__________ FEATURED ARTICLES
EVALUATION MODEL OF THE TURABO
MATHEMATICS AND SCIENCE PARTNERSHIP
PROJECT Dr. Oscar A. Sáenz and Prof. Mylord Reyes Tosta
Abstract The Evaluation Model of the Turabo Mathematics and Science Partnership (AMCT, Spanish acronym) Project combines external and internal evaluation. The external evaluation is composed of three phases: Pre-Evaluation, Evaluation, and Post-Evaluation. The model uses a mixed evaluation approach, it includes a quantitative, as well as, a qualitative focus, and it includes formative and summative evaluations. Descriptive and inferential parametric statistics are utilized in the summative evaluation, following a quasi-experimental design with a comparison group (control group). The AMCT Evaluation Model considers objectives achievement, process improvement and change, learning, quality of implementation, increase of teachers’ content knowledge, support for change in the instructional practices in the classroom, and effect on the students’ academic achievement. The model has been empirically tested during two years, the 2007-2008 and the 2008-2009 cycles of the project execution. Key words: evaluation model, formative evaluation, summative evaluation.
Resumen El Modelo de Evaluación del Proyecto de la Alianza de Matemáticas y Ciencias del Turabo (AMCT) combina la evaluación interna y externa. La evaluación externa está compuesta de tres fases: Pre-Evaluación, Evaluación y Pos-Evaluación. El modelo usa la evaluación mixta, incluye métodos cuantitativos, así como, cualitativos e incluye evaluación formativa y sumativa. Estadísticas descriptivas e inferenciales son utilizadas en la evaluación sumativa, siguiendo un diseño cuasi-experimental con grupo de comparación (grupo control). El Modelo de Evaluación de la AMCT considera el logro de los objetivos, proceso, mejoramiento y cambio, aprendizaje, calidad de la implantación, aumento del conocimiento de contenido de los maestros, apoyo para el cambio en las prácticas de enseñanza en la sala de clases y efecto en el aprovechamiento académico de los estudiantes. El modelo ha sido probado empíricamente durante dos años, los ciclos de ejecución del proyecto 2007-2008 y 2008-2009. Palabras claves: modelo de evaluación, evaluación formativa, evaluación sumativa.
Scientific International Journal™ Vol. 7 No. 2 · May-August 2010 4
INTRODUCTION
his article presents the structure of the evaluation model used in the
Alianza de Matemáticas y Ciencias del Turabo (AMCT, Spanish
acronym) or Turabo Mathematics and Science Partnership Project. It
starts with a description of the AMCT Project, followed by a literature review regarding
the evaluation of professional development projects for teachers. Then, the AMCT
evaluation model, the research design and methodology for impact evaluation, and the
conclusions are presented.
T
THE AMCT PROJECT
he Alianza de Matemáticas y Ciencias del Turabo (AMCT) is a
professional development program for science and math teachers who
teach elementary (4th through 6th) and middle school (7th through 9th) at
public and private schools in the educational region of Caguas, Puerto Rico. The ultimate
goal of the program is to increase the academic achievement of the students taught by the
participating teachers. The AMCT is organized within the Universidad del Turabo (UT)
and comprises three schools, Engineering, Science and Technology, and Education. It is
sponsored, via the Department of Education of Puerto Rico, by funds from the
Mathematics and Science Partnership, Title II-B, Section 2202 of the “No Child Left
Behind Act” of 2001, of the U.S. Department of Education. Said sponsorship is provided
through yearly projects, the first of which began in 2004. The Project’s components are a)
content trainings in math or science, b) in-school support for the design of activities
learned in the trainings, c) scholarships for courses at UT, and e) educational materials.
Beginning in the academic year 2008-2009, a new component was developed, action
research, and volunteer teachers and their respective students had the opportunity to
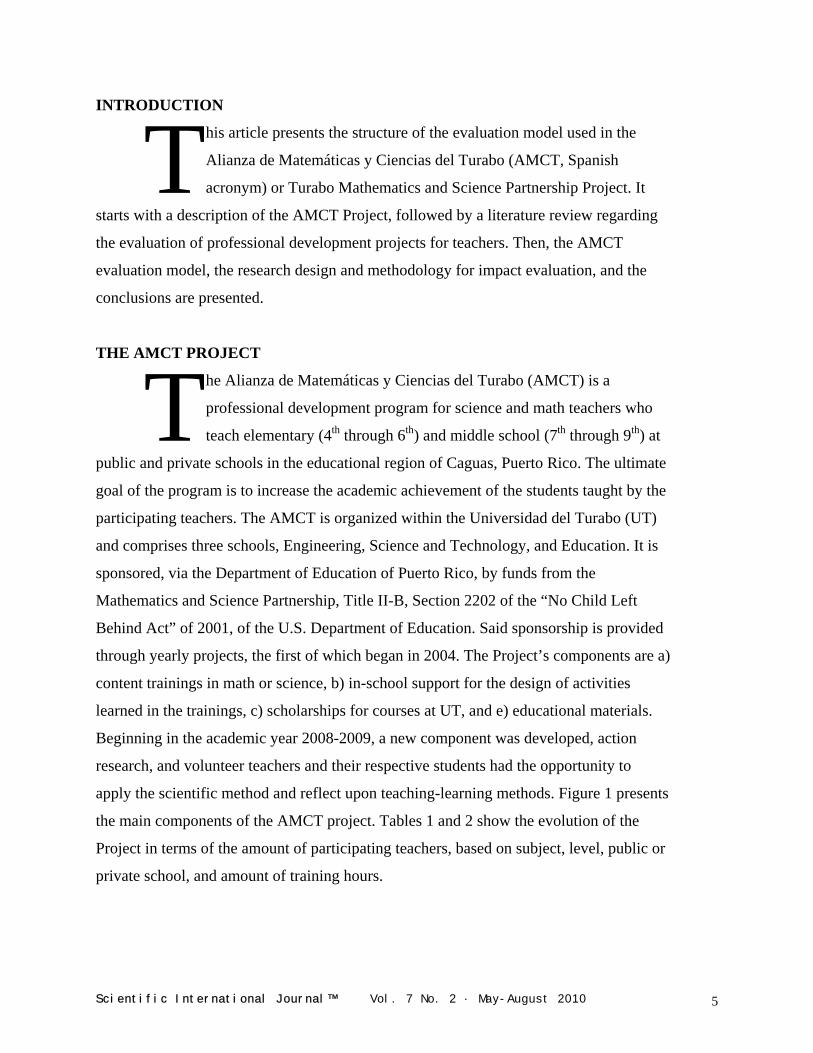
apply the scientific method and reflect upon teaching-learning methods. Figure 1 presents
the main components of the AMCT project. Tables 1 and 2 show the evolution of the
Project in terms of the amount of participating teachers, based on subject, level, public or
private school, and amount of training hours.
T
Scientific International Journal™ Vol. 7 No. 2 · May-August 2010 5
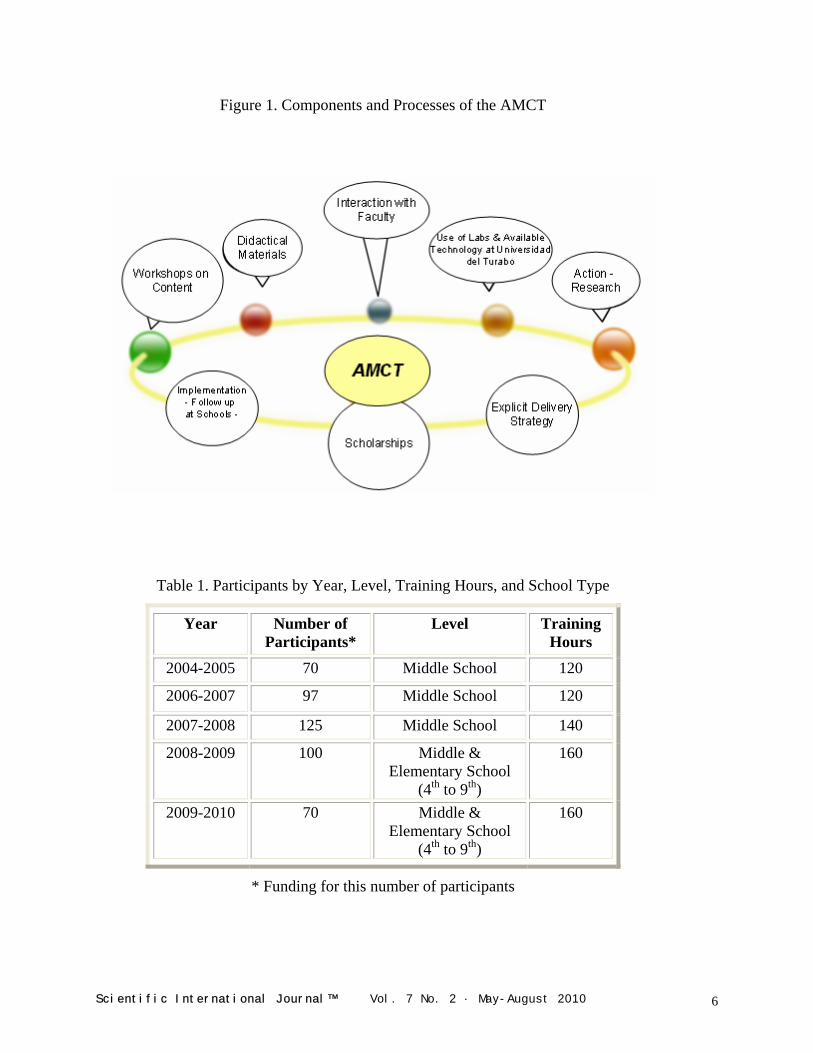
Figure 1. Components and Processes of the AMCT
Table 1. Participants by Year, Level, Training Hours, and School Type
Year Number of Participants*
Level Training Hours
2004-2005 70 Middle School 120
2006-2007 97 Middle School 120
2007-2008 125 Middle School 140
2008-2009 100 Middle & Elementary School
(4th to 9th)
160
2009-2010 70 Middle & Elementary School
(4th to 9th)
160
* Funding for this number of participants
Scientific International Journal™ Vol. 7 No. 2 · May-August 2010 6
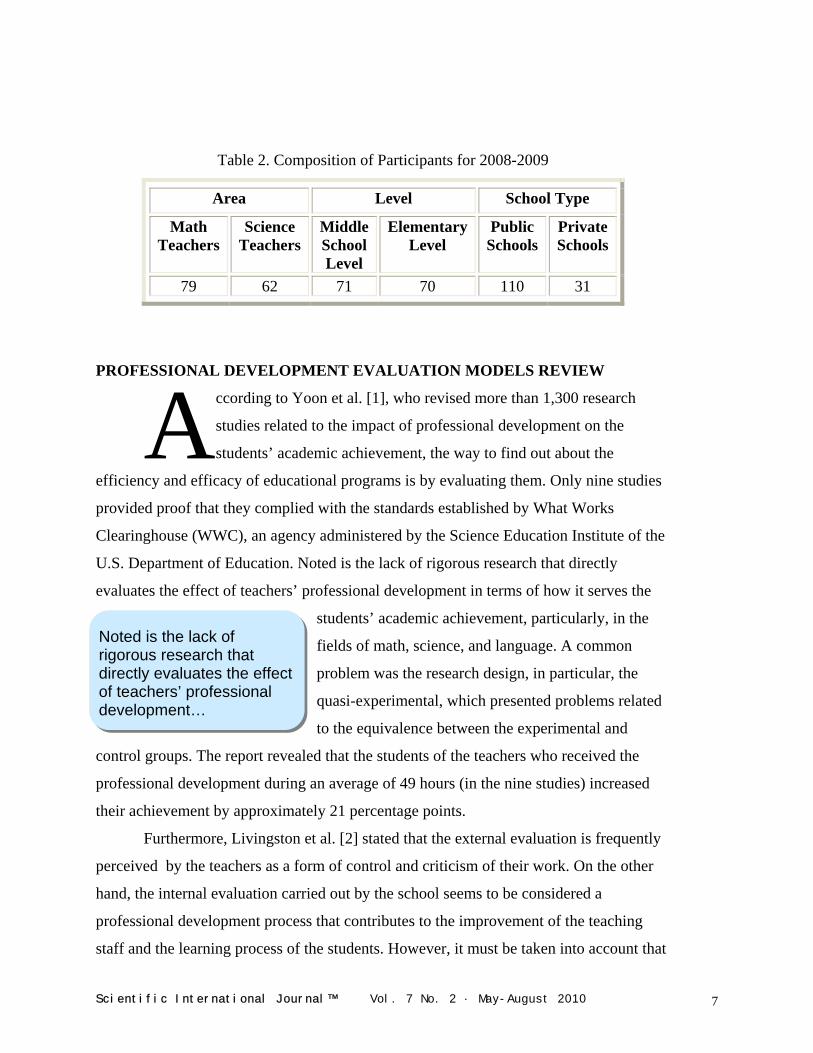
Table 2. Composition of Participants for 2008-2009
Area Level School Type
Math Teachers
Science Teachers
Middle School Level
Elementary Level
Public Schools
Private Schools
79 62 71 70 110 31
PROFE VELOPMENT EVALUATION MODELS REVIEW
Noted is the lack of rigorous research that directly evaluates the effect of teachers’ professional development…
SSIONAL DE
ccording to Yoon et al. [1], who revised more than 1,300 research
studies related to the impact of professional development on the
students’ academic achievement, the way to find out about the
efficiency and efficacy of educational programs is by evaluating them. Only nine studies
provided proof that they complied with the standards established by What Works
Clearinghouse (WWC), an agency administered by the Science Education Institute of the
U.S. Department of Education. Noted is the lack of rigorous research that directly
evaluates the effect of teachers’ professional development in terms of how it serves the
students’ academic achievement, particularly, in the
fields of math, science, and language. A common
problem was the research design, in particular, the
quasi-experimental, which presented problems related
to the equivalence between the experimental and
control groups. The report revealed that the students of the teachers who received the
professional development during an average of 49 hours (in the nine studies) increased
their achievement by approximately 21 percentage points.
A
Furthermore, Livingston et al. [2] stated that the external evaluation is frequently
perceived by the teachers as a form of control and criticism of their work. On the other
hand, the internal evaluation carried out by the school seems to be considered a
professional development process that contributes to the improvement of the teaching
staff and the learning process of the students. However, it must be taken into account that
Scientific International Journal™ Vol. 7 No. 2 · May-August 2010 7
if the evaluation model is not suitable, if it has problems in design, if its execution is not
ethical and, in addition, if mathematical and statistical errors are committed, the results of
the evaluation are neither valid nor trustworthy.
Blank et al. [3] revised 25 programs of professional development for math and
science teachers from schools in the United States. The four criteria considered in the
revision were: 1) the quality of the implementation, 2) an upgrade in the content
knowledge of the teachers, 3) a change in the educational practices in the classroom, and
4) the effects of the professional development on the students. The primary findings were
the following:
a) Of the 25 programs, 20 project directors submitted evaluation reports and only 18 of
those reports had specific findings relating to the four criteria analyzed in that
revision.
b) Thirteen programs reported quality in the implementation of the professional
development activities.
c) Twelve evaluation reports included data regarding an increase in the content
knowledge of the teachers.
d) Twelve reported changes in the educational practices.
e) Twelve programs achieved an increase in the academic achievement of the students.
According to Blank et al. [3], nearly 50% of the programs were able to provide
evidence of a positive change in the content knowledge of teachers and students. These
results coincide with those expressed by Yoon et al. [1] in terms of the lack of valid and
reliable scientific evaluations of many professional development programs in math and
science.
A year later, Blank et al. [4] analyzed the findings of the evaluations of the 25
professional development programs for math and science teachers in 14 states. These
authors reported that, among other things:
a) Seven of the studies reported measurement of the effect of the teachers’ professional
development activities on the results of the students’ academic achievement.
b) Ten of the studies reported measurement of the increase in the teachers’ content
knowledge and four reported measurement of the effects of the teachers’ teaching
practices.
Scientific International Journal™ Vol. 7 No. 2 · May-August 2010 8
c) Those programs that reported an increase in content knowledge in math and science
exposed the teachers to 50 hours or more of content training.
d) Only one third of the programs carried out evaluations that were based on scientific
research designs, which produced findings based on the measurement of the effects
on student achievement and changes in teaching practices.
e) Nearly 25% of the programs included a comparison between an experimental group
and a control group.
…many projects do not carry out evaluations and, even when they do, they rarely use techniques and criteria that are accepted by the experts in the field.
f) Four of the programs implemented adequate instruments for data collection and
analysis to compare teaching practices in the classroom, by utilizing teacher samples.
On the other hand, Capacity [5], which for evaluation purposes supports projects
and programs sponsored by the National Science Foundation (NSF), has developed an
evaluation model known as “Context-Sensitive Evaluation Model Development”. This
model attempts to involve all the participants in the educational process in order to
incorporate relevant factors that promote meaningful
results in educational reform, which are often
overlooked. Among these, there are: implementation
strategies, results of the teachers’ and students’
scholarship, choice of professional careers in math and
science, and an adequate dissemination of evaluation
models and their results among the projects. The latter is of upmost importance for the
Consortium for Building Evaluation Capacity (CBEC), which states that many projects
do not carry out evaluations and that, even when they do, they rarely use techniques and
criteria that are accepted by the experts in the field. It also expresses that some existing
evaluation models cannot easily accommodate the current intricacies of the educational
programs and their reforms. Another situation that is criticized is that, even while there
are evaluation models that can be disseminated, other projects (math, science and
technology, and STEM) do not take them into account in order to improve the present
ones.
The Expert Science Teaching Educational Evaluation Model (ESTEEM)
presented by Burry-Stock [6] of the University of Alabama, established evaluation
instruments that have their philosophical roots in the teacher’s duty to provide the best
Scientific International Journal™ Vol. 7 No. 2 · May-August 2010 9
… is very important that the professional development evaluations be focused on a better understanding of what influences the teachers’ knowledge and documents its impact on the content knowledge of the students.
environment and the best method in support of the students’ learning process. In their
research, they adopted the model developed by Michael Scriven, called “Evaluation
Model Based on the Teachers’ Duties;” this includes five categories: (1) Content
knowledge of the subject; (2) Teachings skills; (3)
Assessment skills; (4) Professionalism and (5) Other
contributions to the school. They stated that this model
serves as a foundation for the use of various methods of
evaluating teachers, such as: peer evaluation, external
evaluation, and self-evaluation. However, they realized
that the main hurdle was the lack of information
regarding the criteria used to consider the expertise of
the teachers.
Lowden [7] stated that few research have documented their impact, expenses and
effects, and that, frequently, professional development evaluations only evaluate the
participants’ satisfaction and/or opinions in terms of their experiences during the
learning process. He added that it is very important that the professional development
evaluations be focused on a better understanding of what influences the teachers’
knowledge and documents its impact on the content knowledge of the students. His
affirmations coincide with those (aforementioned) of Burry-Stock, Capacity, Yoon,
Blank and Livingston.
Lowden [7] also presented Thomas R. Guskey’s evaluation model, which includes
five levels for the gathering of information with regard to professional development and
are structured hierarchically from simple to complex. The five levels are: 1) Reactions of
the participants, 2) The participants’ learning, 3) Organization, help and change, 4) Use
of new abilities and knowledge, and 5) Results of student learning. According to Lowden
[7], this model abides by all the considerations for an appropriate evaluation. The AMCT
evaluation model coincides with four (1, 2, 4, and 5) of the levels of Guskey’s model.
Guskey also stated that:
• If an evaluation is planned more carefully, not only will the evaluation process be
easier, but it will also be better directed toward an effective professional
development.
Scientific International Journal™ Vol. 7 No. 2 · May-August 2010 10
• Many leaders avoid carrying out systematic evaluations for fear of not passing the
test. That is, they fear that the evaluation will reflect that their work is not focused
on improving the students’ learning.
• In certain aspects of the allocation of funds for the No Child Left Behind Act
(NCLB), the federal government finds itself frustrated because it can neither see
nor control its outcome.
• In the past, teachers have often planned the professional development based on
what is new and critical, more than on what they should know in order to work
with, help, and teach their students.
• In the NCLB Act, the federal government imposes specific requirements so that
the teachers only consider programs and innovations that are “scientifically-based
research.” Teachers should now verify whether research is what is behind these
programs and innovations. They should make sure that the research comes from
reliable sources, particularly, from peer-reviewed articles; they should establish
that the programs have been applied in a wide variety of contexts, and that their
effects have been evaluated by third persons. Dr. Guskey also said that he has met
with leaders from the Department of Education and from various philanthropic
organizations who have suggested that he consider changes in the content of the
proposals so that they may be more specific in terms of whatever relates to
evaluation.
ICVET [8] presented four models that evaluate professional development called
1) Donald Kirkpatrick and Thomas Guskey, 2) Anona Armstrong, 3) Zita Unger and
Anthea Rutter, and 4) Program Logic. Regarding the Kirkpatrick and Guskey model,
which is based on a four-level evaluation structure, it has survived more than 30 years of
development in the field of evaluation. The first three levels are centered in trainings,
reactions, learning, and changes in behavior. The fourth element refers to benefits and
organizational results. This model served as a basis for Guskey’s (aforementioned), who
expanded it with questionnaires and proformas. Anona Armstrong’s model is also based
on Kirkpatrick and Guskey. In its first phase, it proposes four levels for the program’s
design, where it reviews the criteria, procedures, and results of the evaluation. As a
second phase, it proposes an evaluation setting that contains the criteria to be evaluated,
Scientific International Journal™ Vol. 7 No. 2 · May-August 2010 11
the procedure for the collection and analysis of data, along with its results. Armstrong’s
model evaluates the program’s design and proceeds with a very detailed and specific
evaluation procedure, concluding with an analysis that includes such variables as
productivity and quality.
Zita Unger and Anthea Rutter developed a model in which the training needs are
aligned with the need for profitability. It is called Strategic Training Evaluation Model
(STEM), also known as Investment Return. It is based on determining the information
needs for the board of directors for each of the stages of the professional development
training, their different prospects, and their perceptions regarding the investment in each
stage. Once this is done, the STEM process is used to help in the alignment of the
training needs with the need for profitability, and evaluates the contribution of the
trainings and development in order to achieve the objectives. In this case, the importance
given to the return on the investment is supported by the fact that each board of directors
or key staff member has something specific in mind that defines the success or failure of
the program. This constitutes its investment (e.g., experience, time, prestige, money, and
credibility) in the training events. The evaluation strategy of this model seeks to extract
information of the measurement and impact of these variables.
The Logical Program Model is recommended because of its usefulness in the
development of an understanding of the critical elements in a program’s operation. This
model’s structure revolves around work-based learning. It begins with an analysis of the
program, identifying the program’s logic, making it explicit. The essence of a logical
program is the premise used to create an explicit scheme of the causal relationship among
the program’s components. In this model, the starting point is thinking about what the
program aims to achieve. The hierarchy begins from the lowest level of the program’s
activities and its performance at various levels. Then, the intermediate and final results
follow. The cardinal objective of this hierarchy is to show the correlation between
performance and results. The hierarchy of results helps identify which needs are in first
place before reaching the second step, the cause/effect relation and/or the contingency
relationships.
Scientific International Journal™ Vol. 7 No. 2 · May-August 2010 12
A noteworthy aspect of the AMCT Model is that the external evaluation contributes not only to the formative and summative evaluation, but also includes pre-evaluation, thus, becoming involved in the process from the outset of the Program…
Hanley et al. [9] designed the “Transition of Change Model” to evaluate
professional development programs. It is a model focused more on exploring the
processes of a program than on the results of an intervention. The authors contend that
this model provides a rational framework to conceptualize and evaluate changes that take
place throughout a variety of organizational agencies in the program. The four
components that the model explores are: 1) the duties of the agent of change, 2)
expression of the program’s vision, 3) people’s transition and commitment to the vision,
and 4) maintenance and renewal of change. This model adopted the guidelines of the
Guskey Model with regard to improvement in professional development.
Caracelli [10] states that there should be a
change in the evaluation processes geared toward
educational accountability that involves measurement
of results or efficiency. The federal evaluations rely on
studies with mixed method designs that are able to
provide evidence or reliable results. On the other hand,
Frechtling [11] states that the evaluation is suitable in
order to determine whether the objectives, goals, and
purposes have been achieved. Furthermore, the
information that is acquired should facilitate the course of action to be taken. If the results
are positive, the program’s continuation is justified, as long as an appropriate updating is
carried out. If the results are negative, measures are taken to correct, radically change, or
discontinue the program.
THE AMCT EVALUATION MODEL
T he AMCT Evaluation Model (Figure 2) is a mixed model. It contains
quantitative and qualitative elements, internal and external evaluation,
and formative and summative evaluation. A noteworthy aspect of the
AMCT Model is that the external evaluation contributes not only to the formative and
summative evaluation, but also includes pre-evaluation, thus, becoming involved in the
process from the outset of the Program, through the inspection of the work plan, and then,
based on the work plan, establishing its own evaluation plan.
Scientific International Journal™ Vol. 7 No. 2 · May-August 2010 13
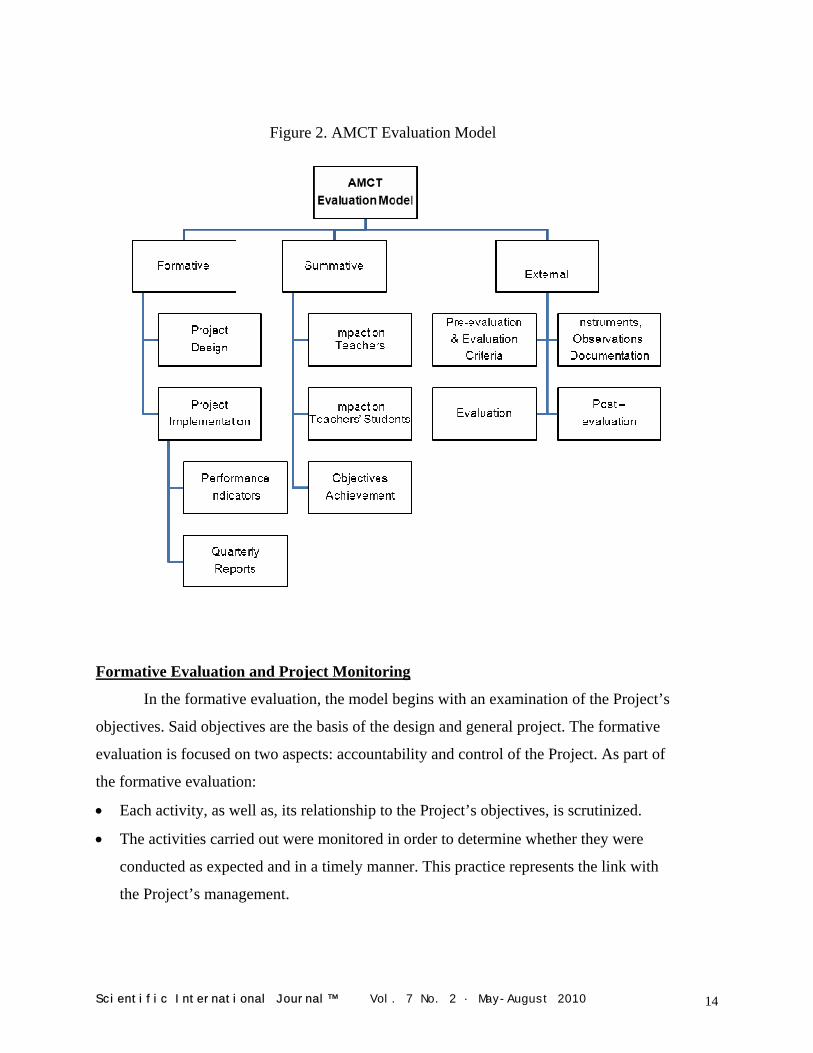
Figure 2. AMCT Evaluation Model
Formative Evaluation and Project Monitoring
In the formative evaluation, the model begins with an examination of the Project’s
objectives. Said objectives are the basis of the design and general project. The formative
evaluation is focused on two aspects: accountability and control of the Project. As part of
the formative evaluation:
• Each activity, as well as, its relationship to the Project’s objectives, is scrutinized.
• The activities carried out were monitored in order to determine whether they were
conducted as expected and in a timely manner. This practice represents the link with
the Project’s management.
Scientific International Journal™ Vol. 7 No. 2 · May-August 2010 14
• Along with the formative evaluation, control of the Project is carried out, which
represents a key factor for the design and implementation of corrective measures
towards the achievement of the Project’s objectives. Particular emphasis is given to
the control of the critical activities, those that could delay the Project’s execution or
otherwise affect the achievement of the objectives.
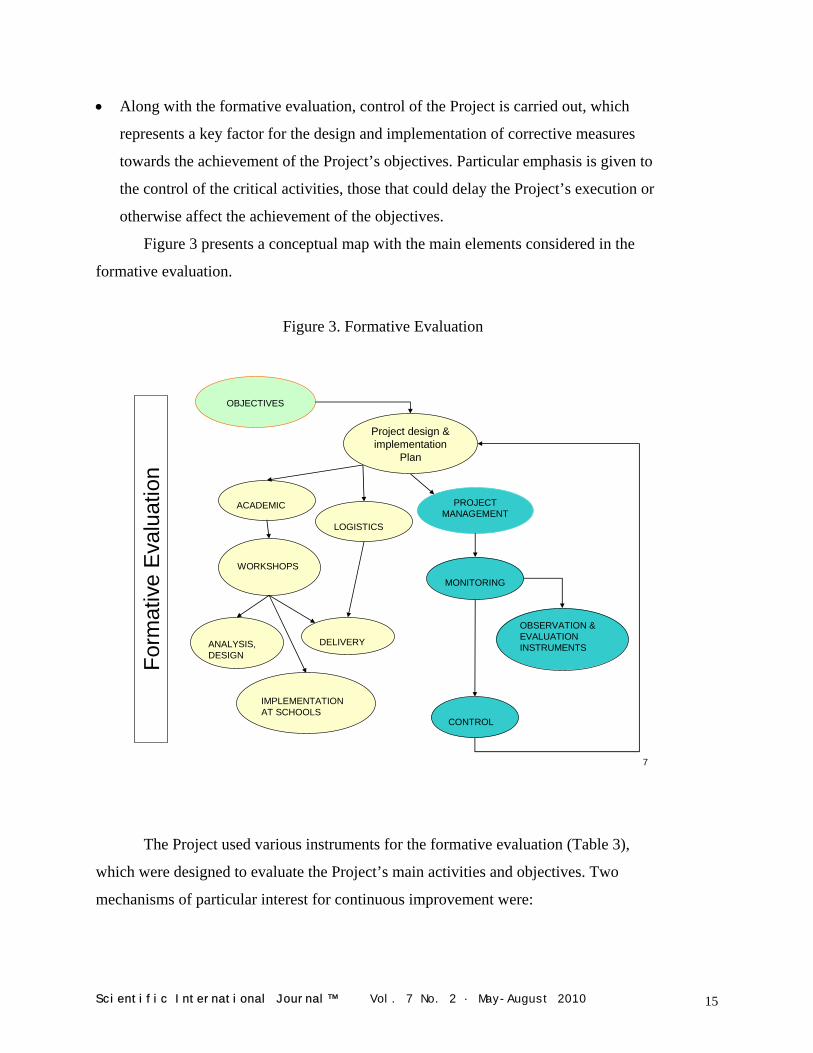
Figure 3 presents a conceptual map with the main elements considered in the
formative evaluation.
Figure 3. Formative Evaluation
Form
ativ
e E
valu
atio
n
OBJECTIVES
ACADEMIC PROJECTMANAGEMENT
WORKSHOPS
IMPLEMENTATION AT SCHOOLS
MONITORING
OBSERVATION & EVALUATION INSTRUMENTSANALYSIS,
DESIGNDELIVERY
CONTROL
LOGISTICS
Project design & implementation
Plan
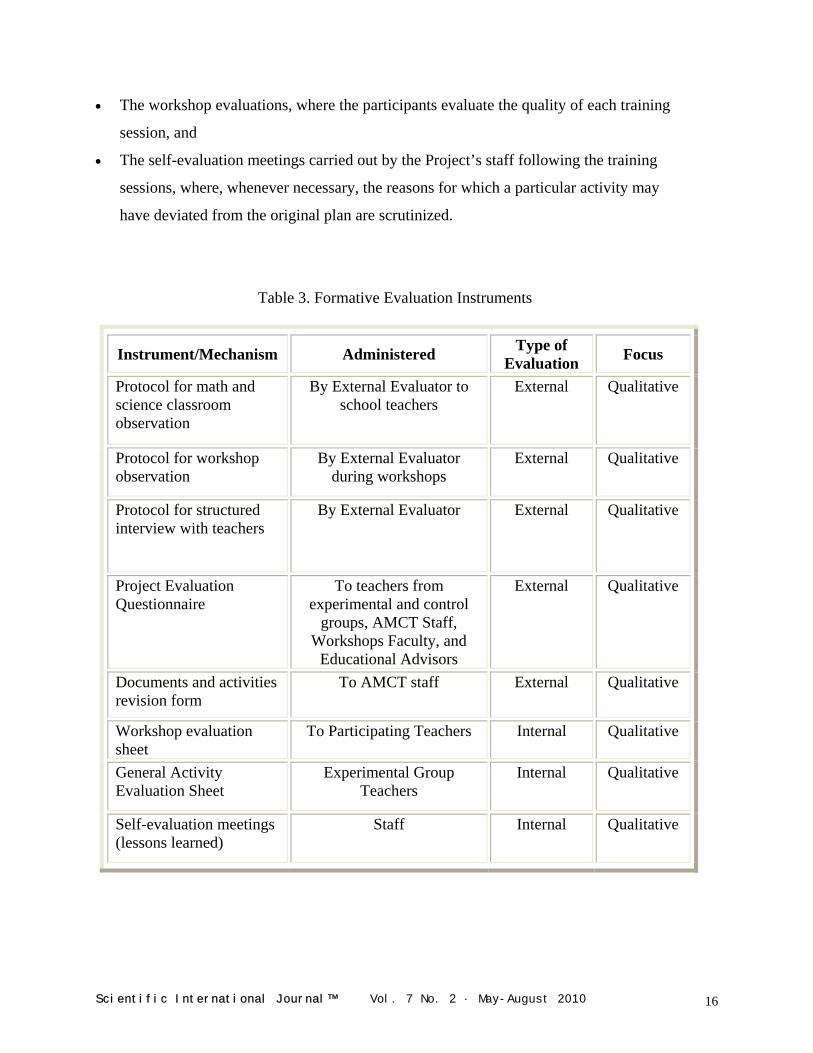
The Project used various instruments for the formative evalu
which were designed to evaluate the Project’s main activities and ob
mechanisms of particular interest for continuous improvement were
Scientific International Journal™ Vol. 7 No. 2 · May-Aug
7
ation (Table 3),
jectives. Two
:
ust 2010 15
• The workshop evaluations, where the participants evaluate the quality of each training
session, and
• The self-evaluation meetings carried out by the Project’s staff following the training
sessions, where, whenever necessary, the reasons for which a particular activity may
have deviated from the original plan are scrutinized.
Table 3. Formative Evaluation Instruments
Instrument/Mechanism Administered Type of Evaluation Focus
Protocol for math and science classroom observation
By External Evaluator to school teachers
External Qualitative
Protocol for workshop observation
By External Evaluator during workshops
External Qualitative
Protocol for structured interview with teachers
By External Evaluator External Qualitative
Project Evaluation Questionnaire
To teachers from experimental and control
groups, AMCT Staff, Workshops Faculty, and
Educational Advisors
External Qualitative
Documents and activities revision form
To AMCT staff External Qualitative
Workshop evaluation sheet
To Participating Teachers Internal Qualitative
General Activity Evaluation Sheet
Experimental Group Teachers
Internal Qualitative
Self-evaluation meetings (lessons learned)
Staff Internal Qualitative
Scientific International Journal™ Vol. 7 No. 2 · May-August 2010 16
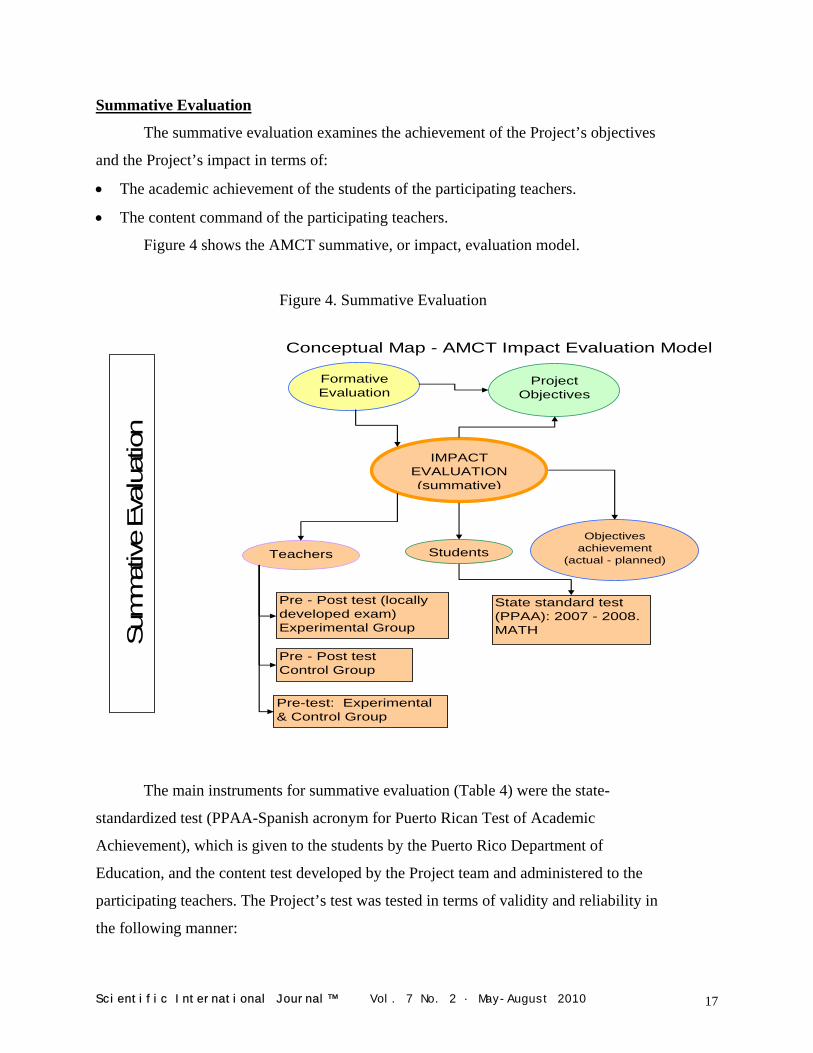
Summative Evaluation
The summative evaluation examines the achievement of the Project’s objectives
and the Project’s impact in terms of:
• The academic achievement of the students of the participating teachers.
• The content command of the participating teachers.
Figure 4 shows the AMCT summative, or impact, evaluation model.
Figure 4. Summative Evaluation
Conceptual Map - AMCT Impact Evaluation Model
Sum
mat
ive
Eva
luat
ion
Formative Evaluation
Project Objectives
IMPACT EVALUATION (summative)
TeachersObjectives
achievement (actual - planned)
Students
Pre - Post test (locally developed exam) Experimental Group
Pre-test: Experimental & Control Group
Pre - Post test Control Group
State standard test (PPAA): 2007 - 2008. MATH
The main instruments for summative evaluation (Table 4) were the state-
standardized test (PPAA-Spanish acronym for Puerto Rican Test of Academic
Achievement), which is given to the students by the Puerto Rico Department of
Education, and the content test developed by the Project team and administered to the
participating teachers. The Project’s test was tested in terms of validity and reliability in
the following manner:
Scientific International Journal™ Vol. 7 No. 2 · May-August 2010 17
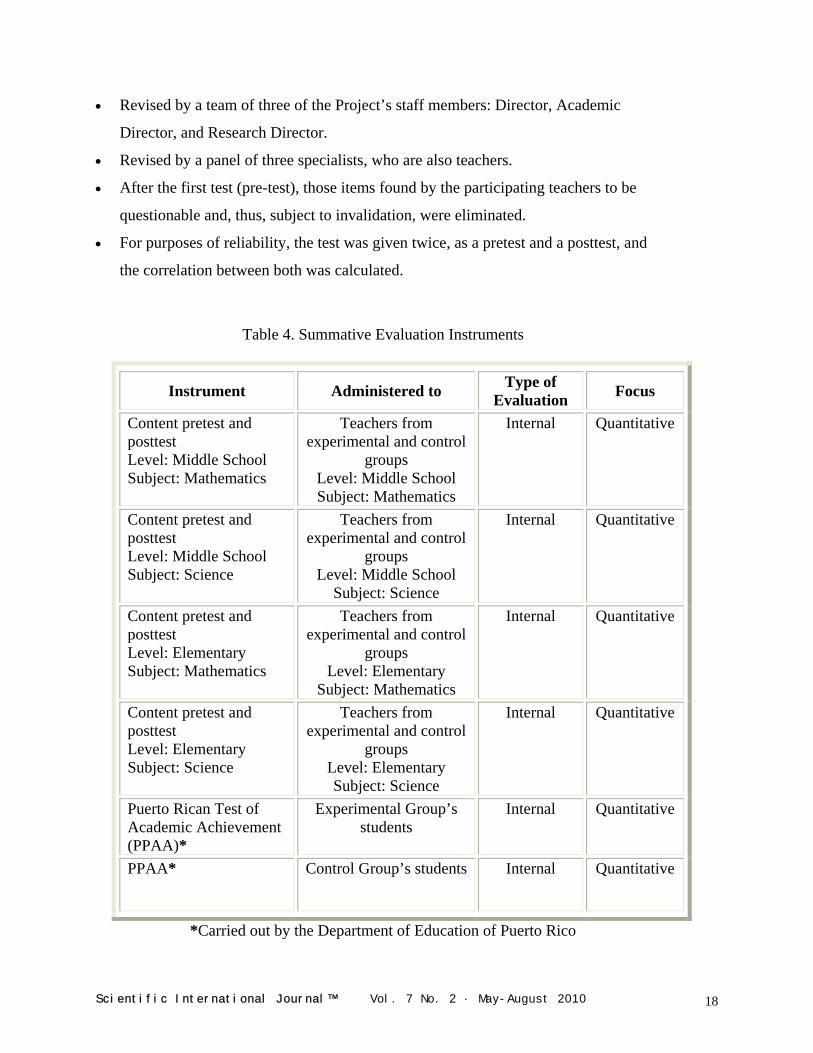
• Revised by a team of three of the Project’s staff members: Director, Academic
Director, and Research Director.
• Revised by a panel of three specialists, who are also teachers.
• After the first test (pre-test), those items found by the participating teachers to be
questionable and, thus, subject to invalidation, were eliminated.
• For purposes of reliability, the test was given twice, as a pretest and a posttest, and
the correlation between both was calculated.
Table 4. Summative Evaluation Instruments
Instrument Administered to Type of Evaluation Focus
Content pretest and posttest Level: Middle School Subject: Mathematics
Teachers from experimental and control
groups Level: Middle School Subject: Mathematics
Internal Quantitative
Content pretest and posttest Level: Middle School Subject: Science
Teachers from experimental and control
groups Level: Middle School
Subject: Science
Internal Quantitative
Content pretest and posttest Level: Elementary Subject: Mathematics
Teachers from experimental and control
groups Level: Elementary
Subject: Mathematics
Internal Quantitative
Content pretest and posttest Level: Elementary Subject: Science
Teachers from experimental and control
groups Level: Elementary Subject: Science
Internal Quantitative
Puerto Rican Test of Academic Achievement (PPAA)*
Experimental Group’s students
Internal Quantitative
PPAA* Control Group’s students Internal Quantitative
*Carried out by the Department of Education of Puerto Rico
Scientific International Journal™ Vol. 7 No. 2 · May-August 2010 18
METHODOLOGY AND RESEARCH DESIGN FOR IMPACT EVALUATION
wo of the Project’s objectives were to increase the content command of
the participating teachers and to increase the content command of their
students. The impact, or summative, evaluation measures increases
through a research methodology based on a quasi-experimental design with matched
comparison group. The comparison group, or control group, is very similar to the group
that receives the intervention, or experimental group, in terms of participation
requirements and demographic characteristics (both groups were made up of teachers
from the same geographic region). Furthermore, the time period in which the two groups
were studied was the same, as well as, the methods used to collect and analyze the data.
T
The impact evaluation was measured by four experiments, each with its own
corresponding formulation and hypothesis testing (level of significance α = 0.05 and
error type II, β < 0.2):
• The first experiment seeks to prove that the intervention increases the participants’
command of the content, through pretests and posttests on content given to the
experimental group.
• The second experiment’s objective is to demonstrate that the Project is the
determining factor that causes the increase – if any – of the participants’ command of
the math and science content, through pretests and posttests given to the control
group.
• The third experiment’s objective is to show that, at the beginning of the Project, the
experimental group’s command of the content is not superior to the control group’s
command, by comparing the results of pretests given to both the experimental group
and the control group.
• The fourth experiment examines whether there was an increase in the academic
achievement of the participants’ students, by comparing the results of the PPAA of
the two most recent years.
Scientific International Journal™ Vol. 7 No. 2 · May-August 2010 19
CONCLUSIONS
he AMCT Evaluation Model complies with the view of Caracelli [10] in
terms of accountability, with Frechtling [11] in terms of goals and
objectives achievement, with Hanley et al. [9] in terms of process
improvement and change, with Lowden [7], who presented Guskey’s model, in terms of
considering participants’ reactions and learning, support for changing and using the new
knowledge and skills acquired during the AMCT trainings and, last but not least, with
Blank et al. [3] that use the following criteria to revise math and science professional
development programs: quality of implementation, increase of teachers’ content
knowledge, support for change in the instructional practices in the classroom, and effect
on the students’ academic achievement.
T
The Project’s objectives are the basis of the AMCT Evaluation Model. The
AMCT evaluation model was empirically tested and fine-tuned during two consecutive
years. The timely application of the model has been instrumental in the Project’s
performance. The formative evaluation supports the Project’s management, particularly,
the control of the Project, in terms of making timely decisions in order to adjust the
course of the Project, whenever necessary. The experimental design used in the
summative evaluation allows for planning, in advance, the necessary activities and
instrument design for the collection of information and hypothesis testing. The impact
evaluation takes on its true dimension provided that the groundwork needed for its
implementation is done at the outset of the Project. The structure for the evaluation model
(i.e., formative and summative, qualitative and quantitative) allows for the tackling of the
intricacies that are typical of the implementation of an educational project. A limitation of
the model is the use of a state standardized test (i.e., the PPAA) which has changed
throughout the years. Consequently, the results of such tests are not suitable for
comparison from one year to another.
ACKNOWLEDGEMENTS
The authors wish to thank the anonymous reviewers for their insightful comments
and suggestions and to Maggie Olmo-Correa for the English translation.
Scientific International Journal™ Vol. 7 No. 2 · May-August 2010 20
REFERENCES
1. Yoon, K.S., Duncan, T., Yu Lee, S. W., Scarloss, B., Shapley, K. L. Reviewing the
evidence on how teacher professional development affects student achievement, in Issues & Answers N. 033, Editor. 2007, U.S. Department of Education, Institute of Education Science: Washington. p. 1-54.
2. Livingston, K.M., et al. Evaluation: judgmental or developmental? European Journal of Teacher Education. 2005. 28(2): p. 165-178.
3. Blank, R.K., De las Alas, N., Smith, C. Analysis of the Quality of Professional Development Programs for Mathematics and Science Teachers: Findings from a Cross-State Study, in Improving Evaluation of Professional Development in Mathematics and Science Education. 2007. Council of Chief State School Officers: Washington, D.C.
4. Blank, R.K., De las Alas, N., Smith, C. Does Teacher Professional Development have Effects on Teaching and Learning. 2008. The Council of Chief State School Officers: Washington, D.C.
5. Capacity, C.f.B.E. Evaluation Model Development. Context-Sensitive Evaluation Models. CBEC- Model Development [Website] 2008 [cited 2000 July 05, 2008].
6. Burry-Stock, J.A.O., R.L. (1993) Expert Science Teaching Educational Evaluation Model (ESTEEM) for Measuring Excellence in Science Teaching for Professional Development (ERIC) Document Reproduction Service No. ED 336 633).
7. Lowden, C. Evaluating the impact of professional development. The Journal of Research in Professional Learning. 2005. p. 1, 2, 3 and 4.
8. ICVET, T.N.I.C.f.V.T.a.L. Professional Development Evaluation - Models and tools. 2008 [cited 2008 July 17, 2008].
9. Hanley, P., Maringe, F. & Ratcliffe, M. (2008) Evaluation of Professional Development: Deploying a process-focused model. International Journal of Science Education. p. 711-725.
10. Caracelli, V.J. Enhancing the Policy Process Through the Use of Ethnography and Other Study Frameworks: A Mixed-Method Strategy. Research in the Schools. 2006. 13(1): p. 84-92.
11. Frechtling, J. The 2002 User-Friendly Handbook for Project Evaluation. 2002. National Science Foundation. p. 94.
AUTHORS
Dr. Oscar A. Sáenz – Associate Professor, Industrial and Management Engineering Department Director, and Mathematics and Science Partnership Project Director, Universidad del Turabo. Gurabo, Puerto Rico. Electronic mail: [email protected] Prof. Mylord Reyes Tosta – Professor and Mathematics and Science Partnership Project Co-Director, Universidad del Turabo. Gurabo, Puerto Rico. Electronic mail: myreyes@ suagm.edu Copyright © 2010 Non-Profit Evaluation & Resource Center, Inc.
Scientific International Journal™ Vol. 7 No. 2 · May-August 2010 21
CARDIOVASCULAR DISEASE PREVENTION: INTERNET
RESOURCES FOR A TEACHING UNIT Prof. Aldo T. Marrocco
INTRODUCTION
he need has been felt to find stimuli for getting
young students interested in the subject
“Health”, helping them to understand the
importance of this gift, which nature has endowed them, in the
optic of doing their best to preserve it. For this reason, internet
resources had been searched such as scientific publications,
atlases, images, graphics and animations that help study
cardiovascular disease (CVD) prevention through a study route
where a “health” culture is promoted in the widest sense.
T
According to the World Health Organization (WHO), cardiovascular diseases
contributed to 16.7 million (29.2%) of total global deaths in 2003.1 Also, at least 20
million survived CVD, therefore, requiring much clinical care. Most of the burden is
attributed to stroke or myocardial infarction and four out of five of these deaths occurred
in low- and middle-income countries.
AIMS OF THE TEACHING UNIT
ince this subject is very complex, this paper is just an introduction to the
study. Stroke and myocardial infarction are the starting point of an
educational route toward an increased awareness of the consequences of
our behavior on our health. These consequences can be positive or negative. The risk
factors are determined, to a great extent, by behaviors learned in childhood and continued
in adulthood such as dietary habits and smoking.
S
Scientific International Journal™ Vol. 7 No. 2 · May-August 2010 22
MATE METHODS RIALS AND
ome documents from the WHO concerning CVD and their prevention,
such as the Atlas of Heart Disease and Stroke2 and the Tobacco Atlas3 are
available, including information about the situation in the world. Also,
several online animations help to better understand the mechanisms of some CVD,4,5
diabetes and its relationship with obesity,6,7 and the relationship between salt and blood
pressure (BP).8
S An important resource for sanitary education is Pubmed, a free digital database of
biomedical and life sciences journal literature which provides access to millions of
papers.9,10 The American Heart Association published a guideline (Primary Prevention of
Ischemic Stroke), which contains 572 citations for further deepening.11 In addition, the
WHO published a document entitled “Avoiding heart attacks and strokes”.12 These
documents are the base of this manuscript.
This teaching unit may cut across Science, English, gymnastics and geography.
When working in the classroom with students that have basic knowledge about anatomy
and physiology, the computer was used for the research and the reading of these
documents. Then, face to face explanations, discussion and verifications followed.
DISCUSSION
he stroke is a neurological deficit due to an interruption of cerebral
blood flow, usually caused by a blockage or bleeding. Some of its risk
factors are no modifiable; therefore, it is important to know them, since
they identify who is at highest risk of stroke and who may benefit from rigorous
prevention.
T Factors such as aging, male gender and low birth weight (<2500 g) are
statistically associated with greater risk. Other factors have some influence, including
genetic and racial ones. A BP higher than 90/140 mm Hg is the first modifiable risk
factor because the hypertension acting on the walls of the arteries can cause bleeding.
However, many doctors advise, if possible, to have an even lower BP. To a certain level,
hypertension is asymptomatic and many people have been undiagnosed.
Scientific International Journal™ Vol. 7 No. 2 · May-August 2010 23
A lower risk of stroke is associated with an increased consumption of fruits and
vegetables. This applies to a lower sodium intake and an increased consumption of
potassium as well. A diet not too rich in fat is generally associated with a lower risk.
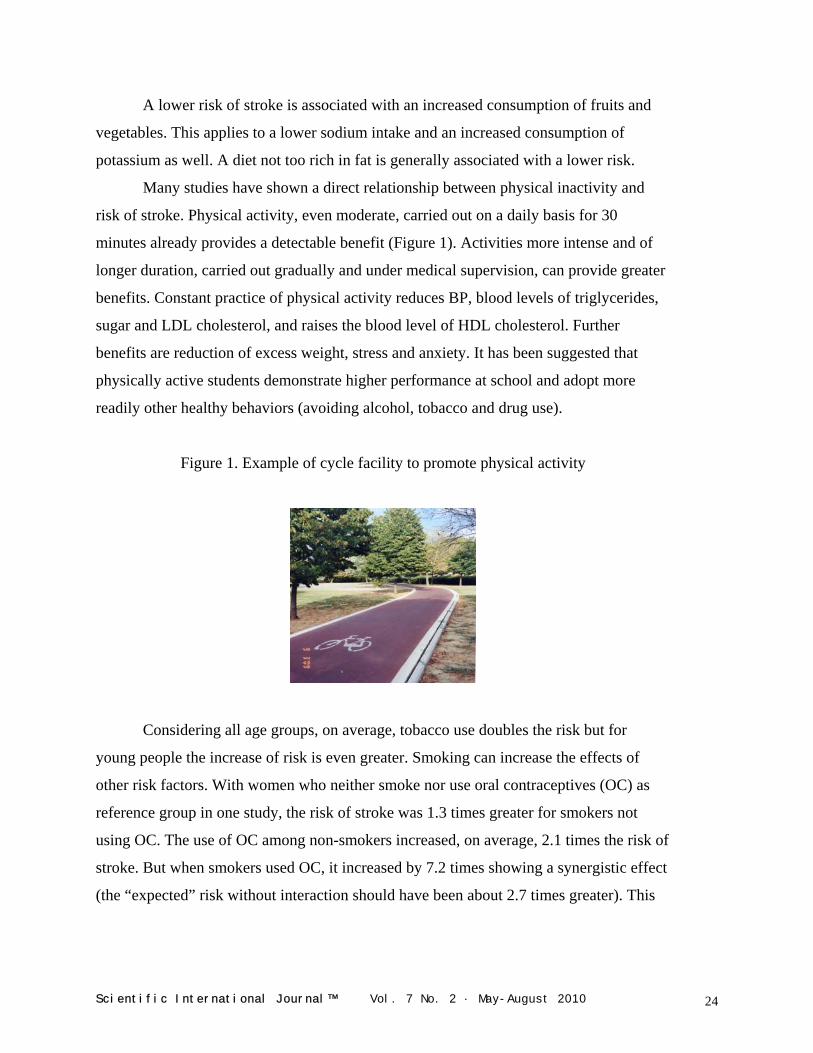
Many studies have shown a direct relationship between physical inactivity and
risk of stroke. Physical activity, even moderate, carried out on a daily basis for 30
minutes already provides a detectable benefit (Figure 1). Activities more intense and of
longer duration, carried out gradually and under medical supervision, can provide greater
benefits. Constant practice of physical activity reduces BP, blood levels of triglycerides,
sugar and LDL cholesterol, and raises the blood level of HDL cholesterol. Further
benefits are reduction of excess weight, stress and anxiety. It has been suggested that
physically active students demonstrate higher performance at school and adopt more
readily other healthy behaviors (avoiding alcohol, tobacco and drug use).
Figure 1. Example of cycle facility to promote physical activity
Considering all age groups, on average, tobacco use doubles the risk but for
young people the increase of risk is even greater. Smoking can increase the effects of
other risk factors. With women who neither smoke nor use oral contraceptives (OC) as
reference group in one study, the risk of stroke was 1.3 times greater for smokers not
using OC. The use of OC among non-smokers increased, on average, 2.1 times the risk of
stroke. But when smokers used OC, it increased by 7.2 times showing a synergistic effect
(the “expected” risk without interaction should have been about 2.7 times greater). This
Scientific International Journal™ Vol. 7 No. 2 · May-August 2010 24
happened in the past with the first generation of OC users. Today, with modern low-dose
hormone OC, even assuming that the risk persists, it is considered very minor.
In terms of education, alcohol is a very sensitive issue since notoriously other factors come into psuch as dangerous drivininteractions with other substances, etc.
lay g,
The relationship between use of alcohol and risk of stroke is expressed by a "J-
shaped" curve. In particular, a low wine consumption is
statistically associated with increased HDL cholesterol,
reduced platelet aggregation, lower concentration of
plasmatic fibrinogen and, therefore, a lower risk
situation as compared to what happens in abstainers.
High consumption of alcohol is very risky since it can
lead to high BP, hypercoagulability, reduced cerebral
blood flow and a greater likelihood of atrial fibrillation. Alcohol can induce dependence
and its abuse is a major public health problem. In terms of education, alcohol is a very
sensitive issue since notoriously other factors come into play such as dangerous driving,
interactions with other substances, etc. Young people and pregnant women should
particularly be bewaring of alcohol.
The use of drugs, including cocaine, amphetamines and heroin, is associated with
increased risk of stroke as it can lead to sudden changes of the BP, embolization,
increased blood viscosity, aggregation of platelets and vascular changes. A study
considering all the age groups showed that drug addiction increases the risk of stroke by
6.5 times. According to this study, but considering only the age groups below 35 years,
the risk is 11.2 times greater, allowing us to understand how much more vulnerable are
young people.
Among the pathologies associated with an increased risk of stroke is type 2
diabetes. It was observed that, in a group of diabetic patients with mean BP 87/154, the
risk was 44% higher than in a group with mean BP 82/144.
Myocardial infarction is caused by an interruption of blood flow to the heart
muscle. This is frequently caused by the accumulation of fatty deposits (atheroma) on the
inner walls of the arteries. The arteries become more rigid and their section decreases,
with increased likelihood that a possible blood clot blocks them. If a blockage takes place
in the arteries of the brain, the stroke occurs; if it happens in the coronary arteries, the
myocardial infarction is the consequence.
Scientific International Journal™ Vol. 7 No. 2 · May-August 2010 25
Overweight and obesity are statistically associated with a high CVD risk. The
body mass index is calculated by dividing the weight in kilograms by the square of height
in meters, ideally it should be between 18.5 and 24.9. A person is considered overweight
when the index is between 25 and 29.9 and obese beyond this value. Abdominal obesity
is achieved with waist circumference exceeding 102 cm for men and 88 cm for women.
This is associated with the presence of visceral fat harmful for metabolism. In this regard,
there are some differences among human races.
Type 2 diabetes is a metabolic disorder which hampers the release of glucose
from the blood to the cells that use it. The result is a fasting glycemia too high, beyond
126 mg/dl (=7 mmol/l), that can accelerate the formation of atheroma resulting in
narrower and harder arteries, with a greater risk of stroke and myocardial infarction.
Diabetes, up to a certain level, is asymptomatic and many people do not know that they
have it. Overweight, physical inactivity, a diet rich in fat and sugars but low in fiber, as
well as abuse of alcohol favor it. Type 2 diabetes occurs generally among adults, but now
the number of young people with this pathology is increasing in many countries.
According to the WHO, BP exceeding 90/140 mm Hg, besides damaging the
arteries leads to a stressing situation for the heart. Overweight, smoking, alcohol abuse,
salty foods, as well as physical inactivity increase BP. High
levels of triglycerides (>150 mg/dl) and LDL cholesterol
(>115 mg/dl), favor the formation of atheroma or plaques of
cholesterol, with consequent CVD risks. The HDL cholesterol
should exceed 40 mg/dl in men and 46 mg/dl in women; this is
beneficial because it has the opposite effect than the LDL.
Among the strategies set by the WHO for the prevention of
CVD are:
1. Consuming limited amounts of foods containing saturated fats.
2. Eating omega-3 contained in certain fish and certain vegetable oils
(remembering, however, that every fat, saturated or not, when taken in excessive amounts
promotes overweight.)
3. Having a fiber rich diet hence oriented towards fruit, vegetables, legumes and
whole grains.
Scientific International Journal™ Vol. 7 No. 2 · May-August 2010 26
4. Practicing a physical activity even moderate such as walking, housework or
gardening, for at least 30 minutes a day, possibly continued on a daily basis. Physical
inactivity increases the risk of coronary heart disease and ischemic stroke by around 1.5
times.
5. Avoiding smoking and abuse of alcohol. The risks are much higher in people
who started smoking before the age of 16.
6. Maintaining a regular body weight. Obese children are very likely to remain
obese into adulthood and to develop CVD and diabetes.
7. Limiting salty foods and sugar. Many preserved, canned, and prepared foods
very often contain a lot of added salt; this notoriously raises BP. Generally, simple
sugars, unlike the complex ones, are rapidly absorbed into the bloodstream and contribute
to high postprandial blood glucose.
The glycemic index of a food indicates how quickly a given amount of sugars
present therein, enters the bloodstream hence causing a more or less sharp increase in
postprandial glycemia. Every food has its own index, depending on the type of fiber and
of sugar it contains, on the acidity, which affects the stomach emptying rate, as well as on
other components.
According to Kaye Foster-Powell et al. (2002) the index is influenced by
industrial processes and the type of cooking method; even botanical differences (e.g.
between different varieties of rice) explain different glycemic indexes.13 A prolonged use
of carbohydrate rich foods with high glycemic index is associated with an increased risk
of type 2 diabetes and CVD.
A heavy workload, especially if coinciding with situations where the employee
has little power to decide, according to Hintsanen Mirka et al. (2005), determines in the
long period, in the most sensitive individuals, thickening of the carotid walls as a
consequence of BP rise.14 This is known to be associated with increased CVD risk.
The effect of yoga on risk factors for CVD was studied by Kyeongra (2007),
reviewing 32 scientific papers published in recent decades.15 Even observing that further
research would be necessary, he concludes that this practice can produce benefits with
regards to blood lipids, overweight, glycemia, and BP. After reviewing 150 papers, Kim
and Heather (2007) confirm these conclusions adding that yoga can also reduce the
Scientific International Journal™ Vol. 7 No. 2 · May-August 2010 27
effects of stress, anxiety, depression, sleep disorders and other factors, further
contributing to CVD prevention.16 According to many yoga teachers, different positions
may have therapeutic effects,17 but in certain specific situations, there can be also
contraindications.
Some countries are facing the double burden of obesity and malnutrition.
The effect of laughter on blood sugar was observed by Hayashi et al. (2003).18 On
a group of volunteers, including 19 diabetic (type 2) not in therapy and 5 healthy
individuals, glycemia was measured before and 2 hours after a meal of 500 kcal. The first
day, after the meal, the volunteers attended a monotonous conference. The next day, after
the meal, they attended a comic comedy that caused intense laughter. Both healthy
individuals and those with diabetes, as expected, always had a rise in postprandial blood
glucose, obviously sharper in the latter. But when they had attended the monotonous
conference the glycemia rose by 6.8 mmol /l in diabetic
and 2.0 mmol /l in healthy subjects, whereas in the case of
comic comedy the blood glucose rose by only 4.3 mmol /l
in diabetic and 1.2 mmol /l in healthy subjects. The authors
attributed the difference to an accelerated consumption of
glucose by the muscles involved in the action of laughing, but speculate that the laughter
has also acted on the neuroendocrine system limiting the rise of glycemia.
According to the WHO, childhood obesity is an epidemic concerning Industrial
and Third World countries, at least for certain population groups.19 Some countries are
facing the double burden of obesity and malnutrition. The WHO provides much guidance
on how to deal with this in schools. The suggestions included the use of school garden to
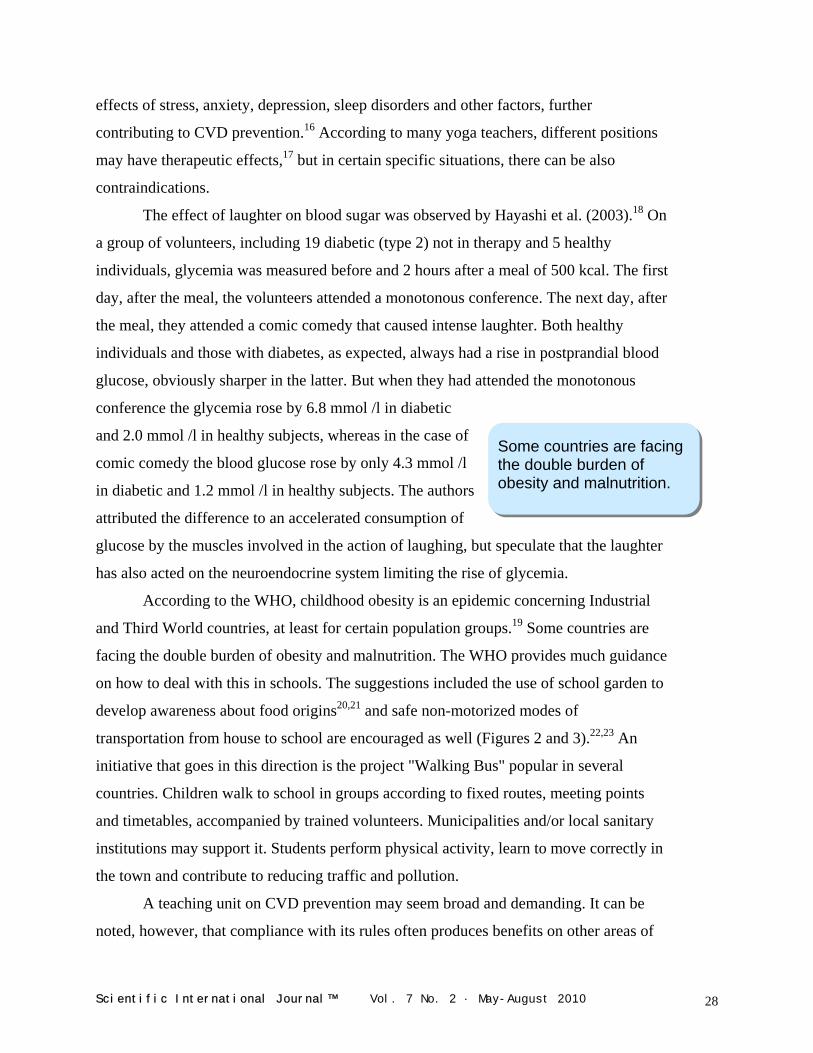
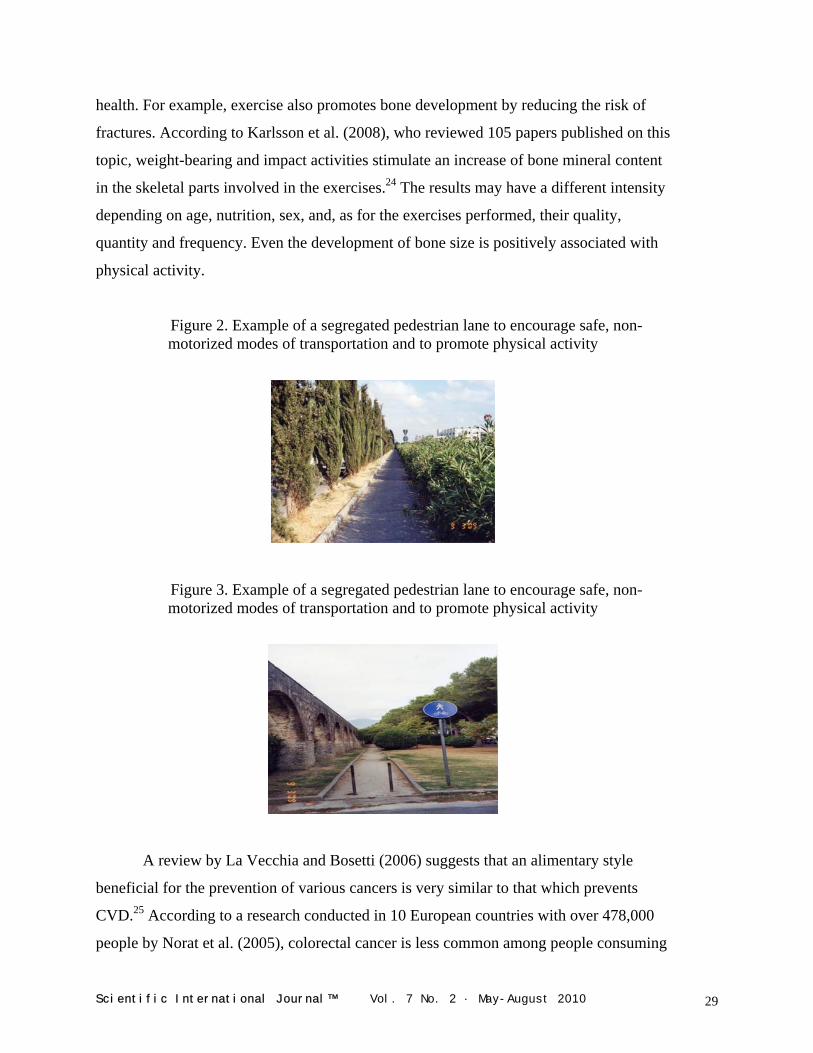
develop awareness about food origins20,21 and safe non-motorized modes of
transportation from house to school are encouraged as well (Figures 2 and 3).22,23 An
initiative that goes in this direction is the project "Walking Bus" popular in several
countries. Children walk to school in groups according to fixed routes, meeting points
and timetables, accompanied by trained volunteers. Municipalities and/or local sanitary
institutions may support it. Students perform physical activity, learn to move correctly in
the town and contribute to reducing traffic and pollution.
A teaching unit on CVD prevention may seem broad and demanding. It can be
noted, however, that compliance with its rules often produces benefits on other areas of
Scientific International Journal™ Vol. 7 No. 2 · May-August 2010 28
health. For example, exercise also promotes bone development by reducing the risk of
fractures. According to Karlsson et al. (2008), who reviewed 105 papers published on this
topic, weight-bearing and impact activities stimulate an increase of bone mineral content
in the skeletal parts involved in the exercises.24 The results may have a different intensity
depending on age, nutrition, sex, and, as for the exercises performed, their quality,
quantity and frequency. Even the development of bone size is positively associated with
physical activity.
Figure 2. Example of a segregated pedestrian lane to encourage safe, non-motorized modes of transportation and to promote physical activity
Figure 3. Example of a segregated pedestrian lane to encourage safe, non-motorized modes of transportation and to promote physical activity
A review by La Vecchia and Bosetti (2006) suggests that an alimentary style
beneficial for the prevention of various cancers is very similar to that which prevents
CVD.25 According to a research conducted in 10 European countries with over 478,000
people by Norat et al. (2005), colorectal cancer is less common among people consuming
Scientific International Journal™ Vol. 7 No. 2 · May-August 2010 29
the largest amounts of fish.26 The opposite occurs among people with the highest intake
of red meat and preserved meat. This suggests similarities between the dietary habits
which prevent colorectal cancer and a diet which prevents CVD. A document of the
WHO focusing on prevention of cancer, in addition to emphasizing the importance of
stopping the childhood obesity epidemic, provides further indications which still have
many similarities with the ones which prevent CVD.27 Intensive lifestyle changes with
increase of CVD were observed in several countries during recent decades.
According to Ding and Malik (2008), in China, the prevalence of obesity,
consequence of a diet with high glycemic index, rich in saturated fats, and less physical
activity related to modernization, is contributing to the spread of diabetes and CVD
risks.28 According to Gill et al. (2002), in some countries of the western Pacific area,
obesity and diabetes are rapidly spreading with consequent damage to the population.29
The reasons given for this change are the abandonment of fishing and manual activities in
agriculture, the diffusion of alcoholism and use of high fat foods, the frequent use of
sugary drinks and cakes. In addition, the spread of private transport and violence
discourages walking.
A project launched in North Karelia in 1972, as a response to the high mortality
from CVD and then extended to the whole of Finland, according to Puska (2002) was the
first one, among a series of projects based on the involvement of the whole community.30
This activity, lasting 25 years, has involved various public services beyond the health
institutions, schools, NGOs, mass media, supermarkets, food industries, agriculture, etc.,
even some environmental changes have been part of the strategy. The consumption of
vegetal foods and fats, initially limited, became much more common; there was a
decrease in the use of animal fat and total consumption of cigarettes. Physical activity
during leisure time increased as well. As a result, among middle-aged men, there was a
decrease of 73% in the annual rate of mortality for heart disease. The general conditions
of health, in the adult population, improved and the mortality rate for lung cancer
decreased by over 70%. Many other countries followed with similar aims.
Scientific International Journal™ Vol. 7 No. 2 · May-August 2010 30
REFERENCES
1. World Health Organization. Cardiovascular disease: prevention and control. Retrieved from http://www.who.int/dietphysicalactivity/publications/facts/cvd/en/
2. World Health Organization. The Atlas of Heart Disease and Stroke. Retrieved from http://www.who.int/cardiovascular_diseases/resources/atlas/en/
3. World Health Organization. The Tobacco Atlas. Retrieved from http://www.who.int/ tobacco/statistics/tobacco_atlas/en/ 4. American Heart Association. American Heart Association Glossary Media Library.
Retrieved from http://www.medmovie.com/mmdatabase/MediaPlayer.aspx? ClientID=65
5. Alta Bates Summit Medical Center. Cardiovascular Disease Risk Assessment and Animations. Retrieved from http://www.altabatessummit.org/anima_cardiovascular/
cv_animations.html 6. MyDr.com. Diabetes. Retrieved from http://www.mydr.com.au/diabetes 7. National Center for Biotechnology Information. Introduction to Diabetes. Retrieved
from http://www.ncbi.nlm.nih.gov/bookshelf/br.fcgi?book=diabetes&part=A3 8. Food Standards Agency. Salt. Retrieved from http://www.salt.gov.uk/
in_the_body.html 9. U.S. National Institutes of Health. PubMed Central. Retrieved from
www.pubmedcentral.nih.gov/ 10. National Center for Biotechnology Information. PubMed. Retrieved from
www.ncbi.nlm.nih.gov/pubmed/ 11. Goldstein, L. B. et al. Primary Prevention of Ischemic Stroke. Retrieved from
http://stroke.ahajournals.org/cgi/content/full/37/6/1583 12. World Health Organization. Avoiding Heart Attacks and Strokes. Retrieved from
http://www.who.int/cardiovascular_diseases/resources/cvd_report.pdf 13. Foster-Powell, K., Holt, S. H. A. and Brand-Miller, J. C. International table of
glycemic index and glycemic load values: 2002. American Journal of Clinical Nutrition, Vol. 76, No. 1, 5-56, 2002. Retrieved from http://www.ajcn.org/cgi/ content/full/76/1/5
14. Hintsanen, M. et al. Job Strain and Early Atherosclerosis: The Cardiovascular Risk in Young Finns Study. Psychosomatic Medicine, 67:740-747 (2005). Retrieved from http://www.psychosomaticmedicine.org/cgi/content/full/67/5/740
15. Yang, K. A Review of Yoga Programs for Four Leading Risk Factors of Chronic Diseases. Evid Based Complement Alternat Med. 2007 December; 4(4): 487–491. Retrieved from http://www.pubmedcentral.nih.gov/articlerender.fcgi?tool
=pubmed&pubmedid=18227916 16. Innes, K. E. and Vincent, H. K. The Influence of Yoga-Based Programs on Risk
Profiles in Adults with Type 2 Diabetes Mellitus: A Systematic Review. Evid Based Complement Alternat Med. 2007 December; 4(4): 469–486. Retrieved from http://www.pubmedcentral.nih.gov/articlerender.fcgi?artid=2176136&tool= pmcentrez
17. Yoga Journal. Retrieved from http://www.yogajournal.com 18. Hayashi, K. et al. Laughter Lowered the Increase in Postprandial Blood Glucose.
Diabetes Care. May 2003; Vol. No. 5: 1651-1652. Retrieved from http://care.diabetesjournals.org/content/26/5/1651.long
Scientific International Journal™ Vol. 7 No. 2 · May-August 2010 31
19. World Health Organization. Childhood overweight and obesity. Retrieved from http://www.who.int/dietphysicalactivity/childhood/en/
20. World Health Organization. The Role of Schools. Retrieved from http://www.who.int/dietphysicalactivity/childhood_schools/en/index.html
21. Food and Agriculture Organization of the United Nations. School Gardens. Retrieved from www.fao.org/schoolgarden/sglib1_en.htm
22. Piedibus.it. Piedibus. Retrieved from http://www.piedibus.it/ 23. Pedestrian and Bicycle Information Center. Walking School Bus. Retrieved from
http://www.walkingschoolbus.org/ 24. Karlsson, M. K., Nordqvist, A. and Karlsson, C. Physical activity increases bone
mass during growth. Food Nutr Res. 2008; 52: 10.3402/fnr.v52i0.1871. Retrieved from http://www.pubmedcentral.nih.gov/articlerender.fcgi?artid=2596740&tool= pmcentrez
25. La Vecchia, C. and Borsetti, C. Diet and cancer risk in Mediterranean countries: open issues. Public Health Nutrition. 2006. 9: 1077-1082. Retrieved from
http://journals.cambridge.org/action/displayAbstract?fromPage=online&aid=960020 26. Norat, T. et al. Meat, fish, and colorectal cancer risk: the European Prospective
Investigation into cancer and nutrition. J Natl Cancer Inst. 2005 June; 97(12): 906–916. Retrieved from http://www.pubmedcentral.nih.gov/articlerender.fcgi?tool=
pubmed&pubmedid=15956652 27. World Health Organization. Preventing cancer: promoting a healthy diet and physical
activity in childhood. Retrieved from http://www.who.int/cancer/prevention/children/ en/index.html
28. Ding, E. L. and Malik, V. S. Convergence of obesity and high glycemic diet on compounding diabetes and cardiovascular risks in modernizing China: An emerging public health dilemma. Global Health 2008; 4:4. Retrieved from http://www.pubmedcentral.nih.gov/articlerender.fcgi?tool=pubmed&pubmedid=18302739
29. Gill, T. et al. Obesity in the Pacific too big to ignore. Secretariat of the Pacific Community 2002. Retrieved from http://www.wpro.who.int/NR/rdonlyres/ B924BFA6-A061-43AE-8DCA-0AE82A8F66D2/0/obesityinthepacific.pdf
30. Puska, P. Successful prevention of non-communicable diseases: 25 years with North Karelia Project in Finland. Public Health Medicine. 2002; 4(1): 5-7. Retrieved from
http://www.who.int/chp/media/en/north_karelia_successful_ncd_prevention.pdf AUTHOR
Prof. Aldo T. Marrocco – Retired Mathematics and Science teacher. Pisa, Italy. Copyright © 2010 Non-Profit Evaluation & Resource Center, Inc.
Scientific International Journal™ Vol. 7 No. 2 · May-August 2010 32
SPANISH TRANSLATION AND CULTURAL
ADAPTATION OF THE ADOLESCENT PSYCHOSOCIAL
SEIZURE INVENTORY IN PUERTO RICO:
IDENTIFICATION OF THE PSYCHOSOCIAL PROBLEMS
IN AN EPILEPTIC GROUP Dr. Flordeliz Serpa
Abstract
The purpose of the study was to translate and culturally adapt the Adolescent Psychosocial Seizure Inventory (APSI) to the Spanish-speaking adolescent population and to identify psychosocial adjustment problems in adolescents with epilepsy. The sample consisted of 308 adolescents: 104 epileptic, 77 asthmatic, and 127 healthy. The subjects were active clients of public hospitals, private clinics, and a public high school. The APSI was translated from English into Spanish, adapted to the Puerto Rican adolescent population, reviewed by a bilingual panel of experts, and administered to the sample. A reliability analysis was performed and the reliability coefficient for the overall assessment was .97. It was concluded that the Spanish version of the APSI was statistically comparable to the original English version, establishing a basis for its use in the psychosocial assessment of Spanish-speaking epileptic adolescents in Puerto Rico. Finally, the results also revealed that the epileptic adolescents had more psychosocial problems than the other groups. Key words: Adolescent Psychosocial Seizure Inventory, APSI, psychosocial adjustment, translation, cultural adaptation.
Resumen El propósito del estudio fue traducir y adaptar culturalmente el Adolescent Psychosocial Seizure Inventory (APSI) a la población adolescente de habla hispana e identificar los problemas de ajuste psicosocial en los adolescentes con epilepsia. La muestra consistió de 308 adolescentes: 104 epilépticos, 77 asmáticos y 127 saludables. Los sujetos eran clientes activos de hospitales públicos, clínicas privadas y una escuela superior pública. El APSI fue traducido de inglés a español, adaptado a la población de adolescentes puertorriqueños, revisado por un panel de expertos bilingüe y administrado a la muestra. Un análisis de confiabilidad fue realizado y el coeficiente de confiabilidad para el instrumento fue de .97. Se concluyó que la versión en español del APSI era estadísticamente comparable con la versión original en inglés, estableciendo la base para su uso en la evaluación psicosocial de los adolescentes epilépticos de habla hispana en Puerto Rico. Finalmente, los resultados también revelaron que los adolescentes epilépticos tienen más problemas psicosociales que los otros grupos. Palabras claves: Adolescent Psychosocial Seizure Inventory, APSI, ajuste psicosocial, traducción, adaptación cultural.
Scientific International Journal™ Vol. 7 No. 2 · May-August 2010 33
INTRO
Epileptic adolescents confront greater problems in their psychosocial adjustment.
DUCTION
ccording to the literature, there is evidence of a high incidence of
psychosocial problems among epileptic adolescents,1 particularly
social, psychological, and behavioral problems.2 It has been difficult to
assess the psychosocial adjustment among epileptic
adolescents. Several researchers stated that epileptic
adolescents, as a group, have a higher incidence of
psychiatric, psychological, and behavioral problems.3, 4
A Some studies addressed these problems and
identified which adolescents with epilepsy were more susceptible to them.5, 6 The
researchers explained that the presence of a chronic condition represented a series of
problems at different levels in the daily living of the adolescents. The literature also
presented that such a condition do not necessarily get to psychopathology but it does
predispose the adolescents to many of the stressful factors in the environment. Thus,
epileptic adolescents confront greater problems in their psychosocial adjustment. In
addition, there were some problems that were very rarely evaluated, such as the
adolescents’ perception about their family and friends reaction to the convulsions and the
epileptic adolescents’ perception about social, scholar, and vocational restrictions.
The identification of problems in the psychosocial adjustment of epileptic
adolescents provides crucial and fundamental information for the decision-making
process in the planning and implementation of health programs and/or services for this
group. The Adolescent Psychosocial Seizure Inventory (APSI) was used to identify the
psychosocial problems of adolescents with epilepsy.1 This questionnaire was developed
by Batzel and was created after the Washington Psychosocial Seizure Inventory (WPSI),
which is used to evaluate psychosocial problems in adults with epilepsy.4 Although
Spanish translations of the WPSI were available since its development, there was no
evidence of a Spanish translation of the APSI. The main purpose of this study was to
develop a reliable and valid Spanish version of the APSI. The specific objectives of this
study were:
1. To translate the APSI from English into Spanish.
Scientific International Journal™ Vol. 7 No. 2 · May-August 2010 34
2. To culturally adapt the APSI for the Spanish-speaking
epileptic adolescent population.
3. To identify the psychosocial adjustment problems in a
group of epileptic adolescents through a comparative
study with two other groups of adolescents (asthmatic
and healthy).
METHODOLOGY
he present study was conceptualized as a comparative study. The
inclusion criteria for the sample were age between 15 and 18 years and
attendance to regular classes at a regular school. For the adolescents
with chronic conditions, diagnosis of epilepsy or asthma was also considered a criterion
for inclusion. Adolescents with a physical, mental or emotionally disabling condition,
such as mental retardation or a terminal disease were excluded. Participation in this study
was completely voluntary and anonymous. Informed consent was obtained from the
parents prior to the administration of the questionnaire to the sample.
T Three questionnaires were utilized for the completion of this study. The first
questionnaire was the APSI. This instrument was translated from English into Spanish
and culturally adapted to the Puerto Rican adolescent population. This translation and
cultural adaptation was reviewed by a bilingual panel of experts constituted by two
neurologists, a psychologist, a social worker, and a health educator. After the Spanish
translation and cultural adaptation of the APSI was performed, a pilot study was
conducted. Nine epileptic adolescents, seven asthmatic adolescents, and eight healthy
adolescents participated in this pilot study and completed the APSI. Based on the results
of this pilot study, necessary modifications were made to the instrument before its final
administration to the sample of the study.
The second questionnaire was developed by the principal investigator to collect
information on independent variables such as age, sex, type of epilepsy, and age at onset.
It also included eight open-ended questions about the adolescents’ perception of the
treatment received at the clinics, family support, and suggestions to help adolescents with
Scientific International Journal™ Vol. 7 No. 2 · May-August 2010 35
epilepsy as a group. The third questionnaire included seven open-ended questions and
was designed to conduct a focus group with epileptic adolescents.
The Spanish translation of the APSI was administered to the adolescents. The
study compared the psychosocial adjustment of the three groups: epileptic, asthmatic, and
healthy. This study also assessed the psychosocial problems of the adolescents with
epilepsy that needs to be considered in the planning and implementation of health care
services and treatment modalities for this population in Puerto Rico. Psychosocial
adjustment problems were identified and compared among the three groups by level of
problem. There were four levels of problems in the psychosocial adjustment:
1. No significant problems
2. Possible problems but of limited significance
3. Distinct and definite difficulties impacting adaptability, and
4. Severe problems having a striking impact on adjustment
RESUL
A TS
reliability analysis of the Spanish version of the APSI was performed.
The psychosocial scales were found to be internally consistent. The
standardized alpha for the scales was established at the .0001 level of
significance. The reliability coefficients for the scales fluctuated from .49 to .93 and the
reliability coefficient for the overall assessment was .97 (Table 1). The sociodemographic
characteristics of the sample were determined through a frequency distribution (Table 2).
The sample consisted of 308 adolescents: 104 epileptic, 77 asthmatic, and 127 healthy.
Of the 308 subjects, 177 were female and 131 were male between 15 to 18 years old. All
the subjects were Spanish-speaking, were randomly selected and were active clients of
public hospitals, private clinics, and a public high school in Puerto Rico. Specifically, the
epileptic adolescents were from the Epilepsy Association of Puerto Rico, the Municipal
Hospital, the University Hospital, and private clinics. The asthmatic adolescents were
selected from the Pediatric Hospital and private clinics. The sample of healthy
adolescents was selected from a public high school in Puerto Rico.
Scientific International Journal™ Vol. 7 No. 2 · May-August 2010 36
A percentage distribution was used to compare the clinical variables of the sample
(Table 3). Clinical variables included type of epilepsy, age of onset, control of condition,
frequency of seizures or asthma attacks, and medication. In addition, a percentage
distribution was used to identify problems in the adolescents’ psychosocial adjustment
and, also, to compare them among the three groups by level of problems. Table 4 presents
the distribution of the four levels of problems in the psychosocial adjustment of the
adolescents. The distribution shows only epileptic adolescents in the fourth level of
problems (39%).
In order to determine differences among the
groups, a chi-square distribution was utilized. The
chi-square test performed to determine the
differences between the epileptic and asthmatic
groups showed a value of 45.56 (p value < .001).
The value of chi-square when the epileptic and
healthy groups were compared was 88.71 (p value <
.0001). When the psychosocial adjustment was
considered as a dichotomous variable (values 1 and 2
= absence of problems and values 3 and 4 = presence of problems), the distribution of the
adolescents that showed problems in their psychosocial adjustment was the following:
82.3% in the epileptic group, 50% in the asthmatic group, and 29% in the healthy group.
The epileptic group was identified as the group with more problems in the psychosocial
adjustment followed by the asthmatic group. These results revealed that the epileptic
adolescents showed a level of problems in their psychosocial adjustment much higher
than the other groups.
Multiple regression analyses were performed in order to examine the contribution
of the sociodemographic and clinical variables to the psychosocial adjustment of the
epileptic and asthmatic adolescents groups. The multiple regression analysis applied to
the healthy group included only sociodemographic variables. The variables that appeared
to have a significant effect over the psychosocial adjustment in the epileptic group were
chronological age, age at onset, and frequency of the seizures. This model explained 32%
of the general psychosocial adjustment of the epileptic group.
Scientific International Journal™ Vol. 7 No. 2 · May-August 2010 37

A multiple regression analysis was performed in order to determine the degree of
association between the psychosocial adjustment of the adolescents and the
sociodemographic and/or clinical variables. Another percentage distribution was used to
determine the adolescents’ perception about family support and understanding, and the
treatment program they were receiving.
For the asthmatic group, most of the sociodemographic and clinical variables
appeared to have a significant effect on the psychosocial adjustment. These set of
variables, except for presence of another health condition and frequency of the attacks,
explained 76% of the psychosocial adjustment of the asthmatic group. Regarding the
healthy group, none of the sociodemographic variables showed to have a significant
effect on the psychosocial adjustment.
Table 1. Coefficients of Reliability of the Spanish Version of the APSI
SCALE STANDARDIZED ALPHA
Family Background .83 Emotional Adjustment .93
Interpersonal Adjustment .86 School Adjustment .92
Vocational Perspective .81 Adjustment to Seizures .80 Medical Management .67
Antisocial Activity .49 Overall Psychosocial
Functioning/Adjustment .97
Scientific International Journal™ Vol. 7 No. 2 · May-August 2010 38
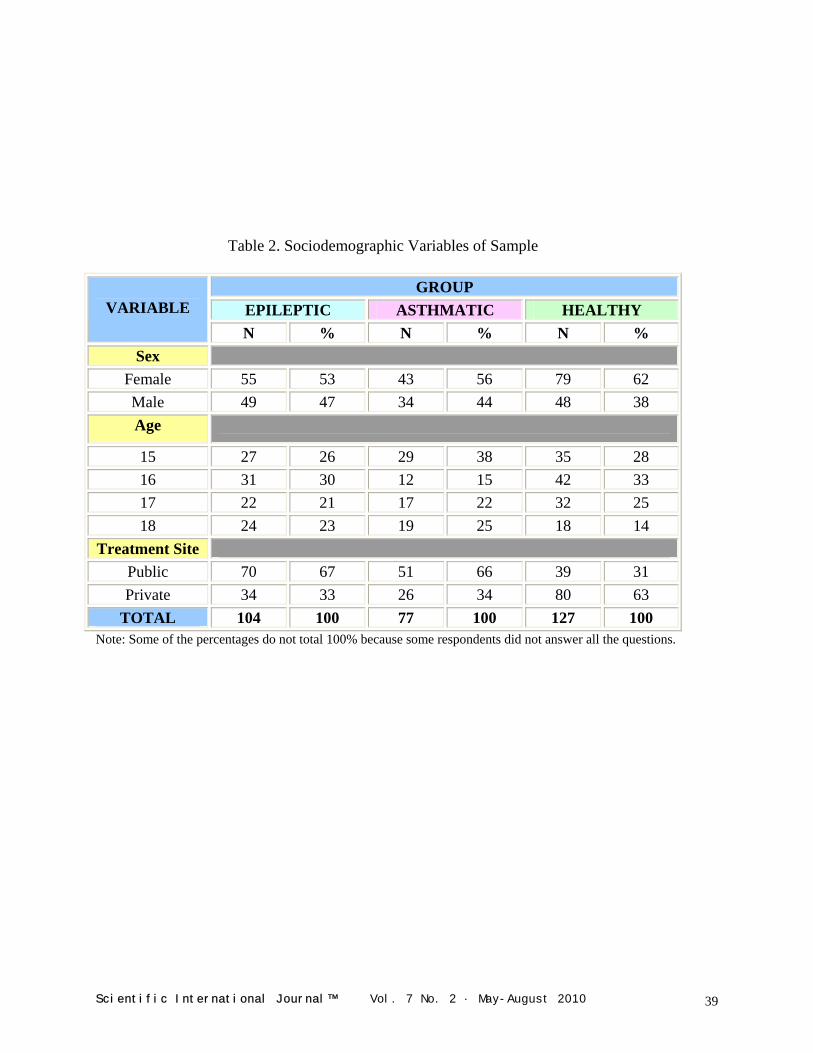
Table 2. Sociodemographic Variables of Sample
GROUP
EPILEPTIC ASTHMATIC HEALTHY VARIABLE N % N % N %
Sex Female 55 53 43 56 79 62 Male 49 47 34 44 48 38 Age
15 27 26 29 38 35 28 16 31 30 12 15 42 33 17 22 21 17 22 32 25 18 24 23 19 25 18 14
Treatment Site Public 70 67 51 66 39 31 Private 34 33 26 34 80 63
TOTAL 104 100 77 100 127 100 Note: Some of the percentages do not total 100% because some respondents did not answer all the questions.
Scientific International Journal™ Vol. 7 No. 2 · May-August 2010 39

Table 3. Clinical Variables of the Sample
GROUP EPILEPTIC ASTHMATIC VARIABLE
N % N % Type of Epilepsy
Partial 53 51 --- --- Generalized 51 49 --- ---
Age at Onset Childhood 62 60 45 58
Adolescence 42 40 32 42 Control
Good 50 48 25 33 Poor 54 52 52 67
Frequency High 46 44 8 10 Low 58 56 69 90
Medication Yes 102 98 71 92 No 2 2 6 8
TOTAL 181 104 100 77 100
Scientific International Journal™ Vol. 7 No. 2 · May-August 2010 40
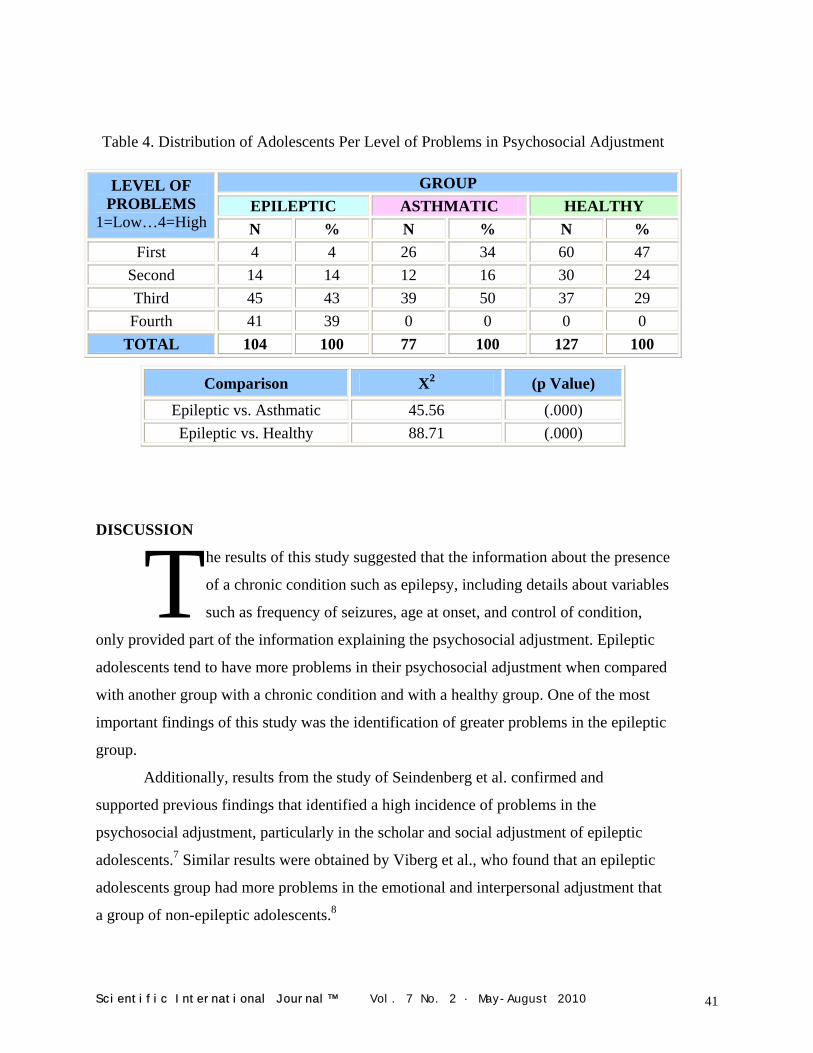
Table 4. Distribution of Adolescents Per Level of Problems in Psychosocial Adjustment
GROUP
EPILEPTIC ASTHMATIC HEALTHY LEVEL OF
PROBLEMS 1=Low…4=High N % N % N %
First 4 4 26 34 60 47 Second 14 14 12 16 30 24 Third 45 43 39 50 37 29 Fourth 41 39 0 0 0 0
TOTAL 104 100 77 100 127 100
Comparison X2 (p Value)
Epileptic vs. Asthmatic 45.56 (.000) Epileptic vs. Healthy 88.71 (.000)
DISCUSSION
he results of this study suggested that the information about the presence
of a chronic condition such as epilepsy, including details about variables
such as frequency of seizures, age at onset, and control of condition,
only provided part of the information explaining the psychosocial adjustment. Epileptic
adolescents tend to have more problems in their psychosocial adjustment when compared
with another group with a chronic condition and with a healthy group. One of the most
important findings of this study was the identification of greater problems in the epileptic
group.
T Additionally, results from the study of Seindenberg et al. confirmed and
supported previous findings that identified a high incidence of problems in the
psychosocial adjustment, particularly in the scholar and social adjustment of epileptic
adolescents.7 Similar results were obtained by Viberg et al., who found that an epileptic
adolescents group had more problems in the emotional and interpersonal adjustment that
a group of non-epileptic adolescents.8
Scientific International Journal™ Vol. 7 No. 2 · May-August 2010 41
Both groups with chronic conditions showed more problems in the psychosocial adjustment than the healthy group.
In the present study, both groups with chronic conditions showed more problems
in the psychosocial adjustment than the healthy group. It was identified that 82.6% of the
epileptic adolescents had problems in their psychosocial adjustment, 50% in the
asthmatic group, and 29% in the healthy group. It was
observed that the epileptic and asthmatic groups were
very different when compared to the healthy group (X2
= 88.71, p value < .0001; X2 = 10.00, p value = .002,
respectively), and showed more problems in the
psychosocial adjustment. It was also observed that these groups were different between
themselves (X2 = 45.56, p value < .001).
The results of the multiple regression analysis for the epileptic group suggested
that the variables that apparently have a significant association with the psychosocial
adjustment were chronological age, age at onset, frequency of the seizures, and the use of
medications. These results were similar to those obtained by Dodrill et al.9 These
researchers studied five groups of epileptic patients. The five samples showed similar
problems in their psychosocial adjustment regardless of the clinical characteristics of the
patients and the treatment site. Similar findings were obtained by Seindenberg et al. and
Hoare.7, 10
Regarding the clinical variables, the findings of this study coincided with those
obtained by Hermann et al. about the type of epilepsy.5 These authors concluded that the
type of epilepsy was not associated to the psychosocial adjustment. About the frequency
of the seizures and the control of the condition, it can be stated that the results of this
study supported those obtained by Rutter et al. (in Hermann et al.) and Hoare.5, 10 These
investigators stated that the psychosocial adjustment of epileptic patients was associated
with the frequency of the seizures and not with the control of the condition. In this study,
the p value for the test of association between frequency of seizures and psychosocial
adjustment was .0002.
On the other hand, the findings about medication contradicted those found by
Rutter et al. (in Clements and Wallace).11 These investigators did not find an association
between the use of medication and the psychosocial adjustment. In the present study, it
Scientific International Journal™ Vol. 7 No. 2 · May-August 2010 42
was observed a beta of 33.92 (p value = .0008), suggesting that medication was
associated with the presence of problems in the psychosocial adjustment.
Regarding the asthmatic group, the findings of this study suggested that many of
the variables considered in the multiple regression models were associated with the
psychosocial adjustment. The only two variables that apparently did not have a
significant association with the psychosocial adjustment were presence of another health
condition and the frequency of attacks. Lastly, the multiple regression model applied to
the healthy group showed no important associations between the variables and the
psychosocial adjustment.
Psychosocial variables should be considered in the treatment program of adolescents with chronic conditions.
CONCLUSIONS
his study provided important evidence
regarding the reliability and validity of
the Spanish version of the APSI. Based
on the results, the Spanish version of the APSI was
statistically comparable to the original English version.
This established a basis for its use in the psychosocial assessment of Spanish-speaking
epileptic adolescents in Puerto Rico and in other Spanish-speaking populations after
appropriate cultural adaptations.
T The results of this study also suggested that adolescents with chronic conditions
have more problems in their psychosocial adjustment. Psychosocial variables should be
considered in the treatment program of adolescents with chronic conditions.
REFERENCES
1. Batzel, L. W., Dodrill, C., Dubinsky, B., Zeigler, R., Conolly, J., Freeman, R., Farwell, J. and Vining, E. An Objective Method for the Assessment of Psychosocial Problems in Adolescents with Epilepsy. Epilepsia. 1991. 32(2):202-211.
2. Levin, R. et al. Psychosocial Dimensions of Epilepsy. Epilepsia. 1988. 29(6):805-816. 3. Apter, A. et al. Behavioral Profile and Social Competence in Temporal Lope Epilepsy
of Adolescence. Journal of American Academy of Child and Adolescent Psychiatry. 1991. 30(6):887-892.
4. Dodrill, C. B., Batzel, L., Queisser, H. and Temkin, N. An Objective Method for the Assessment of Psychological and Social Problems among Epileptics. Epilepsia. 1980. 21:123-135.
Scientific International Journal™ Vol. 7 No. 2 · May-August 2010 43
5. Hermann, B., Schwartz, M., Whitman, S. and Karnes, W. Aggression and Epilepsy: Seizure Type Comparisons and High-Risk Variables. Epilepsia. 1980. 21:691-698.
6. Hermann, B., Schwartz, W. and Vahdat, P. Psychopathology in Epilepsy: Relationship of Seizure Type to Age at Onset. Epilepsia. 1980. 21(15):15-23.
7. Seindenberg, M., Beck, N., Geisser, M., Giordani, B., Sackllares, J., Berent, S., Dreifuss, F. and Boll, T. Academic Achievement of Children with Epilepsy. Epilepsia. 1986. 27(6):753-759.
8. Viberg, et al. Epilepsy in Adolescence: Implications for the Development of Personality. Epilepsia. 1987. 28(5):542-546.
9. Dodrill, C., Breyer, D., Diamond, M., Dubinsky, B. and Geary, B. Psychosocial Problems among Adults with Epilepsy. Epilepsia. 1984. 25(2):168-175.
10. Hoare, P. Does Illness Foster Dependency? A Study of Epileptic and Diabetic Children and Adolescents. Developmental Medicine and Child Neurology. 1984. 26:20-24.
11. Clement, M. J. and Wallace, S. J. A Survey of Adolescents with Epilepsy. Developmental Medicine and Child Neurology. 1990. 32:849-857.
AUTHOR
Dr. Flordeliz Serpa – Researcher and Evaluation Consultant. San Juan, Puerto Rico. Copyright © 2010 Non-Profit Evaluation & Resource Center, Inc.
Scientific International Journal™ Vol. 7 No. 2 · May-August 2010 44