simulation of production process … · filozofija lean proizvodnje nudi široku paletu prednosti....
TRANSCRIPT
1IntroductionUvod
At the turn of the third millennium the world industryhas found itself in probably the largest restructuring sincethe first industrial revolution. The progress is determined bytwo trends:
dynamic progress of information and communicationtechnologies which have enabled the creation of newmarkets and the redefinition of entire professions,globalization of economy thanks to new purchasing andselling markets.
Such a progress forces enterprises to modify theirproduction strategies. New competitors, greater changes indemand in the course of time in market stagnation presentenormous cost pressure upon many enterprises. In order tomeet customers' needs everywhere in the world, theenterprise should increase its flexibility.
A long lasting success will be achieved only by theenterprises that will, besides the necessary optimization ofproduction process, identify and conquer new markets aswell.
One of the possible conceptions for the survival in aturbulent world market is the introduction of newtechnologies and organizational structures (for examplefractal factory, network enterprises, Lean production, sixsigma, business process reengineering, etc.).
Though lean production has been widely recognised forits effectiveness in continuously improving productivity,product quality, and on-time delivery to customers, the costfor hiring a full-time lean manufacturing engineer has keptmany small businesses from implementing lean in theirfacilities [1].
�
�
341
N Gjeldum, I Veža, B Bili. . . ć
ISSN 1330-3651
UDC/UDK 658.52.011.56:629.5
SIMULATION OF PRODUCTION PROCESS REORGANIZEDWITH VALUE STREAM MAPPING
Nikola Gjeldum, Ivica Veža, Boženko Bilić
The philosophy of Lean production offers a wide variety of advantages. Lean production concept is understood as the realization of Lean principle through theefficient application of methods and tools, with faster and more effective discovering of wastes and mistakes in the production systems. This article contains apresentation of the simulation application on production process previously analyzed with Value stream mapping tool. The model was applied to a productionline in the shipbuilding industry in Croatia. The production line current state is simulated with varying market requirements. Using Lean management tools,future improved state was developed and simulated. The simulation provides dynamic models with varying production performance results, unlike by applyingonly a Value stream mapping tool. During simulation runtime, adaptation of production process by varying resources assignment to continuous working cellwas done to fulfill order requirements on time.
Keywords: Lean management, production system, resource, simulation,Value stream mapping
Original scientific paper
Filozofija Lean proizvodnje nudi široku paletu prednosti. Lean koncept proizvodnja predstavlja ostvarenje Lean principa kroz učinkovitu primjenu metoda ialata, za brže i učinkovitije otkrivanje gubitaka i pogrešaka u proizvodnim sustavima. Ovaj članak sadrži prikaz
i reorganiziran pomoću Mapiranja toka vrijednosti hrvatskoj brodograđevnojind razvijeno je i simuliranobuduće stanje toka vrijednosti. Simulacija omogućava dinamičk
korištenja simulacije proizvodnog procesa kojije prethodno analiziran . Model je primijenjen za jednu proizvodnu liniju u
ustriji. Trenutno stanje proizvodne linije je simulirano s varijabilnim zahtjevima tržišta. Korištenjem alata Lean proizvodnje,dobivanje i analizu ih modela s promjenjivim performansama proizvodnog sustava, za razliku
od primjene samo alata Mapiranja toka vrijednosti. Tijekom simulacije, korištena je prilagodba proizvodnog procesa variranjem pridodavanja resursa radnojstanici, koja je služila za ispunjavanje zahtjeva tržišta na vrijeme.
Ključne riječi: Lean menadžment, proizvodni sustav, resursi, simulacija,Mapiranje toka vrijednosti
Izvorni znanstveni članak
Simulacija proizvodnog procesa reorganiziranog s Mapiranjem toka vrijednosti
Simulacija proizvodnog procesa reorganiziranog s Mapiranjem toka vrijednosti
Technical Gazette 18, (2011),3 341-347
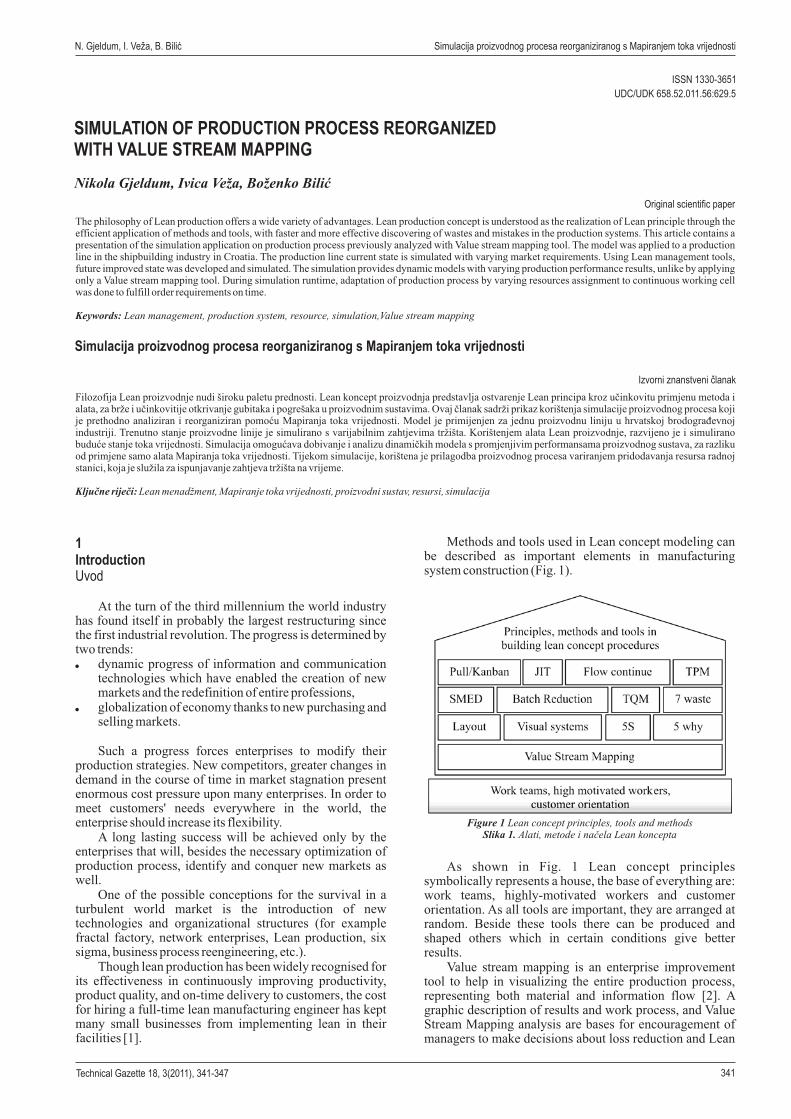
Methods and tools used in Lean concept modeling canbe described as important elements in manufacturingsystem construction (Fig. 1).
As shown in Fig. 1 Lean concept principlessymbolically represents a house, the base of everything are:work teams, highly-motivated workers and customerorientation. As all tools are important, they are arranged atrandom. Beside these tools there can be produced andshaped others which in certain conditions give betterresults.
Value stream mapping is an enterprise improvementtool to help in visualizing the entire production process,representing both material and information flow [2]. Agraphic description of results and work process, and ValueStream Mapping analysis are bases for encouragement ofmanagers to make decisions about loss reduction and Lean
Figure 1Slika 1.
Lean concept principles, tools and methodsAlati, metode i Lean konceptanačela
342
Simulation of production process reorganized with Value Stream Mapping
Tehni ki vjesnikč ,18, 3(2011) 341-347
concept modeling with given tools and methods.Value stream mapping can be a communication tool, a
business planning tool and a tool to manage a changeprocess. Value stream mapping is essentially a languageand, as with any new language, the best way to learnmapping is to practice it formally at first, until it can be usedintuitively [3].
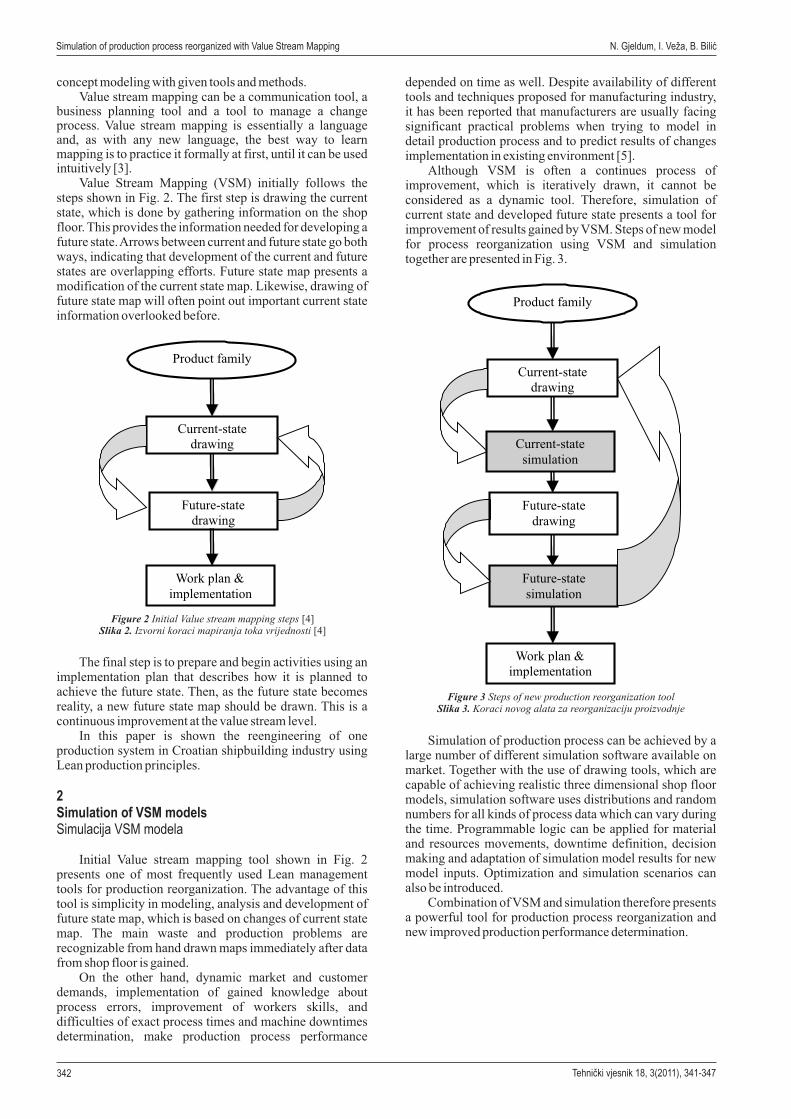
Value Stream Mapping (VSM) initially follows thesteps shown in Fig. 2. The first step is drawing the currentstate, which is done by gathering information on the shopfloor. This provides the information needed for developing afuture state.Arrows between current and future state go bothways, indicating that development of the current and futurestates are overlapping efforts. Future state map presents amodification of the current state map. Likewise, drawing offuture state map will often point out important current stateinformation overlooked before.
N Gjeldum, I Veža, B Bili. . . ć
depended on time as well. Despite availability of differenttools and techniques proposed for manufacturing industry,it has been reported that manufacturers are usually facingsignificant practical problems when trying to model indetail production process and to predict results of changesimplementation in existing environment [5].
Although VSM is often a continues process ofimprovement, which is iteratively drawn, it cannot beconsidered as a dynamic tool. Therefore, simulation ofcurrent state and developed future state presents a tool forimprovement of results gained by VSM. Steps of new modelfor process reorganization using VSM and simulationtogether are presented in Fig. 3.
Simulation of production process can be achieved by alarge number of different simulation software available onmarket. Together with the use of drawing tools, which arecapable of achieving realistic three dimensional shop floormodels, simulation software uses distributions and randomnumbers for all kinds of process data which can vary duringthe time. Programmable logic can be applied for materialand resources movements, downtime definition, decisionmaking and adaptation of simulation model results for newmodel inputs. Optimization and simulation scenarios canalso be introduced.
Combination of VSM and simulation therefore presentsa powerful tool for production process reorganization andnew improved production performance determination.
Product family
Current-state
drawing
Work plan &
implementation
Future-state
drawing
Figure 2Slika 2.
Initial Value stream mapping stepsIzvorni koraci mapiranja toka vrijednosti
[4][4]
The final step is to prepare and begin activities using animplementation plan that describes how it is planned toachieve the future state. Then, as the future state becomesreality, a new future state map should be drawn. This is acontinuous improvement at the value stream level.
In this paper is shown the reengineering of oneproduction system in Croatian shipbuilding industry usingLean production principles.
Initial Value stream mapping tool shown in Fig. 2presents one of most frequently used Lean managementtools for production reorganization. The advantage of thistool is simplicity in modeling, analysis and development offuture state map, which is based on changes of current statemap. The main waste and production problems arerecognizable from hand drawn maps immediately after datafrom shop floor is gained.
On the other hand, dynamic market and customerdemands, implementation of gained knowledge aboutprocess errors, improvement of workers skills, anddifficulties of exact process times and machine downtimesdetermination, make production process performance
2Simulation of VSM modelsSimulacija VSM modela
Product family
Current-state
drawing
Future-state
simulation
Work plan &
implementation
Current-state
simulation
Future-state
drawing
Figure 3Slika 3.
Steps of new production reorganization toolKoraci novog alata za reorganizaciju proizvodnje
343Technical Gazette ,18, 3(2011) 341-347
N Gjeldum, I Veža, B Bili. . . ć
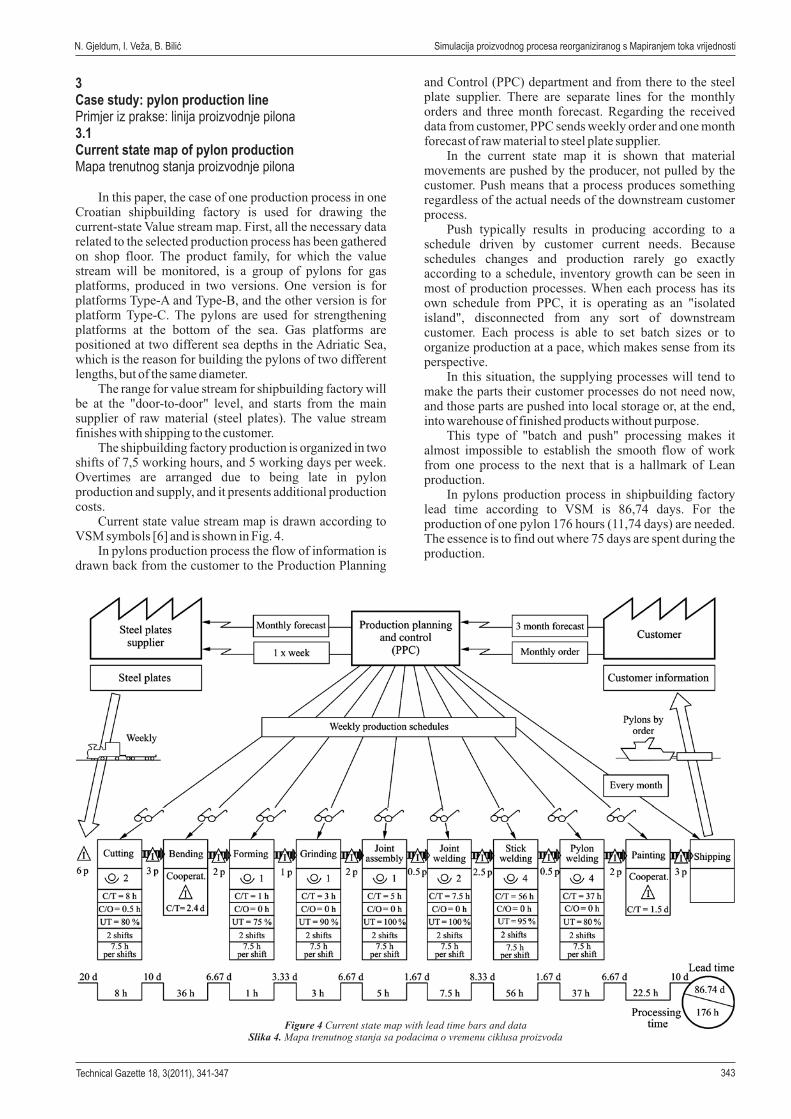
and Control (PPC) department and from there to the steelplate supplier. There are separate lines for the monthlyorders and three month forecast. Regarding the receiveddata from customer, PPC sends weekly order and one monthforecast of raw material to steel plate supplier.
In the current state map it is shown that materialmovements are pushed by the producer, not pulled by thecustomer. Push means that a process produces somethingregardless of the actual needs of the downstream customerprocess.
Push typically results in producing according to aschedule driven by customer current needs. Becauseschedules changes and production rarely go exactlyaccording to a schedule, inventory growth can be seen inmost of production processes. When each process has itsown schedule from PPC, it is operating as an isolatedisland , disconnected from any sort of downstreamcustomer. Each process is able to set batch sizes or toorganize production at a pace, which makes sense from itsperspective.
In this situation, the supplying processes will tend tomake the parts their customer processes do not need now,and those parts are pushed into local storage or, at the end,into warehouse of finished products without purpose.
This type of batch and push processing makes italmost impossible to establish the smooth flow of workfrom one process to the next that is a hallmark of Leanproduction.
In pylons production process in shipbuilding factorylead time according to VSM is 86 74 days. For theproduction of one pylon 176 hours (11 74 days) are needed.The essence is to find out where 75 days are spent during theproduction.
""
" "
,,
3Case study: pylon production line
3.1Current state map of pylon production
Primjer iz prakse: linija proizvodnje pilona
Mapa trenutnog stanja proizvodnje pilona
" "
,
In this paper, the case of one production process in oneCroatian shipbuilding factory is used for drawing thecurrent-state Value stream map. First, all the necessary datarelated to the selected production process has been gatheredon shop floor. The product family, for which the valuestream will be monitored, is a group of pylons for gasplatforms, produced in two versions. One version is forplatforms Type-A and Type-B, and the other version is forplatform Type-C. The pylons are used for strengtheningplatforms at the bottom of the sea. Gas platforms arepositioned at two different sea depths in the Adriatic Sea,which is the reason for building the pylons of two differentlengths, but of the same diameter.
The range for value stream for shipbuilding factory willbe at the door-to-door level, and starts from the mainsupplier of raw material (steel plates). The value streamfinishes with shipping to the customer.
The shipbuilding factory production is organized in twoshifts of 7 5 working hours, and 5 working days per week.Overtimes are arranged due to being late in pylonproduction and supply, and it presents additional productioncosts.
Current state value stream map is drawn according toVSM symbols [6] and is shown in Fig. 4.
In pylons production process the flow of information isdrawn back from the customer to the Production Planning
Simulacija proizvodnog procesa reorganiziranog s Mapiranjem toka vrijednosti
Figure 4Slika 4.
Current state map with lead time bars and dataMapa trenutnog stanja sa podacima o vremenu ciklusa proizvoda
344 Tehni ki vjesnikč ,18, 3(2011) 341-347
3.2Simulation of current stateSimulacija trenutnog stanja
Simulation of pylon production process was done usingProModel 7.5 simulation software.All processes were set toproduce the amount of pylons according to varying monthlycustomer demand. Gathered input information data areentered into model using normal distribution randomgenerator. Process times or cycle times (C/T), machinedowntimes defined by uptime (UT) and changeover times(C/O) were set at mean values shown in Fig. 4 with varianceof 10 %. Ordered quantity has mean value of 6 5 pcs, withvariance of 1 pc. PPC launches orders weekly to allproduction processes. Local storages maximum inventorylevel was set at ten pylons, and maintenance of that levelwas obtained by 'go-see' inspections.
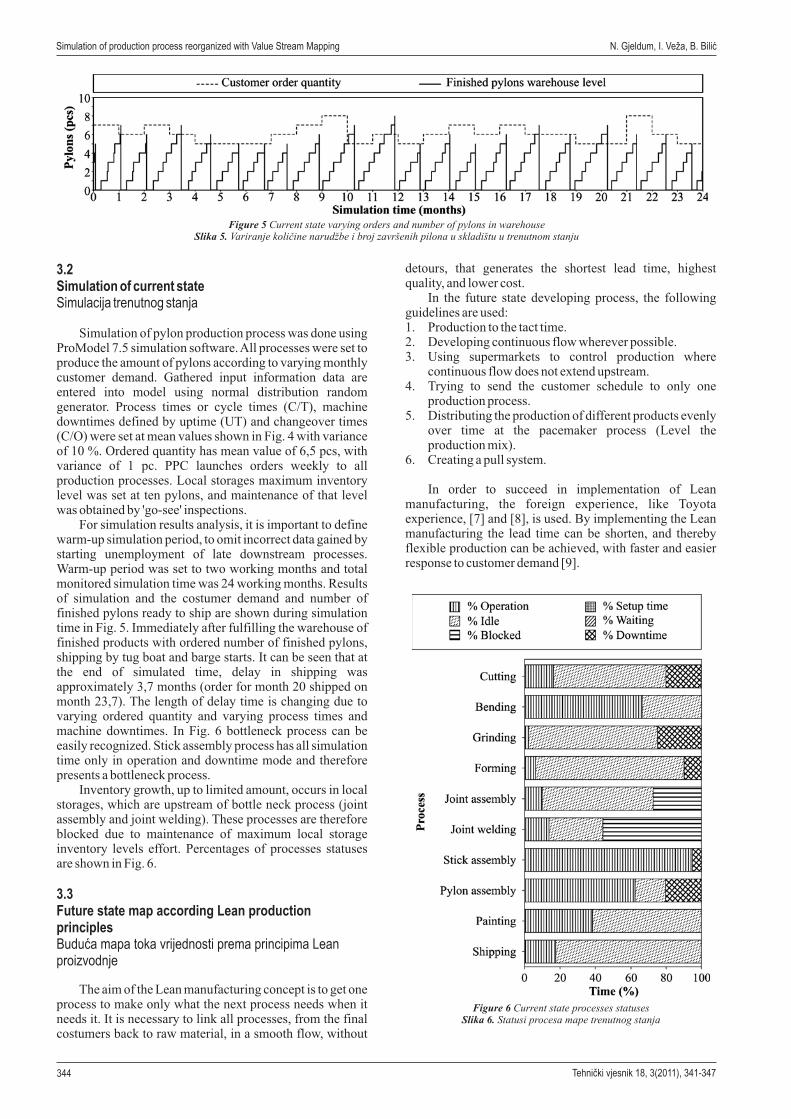
For simulation results analysis, it is important to definewarm-up simulation period, to omit incorrect data gained bystarting unemployment of late downstream processes.Warm-up period was set to two working months and totalmonitored simulation time was 24 working months. Resultsof simulation and the costumer demand and number offinished pylons ready to ship are shown during simulationtime in Fig. 5. Immediately after fulfilling the warehouse offinished products with ordered number of finished pylons,shipping by tug boat and barge starts. It can be seen that atthe end of simulated time, delay in shipping wasapproximately 3 7 months (order for month 20 shipped onmonth 23 7). The length of delay time is changing due tovarying ordered quantity and varying process times andmachine downtimes. In Fig. 6 bottleneck process can beeasily recognized. Stick assembly process has all simulationtime only in operation and downtime mode and thereforepresents a bottleneck process.
Inventory growth, up to limited amount, occurs in localstorages, which are upstream of bottle neck process (jointassembly and joint welding). These processes are thereforeblocked due to maintenance of maximum local storageinventory levels effort. Percentages of processes statusesare shown in Fig. 6.
The aim of the Lean manufacturing concept is to get oneprocess to make only what the next process needs when itneeds it. It is necessary to link all processes, from the finalcostumers back to raw material, in a smooth flow, without
,
,,
3.3Future state map according Lean productionprinciplesBuduća mapa toka vrijednosti prema principima Leanproizvodnje
N Gjeldum, I Veža, B Bili. . . ć
detours, that generates the shortest lead time, highestquality, and lower cost.
In the future state developing process, the followingguidelines are used:1. Production to the tact time.2. Developing continuous flow wherever possible.3. Using supermarkets to control production where
continuous flow does not extend upstream.4. Trying to send the customer schedule to only one
production process.5. Distributing the production of different products evenly
over time at the pacemaker process (Level theproduction mix).
6. Creating a pull system.
In order to succeed in implementation of Leanmanufacturing, the foreign experience, like Toyotaexperience, [7] and [8], is used. By implementing the Leanmanufacturing the lead time can be shorten, and therebyflexible production can be achieved, with faster and easierresponse to customer demand [9].
Simulation of production process reorganized with Value Stream Mapping
Figure 5Slika 5.
Current state varying orders and number of pylons in warehouseu skladištu u trenutnom stanjuVariranje količine narudžbe i broj završenih pilona
Figure 6Slika 6.
Current state processes statusesStatusi procesa mape trenutnog stanja
345Technical Gazette ,18, 3(2011) 341-347
N Gjeldum, I Veža, B Bili. . . ć Simulacija proizvodnog procesa reorganiziranog s Mapiranjem toka vrijednosti
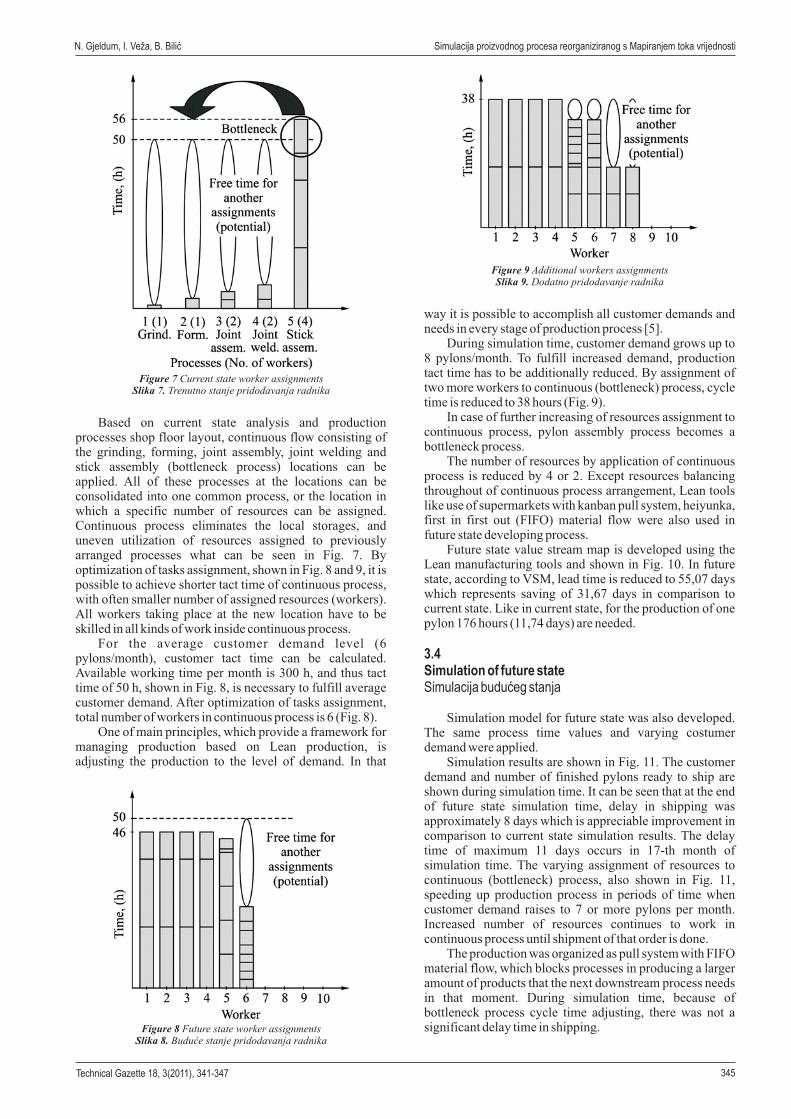
Based on current state analysis and productionprocesses shop floor layout, continuous flow consisting ofthe grinding, forming, joint assembly, joint welding andstick assembly (bottleneck process) locations can beapplied. All of these processes at the locations can beconsolidated into one common process, or the location inwhich a specific number of resources can be assigned.Continuous process eliminates the local storages, anduneven utilization of resources assigned to previouslyarranged processes what can be seen in Fig. 7. Byoptimization of tasks assignment, shown in Fig. 8 and 9, it ispossible to achieve shorter tact time of continuous process,with often smaller number of assigned resources (workers).All workers taking place at the new location have to beskilled in all kinds of work inside continuous process.
For the average customer demand level (6pylons/month), customer tact time can be calculated.Available working time per month is 300 h, and thus tacttime of 50 h, shown in Fig. 8, is necessary to fulfill averagecustomer demand. After optimization of tasks assignment,total number of workers in continuous process is 6 (Fig. 8).
One of main principles, which provide a framework formanaging production based on Lean production, isadjusting the production to the level of demand. In that
Figure 7Slika 7.
Current state worker assignmentsTrenutno stanje pridodavanja radnika
Figure 8Slika 8.
Future state worker assignmentsBuduće stanje pridodavanja radnika
way it is possible to accomplish all customer demands andneeds in every stage of production process [5].
During simulation time, customer demand grows up to8 pylons/month. To fulfill increased demand, productiontact time has to be additionally reduced. By assignment oftwo more workers to continuous (bottleneck) process, cycletime is reduced to 38 hours (Fig. 9).
In case of further increasing of resources assignment tocontinuous process, pylon assembly process becomes abottleneck process.
The number of resources by application of continuousprocess is reduced by 4 or 2. Except resources balancingthroughout of continuous process arrangement, Lean toolslike use of supermarkets with kanban pull system, heiyunka,first in first out (FIFO) material flow were also used infuture state developing process.
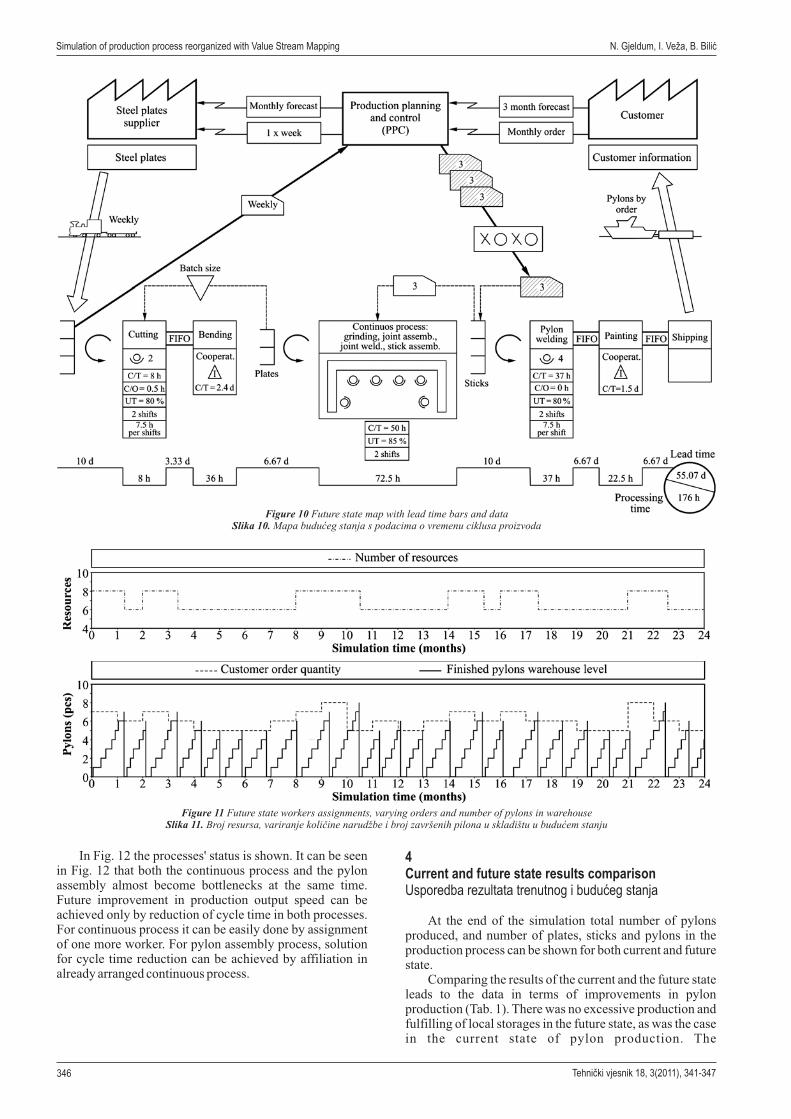
Future state value stream map is developed using theLean manufacturing tools and shown in Fig. 10. In futurestate, according to VSM, lead time is reduced to 55 07 dayswhich represents saving of 31 67 days in comparison tocurrent state. Like in current state, for the production of onepylon 176 hours (11 74 days) are needed.
Simulation model for future state was also developed.The same process time values and varying costumerdemand were applied.
Simulation results are shown in Fig. 11. The customerdemand and number of finished pylons ready to ship areshown during simulation time. It can be seen that at the endof future state simulation time, delay in shipping wasapproximately 8 days which is appreciable improvement incomparison to current state simulation results. The delaytime of maximum 11 days occurs in 17-th month ofsimulation time. The varying assignment of resources tocontinuous (bottleneck) process, also shown in Fig. 11,speeding up production process in periods of time whencustomer demand raises to 7 or more pylons per month.Increased number of resources continues to work incontinuous process until shipment of that order is done.
The production was organized as pull system with FIFOmaterial flow, which blocks processes in producing a largeramount of products that the next downstream process needsin that moment. During simulation time, because ofbottleneck process cycle time adjusting, there was not asignificant delay time in shipping.
,,
,
3.4Simulation of future stateSimulacija budućeg stanja
Figure 9Slika 9.
Additional workers assignmentsDodatno pridodavanje radnika
346 Tehni ki vjesnikč ,18, 3(2011) 341-347
N Gjeldum, I Veža, B Bili. . . ć
4Current and future state results comparisonUsporedba rezultata trenutnog i budućeg stanja
At the end of the simulation total number of pylonsproduced, and number of plates, sticks and pylons in theproduction process can be shown for both current and futurestate.
Comparing the results of the current and the future stateleads to the data in terms of improvements in pylonproduction (Tab. 1). There was no excessive production andfulfilling of local storages in the future state, as was the casein the current state of pylon production. The
Simulation of production process reorganized with Value Stream Mapping
Figure 10Slika 10.
Future state map with lead time bars and datapodacima o vremenu ciklusa proizvodaMapa budućeg stanja s
Figure 11Slika 11.
Future state workers assignments, varying orders and number of pylons in warehouseih pilonaBroj resursa, variranje količine narudžbe i broj završen u skladištu u budućem stanju
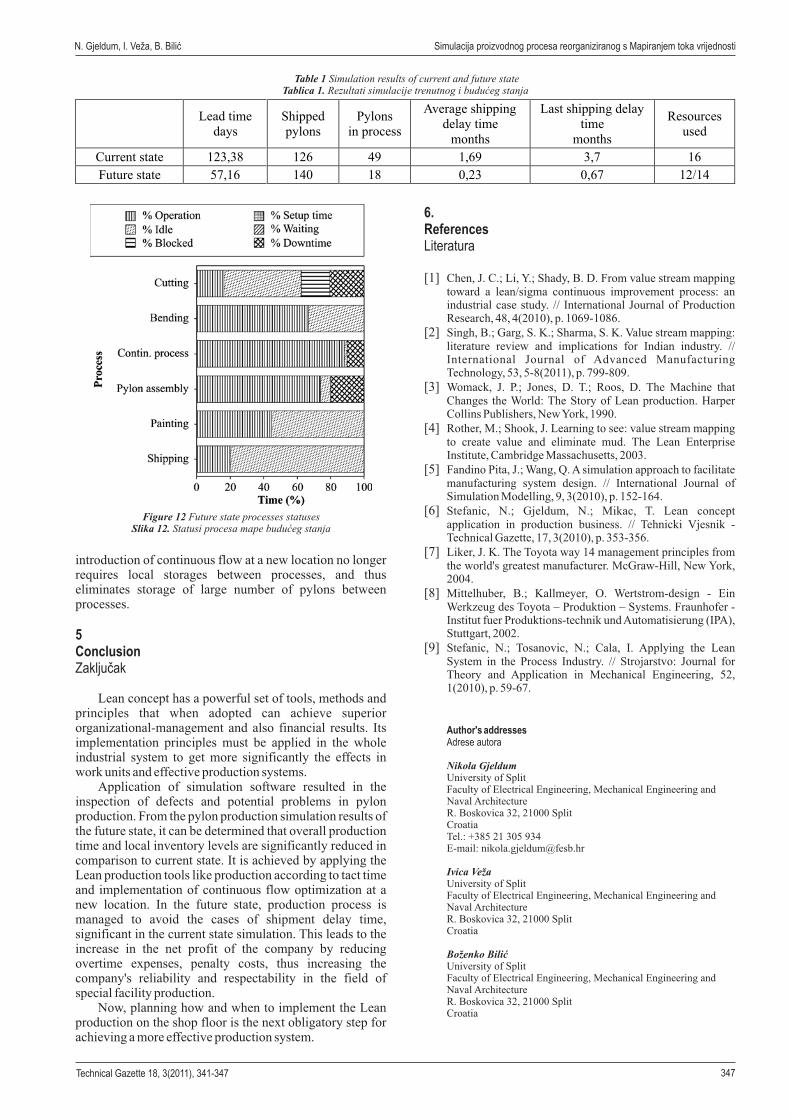
In Fig. 12 the processes' status is shown. It can be seenin Fig. 12 that both the continuous process and the pylonassembly almost become bottlenecks at the same time.Future improvement in production output speed can beachieved only by reduction of cycle time in both processes.For continuous process it can be easily done by assignmentof one more worker. For pylon assembly process, solutionfor cycle time reduction can be achieved by affiliation inalready arranged continuous process.
347Technical Gazette ,18, 3(2011) 341-347
N Gjeldum, I Veža, B Bili. . . ć
6.ReferencesLiteratura
[1]
[2]
[3]
[4]
[5]
[6]
[7]
[8]
[9]
Chen, J. C.; Li, Y.; Shady, B. D. From value stream mappingtoward a lean/sigma continuous improvement process: anindustrial case study. // International Journal of ProductionResearch, 48, 4(2010), p. 1069-1086.
Singh, B.; Garg, S. K.; Sharma, S. K. Value stream mapping:literature review and implications for Indian industry. //International Journal of Advanced ManufacturingTechnology, 53, 5-8(2011), p. 799-809.
Womack, J. P.; Jones, D. T.; Roos, D. The Machine thatChanges the World: The Story of Lean production. HarperCollins Publishers, NewYork, 1990.
Rother, M.; Shook, J. Learning to see: value stream mappingto create value and eliminate mud. The Lean EnterpriseInstitute, Cambridge Massachusetts, 2003.
Fandino Pita, J.; Wang, Q. A simulation approach to facilitatemanufacturing system design. // International Journal ofSimulation Modelling, 9, 3(2010), p. 152-164.
Stefanic, N.; Gjeldum, N.; Mikac, T. Lean conceptapplication in production business. // Tehnicki Vjesnik -Technical Gazette, 17, 3(2010), p. 353-356.
Liker, J. K. The Toyota way 14 management principles fromthe world's greatest manufacturer. McGraw-Hill, New York,2004.
Mittelhuber, B.; Kallmeyer, O. Wertstrom-design - EinWerkzeug des Toyota – Produktion – Systems. Fraunhofer -Institut fuer Produktions-technik und Automatisierung (IPA),Stuttgart, 2002.
Stefanic, N.; Tosanovic, N.; Cala, I. Applying the LeanSystem in the Process Industry. // Strojarstvo: Journal forTheory and Application in Mechanical Engineering, 52,1(2010), p. 59-67.
Author's addressesAdrese autora
Nikola Gjeldum
Ivica Veža
University of SplitFaculty of Electrical Engineering, Mechanical Engineering andNaval ArchitectureR. Boskovica 32 21000 SplitCroatiaTel.: +385 21 305 934E-mail: [email protected]
University of SplitFaculty of Electrical Engineering, Mechanical Engineering andNaval ArchitectureR. Boskovica 32 21000 SplitCroatia
University of SplitFaculty of Electrical Engineering, Mechanical Engineering andNaval ArchitectureR. Boskovica 32 21000 SplitCroatia
,
,
,
Boženko Bilić
introduction of continuous flow at a new location no longerrequires local storages between processes, and thuseliminates storage of large number of pylons betweenprocesses.
Lean concept has a powerful set of tools, methods andprinciples that when adopted can achieve superiororganizational-management and also financial results. Itsimplementation principles must be applied in the wholeindustrial system to get more significantly the effects inwork units and effective production systems.
Application of simulation software resulted in theinspection of defects and potential problems in pylonproduction. From the pylon production simulation results ofthe future state, it can be determined that overall productiontime and local inventory levels are significantly reduced incomparison to current state. It is achieved by applying theLean production tools like production according to tact timeand implementation of continuous flow optimization at anew location. In the future state, production process ismanaged to avoid the cases of shipment delay time,significant in the current state simulation. This leads to theincrease in the net profit of the company by reducingovertime expenses, penalty costs, thus increasing thecompany's reliability and respectability in the field ofspecial facility production.
Now, planning how and when to implement the Leanproduction on the shop floor is the next obligatory step forachieving a more effective production system.
5ConclusionZaključak
Simulacija proizvodnog procesa reorganiziranog s Mapiranjem toka vrijednosti
Figure 12Slika 12.
Future state processes statusesStatusi procesa mape budućeg stanja
Lead time
days
Shipped
pylons
Pylons
in process
Average shipping
delay time
months
Last shipping delay
time
months
Resources
used
Current state 123,38 126 49 1,69 3,7 16
Future state 57,16 140 18 0,23 0,67 12/14
Table 1Tablica 1.
Simulation results of current and future stateRezultati simulacije trenutnog i budućeg stanja