stochastic frontier production...
TRANSCRIPT

European Journal of Agricultural and Forestry Research
Vol.1, No.2, pp.1-15, December 2013
Published by European Centre for Research Training and Development UK (www.ea-journals.org)
1
STOCHASTIC FRONTIER PRODUCTION FUNCTION ON THE RESOURCE USE
EFFICIENCY OF FADAMA II CROP FARMERS IN ADAMAWA STATE, NIGERIA
A.A. GIREI, B. DIRE, M.M. ILIYA AND M. SALIHU
1. Department of Agricultural Economics and Extension, School of Agriculture and Agricultural
Technology, Modibbo Adama University of Technology, Yola. Adamawa State
2. Department of Agricultural Economics and Extension, School of Agriculture and Agricultural
Technology, Modibbo Adama University of Technology, Yola. Adamawa State
3. Department of Agricultural Extension and Management, College of Agriculture Jalingo.
Taraba State.
4. Department of Agricultural Economics and Extension, Faculty of Agriculture, Federal
University, Dutse. Jigawa State.
ABSTRACT: This study assess the resource use efficiency of Fadama II beneficiary crop
farmers in Adamawa state, Nigeria. Data were collected on a sample of 160 farmers and were
analyzed using stochastic frontier production function. The maximum likelihood estimates (MLE)
for the stochastic production function results shows that the coefficients of farm size, inorganic
fertilizer, hired labour and expenses on ploughing, significantly affect food crop output of the
respondents. The mean technical efficiency was 0.71 (or 71%), the mean allocative efficiency
was 0.76 (or 76%) and the mean economic efficiency was 0.54 (or 54%). The study concludes
that, the maximum likelihood estimates (MLE) for the stochastic production function of the
coefficients of farm size(X1), inorganic fertilizer (X3), hired labour (X5) and expenses on
ploughing (X6) were found to be positive and significantly affect food crop output of the
respondents with the mean technical efficiency is 0.71 (or 71%). It is however recommended
that, Government and other donor agencies should intensify advisory services activities on
effective resource allocation, utilization and other ways of increasing farmers’ beneficiary
income. Government in partnership with private sector should encourage farmers to increase its
technical efficiency in food crop production which could be achieved through improved farmer
specific efficiency factors, which include improved farmer education, access to credit, access to
improved extension services and less crop diversification. Government to introduce mentorship
and pre-job training programmes and to include the youth in policy decisions.
KEYWORDS: Resource, Efficiency, Fadama II, Crop Farmers, Application, Stochastic Frontier
Production Function.
K
INTRODUCTION
Agriculture is a primary based activity among the Nigerian rural families. But, because of the
increasing demand for food and jobs for many dwellers, it became necessary for households to
embark on agriculture as a means of filling the food demand and supply gap and providing
income for other household requirements, wealth generation and food security, Earfan Ali et al,
(2013). According to Bukenya (2013), a considerable scope to expand output and also
European Journal of Agricultural and Forestry Research
Vol.1, No.2, pp.1-15, December 2013
Published by European Centre for Research Training and Development UK (www.ea-journals.org)
2
productivity by increasing production efficiency at the relatively inefficient farms and sustaining
the efficiency of those operating at or closer to the frontier is an alternative to attaining this. Thus
several factors like education level and years in farming experience contributes to increase in the
resource use efficiency among farmers Amodu et al, (2011).
However, Crop production in Nigeria is predominantly rain-fed although supplemented with
irrigation in the dry season in some areas. Okpe, (2012) observed that, opportunities available
in the agricultural sector in Nigeria still remain untapped because most available lands suitable
for agricultural production is uncultivated and all year farming have not been carried. However,
one way to harness the agricultural potential of this country is by exploiting the available and
viable Fadama lands which is small-scale, farmer based, privatized irrigation system for crop
production especially during the dry season. It is an alternative to large scale irrigation, which
failed to meet the food self-sufficiency and food security of the country (Baba, 1993). The
importance of fadama cropping system arises from the fact that fadama activity afforded people
some opportunities at a time they would have been idle, besides, the surplus labour during dry
seasons is utilized unlike in the rainy season when labour is a constraint (Sanda and Ayo, 1994).
The importance of fadama lands stem from their high level of residual moisture even during dry
season as well as during drought conditions. The fadamas are also generally higher in organic
matter and nutrients than adjacent upland soils ( Kyuma, 2001). Until recently, little attention has
been given to fadama lands. However, with the realization that population in Nigeria is growing
at an alarming rate, while food supply is slow coupled with the wide spread poverty among the
population, the National Fadama Development Project-II (Fadana II) was put in place to
sustainably increase the income of the Fadama user through increase output. Yet, the issue of
increase food productivity has not been achieved. This may be due to low area of land utilized or
inefficient use of resource in its production. This study would therefore answer the question of
inefficient resource use by the Fadama II beneficiary crop farmers.
Efficiency analysis is generally associated with the possibility of farms producing a certain level
of output from a given bundle of resources or certain level of output at least cost. Maximum
efficiency is attained when it becomes impossible to reshuffle a given resource combination
without decreasing the total output (Adeoti, 2001; Adebayo, 2006).
CONCEPTUAL AND THEORETICAL FARMEWORK
The production function stipulates the technical relationship between inputs and output in the
production process (Olayide and Heady, 1982). This function is assumed to be continuous and
differentiable in mathematical terms. The concept of efficiency is concerned with the relative
performance of the process used in the production process (Upton, 1996). Three types of
efficiency were identified. They include: technical, allocative and economic efficiency.
Measurement of efficiency according to Ogunjobi (1999) is important for the following reasons:
Firstly, it is a success indicator, performance measure by which productive units are evaluated.
Secondly, only by measuring efficiency and separating its effects from the effects of the
production environment can one explore hypotheses concerning the sources of efficiency
differentials. Identification of sources of inefficiency is important to institution of public and
private agencies designed to improve performance. Thirdly, the ability to quantify efficiency
European Journal of Agricultural and Forestry Research
Vol.1, No.2, pp.1-15, December 2013
Published by European Centre for Research Training and Development UK (www.ea-journals.org)
3
provides decision makers with mechanism with which to monitor the performance of the
production system or units under their control. In some cases, theory provides no guidance or
provides conflicting signals concerning the impact of some phenomena on performance. In such
situations, empirical measurement provides qualitative as well as quantitative evidence (Coelli,
1995).
Technical efficiency is based on expressing the maximum amount of output obtainable from
given bundles of production resources with fixed technology. It is the attainment of production
goods without wastage (Amaza and Olayemi, 1999). This is regarded as estimating average
production function (Olayide and Heady, 1982). This definition assumes that technical
inefficiency is absent from the production frontier. Farrell (1957) suggested a method of
measuring technical efficiency of a firm in an industry by estimating the production function of
firms which are fully efficient (ie frontier production function).
Allocative efficiency on the other hand relates to the degree to which a farmer utilizes inputs in
optimal proportions, given the observed input prices (Coelli et al., 2002; Ogundari et al, 2006).
Russell and Young (1983) looked at Allocative efficiency (AE) as a condition that exists when
resources are allocated within the firm according to market prices. In a materialistic society
according to them, this will represent a desirable characteristic when market prices are a true
measure of relative scarcity. This will be the case when prices are determined in perfectly
competitive markets, but when prices are distorted by monopolistic influences or where some
goods remain outside the market system the role of prices in resource allocation is greatly
impaired. Lau and Yotopoulos (1989) stated that a farm is said to be allocatively efficient if it
maximizes profit, that is, it equates its marginal product of every variable input to its
corresponding opportunity cost. A farm which fails to do so is said to be allocatively inefficient.
In Farrell’s framework, economic efficiency (EE) is an overall performance measure and is equal
to the product of Technical Efficiency (TE) and Allocative efficiency (AE) i.e EE = TE ´ AE.
The simultaneous achievement of both efficient conditions according to Heady (1952) occurs
when price relationship are employed to denote maximum profits for the firm or when the choice
indicators are employed to denote the maximization of other economic objectives.
According to Adesina and Djato (1997) economic efficiency occurs when a firm chooses
resources and enterprises in such a way as to attain economic optimum. The optimum implies
that a given resource is considered to be most efficiently used when its marginal value
productivity is just sufficient to offset its marginal cost. Thus, economic efficiency refers to the
choice of the best combination for a particular level of output which is determined by both input
and output prices. This would lead to increase in the farmers output as well as its income
invariably leading to poverty reduction, improved living condition and wellbeing.
One of the suggested ways of achieving reduction in poverty is utilizing of the poor endowment
for improved income earning and in living standards. In other words, enabling the poor to
increase their level of production of economic goods, increase their income level and thereby
their living standards. An obvious way of achieving this is enabling the poor to increase their
agricultural output, so as not only to improve their income but also lift them above the
European Journal of Agricultural and Forestry Research
Vol.1, No.2, pp.1-15, December 2013
Published by European Centre for Research Training and Development UK (www.ea-journals.org)
4
subsistence level. The use of the stochastic frontier analysis in studies in agriculture would
enable both the researchers and the farmers in the allocation and use of its resources optimally.
In Nigeria, the application of this function is a recent development. Such studies conducted in the
recent times include that of Udoh (2000), Okike (2000), Amaza (2000) and Umoh (2006). Udoh
used the Maximum Likelihood Estimation of the stochastic production function to examine the
land management and resource use efficiency in South-Eastern Nigeria. The study found a mean
output-oriented technical efficiency of 0.77 for the farmers, 0.98 for the most efficient farmers
and 0.01 for the least efficient farmers. Okike’s study investigated crop-livestock interaction and
economic efficiency of farmers in the savanna zones of Nigeria. The study found average
economic efficiency of farmers was highest in the Low-Population-Low Market domain;
Northern Guinea and Sudan Savannas ecological zones; and Crop-based Mixed Farmers farming
system. Similarly, Umoh’s study employed the stochastic frontier production function to analyse
the resource use efficiency of urban farmers in Uyo, Southeastern Nigeria. The result shows that
65% of urban farmers were 70% technology efficient; maximum efficiency is 0.91, while
minimum efficiency in urban farm is 0.43
The National Fadama Project-II is among the most recently introduced poverty reduction
programmes aimed at uplifting the living standards of people through increase productivity and
enhanced income generation. A study by Ayanwale and Alimi (2004) has revealed that regions
where agriculture is the main source of employment has higher incidence of poverty. It thus
becomes imperative that appropriate technology and efficient resource use as a measure for
increase productivity must be taken into consideration.
Consequently, it is against this background that, this study was structured to provide answers to
the following questions:
i. What were the optimum quantities of inputs and output for profit maximization in fadama crop
production?
ii. How efficient were Fadama II beneficiaries in food crop production?
Hypotheses of the Study
Ho: Fadama II crop farmers were not technically, allocatively and economically efficient in food
crop production in the study area.
METHODOLOGY
The study Area
Adamawa State is located in the North Eastern part of Nigeria and lies between latitude 70 and
11oN of the equator and longitude 11
o and 14
oE of the Greenwich meridian (Fig 1). It shares
common boundary with Taraba State in the south and west, Gombe State in the northwest and
Borno State in the north. The state has an international boundary with the Cameroun republic
along its eastern border.
Adamawa State covers a land area of about 38,741 km2 with a population of 3.17 million people
(NPC, 2006). Out of this estimated land area about 226,040 ha is under cultivation with about
400 ha under irrigation (Adamawa ADP, 1996). The State has a tropical climate with maximum
European Journal of Agricultural and Forestry Research
Vol.1, No.2, pp.1-15, December 2013
Published by European Centre for Research Training and Development UK (www.ea-journals.org)
5
temperature reaching to as high as 40oC between December and January (Adebayo , 1999). The
mean annual rainfall pattern shows that the amount range from 700 mm in the northern-west part
of the state to 1600 mm in the southern part of the state. Generally, mean annual rainfall is less
than 1000 mm in the central and north-western part of the state including Song, Gombi,
Shelleng, Guyuk, Numan, Demsa, Yola and parts of Fufore local government area (Adebayo ,
1999). The major vegetation formations in the state are the southern guinea savannah, northern
guinea savannah and the sudan savannah. Within each formation is an interspersion of thickets,
tree savannah, open grass savannah and fringing forests in the river valleys.
Nature and Sources of Data
Primary data was used for this study. These were collected through the administration of
structured questionnaires to randomly selected Fadama farmers. The data collected included
respondents’ personal background, production inputs, and cost of production, income and
expenditure, accessibility to basic amenities among others. Data collection was facilitated with
the aid of trained staff selected from the four (4) zones of the state ADP.
Sampling Procedure and Sample Size
Multistage stratified random sampling and purposive sampling techniques were used in the
selection of respondents. In the first stage, the state was stratified into four according to the
Adamawa Agricultural Development Programme (ADADP) zones (Table 3.1). In each of the
zone, participating local government areas in fadama crop production was purposively selected
in proportion to the existing number of Fadama User Associations (FUA).In line with this, four
local government areas in Zone II and one each in Zones I, III and IV were selected. In all, a
total of seven local government areas were sampled. One hundred and eighty (180) food crop
farmers were randomly selected in the FUA groups in the seven selected local government areas
in proportion to their number in each local government. The membership of each FUA ranges
from 10 – 30.
Analytical tools
Inferential statistics was employed in the analysis of data. Inferential statistics involved the use
of stochastic frontier production function to determine the technical, allocative and economic
efficiencies of food crop fadama farmers in crop production in the study area. Linear
programming was used to determine the crop combination that maximizes the production
objective of the farmers.
Stochastic Frontier Production Function
The stochastic frontier production function comprises of a production function of the usual
regression type with a composite disturbance term equal to the sum of two error components
(Aigner et al., 1977; Meeusen and Van den Broeck,1977; Xu and Jeffrey, 1998; Amodu et al,
2011). The model is defined by:
( ) ( ) and
( ) Where Yi is the output of the i
th farm, f(xi) represents an appropriate function of the vector, Xi of
vector of input quantities used by the ith
farm and a vector of unknown parameters, which are
European Journal of Agricultural and Forestry Research
Vol.1, No.2, pp.1-15, December 2013
Published by European Centre for Research Training and Development UK (www.ea-journals.org)
6
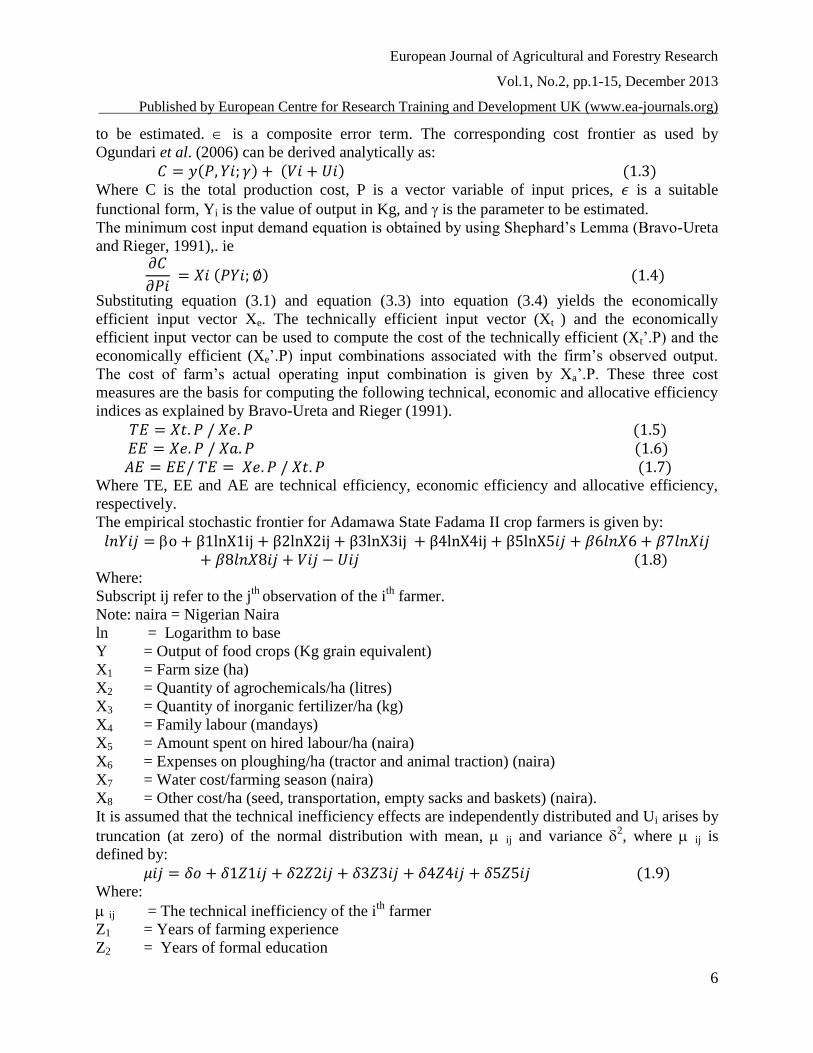
to be estimated. is a composite error term. The corresponding cost frontier as used by
Ogundari et al. (2006) can be derived analytically as:
( ) ( ) ( ) Where C is the total production cost, P is a vector variable of input prices, is a suitable
functional form, Yi is the value of output in Kg, and is the parameter to be estimated.
The minimum cost input demand equation is obtained by using Shephard’s Lemma (Bravo-Ureta
and Rieger, 1991),. ie
( ) ( )
Substituting equation (3.1) and equation (3.3) into equation (3.4) yields the economically
efficient input vector Xe. The technically efficient input vector (Xt ) and the economically
efficient input vector can be used to compute the cost of the technically efficient (Xt’.P) and the
economically efficient (Xe’.P) input combinations associated with the firm’s observed output.
The cost of farm’s actual operating input combination is given by Xa’.P. These three cost
measures are the basis for computing the following technical, economic and allocative efficiency
indices as explained by Bravo-Ureta and Rieger (1991).
( ) ( ) ( )
Where TE, EE and AE are technical efficiency, economic efficiency and allocative efficiency,
respectively.
The empirical stochastic frontier for Adamawa State Fadama II crop farmers is given by:
( )
Where:
Subscript ij refer to the jth
observation of the ith
farmer.
Note: naira = Nigerian Naira
ln = Logarithm to base
Y = Output of food crops (Kg grain equivalent)
X1 = Farm size (ha)
X2 = Quantity of agrochemicals/ha (litres)
X3 = Quantity of inorganic fertilizer/ha (kg)
X4 = Family labour (mandays)
X5 = Amount spent on hired labour/ha (naira)
X6 = Expenses on ploughing/ha (tractor and animal traction) (naira)
X7 = Water cost/farming season (naira)
X8 = Other cost/ha (seed, transportation, empty sacks and baskets) (naira).
It is assumed that the technical inefficiency effects are independently distributed and Ui arises by
truncation (at zero) of the normal distribution with mean, ij and variance 2, where ij is
defined by:
( ) Where:
ij = The technical inefficiency of the ith
farmer
Z1 = Years of farming experience
Z2 = Years of formal education

European Journal of Agricultural and Forestry Research
Vol.1, No.2, pp.1-15, December 2013
Published by European Centre for Research Training and Development UK (www.ea-journals.org)
7
Z3 = Extension contact (number of meetings)
Z4 = Household size
Z5 = Age of farmers (years)
The empirical stochastic frontier cost function for Adamawa fadama crop farmers is given by:
( )
Where:
Note: naira = Nigerian Naira
C1 =Total production cost (naira)
P1 = Cost of land (naira)
P2 = Cost of agrochemicals (naira)
P3 = Cost of fertilizers (naira)
P4 = Cost of family labour (naira)
P5 = Cost of hired labour (naira)
P6 = Expenses on ploughing (naira)
P7 = Water cost (naira)
P8 = Other cost (in naira)
It is assumed that the technical inefficiency effects are independently distributed and Ui arises by
truncation (at zero) of the normal distribution with mean, ij and variance 2, where ij is
defined by:
( ) Where:
ij = The cost inefficiency of the ith
farmer
Z1 = Years of farming experience
Z2 = Years of formal education
Z3 = Extension contact (number of meetings)
Z4 = Household size
Z5 = Age of farmers (years)
The maximum-likelihood estimates of and coefficients were estimated simultaneously using
the computer program FRONTIER 4.1, in which the variance parameters are expressed in terms
of 2
S = 2v +
2 and = /
2 (Coelli, 1994).
RESULTS AND DISCUSSION
Efficiency Estimation
The maximum likelihood estimates (MLE) for the stochastic production function used in
explaining the influence of production inputs on the output of food crop among beneficiaries of
Fadama II, and also in determining the effect of farmer specific characteristics on technical
inefficiency is presented in Table 1.1. The parameters were estimated simultaneously using
frontier 4.1c developed by Coelli (1996).The results shows that the coefficients of farm size (X1),
inorganic fertilizer (X3), hired labour (X5) and expenses on ploughing (X6) were found to be
positive and significantly affect food crop output of the respondents as revealed by the computed
t-values. This implies that, any increase in the use of these production inputs would bring about
increase in food crop output.

European Journal of Agricultural and Forestry Research
Vol.1, No.2, pp.1-15, December 2013
Published by European Centre for Research Training and Development UK (www.ea-journals.org)
8
The value of the sigma squared (δ2) is 0.6548 and is statistically significant at 1% level. This also
indicates a good fit and correctness of the distributional form assumed for the composite error
term in the model. The variance ratio (ץ) is 0.88 and also statistically significant at 1% level,
implying that 88% of the variation in crop output of the respondents is due to differences in their
technical efficiencies. This explains the reason why the ordinary least squares (OLS) estimates
will not be adequate in explaining inefficiency differentials among the farmers. All the estimated
coefficients are less than one, indicating that input allocation is in stage II of the production
function.
The estimated coefficient for farm size is positive, which conform to a priori expectation and
significant at 1% level. The magnitude of the coefficient (0.24) indicates that, the output of food
crop is inelastic to changes in the level of cultivated land area. Therefore, this implies that a 1%
increase in cultivated land area, ceteris paribus, would lead to an increase of 0.24% in the output
of food crop, and vice versa.
The production elasticity with respect to inorganic fertilizer is positive as expected and
statistically significant at 5% level. This stems from the fact that, fertilizer is a major land
augmenting input which improves the productivity of existing land by increasing yield per unit
area. Though Fadama lands have superior fertility status, but increase in the quantity of fertilizer
used in food crop production would further increase the fertility of the existing land resulting in
higher output. This study is consistent with the findings of Umoh (2006) that fertilizers increase
crop yield.
The magnitude of the coefficient of hired labour, which is 0.13, indicates that output in food crop
production in the Fadama lands is highly inelastic to changes in the amount of hired labour used.
Thus, a 1% increase in the mandays of hired labour used would induce an increase of 0.13% in
the output of food crop, and vice versa.
The estimated coefficient for expenses on ploughing is positive and statistically significant at 1%
level, indicating that food crop output among the respondents is inelastic to changes in the
expenses on ploughing. A 1% increase in the expenses on ploughing would bring about 0.05%
increase in the output of food crop.
The returns to scale which is the sum of elasticities reveals that food crop production among
Fadama II beneficiaries is inelastic (0.663) and is in stage II of the production surface. Thus,
additional input would bring about increase in output but at a decreasing rate although it is the
rational stage of production.
The inefficiency parameters were specified as those relating to farmers’ specific socio-economic
characteristics. Three out of the five variables used in the model are significant and also have
apriori expected signs. A negative coefficient indicates that the variable increases efficiency in
food crop production and vice versa; hence, education, extension contact and age increase the
efficiency in food crop production in the study area.
European Journal of Agricultural and Forestry Research
Vol.1, No.2, pp.1-15, December 2013
Published by European Centre for Research Training and Development UK (www.ea-journals.org)
9
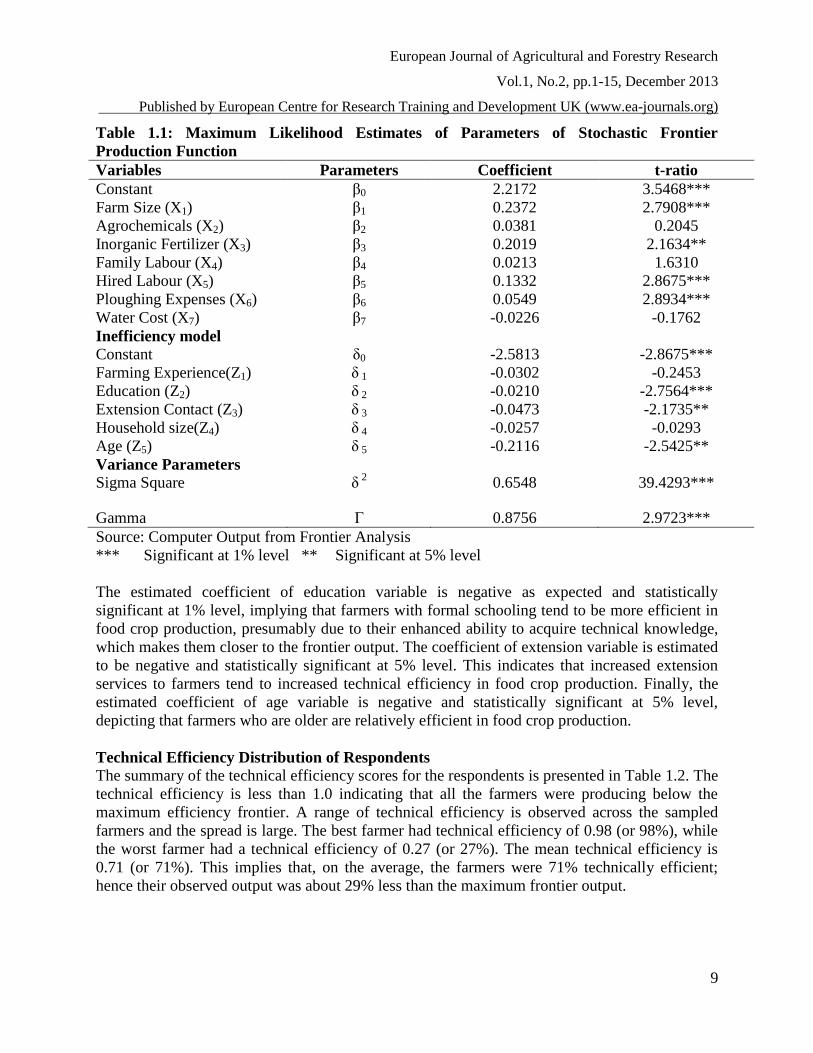
Table 1.1: Maximum Likelihood Estimates of Parameters of Stochastic Frontier
Production Function
Variables Parameters Coefficient t-ratio
Constant β0
2.2172 3.5468***
Farm Size (X1) β1 0.2372 2.7908***
Agrochemicals (X2) β2 0.0381 0.2045
Inorganic Fertilizer (X3) β3 0.2019 2.1634**
Family Labour (X4) β4 0.0213 1.6310
Hired Labour (X5) β5 0.1332 2.8675***
Ploughing Expenses (X6) β6 0.0549 2.8934***
Water Cost (X7) β7 -0.0226 -0.1762
Inefficiency model
Constant δ0 -2.5813 -2.8675***
Farming Experience(Z1) δ 1 -0.0302 -0.2453
Education (Z2) δ 2 -0.0210 -2.7564***
Extension Contact (Z3) δ 3 -0.0473 -2.1735**
Household size(Z4) δ 4 -0.0257 -0.0293
Age (Z5) δ 5 -0.2116 -2.5425**
Variance Parameters
Sigma Square δ 2 0.6548 39.4293***
Gamma Γ 0.8756 2.9723***
Source: Computer Output from Frontier Analysis
*** Significant at 1% level ** Significant at 5% level
The estimated coefficient of education variable is negative as expected and statistically
significant at 1% level, implying that farmers with formal schooling tend to be more efficient in
food crop production, presumably due to their enhanced ability to acquire technical knowledge,
which makes them closer to the frontier output. The coefficient of extension variable is estimated
to be negative and statistically significant at 5% level. This indicates that increased extension
services to farmers tend to increased technical efficiency in food crop production. Finally, the
estimated coefficient of age variable is negative and statistically significant at 5% level,
depicting that farmers who are older are relatively efficient in food crop production.
Technical Efficiency Distribution of Respondents
The summary of the technical efficiency scores for the respondents is presented in Table 1.2. The
technical efficiency is less than 1.0 indicating that all the farmers were producing below the
maximum efficiency frontier. A range of technical efficiency is observed across the sampled
farmers and the spread is large. The best farmer had technical efficiency of 0.98 (or 98%), while
the worst farmer had a technical efficiency of 0.27 (or 27%). The mean technical efficiency is
0.71 (or 71%). This implies that, on the average, the farmers were 71% technically efficient;
hence their observed output was about 29% less than the maximum frontier output.
European Journal of Agricultural and Forestry Research
Vol.1, No.2, pp.1-15, December 2013
Published by European Centre for Research Training and Development UK (www.ea-journals.org)
10
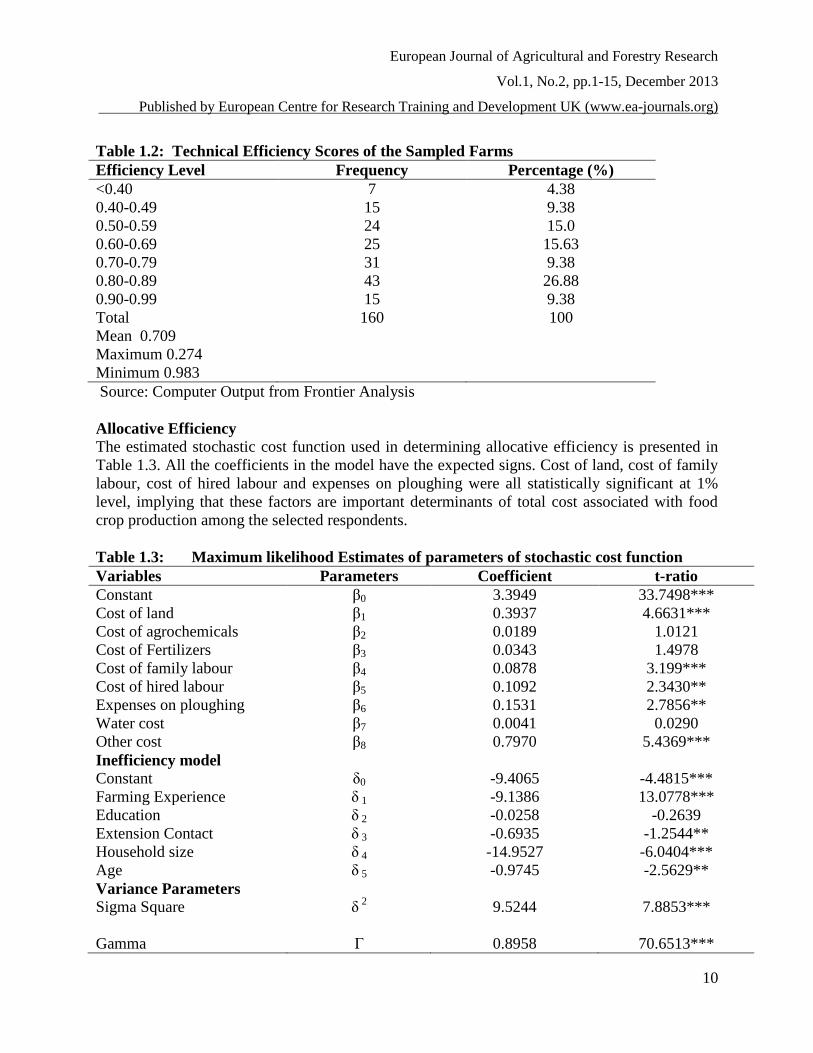
Table 1.2: Technical Efficiency Scores of the Sampled Farms
Efficiency Level Frequency Percentage (%)
<0.40
0.40-0.49
0.50-0.59
0.60-0.69
0.70-0.79
0.80-0.89
0.90-0.99
Total
Mean 0.709
Maximum 0.274
Minimum 0.983
7
15
24
25
31
43
15
160
4.38
9.38
15.0
15.63
9.38
26.88
9.38
100
Source: Computer Output from Frontier Analysis
Allocative Efficiency
The estimated stochastic cost function used in determining allocative efficiency is presented in
Table 1.3. All the coefficients in the model have the expected signs. Cost of land, cost of family
labour, cost of hired labour and expenses on ploughing were all statistically significant at 1%
level, implying that these factors are important determinants of total cost associated with food
crop production among the selected respondents.
Table 1.3: Maximum likelihood Estimates of parameters of stochastic cost function
Variables Parameters Coefficient t-ratio
Constant β0
3.3949 33.7498***
Cost of land β1 0.3937 4.6631***
Cost of agrochemicals β2 0.0189 1.0121
Cost of Fertilizers β3 0.0343 1.4978
Cost of family labour β4 0.0878 3.199***
Cost of hired labour β5 0.1092 2.3430**
Expenses on ploughing β6 0.1531 2.7856**
Water cost β7 0.0041 0.0290
Other cost β8 0.7970 5.4369***
Inefficiency model
Constant δ0 -9.4065 -4.4815***
Farming Experience δ 1 -9.1386 13.0778***
Education δ 2 -0.0258 -0.2639
Extension Contact δ 3 -0.6935 -1.2544**
Household size δ 4 -14.9527 -6.0404***
Age δ 5 -0.9745 -2.5629**
Variance Parameters
Sigma Square δ 2 9.5244
7.8853***
Gamma Γ 0.8958 70.6513***

European Journal of Agricultural and Forestry Research
Vol.1, No.2, pp.1-15, December 2013
Published by European Centre for Research Training and Development UK (www.ea-journals.org)
11
Source: Computer Output from Frontier Analysis
***Significant at 1% level **Significant at 5% level
The variance ratio which is estimated by gamma, (0.90) ץ is very close to one and statistically
significant at 1% level, showing the amount of variation in total cost of production brought about
by cost inefficiencies. This implies that, 90% of the variation in the total cost of production
among the sampled farmers is due to cost inefficiencies. The value of sigma squared (2) is 9.52
and is statistically significant at 1% level, indicating good fit and correctness of the distributional
form assumed for the composite error term in the model.
Allocative Efficiency Distribution of Respondents
The allocative efficiency indices which measures the rate at which resources are allocated in
optional proportion is presented in Table 1.4. The allocative efficiencies of all the respondents
were less than 1.0 indicating that all the respondents were producing below the maximum cost
efficiency frontier. A range of allocative efficiencies is estimated to be 0.76 (or 76%), indicating
that Fadama II beneficiaries are 76% allocatively efficient in food crop production.
Table 1.4: Allocative Efficiency of the sampled farmers.
Efficiency Level Frequency Percentage (%)
0.40-0.49
0.50-0.59
0.60-0.69
0.70-0.79
0.80-0.89
0.90-0.99
Total
Mean 0.76
Maximum 0.99
Minimum 0.45
5
15
22
44
53
21
160
3.13
9.38
13.75
27.50
33.13
13.13
100
Source: Computer Output from Frontier Analysis
Economic Efficiency
Economic efficiency of the farmers which is obtained as the product of technical and allocative
efficiency scores is presented in Table 1.5. The result reveals that variation in the economic
efficiency levels among the respondents is large, with a minimum efficiency of 0.18 (or 18%),
and a maximum efficiency of 0.87 (or 87%). The mean economic efficiency is estimated to be
0.54(or 54%), an indication that the farmers are fairly economic efficient in food crop
production. The analysis of the efficiency levels reveal that about 20% of the farmers have
economic efficiency level of less than 40%, while about 22% have economic efficiency level of
40-49%. About 40% have economic efficiency level of 50-69%, while only about 18% have
efficiency level of 70% and above. Therefore, the simultaneous achievement of both technical
and allocative efficiencies is necessary for the achievement of economic efficiency.

European Journal of Agricultural and Forestry Research
Vol.1, No.2, pp.1-15, December 2013
Published by European Centre for Research Training and Development UK (www.ea-journals.org)
12
Table 1.5: Economic Efficiencies of sampled Farmers
Efficiency Level Frequency Percentage (%)
<0.30
0.30-0.39
0.40-0.49
0.50-0.59
0.60-0.69
0.70-0.79
0.80-0.89
Total
Mean 0.54
Maximum 0.87
Minimum 0.18
11
21
35
27
37
23
6
160
6.88
13.13
21.88
16.88
23.13
14.38
3.75
100
Source: Computer Output from Frontier Analysis
Distribution of Farm-level Technical inefficiency indices, Average Farm size and output
level
The extent to which farm size and output level relates to farm specific technical inefficiency
indices is presented in Table 1.6. As seen in the table, inefficiency effects have inverse and linear
relationships with output levels, but undefined relationship with farm size. As such lower
inefficiency index (<0.40 to 0.49) corresponds with greater output level and vice versa.
Table 1.6: Distribution of Farm-level Technical inefficiency indices, farm and output level
of Respondents
Efficiency Level Mean Farm size (Ha) Mean Output (kg)
<0.40
0.40-0.49
0.50-0.59
0.60-0.69
0.70 - 0.79
0.80- 0.89
0.90-0.99
3.86
6.53
3.16
3.30
3.66
3.88
2.40
12,660.00
15,133.33
4,760.42
6,742.00
7,685.48
8,744.18
2,753.33
Source: Data Analysis, 2011
CONCLUSION
The study concludes that, the maximum likelihood estimates (MLE) for the stochastic
production function of the coefficients of farm size(X1), inorganic fertilizer (X3), hired labour
(X5) and expenses on ploughing (X6) were found to be positive and significantly affect food crop
output of the respondents with the mean technical efficiency is 0.71 (or 71%). The Economic
efficiency of the farmers which is obtained as the product of technical and allocative efficiency
revealed a mean economic efficiency of 0.54(or 54%), an indication that the farmers are fairly
economic efficient in food crop production. It therefore suggests that, productivity and output of
the farmers can be increase for every increase in the resource efficiency use of the farmers.
Similarly, it indicates that the scope of output and productivity of farmers can be increased if
European Journal of Agricultural and Forestry Research
Vol.1, No.2, pp.1-15, December 2013
Published by European Centre for Research Training and Development UK (www.ea-journals.org)
13
better efficiencies are reached. The study therefore, would help other researchers and research
institutions in further research for more effective combinations of resources for better
efficiencies as well as increase output and productivity in the farming business, it would also
help the government, policy makers and other donor agencies in planning, designing and
formulations of agricultural programmes that would tends towards increase resource, resource
availability as well as affordability. The study therefore recommends: Government and other
donor agencies should intensify advisory services activities on effective resource allocation,
utilization and other ways of increasing farmers’ beneficiary income. Government in partnership
with private sector should encourage farmers to increase its technical efficiency in food crop
production which could be achieved through improved farmer specific efficiency factors, which
include improved farmer education, access to credit, access to improved extension services and
less crop diversification. Government to introduce mentorship and pre-job training programmes
and to include the youth in policy decisions. Government should establish farmer field days right
at the site of the farmer’s farm to honour individuals.
REFERENCES
Adebayo, E.F. (2006). Resource-Use Efficiency and multiple Production Objectives of Dairy
Pastoralists in Adamawa State, Nigeria. Unpublished Ph.D Thesis, University of Ibadan,
Nigeria.
Adebayo, E.F. and Onu, J.I. (1999). Economics of rice production in Yola-North and South
Local Government areas. Nigeria Journal of Tropical Agriculture, 1:.15-20
Adebayo, E.F., Moses, J.D. and Olawoye, H.U. (2010). Technical Efficiency of Women Farmers
in Adamawa State. In: Neils, J.S., Khobe, D., Ja’afar- Furo,M.R., and Futuless,
K.N(eds.).Entrepreneurship Development and Nigerian Agricultural Transformation
Process: Prospects and Challenges. Proceedings of the 24th
Annual National Conference
of Farm Management Association of Nigeria, FAMAN, Adamawa State University Mubi,
Nigeria 11-14th
October, 2010. 267-272.
Adeoti, A.I. (2001). Economic Analysis of irrigated and rainfed rics production systems in
Kwara State, Nigeria. Unpublished Ph.D thesis, University of Ibadan, 80-82.
Adesina, A.A. and Djato, K.K. (1997). “Relative efficiency of women as farm managers: profit
function approach”, Cote d’Voire, Journal of Agricultural Economics,.16: 47-53.
Afolabi, J.A. (2010). Fadama Farming as an Environment Friendly and Viable Enterprise in
Undo State, Nigeria. Journal of Human Ecology 30(2): 93-97
Aigner, D.J; Lovell, C.A.K. and Schmidt, P. (1977). “Formulation and Estimation of Stochastic
Frontier Production Function”. Journal of Econometrics, 6: 21-37.
Amaza, P.S. (2000). Resource-use Efficiency in Food Crop Production in Gombe State, Nigeria.
A Ph.D Thesis (unpublished), Department of Agricultural Economics, University of
Ibadan, Nigeria.
Amaza, P.S. and Anumah, C.O. (2003). Resource use Efficiency in Maize Production in Askira
/Uba Local Government Area of Borno State, Nigeria. Journal of Arid Agriculture,
13:117-120.
Amaza, P. S. and Olayemi, J. K. (1999). An Investigation of Production Efficiency in food Crop
Enterprises Gombe State, Nigeria, Journal of Rural Economics and Development 13: 111-
122.
European Journal of Agricultural and Forestry Research
Vol.1, No.2, pp.1-15, December 2013
Published by European Centre for Research Training and Development UK (www.ea-journals.org)
14
Amodu, M.Y., Owolabi, J.O. and Adeola, S.S. (2011). Resource Use Efficiency in Part-time
Food Crop Production: The Stochastic Frontier Approach. Nigerian Journal of Basic and
Applied Science Vol. 19(1):102 - 110
Ayanwale, and Alimi, T. (2004). “The Impact of the National Fadama Facility in Alleviating
Rural Poverty and Enhancing Agricultural Development in South-Western Nigeria”,
Journal of Social Science, 9(3): 157-161.
Baba, K.M. (1993). “Irrigation Development Strategies in Sub-Saharan Africa: A Comparative
Study of Traditional and Modern Irrigation Systems in Bauchi State, Nigeria”. Agricultural
Ecosystem Environment, 45: 47-58.
Bravo-Ureta, B.E. and Rieger, L. (1991). Dairy Farm Efficiency Measurement Using Stochastic
Frontiers and Neoclassical Duality. American Journal of Agricultural Economics 73:
421-428
Coelli, T.J. (1994). A Guide to Frontier Version 4.1; A Computer Program for Stochastic
Frontier Production and Cost Function estimation, Mineo, Department of Agricultural
Econometrics, University of New England, Armidale.
Coelli, T.J. (1995). Recent developments in frontier modeling and efficiency measurement.
Australian Journal of Agricultural Economics, 3(39):219-245.
Coelli, T, J.; Rahman, S. and Thirtle, C. (2002). Technical, Allocative, Cost and Scale
Efficiencies in Bangladesh rice cultivation: A non-parametric approach. Journal of
Agricultural Economics, 53:607-626.
Earfan Ali, K. M. and Samad, Q. A. (2013). Resource use efficiency in farming: An application
of stochastic frontier production function. Journal of Agricultural Economics and
Development Vol. 2(5), 194 - 202
Farrell, M.J. (1957). The Measurement of Productive Efficiency, Journal of the Royal Statistical
Society, ACXX(3),253-290.
Heady, E.O. (1952). Economics of Agricultural Production and Resource-use. Prentice Hall,
New Jersey.
James O. Bukenya, J. O., Hyuha, T. S, Molnar, J. and Twinamasiko
, J. (2013). Efficiency of
Resource Use among Pond Fish farmers in Central Uganda: A Stochastic Frontier
Production Function Approach. Aquaculture Economics & Management Vol. 17(2):148 -
170
Kyuma, K. (2001). Ecological Sustainability of Paddy Soil-r, International Seminar on the
Appropriate use of Fertilizers in Ahmed, Freny, Liu, Kyuma and Mutert (eds.), Taiwan
R.D.C. 6th
- 14th
August, 2001.
Lau, L. and Yotopoulos, P. (1989). “The Meta-production Function Approach to
Technological Change in World Agriculture.” Journal of Development Economics
31, 241-269.
Meeusen, W. and Van Den Broeck, J. (1977). Efficiency Estimation from Cobb- Douglas
Production Function with Composed Error, International Economics Review, 18 (2): 435-
444
National Fadama Development Office, (NFDO) (2005). Poverty reduction through increased
productivity and empowerment‖ Abuja, Nigeria.
European Journal of Agricultural and Forestry Research
Vol.1, No.2, pp.1-15, December 2013
Published by European Centre for Research Training and Development UK (www.ea-journals.org)
15
Ogundari, K., Ojo, S.O. and Ajibefun, I. A. (2006). Economics of Scale and Cost Efficiency in
Small Scale Maize Production: Empirical Evidence From Nigeria, Journal of Social
Science, 13(2):131-136
Ogunjobi, O.P. (1999). Efficiency of small holder cocoa farmers in Ondo State, A Stochastic
Frontier Analysis. An Unpublished M.Sc. Thesis, F.U.T. Akure, 10-18
Okpe, I. J., Abur, C. C., Ominyi, S. O. (2012). Resource Use Efficiency and Rice Production in
Guma Local Government Area of Benue State: An Application of Stochastic Frontier
Production Function. International Review of Social Sciences and Humanities Vol. 3, (1),
108 -116
Olayide, S.O. and Heady, E.O. (1982). Introduction to Agricultural production Economics,
University of Ibadan press, Nigeria.
Russell, N.P. and Young, T. (1983). Frontier Production Function and the Measurement of
Technical Efficiency. Journal of Agricultural Economics, 34: 139-150.
Sanda, A.O. and Ayo, S.B. (1994). “Irrigation Projects on Nigerian Environment”, Project
Report, Ile-Ife, Nigeria.
Simonyan, J.B and Omolehin, R.A. (2012). Analysis of the Impact of Fadama II Project on
Beneficiary Farmers Income in Kaduna State: A Double Difference Method Approach.
International Journal of Economics and Management Sciences. 1(11)1-8
Udoh, E.J. (2006), Technical inefficiency in Vegetable Farms of Humid Regions: An Analysis
of Dry Season Farming by Urban women in South- South Zone, Nigeria. Journal of
Agriculture and Social Science. 1(2):80 – 85.
Umar, A.M. and John, P.C.L. (2012). Effects of Fadama II on Agro-Processing Among Farmers
in Adamawa State, Nigeria. International Journal of Social Science Tomorrow. 1(5), 1-6
Umoh, G. (2006), Resource Use Efficiency in Urban farming: An Application of Stochastic
frontier productions function. International Journal of Agriculture and Biology . 8(1): 38
– 44.
Upton, M. (1996). The Economics of Tropical Farming System, Cambridge University Press,
London. P.248
Xu, X. and Jeffrey, S.R. (1998). Efficiency and Technical Progress in Traditional and Modern
Agriculture, Evidence from Rice Production in China. Agricultural Economics, 18: 157-
165