stratospheric connection to northern hemisphere wintertime ... · ica, northern europe, and eastern...
TRANSCRIPT

1
1. Introduction
Tropospheric predictability on timescales beyond the1-2 week limit of deterministic weather prediction istypically viewed as residing in patterns of variability ofthe coupled-ocean atmosphere system and in the Mad-den-Julian Oscillation. There are recent indications thatextended tropospheric predictability may also derivefrom the dynamical coupling between the stratosphericand tropospheric circulations.
Variability in the circulation of the stratosphere ischaracterized by timescales considerably longer thanthose observed in the troposphere. This longer timescalereflects the differing dynamical processes that perturbthe circulation about its mean state. Whereas the extrat-ropical tropospheric circulation is continually disturbedby rapidly evolving baroclinic waves, variations in thecirculation of the stratosphere are driven largely by rela-tively slower interactions between the zonal flow andplanetary-scale waves dispersing upward from the tro-
posphere.The most striking example of wave-driven, low-fre-
quency variability in the stratosphere is the equatorialquasi-biennial oscillation (QBO; Reed et al. 1961; Bald-win et al. 2001), a quasi-periodic variation in the direc-tion of the zonal flow in the equatorial stratosphere witha mean period of ~27 months. In Northern Hemisphere(NH) high latitudes, variability of the stratosphere isdominated by the episodic weakening and strengtheningof the westerly polar vortex that occurs on timescales ofweeks to months during the winter season, in associa-tion with vacillation cycles (Holton and Mass 1976;Yoden 1990; Scott and Haynes 1998). The decelerationof the vortex is driven mainly by planetary wave break-ing, while the acceleration is driven primarily by relax-ation toward radiative equilibrium.
The low-frequency variability that characterizes thecirculation of the stratosphere has relevance for weatherprediction only to the extent that the circulation of thestratosphere impacts the circulation of the troposphere.
Stratospheric Connection to Northern Hemisphere Wintertime Weather:Implications for Prediction*
DAVID W. J. THOMPSONDepartment of Atmospheric Science, Colorado State University, Ft. Collins, CO, USA
MARK P. BALDWINNorthwest Research Associates Inc., Bellevue, WA, USA
JOHN M. WALLACEDepartment of Atmospheric Sciences, University of Washington, Seattle, WA, USA
( *Submitted to Journal of Climate August 2001; Accepted December 2001)
ABSTRACT
The dynamical coupling between the stratospheric and tropospheric circulations yields a statistically significantlevel of potential predictability for extreme cold events throughout much of the Northern Hemisphere (NH) mid-highlatitudes on both month-to-month and winter-to-winter timescales. Pronounced weakenings of the NH wintertimestratospheric polar vortex tend to be followed by episodes of anomalously low surface air temperatures and increasedfrequency of occurrence of extreme cold events throughout densely populated regions such as eastern North Amer-ica, northern Europe, and eastern Asia that persist for ~2 months. Strengthenings of the vortex tend to be followed bysurface temperature anomalies in the opposite sense. During mid-winter, the quasi-biennial oscillation (QBO) in theequatorial stratosphere has a similar but somewhat weaker impact on NH weather, presumably through its impact onthe strength and stability of the stratospheric polar vortex: i.e., the easterly phase of the QBO favors an increasedincidence of extreme cold events, and vice versa. The signature of the QBO in NH wintertime temperatures isroughly comparable in amplitude to that observed in relation to the El-Niño/Southern Oscillation phenomenon.
2
This impact could occur directly through the mecha-nisms described in Haynes et al. (1991), Hartley et al.(1998), and Black (2002). In this case, anomalousmomentum forcing in the extratropical circulationinduces a deep, thermally indirect mean meridional cir-culation below the level of the forcing that acts to trans-port momentum downwards. It is also possible that thecirculation of the stratosphere impacts the circulation ofthe troposphere indirectly through its effect on therefraction of planetary waves dispersing upwards fromthe troposphere. As discussed in Hartmann et al. (2000)and Shindell et al. (2001), anomalous westerly flow inthe extratropical stratosphere favors increased equator-ward propagation (and hence an anomalous polewardflux of westerly momentum) in the upper troposphere/lower stratosphere, and vice versa.
Anecdotal evidence of the stratosphere’s impact onthe troposphere can be traced back to Quiroz (1977),
who noted that the anticyclonic circulation anomaliesassociated with the sudden stratospheric warming ofJanuary, 1977 descended all the way down to the earth’ssurface. More recently, Baldwin and Dunkerton (1999;2001) found that a statistically significant tendency for“downward propagation” of extra-tropical zonal windanomalies of both signs is evident throughout the histor-ical record. Large amplitude anomalies in the strength ofthe NH wintertime stratospheric polar vortex frequentlyprecede anomalies of the same sign in the troposphereby 1-2 weeks (Baldwin and Dunkerton 1999), and thetropospheric anomalies tend to persist as long as theanomalies in the intensity of the stratospheric polar vor-tex, about 60 days (Baldwin and Dunkerton 2001). Thesurface signature of the stratospheric anomalies stronglyresembles the surface signature of the NH annular mode(NAM), a planetary scale pattern of climate variabilitycharacterized by an out of phase relationship or seesaw
TABLE 1. Winters corresponding to warm and cold episodes of the ENSO cycle, as defined as the eightwarmest and eight coldest January-March mean sea surface temperature anomalies in the equatorial Pacific“cold tongue region” (6°S-6°N, 180°W-90°W) from 1958-1999.
Years
Warm ENSO winters 1958, 1966, 1973, 1977, 1983, 1987, 1992, 1998
Cold ENSO winters 1968, 1971, 1974, 1976, 1984, 1985, 1989, 1996
1958 1959 1960 1961 1962 1963 1964 1965 1966 1967 1968 1969
1969 1970 1971 1972 1973 1974 1975 1976 1977 1978 1979 1980
1980 1981 1982 1983 1984 1985 1986 1987 1988 1989 1990 1991
1991 1992 1993 1994 1995 1996 1997 1998 1999 2000
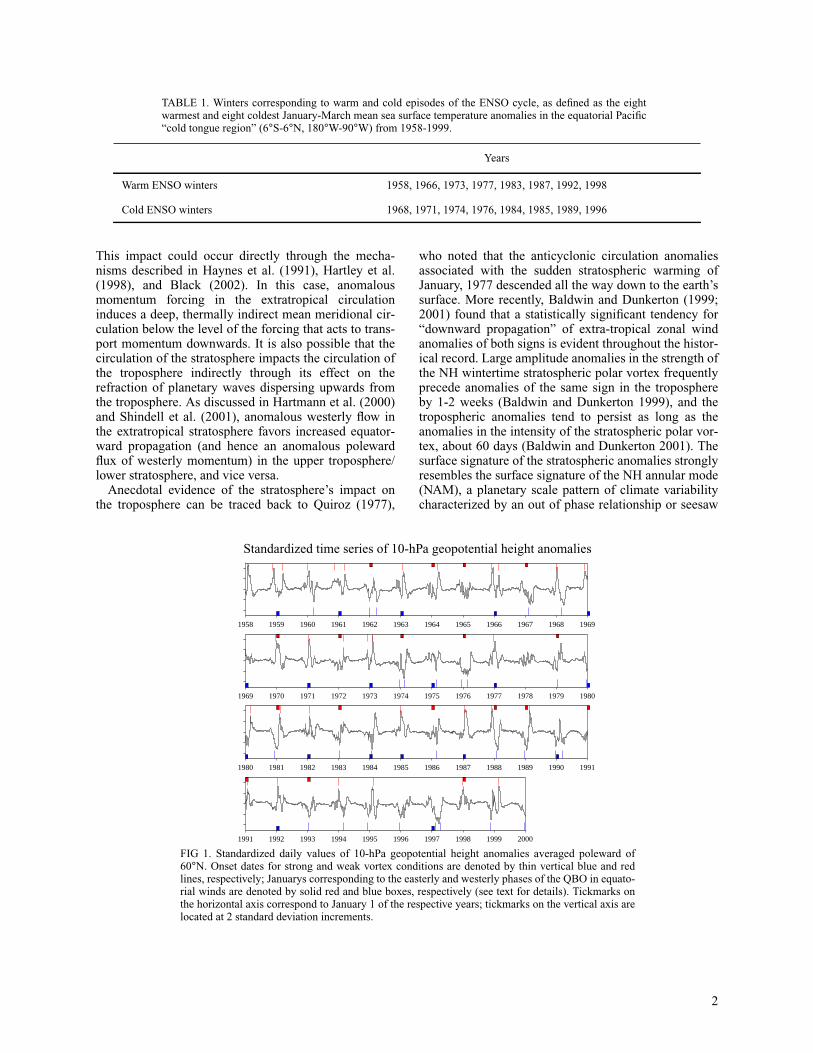
Standardized time series of 10-hPa geopotential height anomalies
FIG 1. Standardized daily values of 10-hPa geopotential height anomalies averaged poleward of60°N. Onset dates for strong and weak vortex conditions are denoted by thin vertical blue and redlines, respectively; Januarys corresponding to the easterly and westerly phases of the QBO in equato-rial winds are denoted by solid red and blue boxes, respectively (see text for details). Tickmarks onthe horizontal axis correspond to January 1 of the respective years; tickmarks on the vertical axis arelocated at 2 standard deviation increments.

3
in the strength of the zonal flow along ~55° N and 35° N(Namias 1950; Thompson and Wallace 2000), a.k.a., theArctic Oscillation (Thompson and Wallace 1998) andthe North Atlantic Oscillation (Walker and Bliss 1932;van Loon and Rogers 1978; Hurrell 1995). The highindex polarity of the NAM is characterized by low sea-level pressure over the pole and anomalously strongwesterlies along ~55° N. Baldwin and Dunkerton (2001)showed that weakenings of the polar vortex tend to befollowed by extended periods in which the NAM isbiased toward its low index polarity (high sea-level pres-sure over the pole), and vice versa.
Sea-level pressure anomalies consistent with the sur-face signature of the NAM emerge in composites basedon the opposing polarities of the QBO in the equatorialstratosphere (Ebdon 1975; Holton and Tan 1980; Bald-win et al. 2001), and time series of the NAM and theQBO exhibit statistically significant coherence on ~27month timescales (Coughlin and Tung 2001). Presum-ably, this linkage reflects the impact of the QBO on theintensity and stability of the NH wintertime strato-spheric polar vortex (Holton and Tan 1980). Planetarywaves originating in the troposphere are more likely tointeract with, and hence weaken, the stratospheric polarvortex when the westerly wave guide is confined to theNH extratropics as is the case during the easterly phaseof the QBO, than when its extends across the equatorinto the SH as it does during the westerly phase of theQBO (Holton and Tan 1980). Hence, the easterly phaseof the QBO favors a weaker stratospheric polar vortexand - through the linkages observed in Baldwin inDunkerton (2001) - anomalies in the tropospheric circu-lation characteristic of the low index polarity of theNAM, and vice versa.
Fluctuations in the surface signature of the NAM, inturn, impact the mean temperature and the frequency ofoccurrence of extreme cold events throughout the NH:low index conditions are marked by below normal meansurface air temperatures (Hurrell 1995; Hurrell and vanLoon 1997) and an enhanced frequency of occurrence ofextreme cold events (Thompson and Wallace 2001)throughout much of North America, Europe, and Asia;high index conditions are marked by anomalies in theopposite sense.
The observed linkages between low-frequency vari-ability in the stratosphere and the circulation of the tro-posphere are clearly of theoretical interest, but itremains to be determined to what extent they are ofpractical use for weather forecasting. Here we gaugetheir usefulness by assessing the potential predictabilityof wintertime mean temperatures and the frequency ofoccurrence of extreme cold events throughout the NHthat derives from the influence of the stratospheric circu-lation upon the surface signature of the NAM. To pro-vide a benchmark for our findings, we compare theresults with corresponding statistics pertaining to the El-Niño/Southern Oscillation (ENSO) phenomenon.
2. Analysis
This study is based on 42 years (1958-1999) of 4times daily data from the NCEP/NCAR Reanalysis(Kalnay et al. 1996; obtained from the NOAA ClimateDiagnostics Center) supplemented with daily stationdata over the United States and Japan (obtained from theNOAA National Climate Data Center).
The potential predictability that derives from thedownward propagation of long-lived zonal wind anoma-lies is assessed by comparing the mean daily surface airtemperature and the frequency of occurrence of extremecold events during the 60-day interval following theonset dates of weak and strong vortex conditions in thestratosphere (defined in accordance with the results ofBaldwin and Dunkerton 2001). Cold events are definedas days on which daily minimum temperature dropsmore than 1.5 standard deviations (rounded up to thenearest degree Celsius) below the January-March (JFM)mean. The onset dates of weak and strong vortex condi-tions in the stratosphere are defined as days when dailyvalues of 10-hPa geopotential height poleward of 60°Nstandardized about the January-March climatologycross the +2 (weak vortex) and -2 (strong vortex) stan-dard deviation thresholds, respectively. The resultingtime series (Fig. 1) is dominated by low frequency vacil-lations during the NH winter in which anomalies of thesame sign typically persist for several weeks, consistentwith the discussion in the previous section. Note that theonset dates of weak and strong vortex conditions(denoted by thin vertical lines in Fig. 1) can be definedin real-time: they do not depend on how long the strato-spheric anomalies persists. If two onset dates occurwithin 60-days of one another, only the first date is usedin the analysis. The analysis is based on all days of thecalendar year, but since the thresholds are based on theJanuary-March climatology, all of the extreme coldevents and onset dates occur during the winter season. Atotal of 31 strong onset dates and 28 weak onset dateswere used in the analysis, which corresponds to a totalsample size of (31+28) x 60=3540 days.
The potential predictability of NH surface air temper-ature anomalies that derives from the linkage with theQBO is assessed by repeating the above analysis using,as a basis for the compositing, winters corresponding tothe opposing phases of the QBO (as indicated in Fig. 1).Winters corresponding to the easterly phase are definedas those in which the monthly-mean 50-hPa zonal-meanzonal winds at the equator in the NCEP/NCAR Reanal-ysis are easterly in all four NH winter months Decem-ber-March, and vice versa. Winters during which the50-hPa zonal winds at the equator change sign areunclassified. The analysis is not sensitive to the specificlevel chosen for defining the phase of the QBO; e.g.,qualitatively similar results were obtained for QBOindices based on 40-hPa zonal winds from the NCEP/NCAR Reanalysis, and for 30-hPa zonal winds based onstation data (Marquardt and Naujokat 1997). A total of17 winters were found to correspond to the easterly and

4
westerly phases of the QBO, respectively (Fig. 1).The predictability that derives from the ENSO phe-
nomenon is assessed by repeating the analysis that wasperformed for the QBO, but for composites based on
warm versus cold years of the ENSO cycle, as definedby the eight warmest and eight coldest JFM-mean seasurface temperature (SST) anomalies in the equatorialPacific “cold tongue region” (6°S-6°N, 180°W-90°W).
TABLE 2. Frequency of occurrence of extreme cold events (days in which daily minimum temperature drops below 1.5 standard devia-tions below the JFM mean) during the 60-day interval (days +1-60) following the onset of weak and strong vortex conditions at 10-hPaand between Januarys when the QBO is easterly and westerly. The samples are indicated in Fig. 1. Individual results not exceeding the95% confidence level are italicized.
-1.5 std. temperature threshold Total Weak vortex:days +1-60
Strong vortex:days +1-60
QBO:easterly
QBO:westerly
< -17° C in Juneau, Ak. 334 104 66 96 61
< -18° C in Chicago, Il. 411 149 67 115 81
< -6° C in Atlanta, Ga. 416 149 73 90 56
< -10° C in Washington, D. C. 392 153 77 96 66
< -9° C New York, NY. 403 164 99 89 69
< 1° C in London, UK 442 157 77 85 29
< -3° C in Paris, Fr. 446 148 68 98 48
<-9° C in Stockholm, Sw. 348 154 54 56 23
<-9° C in Berlin, Ger. 450 142 77 107 60
< -22° C in St. Petersburg, Ru. 381 137 46 74 46
< -20° C in Moscow, Ru. 472 152 80 90 84
< -29° C in Novosibirsk, Ru. 480 155 69 67 58
< -4° C in Shanghai, China 471 170 84 107 92
< -1° C in Tokyo, Japan 328 130 60 92 58
Days 1-60 followingstratospheric anomalies QBO easterly-westerly ENSO (warm-cold)
FIG 2. The difference in daily mean surface temperature anomalies between the 60-day intervalfollowing the onset of weak and strong vortex conditions at 10-hPa (left panel); between Janu-arys when the QBO is easterly and westerly (middle panel); and between winters (January-March) corresponding to the warm and cold episodes of the ENSO cycle (right panel). Thesamples used in the analysis are documented in Fig. 1. Contour levels are at 0.5 C.

5
The corresponding JFM mean SST thresholds for theWarm and Cold phase composites are +0.75 K and -0.37K, respectively. The years included in the Warm andCold composites are indicated in Table 1. The SSTanomalies that were used as a basis for selecting theyears are based on the Comprehensive Ocean-Atmo-sphere Data Set (COADS; Woodruff et al. 1987).
3. Results
The difference between the surface temperatureanomalies averaged over the 60-day period followingthe onset of weak and strong vortex conditions (Fig. 2,left) are largely consistent with the pattern of surfacetemperature anomalies associated with the surface sig-nature of the annular mode (Hurrell 1995; Thompsonand Wallace 2001): most of the mid-high latitude landmasses tend to be anomalously cold following the onsetof weak stratospheric polar vortex conditions whileextreme eastern Canada and North Africa are anoma-lously warm (the pattern would be entirely consistentwith the surface signature of the NAM if eastern Siberiaand Alaska were of the opposite sign). Heavily popu-lated regions such as eastern North America, northernEurope, and eastern Asia are ~1-2 K colder followingthe onset of weak vortex conditions than following theonset of strong vortex conditions. The 60-day intervalfollowing the onset of weak vortex conditions is charac-terized by a higher frequency of occurrence of extreme
low temperatures in most large cities that lie in NH mid-latitudes, with typical ratios of ~2:1 found across NorthAmerica to the east of the Rocky Mountains, andthroughout northern Europe and Asia (Table 2, columns3-4).
We define a simple daily index that characterizes theseverity of winter temperatures at a given station byrelating daily minimum temperature to the January-March (JFM) climatological mean daily minimum tem-perature using the relation:
where wsi(x, t) are the daily 'winter severity index' val-
ues for station x at time t and is the daily minimumtemperature standardized about the JFM climatology.The resulting index is affected only by extreme coldevents and weights the most extreme ones dispropor-tionately heavily. Since it is calculated relative the localJFM mean and JFM standard deviation, the wsi exhibitsa strong seasonality with peak values in mid-winter, andits amplitude does not vary strongly with location. Asingle index indicative of the severity of winter condi-tions at major cities throughout the hemisphere (hereaf-ter WSI(t)) can be defined by averaging wsi(x,t)calculated for all the stations listed in Table 2. WSI val-
wsi x t,( ) T '2 for T ' 2–<=
wsi x t,( ) 0 for T ' 2–≥=
T '
Dec 1 Jan 1 Feb 1 March 1 Dec 1 Jan 1 Feb 1 March 1
Weak vortex
Strong vortex
Win
ter
Seve
rity
Ind
ex
FIG 3. Daily values of the winter-severity index (WSI; as defined in the text) are composited as afunction of calendar day for the 60-day interval following the onset of strong and weak vortex con-ditions at 10-hPa (bars; the climatological WSI is indicated by the parabolic curve). The bottompanels indicate the sample size available for each calendar date. Days when the sample size is lessthan 5 were not included in the composite. Vertical tickmarks are 0.5 for the WSI and 5 for thesample size. The WSI is scaled such that a value of 1 corresponds to the maximum climatologicalvalue.
6
ues composited as a function of calendar date for the 60-day interval following the onset of weak vortex condi-tions in the stratosphere clearly exceed those for the 60-day interval following the onset of strong vortex condi-tions throughout much of the NH winter (Fig. 3).
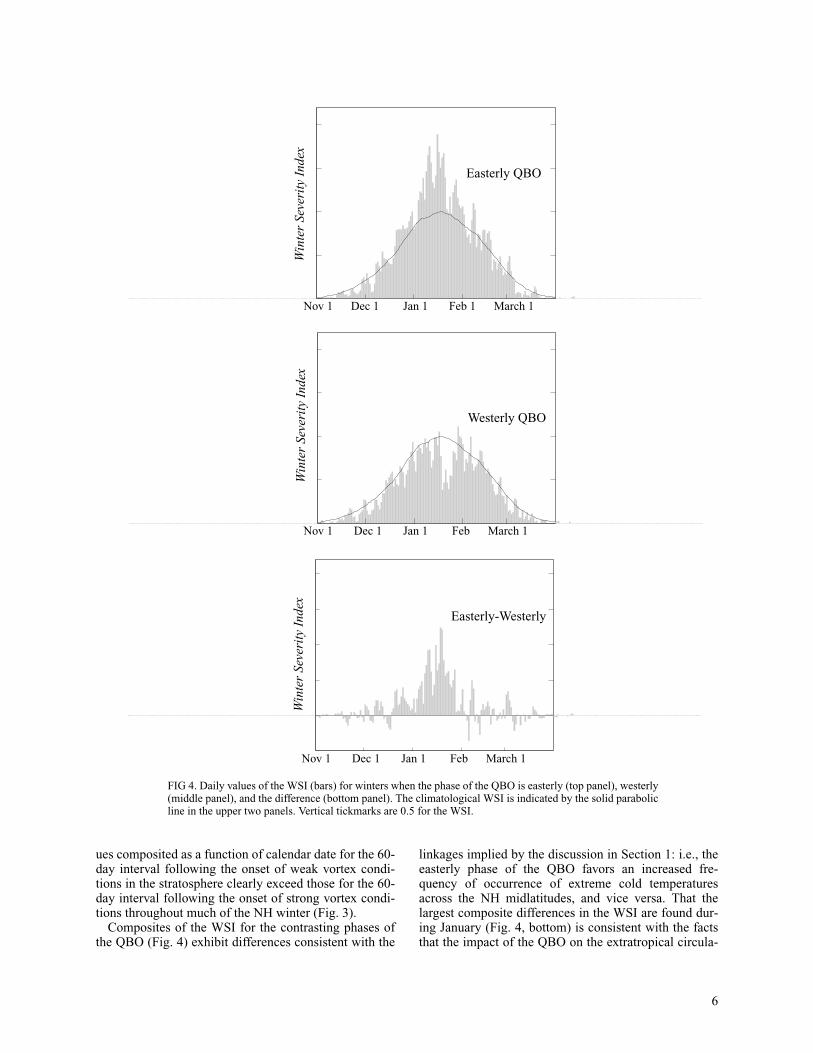
Composites of the WSI for the contrasting phases ofthe QBO (Fig. 4) exhibit differences consistent with the
linkages implied by the discussion in Section 1: i.e., theeasterly phase of the QBO favors an increased fre-quency of occurrence of extreme cold temperaturesacross the NH midlatitudes, and vice versa. That thelargest composite differences in the WSI are found dur-ing January (Fig. 4, bottom) is consistent with the factsthat the impact of the QBO on the extratropical circula-
Nov 1 Dec 1 Jan 1 Feb March 1
Easterly QBO
Westerly QBO
Nov 1 Dec 1 Jan 1 Feb 1 March 1
Nov 1 Dec 1 Jan 1 Feb March 1
Easterly-Westerly
Win
ter
Seve
rity
Ind
exW
inte
r Se
veri
ty I
ndex
Win
ter
Seve
rity
Ind
ex
FIG 4. Daily values of the WSI (bars) for winters when the phase of the QBO is easterly (top panel), westerly(middle panel), and the difference (bottom panel). The climatological WSI is indicated by the solid parabolicline in the upper two panels. Vertical tickmarks are 0.5 for the WSI.

7
tion is largest during early winter (e.g., Baldwin andDunkerton 1998), and that tropospheric anomalies tendto lag those in the stratosphere by ~2 weeks (Baldwinand Dunkerton 1999, 2001). The difference in dailymean temperature between Januarys when the QBO iseasterly and westerly (Fig. 2, middle) resembles the sig-nature of the NAM in surface temperature. The mean ofthe anomalies poleward of 40° N in the middle panel ofFig. 2 (-0.5 K) is ~1/3 of that in the composite derivedfrom the onset of anomalies in the strength of the strato-spheric polar vortex (-1.5 K). The corresponding ratiosin the frequency of occurrence of extreme cold events atmajor cities between the contrasting polarities of theQBO (Table 2, columns 5-6) are also weaker than thosebased on the onset of anomalies in the strength of thestratospheric polar vortex, but they are nevertheless ofthe expected sign in all cases.
The results in Figs. 2-4 and Table 2 exhibit a highlevel of statistical significance. The difference in meantemperatures poleward of 40° N (Fig. 2, left panel), win-tertime values of the WSI index (Figs. 3-4), and the dif-ferences in the frequency of occurrence of extremeevents at individual stations in Table 2 can be replicatedless than 5% of the time in 104 randomized sortings ofthe data (with the exceptions noted in Table 2). The sort-ings are generated by randomizing the order of the yearsin the analysis, but not the days within each calendaryear, hence preserving the autocorrelation characteris-tics of the data. The cumulative significance of theresults in Table 2 is even higher: the likelihood that allstations in Table 2 would exhibit differences of theobserved amplitude and expected sign by chance is lessthan 1 in 104 for both the 60-day intervals following theonset of weak and strong vortex events and the opposingpolarities of the QBO.
4. Comparison with results for ENSO
The results in this section document the impact ofENSO on wintertime mean temperatures and the fre-quency of occurrence of extreme cold events at selectlocations over the NH. The results are not meant to con-stitute a comprehensive review of the impacts of ENSO
on NH wintertime weather. They are presented simplyto provide a benchmark for the results presented in theprevious section.
Figure 2 (right panel) shows the composite differencein daily mean temperature between winters (January-March) corresponding to warm and cold episodes of theENSO cycle (as defined in Section 2). Consistent withprevious results (e.g., Ropelewski and Halpert 1986),the warm phase of the ENSO cycle favors anomalouslywarm wintertime mean conditions over much of north-ern North America, and anomalously cold wintertimemean conditions over the southeastern United States.The composites also suggest that warm episodes of theENSO cycle are characterized by anomalously warmmean temperatures across central Eurasia and cold tem-peratures over northern Eurasia.
The relative frequencies of occurrence of extremecold events during the opposing phases of the ENSOcycle are shown in Table 3 for a selection of locationsover North America. Winters corresponding to the warmphase of the ENSO cycle are marked by a decreasedincidence of extreme cold events throughout much ofnorthern North America, including regions in the south-central United States where the associated wintertimemean conditions are anomalously cold. The decreasedincidence of cold events over the United States duringthe warm phase of ENSO is consistent with thedecreased frequency of occurrence of blocking eventsover Alaska (Renwick and Wallace 1996), which areassociated with cold air outbreaks downstream (Namias1950). The inverse relationship between the frequencyof occurrence of cold events over the south-centralUnited States and the corresponding wintertime meantemperature anomalies exemplifies the importance ofassessing the impacts of climate phenomenon on notonly the mean climate, but on the frequency of occur-rence of extreme events as well. A more thorough treat-ment of the impact of ENSO on the incidence ofextreme cold events is beyond the scope of this paper.
The samples used to assess the impact of the QBOand ENSO on NH wintertime climate have differentcharacteristics: the QBO sample includes 34 winter sea-sons, but only January days; the ENSO sample includesall days during January-March, but only 16 winter sea-
TABLE 3. As in Table 2, but for winter seasons (January-March) corresponding to warmand cold episodes of the ENSO cycle (see text for details), and for locations where theimpact of ENSO on surface temperatures is relatively strong (e.g., Ropelewski and Halpert1986).
Total Warm Cold
< -17° C in Juneau, Ak. 334 32 60
< -24° C in Bozeman, Mt. 448 26 63
< -4° C in Dallas, Tx. 416 39 65
< -9° C in Tulsa, OK. 464 35 75

8
sons. Additionally, the stations analyzed in the QBOsamples are intended to be representative of major citiesthroughout the NH middle and high latitudes, whereasthose analyzed in the ENSO samples were selected torepresent regions in which the impacts of ENSO areknown to be strong. Hence, it is difficult to make a directquantitative comparison between the impact of thesetwo phenomena. Nevertheless, a qualitative comparisonof the results based on the QBO and ENSO suggests thatfor the affected times of year over North America, theirimpacts are roughly comparable: the differences in thefrequency of occurrence of extreme cold events betweenthe easterly and westerly phases of the QBO are similarto those observed during the opposing phases of theENSO cycle (Tables 2-3), as are the scale and amplitudeof the corresponding differences in mean temperature(Fig. 2, middle and right panels).
5. Concluding remarks
The findings in this study suggest that low frequencyvariability in the stratospheric circulation impacts NHwintertime weather on both month-to-month and winter-to-winter timescales. In order to exploit this skill,numerical weather prediction models must have reason-able representations of the relevant stratospheric dynam-ics. The observed linkage between the QBO and thestrength and stability of the NH stratospheric polar vor-tex has been simulated in numerous modeling studies(e.g., Dameris and Ebel 1990; O’Sullivan and Salby1990; Holton and Austin 1991; Hamilton 1998; Niwanoand Takahashi 1998). As noted in the introduction, thislinkage is entirely consistent with northward displace-ment of the critical latitude for Rossby wave breakingduring the easterly phase of the QBO, and vice versa.The observed downward propagation of anomalies inthe NH polar vortex has also been simulated in numeri-cal studies (Christiansen 2001). The dynamics of thislinkage are still under investigation, but they most likelyreflect the impact of anomalies in the strength of thelower stratospheric polar vortex on the poleward eddyfluxes of zonal momentum in the upper troposphere, andthe induced mean meridional circulations that extend allthe way down to the earth’s surface.
To what extent do the results for days 1-60 followingthe onset dates of weak and strong conditions in thestratospheric polar vortex reflect predictability beyondthe ~10 day limit of deterministic weather prediction?To address this question we restricted the analysis inTable 2 and Figures 2-3 to days 11-60 following therespective onset dates. In all cases, the significance ofthe results was unaffected. In several cases, the skill wasfound to improve slightly (~10%), consistent with the 1-2 week time lag between large amplitude anomalies inthe strength of the stratospheric polar vortex and the cir-culation of the troposphere (Baldwin and Dunkerton1999). We also tested to what extent recent trends in sur-face temperatures might bias the results in Tables 2-3 byrepeating the analyses with detrended data. Again, in all
cases, the significance of the results was unaffected.We estimated the potential predictability that derives
from the downward propagation of zonal wind anoma-lies using an index indicative of the strength of the NHpolar vortex at 10-hPa, which corresponds to the highestlevel available in the NCEP/NCAR Reanalysis. Sincevacillation cycles in the stratosphere often originateequatorward of the polar vortex at levels above 10-hPa(e.g., Kodera 1995; Scott and Haynes 1998), it is possi-ble that results based on higher levels will yield an evenlonger lead time with respect to weather at the surface.Hence, making use of stratospheric data from theAdvanced Microwave Sounding Unit (AMSU), it mightbe possible to make an earlier and more definitive deter-mination of the major swings in the stratospheric polarvortex.
It would be interesting to test the extent to whichstate-of-the-art numerical models are capable of exploit-ing both the impact of the QBO on the polar vortex andthe downward propagation of stratospheric zonal windanomalies for making real-time forecasts.
Acknowledgments. We would like to thank R. X.Black and three anonymous reviewers for their helpfulcomments and suggestions. DWJT was supported byfunding provided through Colorado State University;MPB was supported by NOAA Office of Global Pro-grams, the SR&T Program for Geospace Science(NASA), and the National Science Foundation; JMWwas supported by the National Science Foundationunder Grant 9707069.
REFERENCES
Baldwin, M. P. and T. J. Dunkerton, 1998: Quasi-biennial modula-tion of the Southern Hemisphere stratospheric polar vortex.Geophys. Res. Lett., 25, 3343-3346.
Baldwin, M. P., and T. J. Dunkerton, 1999: Propagation of theArctic Oscillation from the stratosphere to the troposphere. J.Geophys. Res., 104, 30 937-30 946.
Baldwin, M. P. et al., 2001: The Quasi-Biennial Oscillation. Rev.Geophys., 39, 179-229.
Baldwin, M. P., and T. J. Dunkerton 2001: Stratospheric harbin-gers of anomalous weather regimes. Science, submitted.
Black, R. X., 2002: Stratospheric forcing of surface climate in theArctic Oscillation. J. Climate, in press.
Christiansen, B., 2001: Downward propagation from the strato-sphere to the troposphere: Model and reanalysis. J. Geophys.Res., in press.
Coughlin, K., and K. -K. Tung, 2001: QBO Signal found at theExtratropical Surface through Northern Annular Modes.Geophys. Res. Lett., in press.
Dameris, M., and A. Ebel, 1990: The Quasi-Biennial Oscillationand major stratospheric warmings: A three-dimensionalmodel study. Ann. Geophys., 8, 79-85.
Ebdon, R. A., 1975: Quasi-biennial oscillation and its associationwith tropospheric circulation patterns. Met. Mag., 104, 282-297.
Hamilton, K., 1998: Effects of an imposed quasi-biennial oscilla-tion in a comprehensive troposphere-stratosphere-mesos-phere general circulation mode. J. Atmos. Sci., 55, 2393-2418.

9
Hartmann, D. L., J. M. Wallace, V. Limpasuvan, D. W. J. Thomp-son, and J. R. Holton, 2000: Can Ozone Depletion andGreenhouse Warming Interact to Produce Rapid ClimateChange? Proc. Nat. Acad. Sci., 97, 1412-1417.
Hartley, D. E., J. Villarin, R. X. Black, and C. A. Davis, 1998: Anew perspective on the dynamical link between the strato-sphere and troposphere. Nature, 391, 471-474.
Haynes, P. H., C. J. Marks, M. E. McIntyre, T. G. Shepherd, K. P.Shine, 1991: On the “downward control” of extratropicaldiabatic circulations by eddy-induced mean zonal forces. J.Atmos. Sci., 48, 651-678.
Holton, J. R., and C. Mass, 1976: Stratospheric vacillation cycles.J. Atmos. Sci., 33, 2218-2225.
Holton, J. R., and H. -C. Tan, 1980: The influence of the equato-rial quasi-biennial oscillation on the global circulation at 50mb. J. Atmos. Sci., 37, 2200-2208.
Holton, J. R. and J. Austin 1991: The influence of the QBO onsudden stratospheric warmings. J. Atmos. Sci., 48, 607-618.
Hurrell, J. W., 1995: Decadal trends in the North Atlantic Oscilla-tion region temperatures and precipitation. Science, 269,676-679.
Hurrell, J. W., and H. van Loon, 1997: Decadal variations in cli-mate associated with the North Atlantic Oscillation. ClimaticChange, 36, 301-326.
Kalnay, E. M., and Coauthors, 1996: The NCEP/NCAR Reanaly-sis Project. Bull. Amer. Meteor. Soc., 77, 437-471.
Kodera, K., 1995: On the origin and nature of the interannual vari-ability of the winter stratospheric circulation in the NorthernHemisphere. J. Geophys. Res. 100, 14077-14087.
Marquardt, C., and B. Naujokat, 1997: An update of the equatorialQBO and its variability. 1st SPARC Gen. Assembly, Mel-bourne Australia, WMO/TD-No. 814, 1, 87-90.
Namias, J., 1950: The index cycle and its role in the general circu-lation. J. Meteorol., 7, 130-139.
Niwano, M. and M. Takahashi, 1998: The influence of the equato-rial QBO on the Northern Hemisphere winter circulation of aGCM. Notes and correspondence: J. Met. Soc. Japan, 76,453-461.
O’Sullivan, D., and M. L. Salby, 1990: Coupling of the quasi-biennial oscillation and the extratropical circulation in thestratosphere through planetary wave transport. J. Atmos. Sci.,47, 650-673.
Quiroz, R. S., 1977: Tropospheric-stratospheric polar vortexbreakdown of January 1977. Geophys. Res. Lett., 4, 151-154.
Reed, R. J., W. J. Campbell, L. A. Rasmussen, and R. G. Rogers,1961: Evidence of downward propagating annual windreversal in the equatorial stratosphere. J. Geophys. Res., 66,813-818.
Renwick, James A., John M. Wallace, 1996: Relationshipsbetween North Pacific Wintertime Blocking, El Niño, andthe PNA Pattern. Mon. Wea. Rev., 124, 2071-2076.
Ropelewski, C.F., M.S. Halpert, 1986: North American Precipita-tion and Temperature Patterns Associated with the El-Niño/Southern Oscillation (ENSO). Mon. Wea. Rev., 114, 2352-2362.
Scott, R. K., and P. H. Haynes, 1998: Internal interannual variabil-ity of the extratropical stratospheric circulation: the low-lati-tude flywheel. Quart. J. Royal Met. Soc., 124, 2149-2173
Shindell, D.T., G.A. Schmidt, R.L. Miller, and D. Rind, 2001:Northern Hemisphere winter climate response to greenhousegas, ozone, solar, and volcanic forcing. J. Geophys. Res.,106, 7193-7210.
Thompson, D. W. J, and J. M. Wallace, 1998: The Arctic Oscilla-tion signature in the wintertime geopotential height and tem-perature fields. Geophys. Res. Lett., 25, 1297-1300.
Thompson, D. W. J., and J. M. Wallace, 2000: Annular modes inthe extratropical circulation. Part I: Month-to-month vari-ability. J. Climate, 13, 1000-1016.
Thompson, D. W. J., and J. M. Wallace, 2001: Regional climateimpacts of the Northern Hemisphere annular mode. Science,293, 85-89.
van Loon, H., and J. Rogers, 1978: Seesaw in winter temperaturesbetween Greenland and northern Europe, Pt. 1, Generaldescription. Mon. Wea. Rev., 106, 1978.
Yoden, S., 1990: An illustrative model of seasonal and interannualvariations of the stratospheric circulation. J. Atmos. Sci., 47,1845-1853.
Walker, G. T. and E. W. Bliss, 1932: World Weather V. Mem. R.Meteorol. Soc., 4, 53-83.
Woodruff, S. D., R. J. Slutz, R. L. Jenne, and P. M. Steurer, 1987:A comprehensive ocean-atmosphere data set. Bull. Amer.Meteor. Soc., 68, 1239-1250.