student mobility: causes, consequences, and solutions
TRANSCRIPT

STUDENT MOBILITY
CAUSES, CONSEQUENCES, AND SOLUTIONS
Russell W. Rumberger University of California, Santa Barbara
June 2015
National Education Policy Center
School of Education, University of Colorado Boulder Boulder, CO 80309-0249
Telephone: (802) 383-0058 Email: [email protected] http://nepc.colorado.edu
This is one of a series of briefs made possible in part by funding from The Great Lakes Center for Education Research and Practice.
http://www.greatlakescenter.org

http://nepc.colorado.edu/publication
Kevin Welner Project Director
Patricia H. Hinchey Academic Editor
William Mathis Managing Director
Erik Gunn Managing Editor
Briefs published by the National Education Policy Center (NEPC) are blind peer-reviewed by members of the Editorial Review Board. Visit http://nepc.colorado.edu to find all of these briefs. For information on the editorial board and its members, visit: http://nepc.colorado.edu/editorial-board.
Publishing Director: Alex Molnar
Suggested Citation:
Rumberger, Russell W. (2015). Student Mobility: Causes, Consequences, and Solutions. Boulder, CO: National Education Policy Center. Retrieved [date] from http://nepc.colorado.edu/publication/student-mobility.
This material is provided free of cost to NEPC's readers, who may make non-commercial use of the material as long as NEPC and its author(s) are credited as the source. For inquiries about commercial use, please contact NEPC at [email protected].

STUDENT MOBILITY: CAUSES, CONSEQUENCES, AND SOLUTIONS Russell W. Rumberger, University of California, Santa Barbara
Executive Summary
Student mobility is a widespread and often unheralded problem facing American schools. The majority of elementary and secondary school children make at least one non-promotional school change over their educational careers, with many children making multiple moves. They do so for a variety of reasons. School changes are most often initiated by families and frequently involve a change of residences due to reasons that are either voluntary (for example, changing jobs or moving to a better home) or involuntary (for example, getting evicted or having a family disruption such as a divorce). But schools can also initiate school changes, such as when students are expelled or when schools are closed.
The research literature suggests that changing schools can harm normal child and adolescent development by disrupting relationships with peers and teachers as well as altering a student’s educational program. The most consistent and severe impacts are on test scores and high school graduation, with less consistent findings on student behavior. The gravest harms follow from multiple moves and those accompanied by disruptions in the home.
Because causes and consequences are varied and complex, recommendations for addressing the issue must be adaptable and applicable to the unique sets of circumstances. School procedures should focus on reducing unnecessary mobility and on making the mobility experience, when necessary, as positive as possible. The following recommendations concern all relevant stakeholders: students and parents, school officials, and policymakers.
Recommendations
• School officials should strive to reduce mobility by improving the overall quality of the school. Case studies have documented that schools undertaking meaningful reforms can dramatically reduce their student mobility rate. School officials should also consider changing suspension and expulsion policies, and they should consider developing open enrollment policies to retain students whose families move locally.

• When considering school closures, district officials should take into account the harmful effects of mobility. If closures are necessary, programs and supports should be put in place to ease the transitions.
• School officials should give students and parents sufficient and timely information with which to make sound decisions about school transfers. In addition, because even better information may not prevent transfers to low-performing schools, school officials should also explore optimum strategies for assisting parents and students in making sound transfer choices.
• Personnel in schools that receive transfer students can assist their transition by planning materials and activities before they arrive, such as recruiting and training volunteer coaches. Teachers who face large numbers of new students throughout the school year can also prepare in advance. Case studies provide useful examples of such activities.
• State officials should collect and report school and district mobility rates, as Colorado and Rhode Island do now. They should also use mobility rates as a measure of school effectiveness after suitable adjustments for student body characteristics. In particular, schools should be at least partially accountable for students they educate even if students eventually transfer. California is currently implementing such a plan: test scores and graduation rates for students who transfer to alternative schools are “rolled back” to their original school. State officials should also allocate funds to schools with high mobility to establish programs to improve the integration of new students in a school.
• Because mobility if often caused by forces outside of school control, policymakers concerned about the harmful effects of mobility need to address those larger causes. These include policies to promote housing stability, such as affordable housing and fair housing laws, and policies to promote economic security in the form of better-paying and more secure jobs.

http://nepc.colorado.edu/publication/student-mobility 1 of 16
STUDENT MOBILITY: CAUSES, CONSEQUENCES, AND SOLUTIONS
Introduction
Students in the United States change schools frequently. Most students attend at least three schools: an elementary school, a middle school, and a high school. These “promotional” school changes can be disruptive to students as they have to adjust to new students, new teachers, and new classes.
However, many students change schools much more frequently for a variety of reasons. Some changes are initiated by families and students. One primary cause is that families change residences either voluntarily (as for job promotion) or involuntarily (as for eviction), which often requires changing schools. Sometimes students leave one school for another in search of a better environment or to enroll in a specific program of study, as when they transfer to a magnet school or a career academy. Other changes are initiated by school and district officials. For example, a number of large urban school districts, including Chicago and Philadelphia, have been closing schools because of declining enrollments and budget shortfalls, forcing students to enroll in other schools. Students may also be forced to change schools for disciplinary reasons, including suspensions and expulsions.
These non-promotional school changes are often referred to as student mobility or school mobility. There is widespread concern among students, parents, educators, and policymakers about whether student mobility, especially frequent or chronic student mobility, is helpful or harmful to students’ school performance. This question is especially timely today because of policies that increasingly close traditional schools, open more charter schools, and promote and financially support transfers out of under-performing schools.
The importance of this issue prompted the United States Senate in 2010 to ask the General Accountability Office to undertake a study of the incidence and effects of student mobility.1 In 2009, a partnership of several prominent U.S. foundations funded the National Research Council (NRC) to convene a workshop to “review research on the patterns of change and mobility in the lives of young children (ages 3 to 8 years) and to examine the implications of this work for the design of child care, early childhood and elementary educational programs, and community services for neighborhoods and vulnerable populations that experience high rates of mobility.”2 In addition, there has been a considerable body of research undertaken over the last two decades investigating why students change schools and what effects such moves have.
This policy brief examines the issue first by describing the extent of mobility among students and schools and then by reviewing the research evidence on its causes and

http://nepc.colorado.edu/publication/student-mobility 2 of 16
consequences. Finally, it offers school personnel and state policymakers recommendations for minimizing mobility and its sometimes negative consequences.
The Incidence of Student Mobility
The extent of mobility in the United States is hard to measure. State education agencies collect student enrollment information, but there is no federal mandate to report such data the way that other data, like graduation rates, must be reported. Consequently, estimates of student mobility must be derived from national education studies, state education data, and data from local school districts. Taken together, these sources suggest student mobility is widespread across the U.S.
The only national estimates of student mobility rates come from surveys conducted by the U.S. Department of Education. One is the National Assessment of Education Progress (NAEP), which at one time asked fourth, eighth, and 12th-grade students how many times they had changed schools over the past two years. In 2000, the last time the information was collected, 35% of grade 4 students had changed schools at least once in the past two years, with 19% making one change, 7% making two changes, and 9% making three or more changes (Figure 1). Among grade 8 students, 21% had changed schools at least once in the past two years, with 12% making one change, 4% making two changes, and 4% making three or more changes. Among 12th grades in 1998 (the last year they were surveyed), only 9% had changed schools in the past two years, with 6% making one change, 2% making two changes, and 1% making three or more changes.
Figure 1. Percent of students who changed schools in the last two years by grade level, 2000
Source Data compiled on March 5, 2015 from NAEP Data Explorer website: http://nces.ed.gov/nationsreportcard/naepdata/dataset.aspx
65 79
90
19
12
7 7
4 3
9 4
0%
20%
40%
60%
80%
100%
Grade 4 Grade 8 Grade 12
3 or more 2 1 None

http://nepc.colorado.edu/publication/student-mobility 3 of 16
Data from the Early Childhood Longitudinal Survey that tracked a national representative sample of U.S. kindergarteners until the fifth grade shows the number of schools that students attended from kindergarten (1998) through fifth grade (2004):3
Same school 33.9%
One change 41.9%
Two changes 20.1%
Three or more changes 4.0%
These data suggest that the majority of students in the U.S. make at least one non-promotional school change during elementary school with a sizeable minority making at least two changes. Data from the National Longitudinal Survey of Youth 1997, based on a nationally representative sample of youth 12-16 years old in 1996, indicated that annual school mobility rates varied from a high of 21.6% among 14-year-olds to a low of 13.9% among 17-year-olds.4
Further insight into the extent of student mobility can be found in statistics from state education agencies. State agencies typically compute mobility rates for schools based on the percentage of students who either enter a school after the start of the school year or exit a school before the end of the school year. Such statistics assume such students are transferring out of or into another school, rather than dropping out. Colorado, for example, reported a student mobility rate of 14.5% for the 2013-2014 school year.5 The rate varied by grade level, from a low of 12.5% in eighth grade to a high of 18.7% in 12th grade. The rate also varied by type of program services received, ranging from a low of 5.3% for students receiving gifted and talented services to a high of 28.3% for migrant students and 32.3% for homeless students. Rhode Island reported a student mobility rate of 14% for elementary schools, 11% for middle schools, and 15% for high schools in 2013-14.6 In both states, however, annual student mobility rates vary widely among schools. In Rhode Island elementary schools, for example, the rate varied from less than a 1% to 28%.
Local education agencies also collect and report data on student mobility. One study examined various forms of mobility in New York City schools and found that between 10% and 12% of students in grade 1-4 switched schools between the 1999-2000 and the 2000-2001 school years, while another 5-6% of students in those grades switched schools during the 2000-2001 school year.7
A more recent study found that 70% of students who entered a charter kindergarten in the fall of 2009 remained in the same school three years later, with 17% switching to a different NYC public school and 12% leaving the NYC public schools.8 In contrast, 61% of students who entered a nearby traditional public school remained there three years later, with 25% switching to a different NYC public school and 14% leaving the NYC public schools.
http://nepc.colorado.edu/publication/student-mobility 4 of 16
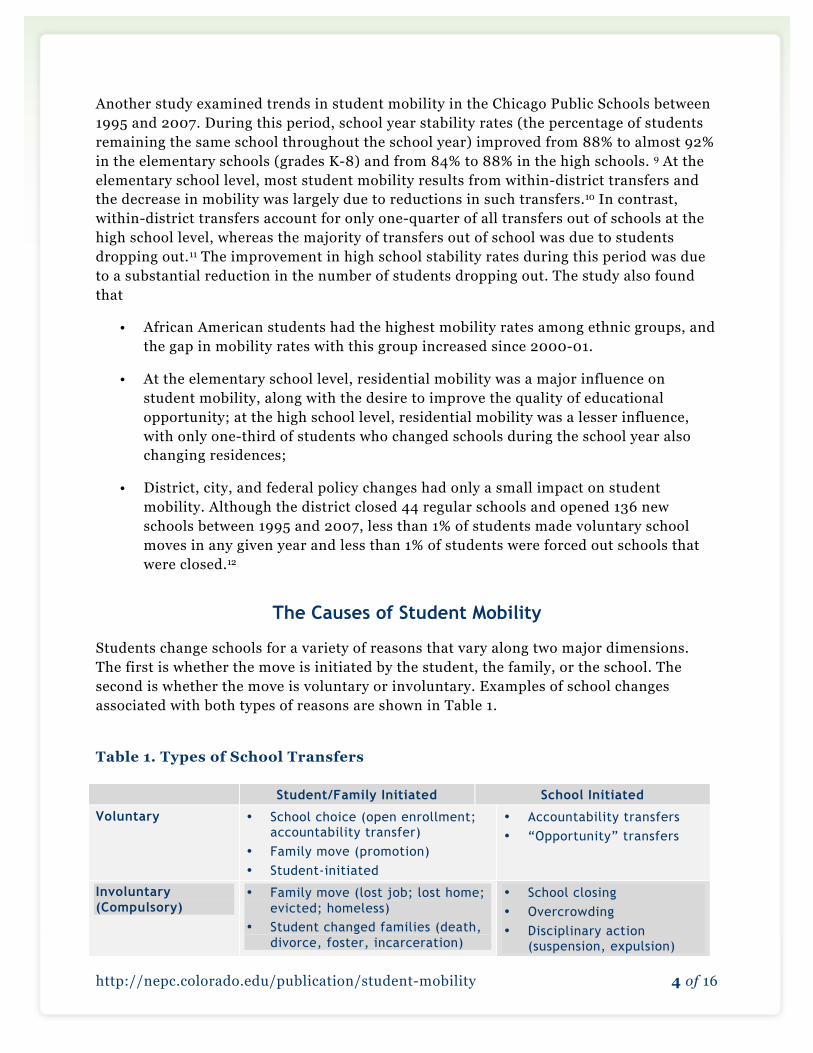
Another study examined trends in student mobility in the Chicago Public Schools between 1995 and 2007. During this period, school year stability rates (the percentage of students remaining the same school throughout the school year) improved from 88% to almost 92% in the elementary schools (grades K-8) and from 84% to 88% in the high schools. 9 At the elementary school level, most student mobility results from within-district transfers and the decrease in mobility was largely due to reductions in such transfers.10 In contrast, within-district transfers account for only one-quarter of all transfers out of schools at the high school level, whereas the majority of transfers out of school was due to students dropping out.11 The improvement in high school stability rates during this period was due to a substantial reduction in the number of students dropping out. The study also found that
• African American students had the highest mobility rates among ethnic groups, and the gap in mobility rates with this group increased since 2000-01.
• At the elementary school level, residential mobility was a major influence on student mobility, along with the desire to improve the quality of educational opportunity; at the high school level, residential mobility was a lesser influence, with only one-third of students who changed schools during the school year also changing residences;
• District, city, and federal policy changes had only a small impact on student mobility. Although the district closed 44 regular schools and opened 136 new schools between 1995 and 2007, less than 1% of students made voluntary school moves in any given year and less than 1% of students were forced out schools that were closed.12
The Causes of Student Mobility
Students change schools for a variety of reasons that vary along two major dimensions. The first is whether the move is initiated by the student, the family, or the school. The second is whether the move is voluntary or involuntary. Examples of school changes associated with both types of reasons are shown in Table 1.
Table 1. Types of School Transfers
Student/Family Initiated School Initiated
Voluntary • School choice (open enrollment; accountability transfer)
• Family move (promotion) • Student-initiated
• Accountability transfers • “Opportunity” transfers
Involuntary (Compulsory)
• Family move (lost job; lost home; evicted; homeless)
• Student changed families (death, divorce, foster, incarceration)
• School closing • Overcrowding • Disciplinary action
(suspension, expulsion)

http://nepc.colorado.edu/publication/student-mobility 5 of 16
A third dimension associated with the other two is whether the transfers take place between school years or during a school year. Because voluntary moves are often planned in advance, they often take place between school years to minimize the disruption to students’ educational lives.13 In contrast, involuntary moves often occur during the school year and, hence, can be more disruptive to students’ educational experiences.
Most school transfers are initiated by students and their families. Residential mobility is common in the U.S., so it is not surprising that the most common reason for changing schools is that families changed residences. The U.S. Census reports that 13.5% of U.S. school-aged children (5-17 years of age) changed residences between 2012 and 2013, with 9% moving within the same county, 2.3% moving to a different county within the same state, 1.7% moving to a different state, and .5% moving from abroad.14 These figures suggest most residential moves are local, which implies that not all residential moves involve a school move. A national study of adolescent youth found that only about half of all school moves involved a residential move.15 A 1988 study that tracked eighth-graders for four years found that while half of all residential moves did not require changing schools, fully 70% of all school changes were associated with families moving.16 Due to a number of policy initiatives by the federal and state governments that promote open enrollment and school choice, it is likely that the percent of school changes associated with residential moves has decreased over time. For example, as noted earlier, only one third of high school transfers in Chicago also included residential moves.17
Families change residences for a number of reasons, both voluntary and involuntary. Voluntary residential moves can be due to a job promotion in another location or moving to a better home or neighborhood or even to access a better school. Involuntary residential moves can be due to loss of a job, home foreclosure, eviction from a rental property, displacement caused by a natural disasters, homelessness, divorce, death, foster care, or incarceration. The U.S. Census reports that the most common reasons for moving between 2013 and 2014 were: “wanted new or better home/apartment” (15%); wanted “to establish own household” (11%); “new job or job transfer”; and, “wanted cheaper housing” (9%).18 All such moves are not only disruptive to the family; they can also be disruptive to children’s schooling.
Some moves are particularly disruptive. Homelessness is one example. Although homelessness varies widely by geography, it is more common in large urban centers. A paper prepared for the NRC student mobility workshop examined homelessness and school mobility in Philadelphia.19 It found that the overall incidence of homelessness of a third-grade cohort of public school students (for whom state proficiency data were available) averaged 9.2% across the city—about three times the national average—and ranged from 0% to 32% across schools.20 Almost half of the third-grade cohort had made at least one non-promotional school change between kindergarten and the end of third grade. A follow-up study by the same authors also reported that almost two-thirds of the homeless children made at least one school move, a rate 50% higher than the overall third-grade population.21 A more recent study examines variability in the homeless experiences

http://nepc.colorado.edu/publication/student-mobility 6 of 16
of mothers and their children in an unidentified eastern city.22 Like other studies, this study found that because these mothers suffer from other conditions related to their homelessness, such as health and financial problems, they often cannot provide frequent and meaningful interactions or other necessary supports for their children’s growth and development. Consistent with this finding, a recent review of the literature on homelessness notes that homeless children often suffer from social and psychological isolation because of a lack of supportive social relationships.23
Students’ families not only change residences, but students can also change families due to death, divorce, foster care, or the incarceration of a family member. School changes are especially common among foster youth because they frequently change families. For example, a retrospective study of 159 former foster care youth found that they averaged more than seven placements and eight school transfers over their average of 6.6 years in foster care.24 In addition, a growing number of divorces in the U.S. involve joint custody, where students in essence have two homes.25
Students and families can also voluntarily change schools without changing residences. Open enrollment policies allow students to attend schools anywhere in their district or even in other districts. According to the Education Commission of the States, 21 states allow students to choose schools outside their home district (known as mandatory interdistrict open enrollment), and 22 states allow students to attend any school within their home district (known as mandatory intradistrict enrollment); a majority of these states offer students both options.26 Charter schools are also a growing option for students.
Students and families may take advantage of options for school change proactively when a student is promoted from one grade level to another—for example, between middle and high school. But these options also encourage or permit reactive, non-promotional school transfers if students or their families are dissatisfied with a school placement. Students may, for example, change schools to escape being victimized (attacked, threatened, bullied, or harassed).27
Schools can also initiate both voluntary and involuntary school transfers. The federal No Child Left Behind Act requires schools identified as underperforming to inform parents of their right to transfer to a higher performing school and pay for the transportation to attend.28 Although schools initiate the process, families make the final decision.
Schools also “encourage” students to voluntarily transfer to more suitable, alternative schools (continuation high schools, for example) a practice sometimes labeled as “opportunity” transfers.29 This practice has likely increased due to state and federal accountability pressures to improve test scores and graduation rates. One response to these pressures is for schools to “discharge” their lowest performing students.30
Schools can also initiate involuntary transfers. A growing number of urban districts, including Chicago and Philadelphia, are closing schools due to budget cuts, declining enrollments, and academic underperformance, forcing students to transfer to other schools. For example, between 2001 and 2009 the Chicago Public Schools closed 44 schools for three reasons: non-academic reasons (underutilization of school’s space, poor
http://nepc.colorado.edu/publication/student-mobility 7 of 16
condition of the building, an alternative need for the space, or conversion to a charter school); academic reasons (underperformance); or a need for change in educational focus.31 In March, 2013, school officials in Philadelphia approved a plan to close 23 public schools, representing 10% of the district’s schools.32
Schools can also initiate involuntary transfers due to disciplinary actions, such as expulsions and suspensions, which may lead to a new school placement due to “zero tolerance” or “tough love” policies.33
The Consequences of Mobility
What are the consequences of mobility? Do they lead to positive outcomes for students, negative outcomes for students, or are the impacts insignificant? Do the consequences vary depending on the outcomes (test scores, behavior, high school graduation), the number of moves, the reason for the move (proactive vs. reactive) or when the move takes place (elementary, middle or high school; between school years vs. during the school year)? Are there any consequences for teachers and schools?
Despite a fairly robust research literature on this topic, these questions are actually hard to answer. The reasons students transfer, such as family disruptions or problems at school, can also influence subsequent student outcomes even without a school transfer. As a result, it is hard to accurately assess the causal impact of student mobility.
This issue was one of the topics addressed by a workshop convened by the National Research Council on June 29-30, 2009 to examine the impact of student mobility on the academic achievement of young children (ages 3 to 8). The planning committee invited expert scholars to present papers on early childhood development, children most affected by mobility, methodological issues, and policy and programmatic responses. One paper examined the impact of mobility from a developmental perspective:
Children’s body function, brain development, capacities for dealing with stress, and behavior change over time, and these variations may make them more or less vulnerable to—or able to withstand—the effects of mobility. Parents as well as children may perceive and handle a move differently depending on the child’s developmental stage…Disruptions in this development can have a snowball effect, which explains how mobility has the potential to harm children…Specifically, mobility (particularly repeated mobility) can disrupt children’s routines, the consistency of their care and health care, and their relationships, as well as learning routines, relationships with teachers and peers, and the curriculum to which they are exposed.34
Moreover, the impact can vary depending on the child’s age or stage of development, family circumstances (stress, violence, disruptions of family supports), other risk factors (poverty), and cultural factors (moves across international borders).

http://nepc.colorado.edu/publication/student-mobility 8 of 16
This complexity of developmental impacts and contributing factors make it difficult to ascertain the causal impact of mobility versus what the outcomes would have been (the “counterfactual”) had the child not changed schools. Most studies that have examined the impacts of mobility rely on quasi-experimental designs that do not fully control for the host of factors that may influence residential and school moves as well as various developmental outcomes.
Despite this limitation, a number of studies with substantial controls for prior achievement and background factors have examined the impacts of student mobility. One paper from the 2009 NRC workshop summarized the findings from 16 studies (9 of which were identified as methodologically strong) conducted since 1990. The study found that even one non-promotional school move both reduced elementary school achievement in reading and math and increased high school dropout rates, with the most pronounced effects for students who made three or more moves.35
Findings from other workshop participants were mixed. One national study found overall negative effects of mobility on reading, but not on math, with more pronounced impacts on low-SES children, students with disabilities, and English Language Learners.36 Four other studies based on data from the states of North Carolina, Florida, and Texas, and New York City also found mixed effects, although there were more consistent findings that students who made three or more non-promotional moves were more likely to experience negative effects.
Finally, the Texas study also found that higher student mobility in schools had a dramatic negative impact on the achievement of all students in the school.37
A number of studies published since 2009 also found mixed impacts of student mobility. One study that tracked a cohort of preschool students in Chicago for 25 years found that students who made non-promotional school changes between kindergarten and 12th grade were less likely to complete high school on time, completed fewer years of school, had lower levels of occupational prestige in their jobs, experienced more symptoms of depression, and were more likely to be arrested as adults.38 The impacts of mobility were above and beyond the impacts of associated risks such as poverty and residential mobility, and were more severe for transfers between the fourth and eighth grades.39 Another study examined the impacts of mobility, including promotional mobility, on students in the Nashville public schools enrolled in grades 3 to 8.40 The study found that all types of school changes reduced achievement growth in reading and mathematics by 6%, representing 10 days of instruction. A third study found that students who entered the New York City school district during high school, either as foreign-born immigrants or U.S. born migrants, were less likely to graduate than students who remained in the district or entered the district during elementary or middle school.41 Two additional studies based on the same national longitudinal study of youth ages 12-16 found the effects of mobility varied by outcome: the first study found that the effects of residential and school mobility
The existing research evidence suggests that student mobility, in general, leads to negative impacts on students.

http://nepc.colorado.edu/publication/student-mobility 9 of 16
on delinquency and substance abuse were spurious, suggesting no direct causal impact after controlling for factors associated both with mobility and these outcomes,42 whereas the second study found that although half of the observed association between changing high schools was explained by the characteristics of students prior to the ninth grade, changing schools still increased the odds of dropping out, but only for students at moderate risk of dropping out.43
Some studies have examined whether the effects of student mobility are more severe if accompanied by family disruptions. One international study found no effects of either school mobility or family transitions (change in family structure) on a number of behavior outcomes of U.S. students in grades 4 and 6, but it did find that students who experienced both forms of instability were more likely to affiliate with a best friend who had social problems.44 A study in Philadelphia found negative effects of mobility on reading and math scores, and positive effects on social problems and task engagement, but the effects were more pronounced among students who were both homeless and experienced school mobility.45
The impact of mobility may depend on reason for the transfers (voluntary vs. involuntary) and circumstances (going to a better vs. a worse school with or without changing residences). One study found that although foreclosures in New York City lead to increased school mobility, students who changed schools tended to move to lower performing schools whether or not the move was prompted by foreclosures.46 Three studies of mobility due to school closings—one in Michigan, one in Chicago, and one in an anonymous urban district—found the overall impact was neither positive nor negative and a positive impact when students moved to higher performing schools.47 Another study found the impacts of mobility were greater when students moved to a new county, city, or state versus moving locally.48
Other studies have investigated the mediating factors that explain how and why student mobility affects student outcomes. One study found that the impacts of both homelessness and school mobility on academic achievement and classroom engagement were mediated partially by absenteeism.49 Other studies have documented how school mobility disrupts friendship networks (peer social capital) thereby leading to lower achievement.50 Still other studies have documented the impacts of mobility on students’ psychological well-being. A high school student who participated in a comprehensive study of mobility in California commented:
Moving and changing schools really shattered my personality. I feel like there’s all these little things I picked up from all of the different schools and I feel all disoriented all the time. There’s no grounding. I always just feel like I’m floating. It’s psychological damage, really…because you never feel like a complete person. That’s how I feel—I feel fragmented. Every time I moved I felt less and less important.51
Mobility not only impacts students who change schools, it also impacts classrooms and schools who must deal with mobile students. The California mobility study documented

http://nepc.colorado.edu/publication/student-mobility 10 of 16
the impacts that mobile students can have on schools in processing students when they enter or exit a school, a sort of “chaos” factor, and on teachers who report how disruptive and difficult it is to teach in classrooms with constant student turnover.52 As one teacher reported:
We start on a project, and prepare for the project by putting them in the appropriate groups. When a kid leaves in the middle, we have to adjust the whole group again. It is very tiring, time consuming. Often times you lost momentum in what you are doing. It takes a lot of time to readjust and refocus and figure out how you’re going to do it.53
More recently, staff in Chicago schools that received large numbers of students from nearby closed schools “reported feelings of demoralization, stress, and tension because they lacked resources to integrate new students.”54
The disruption and chaos in schools impacted by high student turnover can adversely affect non-mobile students. And, as noted above, one study in Texas found that student turnover, especially during the school year, adversely affected student achievement not just of mobile students, but everyone in the school.55 Moreover, the effects were larger for poor and minority students.
Discussion and Analysis
Student mobility is a fact of life in American schools. Research suggests that the majority of elementary and secondary school children make at least one non-promotional school change over their educational careers. They do so for a variety of reasons. School changes are most often initiated by families and frequently involve a change of residences due to voluntary (for example, changing jobs or moving to a better home) or involuntary (for example, getting evicted or having a family disruption such as a divorce) reasons. But schools can also initiate school changes, such as when students are expelled or when schools are closed.
The research literature suggests that changing schools can harm normal child and adolescent development by disrupting relationships with peers and teachers as well as altering a student’s educational program. The impact may be particularly severe when accompanied by disruptions in the home, such as a loss of job, eviction, divorce, or death. Because school changes, especially involuntary school changes, are often due to or accompanied by other factors associated with school performance (poverty, family stress or disruption, student behavior), it is hard to definitively establish the causal impact of student mobility. In addition, many existing studies also do not identify the reason for school transfers or whether it takes place during the school year or between school years. So, continued studies are needed, especially using more sophisticated statistical models that can accurately gauge the causal impact of mobility. Further research is also needed to document the impact of mobility on schools and on the achievement of non-mobile students.
http://nepc.colorado.edu/publication/student-mobility 11 of 16
Despite these limitations, the existing research evidence suggests that student mobility, in general, leads to negative impacts on students. The most consistent and severe impacts are on test scores and high school graduation, with less consistent findings on student behavior. The impacts tend to be more severe for multiple school moves—“chronic” mobility—and when accompanied by family disruptions, such as those experienced by homeless or foster youth. These negative impacts may be mitigated by moving to a higher performing school, although the opportunity to do so may be limited in urban environments.
What is less clear from existing research is whether the impacts of school mobility depend whether the move was voluntary or involuntary, or whether the move occurred between school years or during the school year. Voluntary school moves done for strategic reasons may be the least disruptive. Many voluntary school moves result from residential mobility, which may include consideration of school options. Or, families may select new schools without moving, which is more often the case in high school where more options are available. And, still more options are being created through open enrollment policies, the creation of more charter and alternative schools, and school accountability. Although students and families most often exercise these options during promotional transitions between elementary, middle, and high schools, they may also minimize the disruption by changing schools between school years. The impacts of such changes can be positive, especially when it results in a student attending a higher quality or higher performing school.56
Other voluntary school moves are more reactive, less carefully planned, and more likely to take place during rather than between school years. As a result, they are more disruptive both academically and socially. Students transferring into a new school in the middle of the year have to fit into new classes with a new teacher and new classmates. They also have to find new friends and activities.
Many school moves are made involuntarily and are either initiated by students, their families, or their schools. Such moves are also more likely to be reactive and therefore less carefully planned and more disruptive. Families may move involuntarily due to a host of reasons, including foreclosure, eviction, and job loss. The most acute case involves homeless children. Children also change families, as in the case of foster youth, which often results in forced school changes.
Recommendations
Student mobility is a common feature of the U.S. school system that can lead to positive or negative outcomes. It is also complex both in its causes and consequences. As a result, recommendations for addressing the issue are difficult to formulate. A simple response is to make recommendations to reduce unnecessary mobility, promote its positive aspects, and reduce the negative impacts. Such recommendations can be addressed to all relevant stakeholders: students and parents; school officials, and policymakers.57
• School officials should strive to reduce mobility by improving the overall quality of the school. Case studies have documented that schools undertaking meaningful

http://nepc.colorado.edu/publication/student-mobility 12 of 16
reforms can dramatically reduce their student mobility rate. School officials should also consider changing suspension and expulsion policies, and they should consider developing open enrollment policies to retain students whose families move locally.
• When considering school closures, district officials should take into account the harmful effects of mobility. If closures are necessary, programs and supports should be put in place to ease the transitions.
• School officials should give students and parents sufficient and timely information with which to make sound decisions about school transfers. In addition, because even better information may not prevent transfers to low-performing schools, school officials should also explore optimum strategies for assisting parents and students in making sound transfer choices.
• Personnel in schools that receive transfer students can assist their transition by planning materials and activities before they arrive, such as recruiting and training volunteer coaches. Teachers who face large numbers of new students throughout the school year can also prepare in advance. Case studies provide useful examples of such activities.
• State officials should collect and report school and district mobility rates, as Colorado and Rhode Island do now. They should also use mobility rates as a measure of school effectiveness after suitable adjustments for student body characteristics. In particular, schools should be at least partially accountable for students they educate even if students eventually transfer. California is currently implementing such a plan: test scores and graduation rates for students who transfer to alternative schools are “rolled back” to their original school. State officials should also allocate funds to schools with high mobility to establish programs to improve the integration of new students in a school.
• Because mobility if often caused by forces outside of school control, policymakers concerned about the harmful effects of mobility need to address those larger causes. These include policies to promote housing stability, such as affordable housing and fair housing laws, and policies to promote economic security in the form of better-paying and more secure jobs.

http://nepc.colorado.edu/publication/student-mobility 13 of 16
Notes and References
1 United States Government Accountability Office. (2010). K-12 education: Many challenges arise in educating
students who change schools frequently. Washington, DC: United States Government Accountability Office.
2 National Research Council and Institute of Medicine. (2010). Student mobility: Exploring the impact of frequent moves on achievement: Summary of a workshop. Washington, DC: National Academic Press, 2.
3 Princiotta, D., Flanagan, K. D., & Huasken, E. G. (2006). Fifth grade: First findings from the fifth-grade follow-up of the Early Childhood Longitudinal Study, Kindergarten Class of 1998-99 (ECLS-K). Washington, DC: U.S. Department of Education. Retrieved March 22, 2015, from http://nces.ed.gov/pubsearch/pubsinfo.asp?pubid=2006038, Table 1.
4 Gasper, J., DeLuca, S., & Estacion, A. (2010). Coming and going: Explaining the effects of residential and school mobility on adolescent delinquency. Social Science Research, 39(3), 459-476.
5 Data retrieved March 5, 2015, from Colorado Department of Education website: http://www.cde.state.co.us/cdereval/mobility-stabilitycurrent.
6 Data retrieved March 5, 2015, from Rhode Island data reporting website, InfoWorks! http://infoworks.ride.ri.gov/state/ri.
7 Schwartz, A.E., Stiefel, L., & Chalico, L. (2009). The multiple dimensions of student mobility and implications for academic performance: Evidence from New York City elementary and middle school students. New York: New York University.
8 New York City Independent Budget Office. (2014). Staying or going? Comparing student attrition rates at charter schools. New York City: Independent Budget Office, Table 3.
9 de la Torre, M., & Gwynne, J. (2009). Changing schools: A look at student mobility trends in Chicago Public Schools since 1995. Chicago: Consortium on Chicago School Research, 9-13. Retrieved March 22, 2015, from http://ccsr.uchicago.edu/publications/changing-schools-look-student-mobility-trends-chicago-public-schools-1995.
10 de la Torre, M., & Gwynne, J. (2009). Changing schools: A look at student mobility trends in Chicago Public Schools since 1995. Chicago: Consortium on Chicago School Research, 3. Retrieved March 22, 2015, from http://ccsr.uchicago.edu/publications/changing-schools-look-student-mobility-trends-chicago-public-schools-1995.
11 de la Torre, M., & Gwynne, J. (2009). Changing schools: A look at student mobility trends in Chicago Public Schools since 1995. Chicago: Consortium on Chicago School Research. Retrieved March 22, 2015, from http://ccsr.uchicago.edu/publications/changing-schools-look-student-mobility-trends-chicago-public-schools-1995.
12 de la Torre, M., & Gwynne, J. (2009). Changing schools: A look at student mobility trends in Chicago Public Schools since 1995. Chicago: Consortium on Chicago School Research, 4. Retrieved March 22, 2015, from http://ccsr.uchicago.edu/publications/changing-schools-look-student-mobility-trends-chicago-public-schools-1995.
13 As noted earlier (footnote 7) in the New York City study, twice as many students changed schools between school years than changed schools during the school year
14 Data retrieved March 21, 2015, from U.S. Census, American FactFinder: http://factfinder.census.gov/faces/tableservices/jsf/pages/productview.xhtml?pid= ACS_13_1YR_S0701&prodType=table

http://nepc.colorado.edu/publication/student-mobility 14 of 16
15 Gasper, J., DeLuca, S., & Estacion, A. (2010). Coming and going: Explaining the effects of residential and
school mobility on adolescent delinquency. Social Science Research, 39(3), 459-476.
16 Rumberger, R. W., & Larson, K. A. (1998). Student mobility and the increased risk of high school dropout. American Journal of Education, 107, 1-35, Table 2.
17 de la Torre, M., & Gwynne, J. (2009). Changing schools: A look at student mobility trends in Chicago Public Schools since 1995. Chicago: Consortium on Chicago School Research, 4. Retrieved March 22, 2015, from http://ccsr.uchicago.edu/publications/changing-schools-look-student-mobility-trends-chicago-public-schools-1995.
18 U.S. Census Bureau. (2015). Geographic Mobility: 2013 to 2014, Table 23. Retrieved March 30, 2015, from http://www.census.gov/hhes/migration/data/cps/cps2014.html
19 National Research Council and Institute of Medicine. (2010). Student mobility: Exploring the impact of frequent moves on achievement: Summary of a workshop. Washington, DC: National Academic Press. 23-24.
20 National Research Council and Institute of Medicine. (2010). Student mobility: Exploring the impact of frequent moves on achievement: Summary of a workshop. Washington, DC: National Academic Press, 24-25.
21 Fantuzzo, J. W., LeBoeuf, W. A., Chen, C. C., Rouse, H. L., & Culhane, D. P. (2012). The Unique and Combined Effects of Homelessness and School Mobility on the Educational Outcomes of Young Children. Educational Researcher, 41(9), 393-402.
22 Miller, P.M. (2015). Families' experiences in different homeless and highly mobile settings: Implications for school and community practice. Education and Urban Society, 47(1), 3-32.
23 Miller, P.M. (2011). A critical analysis of the research on student homelessness. Review of Educational Research, 81(3), 308-337, 315.
24 Sullivan, M.J., Jones, L., & Mathiesen, S. (2010). School change, academic progress, and behavior problems in a sample of foster youth. Children and Youth Services Review, 32(2), 164-170, 164.
25 Nunley, J.M., & Seals, R.A. (2011). Child-custody reform, marital investment in children, and the labor supply of married mothers. Labour Economics, 18(1), 14-24.
26 Mikulecky, M.T. (2012). Open enrollment is on the menu--but can you order it? Denver: Education Commission of the States, 2.
27 Carson, D.C., Esbensen, F.A., & Taylor, T.J. (2013). A longitudinal analysis of the relationship between school victimization and student mobility. Youth Violence and Juvenile Justice, 11(4), 275-295.
28 Sunderman, G.L. (2008). Holding NCLB accountable: Achieving accountability, equity, & school reform. Thousand Oaks, CA: Corwin Press.
29 Kelly, D. M. (1993). Last chance high: How girls and boys drop in and out of alternative schools. New Haven: Yale University Press.
Fine, M. (1991). Framing dropouts: Notes on the politics of an urban public high school. Albany, NY: State University of New York Press.
30 Riehl, C. (1999). Labeling and letting go: An organizational analysis of how high school students are discharged as dropouts. In A. M. Pallas (Ed.), Research in Sociology of Education and Socialization (231-268). New York: JAI Press.
31 de la Torre, M., & Gwynne, J. (2009). When schools close: Effects on displaced students in Chicago public schools. Chicago: Consortium on Chicago School Research, 6. Retrieved August 19, 2009, from http://ccsr.uchicago.edu/content/publications.php?pub_id=136.

http://nepc.colorado.edu/publication/student-mobility 15 of 16
32 Hurdle, J. (2013, March 7 2013). Philadelphia officials vote to close 23 schools. New York Times. Retrieved
March 27, 2015, from http://www.nytimes.com/2013/03/08/education/philadelphia-officials-vote-to-close-23-schools.html
33 Losen, D.J., & Martinez, T.E. (2013). Out of school & off track: The overuse of suspensions in middle and high schools. Los Angeles: Center for Civil Rights Remedies at UCLA's Civil Rights Project.
34 National Research Council and Institute of Medicine. (2010). Student mobility: Exploring the impact of frequent moves on achievement: Summary of a workshop. Washington, DC: National Academic Press, 6.
35 National Research Council and Institute of Medicine. (2010). Student mobility: Exploring the impact of frequent moves on achievement: Summary of a workshop. Washington, DC: National Academic Press, 11.
36 National Research Council and Institute of Medicine. (2010). Student mobility: Exploring the impact of frequent moves on achievement: Summary of a workshop. Washington, DC: National Academic Press, 14-15.
37 National Research Council and Institute of Medicine. (2010). Student mobility: Exploring the impact of frequent moves on achievement: Summary of a workshop. Washington, DC: National Academic Press, 34.
38 Herbers, J.E., Reynolds, A.J., & Chen, C.C. (2013). School mobility and developmental outcomes in young adulthood. Development and Psychopathology, 25(2), 501-515, 501.
39 Herbers, J.E., Reynolds, A.J., & Chen, C.C. (2013). School mobility and developmental outcomes in young adulthood. Development and Psychopathology, 25(2), 501-515.
40 Grigg, J. (2012). School enrollment changes and student achievement growth: A case study in educational disruption and continuity. Sociology of Education, 85(4), 388-404.
41 Stiefel, L., Schwartz, A. E., & Conger, D. (2010). Age of entry and the high school performance of immigrant youth. Journal of Urban Economics, 67(3), 303-314.
42 Gasper, J., DeLuca, S., & Estacion, A. (2012). Switching Schools: Revisiting the Relationship Between School Mobility and High School Dropout. American Educational Research Journal, 49(3), 487-519.
43 Gasper, J., DeLuca, S., & Estacion, A. (2012). Switching Schools: Revisiting the Relationship Between School Mobility and High School Dropout. American Educational Research Journal, 49(3), 487-519.
44 Dupere, V., Archambault, I., Leventhal, T., Dion, E., & Anderson, S. (2015). School Mobility and School-Age Children's Social Adjustment. Developmental Psychology, 51(2), 197-210.
45 Fantuzzo, J. W., LeBoeuf, W. A., Chen, C. C., Rouse, H. L., & Culhane, D. P. (2012). The Unique and Combined Effects of Homelessness and School Mobility on the Educational Outcomes of Young Children. Educational Researcher, 41(9), 393-402.
46 Been, V., Ellen, I.G., Schwartz, A.E., Stiefel, L., & Weinstein, M. (2011). Does losing your home mean losing your school? Effects of foreclosures on the school mobility of children. Regional Science and Urban Economics, 41(4), 407-414.
47 de la Torre, M., & Gwynne, J. (2009). Changing schools: A look at student mobility trends in Chicago Public Schools since 1995. Chicago: Consortium on Chicago School Research, 2-3. Retrieved March 22, 2015, from http://ccsr.uchicago.edu/publications/changing-schools-look-student-mobility-trends-chicago-public-schools-1995.
Brummet, Q. (2014). The effect of school closings on student achievement. Journal of Public Economics, 119, 108-124.
Engberg, J., Gill, B., Zamarro, G., & Zimmer, R. (2012). Closing schools in a shrinking district: Do student outcomes depend on which schools are closed? Journal of Urban Economics, 71(2), 189-203.

http://nepc.colorado.edu/publication/student-mobility 16 of 16
48 Gillespie, B.J. (2013). Adolescent behavior and achievement, social capital, and the timing of geographic
mobility. Advances in Life Course Research, 18(3), 223-233.
49 Fantuzzo, J. W., LeBoeuf, W. A., Chen, C. C., Rouse, H. L., & Culhane, D. P. (2012). The Unique and Combined Effects of Homelessness and School Mobility on the Educational Outcomes of Young Children. Educational Researcher, 41(9), 393-402.
50 Ream, R.K. (2005). Toward understanding how social capital mediates the impact of mobility on Mexican American achievement. Social Forces, 84(1), 201-224.
Ream, R.K., & Rumberger, R.W. (2008). Student engagement, peer social capital, and school dropout among Mexican American and non-Latino white students. Sociology of Education, 81(2), 109-139.
Benner, A.D. (2011). Latino adolescents' loneliness, academic performance, and the buffering nature of friendships. Journal of Youth and Adolescence, 40(5), 556-567.
51 Rumberger, R.W., Larson, K.A., Ream, R.K., & Palardy, G.A. (1999). The educational consequences of mobility for California students and schools. Berkeley, CA: Policy Analysis for California Education, 39-40.
52 Rumberger, R.W., Larson, K.A., Ream, R.K., & Palardy, G.A. (1999). The educational consequences of mobility for California students and schools. Berkeley, CA: Policy Analysis for California Education, 55-51.
53 Rumberger, R.W., Larson, K.A., Ream, R.K., & Palardy, G.A. (1999). The educational consequences of mobility for California students and schools. Berkeley, CA: Policy Analysis for California Education, 57.
54 de la Torre, M., & Gwynne, J. (2009). Changing schools: A look at student mobility trends in Chicago Public Schools since 1995. Chicago: Consortium on Chicago School Research, 5. Retrieved March 22, 2015, from http://ccsr.uchicago.edu/publications/changing-schools-look-student-mobility-trends-chicago-public-schools-1995.
55 Hanushek, E.A., Kain, J.F., & Rivkin, S.G. (2004). Disruption versus tiebout improvement: The costs and benefits of switching schools. Journal of Public Economics, 88(9-10), 1721-1746, 1744.
56 Such as a school with higher test scores or higher graduation rates.
57 The following examples are taken from:
Rumberger, R.W., Larson, K.A., Ream, R.K., & Palardy, G.A. (1999). The educational consequences of mobility for California students and schools. Berkeley, CA: Policy Analysis for California Education.
Rumberger, R.W. (2003). The causes and consequences of student mobility. Journal of Negro Education, 72(1), 6-21.