tehama ounty labor market profile and …...p a g e | 1 tehama ounty labor market profile and...
TRANSCRIPT

October 2016
Northern Rural Training and Employment Consortium (NoRTEC)
Tehama County Labor Market Profile and Industry/Sector Analysis
Prepared for:
NoRTEC Workforce Development Board Michael Cross, Executive Director

P a g e | 1
Tehama County Labor Market Profile and
Industry/Sector Analysis
Acknowledgements
This report was compiled by:
1630 N Meridian Street, Suite 430
Indianapolis, IN 46202
317.894.5508
www.tpma-inc.com
Alliance for Workforce Development
Siskiyou Training and Employment Center
Del Norte Workforce Center
Smart Business Resource Center
Job Training Center

P a g e | 2 C o n t e n t s
Tehama County Labor Market Profile and
Industry/Sector Analysis
Contents Executive Summary ............................................................................................................................1
Key Findings .............................................................................................................................................. 1
Recommendations .................................................................................................................................... 2
Tehama County ..................................................................................................................................4
Demographic and Labor Force Characteristics ......................................................................................... 4
Human Capital ........................................................................................................................................... 9
Industry Sector Analysis .......................................................................................................................... 11
Occupation Analysis ................................................................................................................................ 15
High Demand Jobs – Education and Training.......................................................................................... 18
Detailed Industry Analysis ....................................................................................................................... 22
Appendix ......................................................................................................................................... 29
Data Sources and Glossary of Key Terms ................................................................................................ 29
Industry Sector Definitions ..................................................................................................................... 30
Tehama County Input Session Takeaways .............................................................................................. 33
Tehama County Survey Response ........................................................................................................... 34

P a g e | 1 C o n t e n t s
Tehama County Labor Market Profile and
Industry/Sector Analysis
P a g e | 1
Executive Summary This report provides a detailed Demographic, Labor Market and Industry/Sector Analysis for Tehama
County, which is part of the Northern Rural Training and Employment Consortium (NoRTEC) Region
within Northern California.
The report includes both quantitative and qualitative data regarding past, current and projected
economic trends within the county. Data examined include age and race trends and projections; income
and poverty; human capital and labor force; unemployment; commuting patterns; employment by
industry; employment by occupation; industry and occupation connections; and industry sectors. Data
were gathered from a variety of public and proprietary data sources and a survey of regional employers.
An input session was held within the county in May 2016 to validate and supplement the quantitative
data. Participants included key stakeholders, service providers, and employers.
Based on an analysis of the quantitative and qualitative analysis, the following section outlines the key
findings, including strengths and challenges within the county, as well as recommended industry sectors
to emphasize for purposes of workforce planning and resource allocation.
Key Findings The county’s population increased at a rate of 4% over the past ten years. This growth outpaced
growth within the NoRTEC region, which was 1.3%. However, it lags growth within the state
which was 9.3% over the same time period.
The median household income within the county is $42,369, which is slightly below the average
for the NoRTEC region, which is $43,977. It also trails the state, which is $61,489. The poverty
rate for the county is 18.2%, which is similar to the NoRTEC region (18.6%). It is higher than the
state average, which is 16.4%.
Over the past ten years, unemployment trends have been similar to the state. However, the
overall unemployment rates within the county are consistently 2 to 4 percentage points higher.
The top industry sector by employment for the county is Government, which includes
education, state and federal government. Government makes up nearly 20% of employment.
Other significant sectors include: Health Care; Retail Trade; Agriculture; and Manufacturing.
However, with the exception of Government, all of these sectors grew over the past five years.
Health Care and Social Assistance led the way by adding nearly 750 new jobs.
High demand occupations within the county are primarily within the Health Care sector and
include: Personal Care Aides (125 new jobs); Combined Food Preparation and Serving Workers,
Including Fast Food (48 new jobs); Home Health Aides (35 new jobs); Nursing Assistants (24 new
jobs); and Laborers and Freight, Stock, and Material Movers, Hand (21 new jobs).
According to feedback from the May 2016 input session, one of the county’s advantages is that
it is located on a major transportation corridor and between two larger population centers. This
allows employers to draw workers from the neighboring areas. However, one of the challenges
is that wages are higher in the neighboring areas and many workers are willing to commute out
of the county.
The need for bilingual employees was also expressed. Many employers within the Health Care,
Manufacturing and Agriculture sectors indicated a preference for hiring employees who are
bilingual.

P a g e | 2 C o n t e n t s
Tehama County Labor Market Profile and
Industry/Sector Analysis
P a g e | 2
Based on survey results, the most significant challenges for employers within the county include
finding qualified candidates to hire and filling high-skill positions.
For difficult to fill positions, most employers indicated that education was the most desired
attribute amongst candidates.
Recommendations The priority sectors for the NoRTEC region include: Health Care; Manufacturing; Agriculture; Tourism;
and Information Technology (IT). These recommendations are based on an analysis of employment
trends within each of the 11 counties, as well as the region as a whole. These industry sectors are
economically vital to the region, have experienced employment growth, are projected to grow through
2020, and/or tend to be concentrated within the region. Another key consideration was an emphasis on
industry sectors with occupations that have a variety of entry-level educational requirements, and pay a
relatively higher wage compared to other sectors. All of these sectors are present to some degree within
each of the 11 NoRTEC counties. However, some of the sectors are a better fit for individual counties
than for others.
Within Tehama County, the sectors that match the priority sectors for the region include: Health Care;
Manufacturing; Agriculture; and Tourism. The Information Technology (IT) sector has a very small
employment presence within the county with fewer than 20 employees.
Health Care Health Care is the second largest employment sector within the county and added the greatest
number of jobs since 2010. Growth is projected to continue through 2020. Of the top ten high
demand occupations within the county, five are within the Health Care sector. These trends
indicate that this should be a priority sector for the county.
Key occupations within Health Care include: Personal Care Aides; Nursing, Psychiatric, and Home
Health Aides; Miscellaneous Healthcare Support Occupations; and Registered Nurses. All have
experienced growth over the past five years and are projected to grow through 2020. Registered
Nurses, which is one of the largest occupational groups, pays one of the highest wages, with a
median hourly wage of $42.63/hr.
Manufacturing For the Manufacturing sector, key subsectors include Miscellaneous Wood Product
Manufacturing; Fruit and Vegetable Preserving and Specialty Food Manufacturing; and Veneer,
Plywood, and Engineered Wood Product Manufacturing. However, the Manufacturing sector is
quite diverse within the county and other significant manufacturing categories include: Paper
Manufacturing; Machinery Manufacturing; Transportation Equipment Manufacturing; and Grain
and Oilseed Milling.
Occupations with the greatest number of employees include: Miscellaneous Assemblers and
Fabricators; Woodworking Machine Setters, Operators, and Tenders; and Cabinet and Bench
Carpenters. These occupations are projected to add the greatest number of jobs through 2020.
Median hourly earnings for these occupations range from $11.61/hr to $15.62/hr. High wage
manufacturing jobs within the county include: Industry Production Managers ($39.49/hr);
General and Operations Managers ($37.01/hr); and Sales Representatives, Wholesale and
Manufacturing ($25.45/hr).
P a g e | 3 C o n t e n t s
Tehama County Labor Market Profile and
Industry/Sector Analysis
P a g e | 3
Agriculture The Agriculture sector is the fourth largest industry sector within the County. It has experienced
growth since 2010 and is project to grow through 2020. The majority of employment is found
within Crop Production, along with supporting activities. Animal Production and Aquaculture
and Logging are also important sectors.
Key occupations within Agriculture for the county include: Miscellaneous Agricultural Workers
and Farmers, Ranchers, and Other Agricultural Managers. The median wage for Miscellaneous
Agricultural Workers is $10.00/hr. However, the median wage for Farmers, Ranchers, and Other
Agricultural Managers is $18.46/hr.
Tourism The Tourism sector falls across several business categories including Hotels and Restaurants;
Travel Agencies and Tour Operators; Arts, Entertainment and Recreation; and Sightseeing
Transportation. Within the county, the largest subsectors include Restaurants and Other Eating
Places; Other Amusement and Recreation Industries; and Traveler Accommodation. All are
projected to grow through 2020.
Key occupations for the Tourism sector include primarily fall within food service: Fast Food and
Counter Workers; Cooks; Waiters and Waitresses; and Supervisors of Food Preparation and
Serving Workers. Of these four, Supervisors, etc. pay the highest median wage ($16.27/hr).

P a g e | 4 C o n t e n t s
Tehama County Labor Market Profile and
Industry/Sector Analysis
P a g e | 4
Tehama County
Introduction The following is a labor market and industry/sector profile for Tehama
County, California. The quantitative data for the profile includes a
geographic overview, demographic and labor force characteristics, industry
analysis, occupation analysis, and labor force data. For the profile, the
project team collected and analyzed data from Economic Modeling
Specialists Int’l. (EMSI), U.S. Census Bureau, and the U.S. Bureau of Labor
Statistics.
Demographic and Labor Force
Characteristics
Total Population Tehama County is located at the north end of the NoRTEC region, in between the Shasta Trinity Forest
and the Lassen National Forest. The largest community is Red Bluff. The population of Tehama County
increased from 60,602 to 63,192 residents over the past ten years.1 This represents a 4% increase, which
is lower than the state’s growth rate of 9.3% and the national growth rate of 8.7%. Looking forward over
the next five years, the county’s population is projected to decrease an additional 0.5%.
The population of Tehama County is aging. Over the past ten years, the population of 65 years and older
and those ages 55 to 64 were the two fastest growing cohorts. The aging population is a concern because
it impacts the availability of labor over the next decade.
Age 2005 Population
2015 Population Change (2005-2015) Projected Change (2015-2020)
Under 5 4,073 3,987 (86) (2.0%) 486 12.2%
5-19 13,433 12,632 (801) (6.0%) (259) (2.1%)
20-34 9,840 11,125 1,285 13.1% (377) (3.4%)
35-54 16,783 15,284 (1,499) (8.9%) (1,050) (6.9%)
55-64 7,087 8,741 1,654 23.3% 593 6.8%
Over 65 9,386 11,425 2,039 21.7% 935 8.2%
Total 60,602 63,192 2,590 4.0% 329 0.5%
1 EMSI Analyst 2016

P a g e | 5 C o n t e n t s
Tehama County Labor Market Profile and
Industry/Sector Analysis
P a g e | 5
Race/Ethnicity The population of the county is fairly diverse, though 68% of the 2015 population identifies as White,
Hispanics are a large minority group (25% of the population). The three fastest growing race/ethnicity
groups in the county are Black, Native Hawaiian or Pacific Islander, and Hispanic.2
Race/Ethnicity 2015 Population Change, 2005-2015
White 43,547 (2,203) (4.8%)
Hispanic 15,501 4,060 35.5%
Asian 757 191 33.7%
Two or More Races 1,620 262 19.3%
American Indian or Alaskan Native 1,216 102 9.2%
Black 468 155 49.5%
Native Hawaiian or Pacific Islander 85 25 41.7%
2 The Hispanic population includes Hispanics in White, Black, Two or More Races, Asian, American Indian or Alaskan Native, Native Hawaiian, or Pacific Islander.
(2,000)
(1,500)
(1,000)
(500)
0
500
1,000
1,500
2,000
2,500
Under 5 5-9 20-34 35-54 55-64 Over 65
Population Change by Age Group, 2005- 2015

P a g e | 6 C o n t e n t s
Tehama County Labor Market Profile and
Industry/Sector Analysis
P a g e | 6
Educational Attainment Compared to the NoRTEC region, Tehama County has a slightly higher percentage of those with just a
High School Diploma and a much higher percentage than the state average. However, residents have a
lower percentage with Some College, Associate’s Degree, Bachelor’s Degree, or Graduate Degree or
Higher. Although the percentage of those with at least Some College is slightly lower than the NoRTEC
average, it is much higher than the California and US averages. Compared to the state and the nation,
Tehama County should be relatively more competitive for jobs that require between a high school
diploma and less than a college degree, which may include those who have earned a short-term
credential.
Education Level 2015 Population
2015 Percent
2015 Percent NoRTEC
2015 Percent
California
2015 Percent
US
Less Than 9th Grade 4,076 9.5% 5.1% 11.2% 6.6%
9th Grade to 12th Grade 4,847 11.3% 8.4% 8.2% 7.7%
High School Diploma 12,514 29.3% 24.9% 21.0% 28.1%
Some College 12,175 28.5% 30.5% 21.7% 21.0%
Associate's Degree 3,390 7.9% 9.7% 7.8% 7.8%
Bachelor's Degree 3,819 8.9% 14.2% 19.3% 18.0%
Graduate Degree and Higher 1,929 4.5% 7.2% 10.9% 10.7%

P a g e | 7 C o n t e n t s
Tehama County Labor Market Profile and
Industry/Sector Analysis
P a g e | 7
Income Tehama County’s poverty rate of 18.2% is fifth highest within the NoRTEC region. It is also higher than
the median rates for California and the United States.3 The Median Household Income ($42,369) for the
County is also the fifth highest within the NoRTEC region. However, it is significantly lower than the state
of California and the United States.
3 U.S. Census Bureau 2010-2014.
Median Household Income (‘10-‘14) Poverty Rate
Butte $43,165 21.9%
Del Norte $39,302 22.4%
Lassen $53,351 19.4%
Modoc $38,560 20.2%
Nevada $56,949 11.4%
Plumas $48,032 14.0%
Shasta $44,556 14.7%
Sierra $43,107 13.8%
Siskiyou $37,495 21.1%
Tehama $42,369 18.2%
Trinity $36,862 19.9%
California $61,489 16.4%
United States $53,482 14.8%

P a g e | 8 C o n t e n t s
Tehama County Labor Market Profile and
Industry/Sector Analysis
P a g e | 8
Commuting In 2014, Tehama County had 6,857 workers commuting into the county and 11,600 commuting out. This
means that Tehama County is a net exporter of workers.4 Apart from the commuting population, a large
number of individuals (8,483) both lived and worked within the county. Of those commuting into
Tehama County, the largest number came from Shasta County (2,195, 14.3% of the workforce), and
Butte County (1,042, 6.8%). The top destination counties for Tehama County out-commuting workers
were Shasta County (3,213, 16.0%), and Butte County (1,606, 8.0%).
4 U.S. Census Bureau, OnTheMap, 2014 (most recently available). http://onthemap.ces.census.gov/
8,483 live and work in
Tehama County
6,857 workers
commute in
11,633 workers
commute out
Net loss of 4,776 workers

P a g e | 9 C o n t e n t s
Tehama County Labor Market Profile and
Industry/Sector Analysis
P a g e | 9
Human Capital
Labor Force Labor force statistics include both the
employed and the unemployed,
excluding only those who have
stopped looking for work (discouraged
workers) and those who are
voluntarily not in the labor force. In
2016, over 24,800 workers
participated in the Tehama County
labor force, of these, 22,810 were
employed. Over the last 20 years, employment in the county was at its highest in October 2002 and
lowest in January 1996. As of January 2016, the unemployment rate for the county was 8.1%, higher
than the unemployment rate of California (5.8%) and the United States (4.9%).
Labor Force Participation Rate The labor force participation rate is sensitive to demographic changes because participation rates vary
across age, gender, income and race/ethnicity. For example, in
2015 the national labor force participation rate for individuals
older than 54 (39.9%) was significantly lower than for those
between the ages of 25 and 54 (80.7%).
The national labor force participation rate has decreased since
2000, a trend that is expected to continue in the next decade in
part due to the aging of the baby-boomer generation. In 2000,
baby boomers were the heart of the workforce. However, as
this large group of individuals moves closer to retirement, the
overall workforce participation rate decreases. It is worth
mentioning that the participation rate of older workers has
been increasing in the past ten years, but it is still significantly
lower than those of the young adult and middle-aged groups.
Workers in older age brackets and those who are retirement age, compose a considerable proportion of
Tehama County’s population. The older worker population (55 to 64 years of age) was estimated to be
8,741 in 2015.6 A large number of these older workers are expected to retire in the next ten years. Even
more notably, those who are 65 years and older were estimated to total 11,425, equivalent to 18% of
the county’s population.
5 U.S. Bureau of Labor Statistics, 1996.1-2016.1. http://www.bls.gov/data/ 6 The older worker population (55 years and older) in the county is estimated by multiplying the population of this age group by the corresponding labor force participation rate.
EMPLOYMENT IN TEHAMA COUNTY 1996-2016 5
Peak October 2002 (25,268)
January 2016 (22,810– 9.7% lower)
Trough January 1996 (19,679)
January 2016 (22,810 – 15.9% higher)
January 2016
Employment: 22,810 Labor Force: 24,813
Unemployment rate: 8.1%
Labor Force Participation Rate The labor force participation rate
represents the proportion of the
population that is working or pursuing
work, as opposed to those voluntarily
not working or not pursuing work.
The labor force participation rate is
affected by various factors, including
availability of jobs, socioeconomic
composition of the population,
demographics, as well as structural
changes in the economy.

P a g e | 10 C o n t e n t s
Tehama County Labor Market Profile and
Industry/Sector Analysis
P a g e | 10
As noted previously, individuals can be members of the labor force even if they are not currently
employed. Those who are not employed but who are actively looking for work are classified by the
United States Department of Labor as unemployed. Like participation rates, what is considered a normal
unemployment rate varies from region to region based on demographics of each population. Generally
speaking, unemployment tends to spike during recessions and following major layoffs or relocations,
eventually settling to a more normal and stable rate as individuals adjust to the new availability of
employment opportunities. Prolonged periods of unusually high unemployment are typically a signal
that the supply of workers is not in balance with demand for workers.
At its peak, the unemployment rate struck 15.4% in 2010, and dipped to its lowest rate in 2006 at 6.5%.
The Bureau of Labor Statistics of the U.S. Department of Labor reported a gradual decrease in
unemployment in Tehama County since 2010. The unemployment rate for the state of California
followed a similar trend between 2005 and 2015, though the story at the state level is more positive; the
state’s rate is consistently 2 to 4 percentage points lower than Tehama County’s. For California, the
unemployment rate hit its highest mark in 2010 at 12.2% and its lowest mark in 2006 at 4.9%.
6.9%
15.4%
8.0%
5.4%
12.2%
6.2%
0.0%
2.0%
4.0%
6.0%
8.0%
10.0%
12.0%
14.0%
16.0%
18.0%
2005 2006 2007 2008 2009 2010 2011 2012 2013 2014 2015
Tehama County & California Unemployment Rates2005-2015 Annual Average
Tehama County California
P a g e | 11 C o n t e n t s
Tehama County Labor Market Profile and
Industry/Sector Analysis
P a g e | 11
Industry Sector Analysis Industry data are classified according to the types of goods and services that are rendered by
businesses. These data indicate past and projected growth trends by sector and reveal sectors in which
Tehama County is well suited to be competitive.
A chart and several tables are displayed related to industry data. Each of the figures prove data that
descend in order according to 2015 employment. Other data displayed include: employment growth
over the past five years, forecasted growth over the next five years, growth due to competitive effect
(CE), and location quotient (LQ).
The competitive effect helps to determine the amount of job growth that occurred due to the county’s
competitive advantages as compared to the national growth in general and the national growth rate for
each sector. In other words a positive number indicates that the county experienced more growth than
was expected.
Location Quotient (LQ) measures how concentrated or specialized an industry is in a particular county
and helps to demonstrate what makes a particular county’s economy unique. A number greater than
1.25 indicates that the particular sector is considerably more concentrated than the national average. It
also typically indicates that local demand for the products and/or services produced by that industry
have been met and the industry is likely exporting products and/or services outside of the county. In
other words these may be industries that are bringing money into the county, rather that circulating
money already present within the county.7
7 Data from this section are from Economic Modeling Specialists International (EMSI), 2016.1 Class of Worker.

P a g e | 12 C o n t e n t s
Tehama County Labor Market Profile and
Industry/Sector Analysis
P a g e | 12
Industry Mix The broad industry sectors in Tehama County employing the most workers are Government (3,707,
19.5% of all county employment), Health Care (2,712, 14.3%), Retail Trade (2,029, 10.7%), and
Agriculture (1,890, 10%).8 Multiple industry sectors expanded over the past five years, but Health Care
and Transportation and Warehousing lead the pack in terms of net new job growth.
Tehama County’s economy is more diverse that many other areas within the NoRTEC region. The county
has a strong presence of many different varieties of both service and product producing industries.
Looking at the county in terms of competitive strengths, it significantly outperformed other parts of the
United States in job growth in each of the following sectors: Health Care, Transportation and
Warehousing, and Construction. Transportation and Warehousing, and Health Care are both worthy of
special attention due to the fact that they also have strong location quotient scores (2.24 and 1.16,
respectively) indicating that they are more concentrated in Tehama County that other parts of the
United States.
8 These industries are by 2-digit NAICS code. EMSI Analyst 2016.
19.5%
14.3%
10.7%
10%
9.6%
7.6%
6.6%
5.4%
3.6%
3.2%
2.1%
1.9%
1.3%
1%
1%
0 1,000 2,000 3,000 4,000 5,000
Government
Health Care and Social Assistance
Retail Trade
Crop and Animal Production
Manufacturing
Transportation and Warehousing
Accommodation and Food Services
Construction
Other Services (except Public Administration)
Administrative and Support and Waste…
Professional, Scientific, and Technical Services
Wholesale Trade
Finance and Insurance
Real Estate and Rental and Leasing
Arts, Entertainment, and Recreation
Tehama County Jobs by 2-digit Industry Sector
2005 Jobs 2010 Jobs 2015 Jobs

P a g e | 13 C o n t e n t s
Tehama County Labor Market Profile and
Industry/Sector Analysis
P a g e | 13
Industry 2010 Jobs
2015 Jobs
Change in Jobs 2010 - 2015
Change in Jobs 2015 - 2020
Location Quotient
Comp. Effect
Government 3,992 3,707 (285) (7%) 47 1% 1.26 (215)
Health Care and Social Assistance 1,963 2,712 749 38% 330 12% 1.14 491
Retail Trade 1,962 2,029 67 3% (67) (3%) 1.03 (79)
Crop and Animal Production 1,741 1,890 149 9% 8 0% 8.12 78
Manufacturing 1,635 1,816 181 11% (49) (3%) 1.20 79
Transportation and Warehousing 1,117 1,451 334 30% (13) (1%) 2.34 193
Accommodation and Food Services 1,101 1,258 157 14% 81 6% 0.79 (19)
Construction 903 1,032 129 14% 60 6% 1.02 39
Other Services (except Public Administration)
1,184 683 (501) (42%) (45) (7%) 0.75 (512)
Administrative and Support and Waste Management and Remediation Services
485 600 115 24% 64 11% 0.51 30
Professional, Scientific, and Technical Services
414 392 (22) (5%) 26 7% 0.32 (83)
Wholesale Trade 311 356 45 14% 76 21% 0.49 23
Finance and Insurance 261 254 (7) (3%) 32 13% 0.34 (18)
Real Estate and Rental and Leasing 200 185 (15) (8%) (18) (10%) 0.59 (28)
Arts, Entertainment, and Recreation 137 185 48 35% 23 12% 0.58 31
Utilities 100 112 12 12% (3) (3%) 1.63 10
Unclassified Industry 41 85 44 107% 5 6% 2.73 16
Educational Services 82 80 (2) (2%) 15 19% 0.17 (11)
Information 76 74 (2) (3%) 22 30% 0.21 (4)
Management of Companies and Enterprises
303 72 (231) (76%) (29) (40%) 0.27 (290)
Mining, Quarrying, and Oil and Gas Extraction
14 <10 Insf. Data
Insf. Data
Insf. Data
Insf. Data
0.01 (14)

P a g e | 14 C o n t e n t s
Tehama County Labor Market Profile and
Industry/Sector Analysis
P a g e | 14
Key Industries The industry group (4-digit NAICS) level sheds light on specific drivers of economic growth. The following
table shows the county’s top 20 industry groups by total employment in 2015.9 Of the top 20 largest
industries, Local Government, Excluding Education and Hospitals employs the most people, followed by
Education and Hospitals (Local Government). The three highest growth industries were Warehousing
and Storage (281 new jobs); Other Wood Product Manufacturing (209 new jobs); and Local Government,
Excluding Education and Hospitals (122 new jobs).
Industry 2015 Jobs ’10-’15 Change ’15-’20 Change
Local Government, Excluding Education and Hospitals 1,696 122 8% 35 2%
Education and Hospitals (Local Government) 1,588 (390) (20%) 23 1%
Warehousing and Storage 1,090 281 35% 44 4%
Other Wood Product Manufacturing 1,001 209 26% 155 15%
Crop Production 999 4 0% (19) (2%)
Restaurants and Other Eating Places 986 67 7% 28 3%
Individual and Family Services 880 635 259% 334 38%
Support Activities for Crop Production 508 87 21% 29 6%
General Medical and Surgical Hospitals 429 (28) (6%) 11 3%
Grocery Stores 358 7 2% (28) (8%)
Gasoline Stations 336 49 17% 11 3%
Offices of Physicians 287 56 24% (3) (1%)
Fruit and Vegetable Preserving and Specialty Food Manufacturing
286 (74) (21%) (51) (18%)
Services to Buildings and Dwellings 239 19 9% 4 2%
Federal Government, Civilian 226 (59) (21%) (8) (4%)
Building Material and Supplies Dealers 220 35 19% (28) (13%)
General Freight Trucking 219 56 34% (36) (16%)
Other Specialty Trade Contractors 213 30 16% 4 2%
Department Stores 210 0 0% 13 6%
Animal Production and Aquaculture 199 50 34% 3 2%
9 These industries are by 4-digit NAICS code.

P a g e | 15 C o n t e n t s
Tehama County Labor Market Profile and
Industry/Sector Analysis
P a g e | 15
Occupation Analysis An examination of occupational demand is separate and distinct from industry analysis because
industries require a mix of occupations to function. For example, the Manufacturing sector employs
occupations that might be traditionally defined as “manufacturing occupations” – called Production
occupations at the broadest level of occupation classification. The Manufacturing sector, however, also
employs managers, accountants, maintenance and repair personnel, administrative support staff,
lawyers, and many other occupational categories necessary for the industry’s survival. As a workforce
development board, NoRTEC’s mission is to serve individual job seekers and businesses more specifically
than serving as catalysts for industry-specific development. As such, it’s important to understand the
specific occupational roles that are required to keep local businesses flourishing.
The occupational analysis that follows provides a view of the most critical occupations within the region
from an overarching economic perspective and specifically related to some of the key industries that
were highlighted previously.
Occupational Groups Tehama County’s top occupations include:
Office and Administrative Support Occupations (2,250 jobs)
Transportation and Material Moving Occupations (1,893 jobs)
Sales and Related Occupations (1,664 jobs)
Education, Training, and Library Occupations (1,588 jobs)10
The median hourly earnings for all occupations available range from $10.25/hr for Personal Care and
Service Occupations to $42.12/hr for Legal Occupations.
As noted in the industry analysis section, location quotient scores can indicate fields where the county
has a strong competitive advantage over other places in United States. Occupational groups where
Tehama County has a strong concentration of workers (above an LQ of 1.25) include:
Farming, Fishing and Forestry (9.74)
Transportation and Material Moving Occupations (1.53)
Education, Training, and Library Occupations (1.42)
Production Occupations (1.34)
These are the occupation groups for which the region is highly specialized. For example, jobs in Farming,
Fishing, and Forestry make up 9.74x more of the employment base than they do nationally.
10 These occupations are by 2 digit SOC code (Standard Occupation Classification System).

P a g e | 16 C o n t e n t s
Tehama County Labor Market Profile and
Industry/Sector Analysis
P a g e | 16
Broad Occupation Mix Occupation 2015
Employment % of Total
Employment Median Hourly
Earnings
2015 Location Quotient
Office and Administrative Support 2,250 11.7% $16.57 0.78
Transportation and Material Moving 1,893 9.9% $16.86 1.53
Sales and Related 1,664 8.7% $13.21 0.87
Education, Training, and Library 1,588 8.3% $21.73 1.42
Production 1,549 8.1% $14.82 1.34
Farming, Fishing, and Forestry 1,484 7.7% $11.49 9.74
Food Preparation and Serving Related 1,390 7.3% $10.72 0.87
Management 1,129 5.9% $32.44 1.10
Installation, Maintenance, and Repair 849 4.4% $20.62 1.02
Construction and Extraction 848 4.4% $18.61 1.19
Personal Care and Service 773 4.0% $10.25 1.02
Building and Grounds Cleaning and Maintenance 711 3.7% $12.38 0.98
Healthcare Practitioners and Technical 602 3.1% $41.71 0.59
Protective Service 484 2.5% $27.54 1.15
Business and Financial Operations 440 2.3% $25.37 0.47
Healthcare Support 410 2.1% $14.30 0.78
Community and Social Service 353 1.8% $22.16 1.13
Life, Physical, and Social Science 188 1.0% $23.52 1.24
Arts, Design, Entertainment, Sports, and Media 154 0.8% $14.90 0.47
Architecture and Engineering 109 0.6% $32.98 0.35
Military 106 0.6% $16.43 0.41
Computer and Mathematical 95 0.5% $30.71 0.19
Legal 83 0.4% $42.12 0.51

P a g e | 17 C o n t e n t s
Tehama County Labor Market Profile and
Industry/Sector Analysis
P a g e | 17
Top Occupations – 4 Digit SOC Codes The following table displays the top 20 occupations by 4-digit occupational groups within Tehama County11. The occupation employing the most workers is Miscellaneous Agricultural Workers, followed by Cashiers and Driver/Sales Workers and Truck Drivers. Miscellaneous Assemblers and Fabricators experienced the most growth, with the addition of 126 new jobs between 2010 and 2015.
Occupation 2015 Employment
Change, 2010-2015
Projected Change,
2015-2020
Projected Annual
Openings
Median Hourly Earnings
Miscellaneous Agricultural Workers 1,134 112 11% 9 1% 38 $10.00
Cashiers 714 61 9% (9) (1%) 31 $9.90
Driver/Sales Workers and Truck Drivers
667 115 21% (9) (1%) 12 $15.84
Laborers and Material Movers, Hand
587 78 15% 24 4% 22 $14.24
Fast Food and Counter Workers 441 36 9% 52 12% 30 $9.93
Elementary and Middle School Teachers
409 (86) (17%) 14 3% 12 $29.97
Building Cleaning Workers 396 (123) (24%) 1 0% 11 $11.77
Secretaries and Administrative Assistants
394 27 7% 9 2% 7 $17.50
Miscellaneous Assemblers and Fabricators
382 126 49% 6 2% 8 $12.70
Teacher Assistants 365 (39) (10%) 9 2% 10 $13.03
Cooks 350 37 12% 10 3% 10 $11.22
Retail Salespersons 294 3 1% (9) (3%) 10 $12.19
Grounds Maintenance Workers 274 42 18% 10 4% 9 $12.50
Personal Care Aides 262 49 23% 125 48% 28 $9.97
General and Operations Managers 253 31 14% 10 4% 7 $37.01
Office Clerks, General 250 13 5% 5 2% 6 $13.32
Bookkeeping, Accounting, and Auditing Clerks
230 18 8% 2 1% 3 $18.21
Industrial Truck and Tractor Operators
228 30 15% (7) (3%) 5 $18.00
Maintenance and Repair Workers, General
224 35 19% 7 3% 6 $17.75
First-Line Supervisors of Sales Workers
220 (2) (1%) (4) (2%) 5 $16.17
11 Occupations are by 4 digit SOC code.

P a g e | 18 C o n t e n t s
Tehama County Labor Market Profile and
Industry/Sector Analysis
P a g e | 18
High Demand Jobs – Education and Training According to the U.S. Bureau of Labor Statistics analysis of minimum education and training requirements12, 57% typically require less than a high school diploma.13 Approximately 7% of these high demand jobs typically require at least a Bachelor’s degree. In terms of training and experience requirements, 77% of these jobs require some type of training, which is typically on-the-job training.
12 Individual employers may require more education than BLS analysis suggests is required. For example, some employers may require high school completion even for jobs that BLS suggests could be performed with less education. 13 A total of 23 occupations with the highest projected job growth from 2015 to 2020 are included in this analysis. These occupations are with 5 digit SOC code. EMSI Analyst 2016.1.
57%
18%
6%
7%
10%2%
Educational Requirements
Less Than High School
High School or Equivalent
Associate's Degree
Bachelor's Degree
Postsecondary Non-Degree Award
Some College, No Degree
75%
2%
23%
Training Requirements
On-the-Job Training Internship/Residency
None

P a g e | 19 C o n t e n t s
Tehama County Labor Market Profile and
Industry/Sector Analysis
P a g e | 19
Description 2020 Jobs
2015 - 2020
Change
Annual Openings
Avg. Hourly
Earnings
Typical Entry Level
Education
Typical On-The-Job Training
Personal Care Aides 387 125 28 $10.19 Less than high school
Short-term on-the-job training
Combined Food Preparation and Serving Workers, Including Fast Food
439 48 26 $10.63 Less than high school
Short-term on-the-job training
Home Health Aides 91 35 9 $10.72 Less than high school
Short-term on-the-job training
Nursing Assistants 141 24 7 $11.69 Postsecondary non-degree award
None
Laborers and Freight, Stock, and Material Movers, Hand
354 21 15 $15.44 Less than high school
Short-term on-the-job training
Registered Nurses 190 17 7 $41.39 Associate's degree
None
Construction Laborers 200 15 7 $14.71 Less than high school
Short-term on-the-job training
Woodworking Machine Setters, Operators, and Tenders, Except Sawing
107 12 3 $13.50 High school diploma or equivalent
Short-term on-the-job training
Electrical Power-Line Installers and Repairers
35 11 3 $40.65 High school diploma or equivalent
Long-term on-the-job training
Licensed Practical and Licensed Vocational Nurses
97 11 4 $24.14 Postsecondary non-degree award
None
Operating Engineers and Other Construction Equipment Operators
70 10 3 $28.76 High school diploma or equivalent
Moderate-term on-the-job training
Tellers 78 10 5 $13.35 High school diploma or equivalent
Short-term on-the-job training
Dental Assistants 78 10 4 $19.39 Postsecondary non-degree award
None
Dental Hygienists 61 10 3 $47.22 Associate's degree
None
Elementary School Teachers, Except Special Education
311 10 9 $31.66 Bachelor's degree
Internship/residency
General and Operations Managers 263 10 7 $45.06 Bachelor's degree
None
Recreation Workers 48 9 2 $10.97 Bachelor's degree
None
Telecommunications Line Installers and Repairers
28 9 2 $30.25 High school diploma or equivalent
Long-term on-the-job training
Sales Representatives, Wholesale and Manufacturing, Except Technical and Scientific Products
99 9 4 $35.08 High school diploma or equivalent
Moderate-term on-the-job training

P a g e | 20 C o n t e n t s
Tehama County Labor Market Profile and
Industry/Sector Analysis
P a g e | 20
Description 2020 Jobs
2015 - 2020
Change
Annual Openings
Avg. Hourly
Earnings
Typical Entry Level
Education
Typical On-The-Job Training
Cabinetmakers and Bench Carpenters
148 9 3 $16.32 High school diploma or equivalent
Moderate-term on-the-job training
Landscaping and Groundskeeping Workers
247 9 8 $11.86 Less than high school
Short-term on-the-job training
Secretaries and Administrative Assistants, Except Legal, Medical, and Executive
266 9 5 $15.42 High school diploma or equivalent
Short-term on-the-job training
Teacher Assistants 374 9 10 $13.15 Some college, no degree
None

P a g e | 21 C o n t e n t s
Tehama County Labor Market Profile and
Industry/Sector Analysis
P a g e | 21
Connection between High Demand Occupations and Key Industries
Top Occupations Key Industries
Personal Care Aides Health Care
Combined Food Preparation and Serving Workers, Including Fast Food
Tourism
Home Health Aides Health Care
Nursing Assistants Health Care
Laborers and Freight, Stock, and Material Movers, Hand
Transportation and Warehousing
Manufacturing
Registered Nurses Health Care
Construction Laborers Construction
Woodworking Machine Setters, Operators, and Tenders, Except Sawing
Manufacturing
Electrical Power-Line Installers and Repairers Construction
Licensed Practical and Licensed Vocational Nurses
Health Care
Industry and Occupation Connections Industries drive economic growth, but the fuel that enables those industries to function are its workers,
who are classified by occupational codes. Considering the importance of talent to supporting key
regional industries, it is worth exploring the connections between significant industries and the
occupations that are most critical to those industries.
The following table identifies the top ten high demand occupations and how they are connected to
some of the region’s key industries.14 Five of the high demand occupations are within the Health Care
sector.
14 Occupations are by 4-digit SOC code.

P a g e | 22 C o n t e n t s
Tehama County Labor Market Profile and
Industry/Sector Analysis
P a g e | 22
Detailed Industry Analysis The following section provides an in-depth look at sectors that are important to the Tehama County
economy. These industry sectors include: Health Care; Manufacturing; Professional, Scientific, and
Technical Services; Agriculture; and Administrative and Support Services. For each of these sectors the
top employing sub-sectors are listed by 4-digit NAICS code, as well as the staffing patterns for each
sector. Staffing patterns data show the top employing occupations at the 4-digit SOC level, along with
past and projected growth, competitive effect, location quotient and average earnings.
Health Care by Employment – (Top 4-Digit NAICS) The largest sectors by employment include Individual and Family Services (880); General Medical and
Surgical Hospitals (429); and Offices of Physicians (287).The sectors with the largest LQs include
Vocational Rehabilitation Services at 3.74 and Individual and Family Services at 3.22. Individual and
Family Services is projected to grow over the next five years, while other industries, such as General
Medical and Surgical Hospitals are expected to decrease in employment. The sector paying the highest
average wages is General Medical and Surgical Hospitals ($76,524), while the sector with the lowest
average wages is Vocational Rehabilitation Services ($10,563).
Industry 2015 Jobs
’10-’15 Change
CE ’10-‘15
’15-’20 Change
CE ’15-‘20
’15 LQ Average Earnings
Individual and Family Services 880 635 482 334 139 3.22 $10,563
General Medical and Surgical Hospitals
429 (28) (54) 11 (17) 0.77 $76,524
Offices of Physicians 287 56 33 (3) (33) 0.90 $67,938
Vocational Rehabilitation Services
159 64 65 (78) (84) 3.74 $14,689
Child Day Care Services 151 (48) (47) (22) (28) 1.00 $18,714
Nursing Care Facilities (Skilled Nursing Facilities)
145 79 79 34 23 0.72 $26,866
Home Health Care Services 144 (15) (48) 9 (24) 0.85 $22,036
Offices of Dentists 136 7 (5) 24 11 1.17 $47,234
Offices of Other Health Practitioners
118 (40) (72) (21) (41) 1.03 $29,327
Continuing Care Retirement Communities and Assisted Living Facilities for the Elderly
81 1 (13) 24 10 0.76 $20,985
Residential Intellectual and Developmental Disability, Mental Health, and Substance Abuse Facilities
59 (17) (24) (18) (25) 0.78 $22,293
Outpatient Care Centers 49 1 (11) 19 10 0.52 $39,986
Other Residential Care Facilities
44 Insf. Data
44 10 7 2.23 $24,616
Medical and Diagnostic Laboratories
15 3 2 7 5 0.46 $26,472

P a g e | 23 C o n t e n t s
Tehama County Labor Market Profile and
Industry/Sector Analysis
P a g e | 23
Industry 2015 Jobs
’10-’15 Change
CE ’10-‘15
’15-’20 Change
CE ’15-‘20
’15 LQ Average Earnings
Other Ambulatory Health Care Services
11 Insf. Data
4 1 (0) 0.28 $22,724
Community Food and Housing, and Emergency and Other Relief Services
<10 Insf. Data
3 Insf. Data
(2) 0.20 Insf. Data
Psychiatric and Substance Abuse Hospitals
0 0 0 0 0 0.00 $0
Specialty (except Psychiatric and Substance Abuse) Hospitals
0 0 0 0 0.00 $0
Staffing Patterns for Health Care (Top 4-digit SOC) The top four occupations by employment within the Health Care sector include: Personal Care Aides
(251); Nursing, Psychiatric and Home Health Aides (168); Miscellaneous Healthcare Support Occupations
(163); and Registered Nurses (158). All of these top occupations increased in employment in the past
five years and are projected to grow up to 2020. The occupation that pays the highest median wage is
Medical and Health Services Managers at $80.15/hr and the occupation that pays the lowest median
wage in this industry sector is Childcare Workers at $8.63/hr.
Occupation 2015 Employment
Change, 2010-2015
Projected Change,
2015-2020
Median Hourly
Earnings
Personal Care Aides 251 144 135% 128 51% $9.97
Nursing, Psychiatric, and Home Health Aides
168 56 50% 59 35% $11.01
Miscellaneous Healthcare Support Occupations
163 15 10% 10 6% $16.59
Registered Nurses 158 12 8% 16 10% $42.63
Secretaries and Administrative Assistants
124 33 36% 7 6% $17.50
Building Cleaning Workers 110 38 53% 8 7% $11.77
Counselors 91 25 38% (5) (5%) $24.61
Childcare Workers 86 (27) (24%) (19) (22%)
$8.63
Receptionists and Information Clerks 81 16 25% 0 0% $15.02
Licensed Practical and Licensed Vocational Nurses
78 22 39% 11 14% $23.68
Miscellaneous Community and Social Service Specialists
70 41 141% 10 14% $16.61
Office Clerks, General 66 19 40% 2 3% $13.32
Teacher Assistants 59 28 90% 6 10% $13.03
Social Workers 56 25 81% 11 20% $25.69
Dental Hygienists 50 4 9% 10 20% $46.56

P a g e | 24 C o n t e n t s
Tehama County Labor Market Profile and
Industry/Sector Analysis
P a g e | 24
Occupation 2015 Employment
Change, 2010-2015
Projected Change,
2015-2020
Median Hourly
Earnings
Therapists 49 (9) (16%) 1 2% $36.38
Preschool and Kindergarten Teachers 48 (1) (2%) 1 2% $18.79
General and Operations Managers 44 21 91% 5 11% $37.01
Medical and Health Services Managers
44 7 19% 3 7% $48.03
Bookkeeping, Accounting, and Auditing Clerks
42 17 68% 3 7% $18.21
Manufacturing by Employment – (Top 4-Digit NAICS) The largest industry within Manufacturing in the county is Other Wood Product Manufacturing with
1,001 jobs, followed by Fruit and Vegetable Preserving and Specialty Food Manufacturing, with 286 jobs.
Other Wood Product Manufacturing grew between 2010 and 2015 and is expected to have continued
growth. However, Fruit and Vegetable Preserving and Specialty Food Manufacturing has been on the
decline, and further job decline is projected.
Industry 2015 Jobs
’10-’15 Change
CE ’10-‘15
’15-’20 Change
CE ’15-‘20
’15 LQ Average Earnings
Other Wood Product Manufacturing 1,001 209 150 155 218 36.50 $46,707
Fruit and Vegetable Preserving and Specialty Food Manufacturing
286 (74) (68) (51) (44) 13.81 $42,135
Veneer, Plywood, and Engineered Wood Product Manufacturing
163 163 163 (109) (101) 18.41 $53,110
Converted Paper Product Manufacturing 54 (4) (1) Insf. Data
(49) 1.67 $59,253
Other General Purpose Machinery Manufacturing
46 Insf. Data
40 13 13 1.43 $61,238
Other Transportation Equipment Manufacturing
36 Insf. Data
31 15 15 9.20 $22,937
Grain and Oilseed Milling 34 10 10 11 12 4.77 $30,082
Household and Institutional Furniture and Kitchen Cabinet Manufacturing
28 (66) (74) 0 3 0.88 $25,870
Beverage Manufacturing 22 Insf. Data
13 (5) (5) 0.84 $51,388
Plastics Product Manufacturing 21 Insf. Data
16 (7) (7) 0.31 $43,259
Printing and Related Support Activities 18 0 1 (6) (4) 0.31 $37,770
Aerospace Product and Parts Manufacturing
18 Insf. Data
17 2 2 0.30 $59,272
Other Miscellaneous Manufacturing 13 (5) (6) Insf. Data
(4) 0.34 $30,278
Coating, Engraving, Heat Treating, and Allied Activities
11 Insf. Data
4 Insf. Data
(3) 0.69 $31,558
Architectural and Structural Metals Manufacturing
11 Insf. Data
5 2 2 0.24 $34,457

P a g e | 25 C o n t e n t s
Tehama County Labor Market Profile and
Industry/Sector Analysis
P a g e | 25
Industry 2015 Jobs
’10-’15 Change
CE ’10-‘15
’15-’20 Change
CE ’15-‘20
’15 LQ Average Earnings
Clay Product and Refractory Manufacturing
10 Insf. Data
5 Insf. Data
(2) 1.93 $42,610
Semiconductor and Other Electronic Component Manufacturing
<10 Insf. Data
(0) Insf. Data
(0) 0.03 Insf. Data
Communications Equipment Manufacturing
<10 Insf. Data
(2) Insf. Data
(0) 0.07 Insf. Data
Industrial Machinery Manufacturing <10 Insf. Data
1 Insf. Data
1 0.12 Insf. Data
Other Fabricated Metal Product Manufacturing
<10 Insf. Data
(6) Insf. Data
1 0.20 Insf. Data
Staffing Patterns for Manufacturing (Top 4-digit SOC) The largest employing Production related occupations in the county are Miscellaneous Assemblers and
Fabricators at 315; followed by Woodworking Machine Setters, Operators, and Tenders at 163; and
Cabinetmakers and Bench Carpenters at 135. Despite projected decline in most other fields, these top
three occupations are projected to increase in employment.
Occupation 2015 Employment
Change, 2010-2015
Projected Change, 2015-
2020
Median Hourly
Earnings
Miscellaneous Assemblers and Fabricators 315 102 48% 5 2% $12.70
Woodworking Machine Setters, Operators, and Tenders
163 (2) (1%) 16 10% $13.53
Cabinetmakers and Bench Carpenters 135 5 4% 8 6% $15.62
Miscellaneous Production Workers 119 17 17% (26) (22%) $11.61
Packaging and Filling Machine Operators and Tenders
99 (3) (3%) (15) (15%) $16.17
Laborers and Material Movers, Hand 98 (10) (9%) (6) (6%) $14.24
Driver/Sales Workers and Truck Drivers 61 6 11% (5) (8%) $15.84
Industrial Machinery Installation, Repair, and Maintenance Workers
56 8 17% (5) (9%) $21.71
First-Line Supervisors of Production and Operating Workers
51 2 4% (1) (2%) $22.05
Industrial Truck and Tractor Operators 51 (4) (7%) (5) (10%) $18.00
General and Operations Managers 35 4 13% (1) (3%) $37.01
Miscellaneous Food Processing Workers 30 (9) (23%) (4) (13%) $13.25
Maintenance and Repair Workers, General 30 2 7% (2) (7%) $17.75
Sales Representatives, Wholesale and Manufacturing
25 0 0% 0 0% $25.45
Inspectors, Testers, Sorters, Samplers, and Weighers
23 (1) (4%) 0 0% $16.66
Machinists 21 13 163% 1 5% $19.42
Carpenters 20 0 0% 5 25% $17.13

P a g e | 26 C o n t e n t s
Tehama County Labor Market Profile and
Industry/Sector Analysis
P a g e | 26
Occupation 2015 Employment
Change, 2010-2015
Projected Change, 2015-
2020
Median Hourly
Earnings
Crushing, Grinding, Polishing, Mixing, and Blending Workers
19 4 27% 0 0% $13.82
Bookkeeping, Accounting, and Auditing Clerks 17 1 6% 0 0% $18.21
Industrial Production Managers 17 3 21% (1) (6%) $39.49
Agriculture by Employment – (Top 4-Digit NAICS) In Tehama County, the top employing industries in the Agriculture sector are Crop Production at 999
jobs; Support Activities for Crop Production at 508 jobs and Animal Production and Aquaculture at 199
jobs. Of the top four, three are expected to grow through 2020, with the exception of Crop Production,
which is projected to decline.
Industry 2015 Jobs
’10-’15 Change
CE ’10-‘15
’15-’20 Change
CE ’15-‘20
’15 LQ Average Earnings
Crop Production 999 4 (51) (19) (20) 9.71 $32,977
Support Activities for Crop Production 508 87 50 29 1 9.01 $30,773
Animal Production and Aquaculture 199 50 51 3 14 3.81 $25,128
Logging 128 13 16 1 12 14.27 $45,555
Support Activities for Animal Production
22 (2) (2) (7) (7) 4.57 $20,735
Support Activities for Forestry 19 (9) (10) (5) (5) 8.37 $26,489
Fishing 12 Insf. Data
6 4 5 3.08 $7,482
Hunting and Trapping <10 Insf. Data
(0) Insf. Data
0 4.48 Insf. Data
Timber Tract Operations <10 Insf. Data
0 Insf. Data
1 1.27 Insf. Data
Forest Nurseries and Gathering of Forest Products
0 0 0 0 0 0.00 $0
Staffing Patterns for Agriculture (Top 4-digit SOC) The largest occupations employed within this sector include Miscellaneous Agricultural Workers with
566 jobs; Farmers, Ranchers and Other Agricultural Managers at 148 jobs, and Driver/Sales Workers and
Truck Drivers at 32 jobs. Among these top three occupations, none grew between 2010 and 2015.
Occupation 2015 Employment
Change, 2010-2015
Projected Change, 2015-2020
Median Hourly
Earnings
Miscellaneous Agricultural Workers 566 0 0% (14) (2%) $10.00
Farmers, Ranchers, and Other Agricultural Managers
148 0 0% 0 0% $18.46
Driver/Sales Workers and Truck Drivers 32 1 3% 0 0% $15.84

P a g e | 27 C o n t e n t s
Tehama County Labor Market Profile and
Industry/Sector Analysis
P a g e | 27
Occupation 2015 Employment
Change, 2010-2015
Projected Change, 2015-2020
Median Hourly
Earnings
First-Line Supervisors of Farming, Fishing, and Forestry Workers
24 0 0% 0 0% $24.31
Graders and Sorters, Agricultural Products 24 (1) (4%) (1) (4%) $12.71
Laborers and Material Movers, Hand 21 1 5% (1) (5%) $14.24
Grounds Maintenance Workers 15 0 0% 0 0% $12.50
Sales Representatives, Wholesale and Manufacturing
10 0 0% 0 0% $25.45
Tourism15 by Employment – (4-Digit NAICS) The vast majority of employment within this industry sector is found within one subsectors: Restaurants
and Other Eating Places (986). Over the past five years, this subsector added 67 jobs. The subsector is
projected to add another 28 jobs through 2020. However, RV (Recreational Vehicle) Parks and Recreation
Camps is projected to add nearly 40 jobs through 2020. RV (Recreational Vehicle) Parks and Recreational
Camps) has the highest average earnings ($37,578), while the sector with the lowest is Drinking Places
(Alcoholic Beverages) ($9,238).
Industry 2015
Jobs
’10-’15
Change
CE ’10-
‘15
’15-’20
Change
CE ’15-
‘20
’15 LQ Average
Earnings
Restaurants and Other Eating Places 986 67 (96) 28 (39) 0.81 $13,919
Other Amusement and Recreation
Industries 125 38 27 16 6 0.79 $16,425
Traveler Accommodation 125 35 28 7 1 0.56 $16,047
RV (Recreational Vehicle) Parks and
Recreational Camps 74 51 48 39 35 9.76 $37,578
Special Food Services 48 21 16 14 11 0.52 $21,683
Independent Artists, Writers, and
Performers 24 (1) (3) 0 0 0.66 $10,203
Drinking Places (Alcoholic Beverages) 15 Insf. Data 6 Insf. Data (5) 0.32 $9,238
Spectator Sports 15 2 0 1 1 0.64 $16,662
Staffing Patterns for Tourism (Top 4-digit SOC) The majority of employment within this industry sector is found within four occupations that are within
the food service industry: Fast Food and Counter Workers (336); Cooks (261); Waiters and Waitresses
(177); and Supervisors of Food Preparation and Serving Workers (72). These subsectors also added the
15 The Tourism industry crosses over several industries, including NAICS 48 (Transportation and Warehousing); 56 (Administrative and Support Services); 71 (Arts, Entertainment, and Recreation; and 72 (Accommodation and Food Services).

P a g e | 28 C o n t e n t s
Tehama County Labor Market Profile and
Industry/Sector Analysis
P a g e | 28
most jobs over the past five years. Of the four, all but Waiters and Waitresses and are projected to add
the greatest number through 2020.
Within this industry sector, General and Operations Managers is the occupation paying the highest
median wage at $37.01/hr. The occupation with the lowest median earnings is Dishwashers at $9.64/hr.
Occupation 2015 Employment
Change, 2010-2015
Projected Change, 2015-2020
Median Hourly
Earnings
Fast Food and Counter Workers 336 30 10% 46 14% $9.93
Cooks 261 21 9% 4 2% $11.22
Waiters and Waitresses 177 22 14% (12) (7%) $9.65
Supervisors of Food Preparation and Serving Workers
72 9 14% 7 10% $16.27
Food Preparation Workers 48 3 7% 2 4% $10.50
Building Cleaning Workers 46 8 21% 5 11% $11.77
Hotel, Motel, and Resort Desk Clerks 46 18 64% 6 13% $10.78
Cashiers 45 6 15% 4 9% $9.90
Food Service Managers 45 5 13% 3 7% $16.04
Dishwashers 42 4 11% (2) (5%) $9.64
Bartenders 36 9 33% (3) (8%) $9.82
Grounds Maintenance Workers 31 16 107% 9 29% $12.50
Hosts and Hostesses, Restaurant, Lounge, and Coffee Shop
20 2 11% (2) (10%) $9.50
Maintenance and Repair Workers, General 18 8 80% 6 33% $17.75
Dining Room and Cafeteria Attendants and Bartender Helpers
18 2 13% (1) (6%) $9.67
Recreation and Fitness Workers 15 2 15% 4 27% $12.26
Miscellaneous Entertainment Attendants and Related Workers
13 4 44% 3 23% $10.13
Musicians, Singers, and Related Workers 12 2 20% 1 8% $18.40
General and Operations Managers 11 3 38% 2 18% $37.01

P a g e | 29 C o n t e n t s
Tehama County Labor Market Profile and
Industry/Sector Analysis
P a g e | 29
Appendix
Data Sources and Glossary of Key Terms Data Sources All data and analysis for this report are directly or indirectly derived from information provided by either the U.S. Bureau of the Census or U.S. Bureau of Labor Statistics:
Economic Modeling Specialists International (EMSI), 2016.1 Class of Worker data (based on the U.S. Quarterly Census of Employment and Wages) and general demographic estimates
U.S. Census American Community Survey 2010-2014 Estimates
U.S. Census OnTheMap
Competitive Effect Used in conjunction with "Shift-Share Analysis" techniques16, The Competitive Effect metric seeks to isolate the influence of local dynamics from the influence of non-local factors on industries' employment growth or decline. A positive number indicates that the study area experienced more growth within a particular industry than would have been expected from non-local trends; the magnitude of The Competitive Effect indicates the strength of the purely local influence on the industry's employment change.
Location Quotient Location Quotient (LQ) measures the relative importance of an industry's employment to a particular region, and uses the straightforward formula: [% of total local employment/% of total national employment]. Location Quotients are one of the most common and important indicators of local economic characteristics; LQ's greater than 1.25 are typically considered to be the threshold for identifying an industry as especially relatively strong.
NAICS Codes (The North American Industry Classification System) NAICS is the standard used by Federal statistical agencies in classifying business establishments for the purpose of collecting, analyzing, and publishing statistical data related to the U.S. business economy. The numbering structure is hierarchical in nature, meaning that fewer digits are broader in their meaning, while longer (up to six) digits provider greater specificity.
SOC Codes (Standard Occupational Classification) The 2000 Standard Occupational Classification (SOC) System was developed in response to a growing need for a universal occupational classification system. Such a classification system allows government agencies and private industry to produce comparable data. Users of occupational data include government program managers, industrial and labor relations practitioners, students considering career training, job seekers, vocational training schools, and employers wishing to set salary scales or locate a new plant. It is used by federal agencies collecting occupational data, providing a standard means to compare such data across agencies. It is designed to cover all occupations in which work is performed for pay or profit, reflecting the current occupational structure in the United States.
As with NAICS, the SOC coding structure is hierarchical, with fewer digits provide broad data (occupational
categories), while larger provide more specific data (specific professions).
16 Shift share is a standard regional analysis method that attempts to determine how much of regional job growth can be attributed to national trends and how much is due to unique regional factors. Shift share helps answer why employment is growing or declining in a regional industry, cluster, or occupation.

P a g e | 30 C o n t e n t s
Tehama County Labor Market Profile and
Industry/Sector Analysis
P a g e | 30
Industry Sector Definitions Health Care
NAICS Description
6211 Office of Physicians
6212 Offices of Dentists
6213 Offices of Other Health Practitioners
6214 Outpatient Care Centers
6215 Medical and Diagnostic Laboratories
6216 Home Health Care Services
6219 Other Ambulatory Health Care Services
6221 General Medical and Surgical Hospitals
6222 Psychiatric and Substance Abuse Hospitals
6223 Specialty (except Psychiatric and Substance Abuse) Hospitals
6231 Nursing Care Facilities (Skilled Nursing Facilities)
6232 Residential Intellectual and Developmental Disability, Mental Health, and Substance Abuse Facilities
6233 Continuing Care Retirement Communities and Assisted Living Facilities for the Elderly
6239 Other Residential Care Facilities
6241 Individual and Family Services
6242 Community Food and Housing, and Emergency and Other Relief Services
6243 Vocational Rehabilitation Services
6244 Child Care Services
Manufacturing NAICS Description
3111 Animal Food Manufacturing
3112 Grain and Oilseed Milling
3114 Fruit and Vegetable Preserving and Specialty Food Manufacturing
3115 Dairy Product Manufacturing
3116 Animal Slaughtering and Processing
3118 Bakeries and Tortilla Manufacturing
3119 Other Food Manufacturing
3121 Beverage Manufacturing
3149 Other Textile Product Mills
3152 Cut and Sew Apparel Manufacturing
3169 Other Leather and Allied Product Manufacturing
3211 Sawmills and Wood Preservation
3212 Veneer, Plywood, and Engineered Wood Product Manufacturing
3219 Other Wood Product Manufacturing

P a g e | 31 C o n t e n t s
Tehama County Labor Market Profile and
Industry/Sector Analysis
P a g e | 31
NAICS Description
3222 Converted Paper Product Manufacturing
3231 Printing and Related Support Activities
3254 Pharmaceutical and Medicine Manufacturing
3255 Paint, Coating, and Adhesive Manufacturing
3256 Soap, Cleaning Compound, and Toilet Preparation Manufacturing
3259 Other Chemical Product and Preparation Manufacturing
3261 Plastics Product Manufacturing
3271 Clay Product and Refractory Manufacturing
3272 Glass and Glass Product Manufacturing
3273 Cement and Concrete Product Manufacturing
3279 Other Nonmetallic Mineral Product Manufacturing
3313 Alumina and Aluminum Production and Processing
3321 Forging and Stamping
3322 Cutlery and Handtool Manufacturing
3323 Architectural and Structural Metals Manufacturing
3324 Boiler, Tank, and Shipping Container Manufacturing
3325 Hardware Manufacturing
3327 Machine Shops; Turned Product; and Screw, Nut, and Bolt Manufacturing
3328 Coating, Engraving, Heat Treating, and Allied Activities
3329 Other Fabricated Metal Product Manufacturing
3331 Agriculture, Construction, and Mining Machinery Manufacturing
3332 Industrial Machinery Manufacturing
3333 Commercial and Service Industry Machinery Manufacturing
3334 Ventilation, Heating, Air-Conditioning, and Commercial Refrigeration Equipment Manufacturing
3335 Metalworking Machinery Manufacturing
3339 Other General Purpose Machinery Manufacturing
3341 Computer and Peripheral Equipment Manufacturing
3342 Communications Equipment Manufacturing
3344 Semiconductor and Other Electronic Component Manufacturing
3345 Navigational, Measuring, Electromedical, and Control Instruments Manufacturing
3346 Manufacturing and Reproducing Magnetic and Optical Media
3351 Electric Lighting Equipment Manufacturing
3352 Household Appliance Manufacturing
3353 Electrical Equipment Manufacturing
3362 Motor Vehicle Body and Trailer Manufacturing
3363 Motor Vehicle Parts Manufacturing
3364 Aerospace Product and Parts Manufacturing
3366 Ship and Boat Building
3369 Other Transportation Equipment Manufacturing
3371 Household and Institutional Furniture and Kitchen Cabinet Manufacturing
3372 Office Furniture (including Fixtures) Manufacturing
3391 Medical Equipment and Supplies Manufacturing
3399 Other Miscellaneous Manufacturing

P a g e | 32 C o n t e n t s
Tehama County Labor Market Profile and
Industry/Sector Analysis
P a g e | 32
Agriculture NAICS Description
1110 Crop Production
1120 Animal Production and Aquaculture
1131 Timber Tract Operations
1132 Forest Nurseries and Gathering of Forest Products
1133 Logging
1141 Fishing
1142 Hunting and Trapping
1151 Support Activities for Crop Production
1152 Support Activities for Animal Production
1153 Support Activities for Forestry
Tourism NAICS Description
4871 Scenic and Sightseeing Transportation, Land
4872 Scenic and Sightseeing Transportation, Water
4879 Scenic and Sightseeing Transportation, Other
5615 Travel Arrangement and Reservation Services
5619 Other Support Services
7111 Performing Arts Companies
7112 Spectator Sports
7113 Promoters of Performing Arts, Sports, and Similar Events
7114 Agents and Managers for Artists, Athletes, Entertainers, and Other Public Figures
7115 Independent Artists, Writers, and Performers
7121 Museums, Historical Sites, and Similar Institutions
7131 Amusement Parks and Arcades
7132 Gambling Industries
7139 Other Amusement and Recreation Industries
7211 Traveler Accommodation
7212 RV (Recreational Vehicle) Parks and Recreational Camps
7213 Rooming and Boarding Houses
7223 Special Food Services
7224 Drinking Places (Alcoholic Beverages)
7225 Restaurants and Other Eating Places

P a g e | 33 C o n t e n t s
Tehama County Labor Market Profile and
Industry/Sector Analysis
P a g e | 33
Tehama County Input Session Takeaways Tehama County is situated on a major transportation corridor and between two larger
population centers in the region, both of which provide economic opportunities and a larger
talent pool to draw from. This also can be a challenge, as wages are higher in the nearby cities,
and many workers are not opposed to commuting these distances for higher pay.
There are currently efforts in the county, such as Expect More Tehama, to encourage
collaboration among local organization and break down silos in services. These efforts should be
continued and expanded as much as possible to maximize the diminishing resources of many
organizations.
There are a lot of personal relationships among community partners that help to spread
information, but there needs to be a greater focus on sharing this information more widely and
in a more sustainable way. This is true for programs and resources to support businesses and
community members as well as events and other opportunities that contribute to the high
quality of life in the area.
The need for bilingual employees was also expressed. Many employers within the Health Care
and Agriculture sectors indicated a preference for hiring employers who are bilingual.
Participants recognized that as unemployment has decreased, employers have had to reach out
and consider new populations to fill positions, specifically including ex-offenders. Many
employers do not have full information to make them consider this population. Services to help
employers understand and find creative solutions to mitigate the risks and concerns that they
have would be very helpful.

P a g e | 34 C o n t e n t s
Tehama County Labor Market Profile and
Industry/Sector Analysis
P a g e | 34
Tehama County Survey Response TPMA developed a survey designed to engage county employers and to better understand current workforce trends and needs in the Tehama County region. In doing so, our consulting team collaborated with NoRTEC and its service providers, which included a diverse group of workforce development, economic development, and other community organizations. Over a four-month period the survey was distributed via email and completed through face-to-face meetings with employers. Survey questions were focused on the following topics:
Industry and business demographics;
Employment numbers and projections;
Labor market “churn”;
Skill needs and gaps;
Education and training requirements;
Desired industry recognized credentials; and
Training challenges. There were 25 employers who participated in the survey. The following includes a summary, analysis
and key findings.
Which industry best describes your company?

P a g e | 35 C o n t e n t s
Tehama County Labor Market Profile and
Industry/Sector Analysis
P a g e | 35
How many employees do you have?
Number of employees Average
Total 112
Full-time 94
Part-time 20
Seasonal 41
Temp 4
How many total employees do you have by county?
County Average
Butte 24
Del Norte 0
Lassen 17
Modoc 0
Nevada 0
Plumas 0
Shasta 27
Sierra 0
Siskiyou 0
Tehama 86
Trinity 0

P a g e | 36 C o n t e n t s
Tehama County Labor Market Profile and
Industry/Sector Analysis
P a g e | 36
Which best describes this location?
On a scale of 1 {not a challenge} to 4 {significant challenge}, how challenging are the following
workforce issues for your company?
Workforce Issues 1 (not a
challenge) 2 (minor
challenge)
3 (moderate challenge)
4 (significant challenge)
Unsure or N/A
Finding qualified candidates to hire 0 2 12 11 0
Training new workers 4 10 10 1 0
Filling high-skill positions 1 1 7 16 0
Adequately assessing and screening candidates
6 7 11 1 0
Drug Screening Candidates 13 4 1 4 3
Identifying skills and knowledge required for jobs at my company
13 8 2 1 0
Retaining existing workers 5 11 8 1 0
Training existing workers 8 11 6 0 0
Replacing retiring workers 4 8 6 5 2
Understanding of locally available resources to help my company
11 9 4 0 1
Determining competitive wage levels to attract workers
8 13 1 3 0
24.0%
32.0%
44.0%
Branch or subsidiary location Headquarters Single location

P a g e | 37 C o n t e n t s
Tehama County Labor Market Profile and
Industry/Sector Analysis
P a g e | 37
Top Five Most Challenging Workforce Issues from Above
Top Five Challenges Responded "Moderate
Challenge" or higher
Finding qualified candidates to hire 23
Filling high-skill positions 23
Adequately assessing and screening candidates 12
Replacing retiring workers 11
Training new workers 11

P a g e | 38 C o n t e n t s
Tehama County Labor Market Profile and
Industry/Sector Analysis
P a g e | 38
What is your most significant workforce-related challenge or your greatest workforce need?
Challenge Top Responses
Finding qualified workers 15
Finding workers with soft skills (attendance, work ethic, people skills) 5
Trying to pay a competitive wage 2
Finding candidates who are willing to work PT or seasonal 2
Finding candidates with basic computer skills 1
What is the average vacancy length for open positions?
The average length based on all responses is 7.3 weeks.
How many full-time (35+ hours/week) new, replacement, and retiring workers do you expect within
the next 0 to 12 months, 1 to 2 years, 3 to 4 years, and 5 to 7 years?
Number of new positions Average Range
0-12 months 1.7 1-2
1 - 2 years 1.9 1-2
3 - 4 years 1.8 1-2
5 - 7 years 2.0 2
Number of replacement positions Average Range
0-12 months 4.3 1
1 - 2 years 3.9 3-4
3 - 4 years 4.2 4
5 - 7 years 4.2 4

P a g e | 39 C o n t e n t s
Tehama County Labor Market Profile and
Industry/Sector Analysis
P a g e | 39
Number of retiring positions Average Range
0-12 months 2.0 2
1 - 2 years 2.1 2
3 - 4 years 2.2 2
5 - 7 years 2.5 2-3
Please provide information regarding your current wages for up to 3 of your top full-time occupations
by number of employees.
Top Occupation #1
Title: Technicians
Job Description: HVAC, electrician, welder
Average number of jobs at location: 5-6
Desired/required certificates/credentials: Certificate/license in specialty; previous work experience; HS diploma preferred
Average entry level: $15.02
Average mid-level: $17.38
Average advanced-level: $21.14
Top Occupation #2
Title: Administrative Positions
Job Description: Office and administrative tasks; working front desk; answering phones
Average number of jobs at location: 9-10
Desired/required certificates/credentials: HS diploma or AA preferred; typing skills; previous office experience
Average entry level: $14.27
Average mid-level: $15.15
Average advanced-level: $20.72
Top Occupation #3
Title: Entry-level workers
Job Description: Entry-level; often physical labor (cleaning, food service, customer service)
Average number of jobs at location: 23
Desired/required certificates/credentials: None, HS diploma preferred
Average entry level: $11.55
Average mid-level: $12.00 Average advanced-level: $14.75

P a g e | 40 C o n t e n t s
Tehama County Labor Market Profile and
Industry/Sector Analysis
P a g e | 40
Do you provide any of the following health benefits?
Most difficult to fill positions and why
Position Reason Responses
High-skilled technical positions Finding qualified candidates 6
Medical positions Hard to find candidates for licensed positions 4
Administrative positions Require math skills and computer expertise 3
Cooks Lack of qualified candidates 2
0 5 10 15 20 25
Employer-sponsored health - employee only
Employer-sponsored health benefits to family
Employer-sponsored retirement savings
Paid vacation
Paid sick leave above California requirement
None of the above
Responses

P a g e | 41 C o n t e n t s
Tehama County Labor Market Profile and
Industry/Sector Analysis
P a g e | 41
Please provide information for your most difficult to fill full-time occupations
What are the factors that most impact difficult to fill positions?
Factors Responses
Lack of qualified candidates, generally 11
Rural location 4
Lack of soft skills 3
Low wages 3
Lack of previous work experience 2
Lack of candidates for positions requiring high skill/education level
1
Retaining existing employees 1
Undesirable work schedule 1
Title: Technicians
Brief job description: Welders, equipment operators, machinists, HVAC, millwrights
Number of current openings: 29
Desired or required certificates or credentials (if any): N/A
Hourly/annual wage ($) $19.95
Title: Medical positions (primarily nurses and MAs)
Brief job description: Working with clients in a variety of settings/divisions
Number of current openings: 33
Desired or required certificates or credentials (if any): State license and required education Hourly/annual wage ($) $40.333 Title: Therapists and social workers
Brief job description: Provides individual and group mental health care; connects eligible recipients to services
Number of current openings: 16
Desired or required certificates or credentials (if any): BSW and state license, MSW preferred
Hourly/annual wage ($): $20.85

P a g e | 42 C o n t e n t s
Tehama County Labor Market Profile and
Industry/Sector Analysis
P a g e | 42
What do you look for most from candidates in difficult-to-fill positions?
What other {if any} skills and/or experience levels are currently in greatest demand?
Top Responses Responses
Soft skills 19
Customer service experience 8
Basic math skills 2
Computer skills 2
Experience working with victims of domestic violence 1
Experience working with a county entity 1
Seasonal employees 1
SolidWorks design knowledge 1
Understanding of LEAN manufacturing 1
Knowledge of electronic medical records 1
Instrumentation operators 1
Previous work experience
On the job training
Education
0 2 4 6 8 10 12 14 16
Responses

P a g e | 43 C o n t e n t s
Tehama County Labor Market Profile and
Industry/Sector Analysis
P a g e | 43
What other {if any} skills and/or experience levels are most difficult to find?
Top Responses Responses
Work ethic/soft skills 3
Basic math skills 2
Drug free 1
Electricians 1
Masters-level social workers 1
Environmental safety 1
What industry-recognized credentials, certifications and/or degrees do you value most?
Top Responses Responses
College degree 3
RN edu/license 3
Food handling card 2
Medical assistance edu/license 2
MSW, LSW, LCSW and corresponding license 2
ASE certification 1
Doctor of Chiropractic 1
Electrician certification 1
High school diploma 1
HVAC certification 1
Welding certification 1
CA insurance licenses 1
PLC 1

P a g e | 44 C o n t e n t s
Tehama County Labor Market Profile and
Industry/Sector Analysis
P a g e | 44
Do you offer training or other professional development, above and beyond initial on-the-job
training?
0 5 10 15 20 25
At this time no
No, but would consider
Yes, funding for individuals to attend outsidetraining
In-house
Responses

P a g e | 45 C o n t e n t s
Tehama County Labor Market Profile and
Industry/Sector Analysis
P a g e | 45
How do you rate the following?
Top Responses Excellent Good Poor Fair Unsure
Soft skills of workers 5 11 0 8 1
Hard/technical skills of workers 4 16 0 3 2
Overall quality of entry-level workers 1 13 1 10 0
Overall quality of high-skill workers 8 13 0 2 2
Quality of education and training programs 4 11 0 5 5
Knowledge of available services from America's Job Center of California (e.g. assistance with job ads) 6 15 1 3 0
Which of the following best describes your experience with your local America’s Job Center of
California office and/or business service center?
0 2 4 6 8 10 12 14 16
Not familiar with them
Familiar, but have not tried them
Have utilized them successfully
Have utilized them, but unsuccessfully
Responses
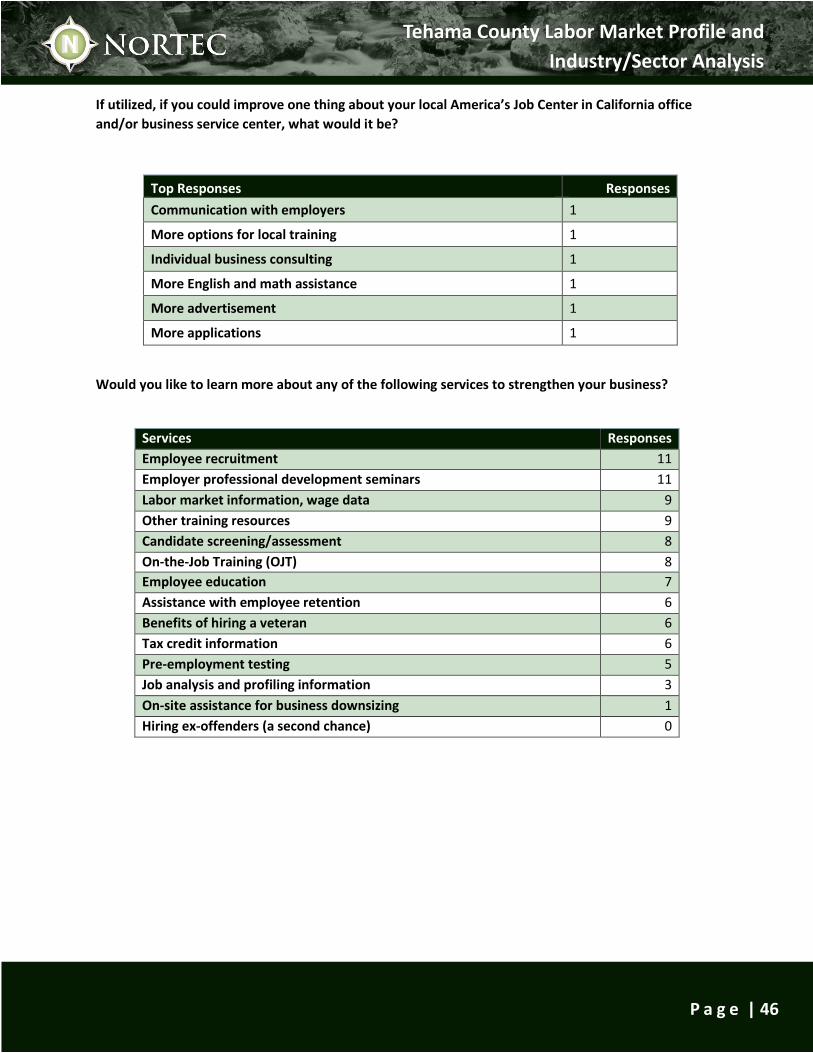
P a g e | 46 C o n t e n t s
Tehama County Labor Market Profile and
Industry/Sector Analysis
P a g e | 46
If utilized, if you could improve one thing about your local America’s Job Center in California office
and/or business service center, what would it be?
Top Responses Responses
Communication with employers 1
More options for local training 1
Individual business consulting 1
More English and math assistance 1
More advertisement 1
More applications 1
Would you like to learn more about any of the following services to strengthen your business?
Services Responses
Employee recruitment 11
Employer professional development seminars 11
Labor market information, wage data 9
Other training resources 9
Candidate screening/assessment 8
On-the-Job Training (OJT) 8
Employee education 7
Assistance with employee retention 6
Benefits of hiring a veteran 6
Tax credit information 6
Pre-employment testing 5
Job analysis and profiling information 3
On-site assistance for business downsizing 1
Hiring ex-offenders (a second chance) 0

P a g e | 47 C o n t e n t s
Tehama County Labor Market Profile and
Industry/Sector Analysis
P a g e | 47
What business or trade groups do you currently participate in?
0 2 4 6 8 10
None
Industry-specific association
Chamber of Commerce
HR Group
Rotary
Farm Bureau
Non-Profit / Community Service Group
Employer-sponsored health club
Responses
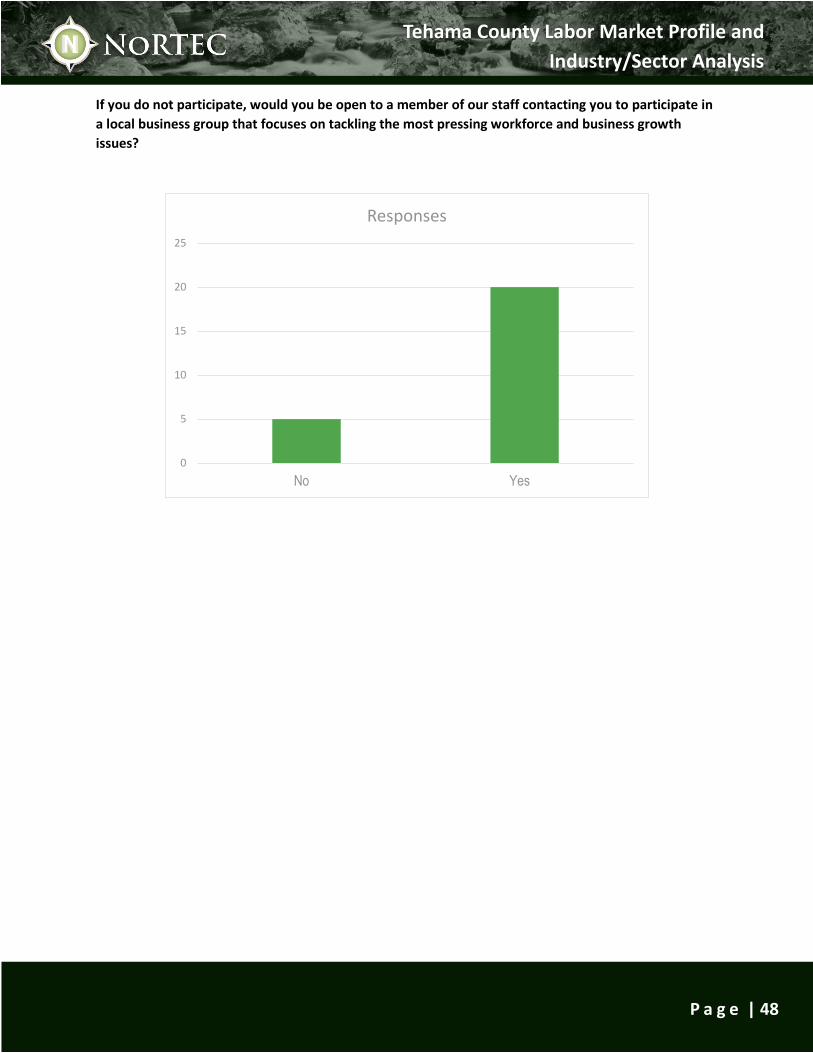
P a g e | 48 C o n t e n t s
Tehama County Labor Market Profile and
Industry/Sector Analysis
P a g e | 48
If you do not participate, would you be open to a member of our staff contacting you to participate in
a local business group that focuses on tackling the most pressing workforce and business growth
issues?
0
5
10
15
20
25
No Yes
Responses