the causes and consequences of economic restructuring
TRANSCRIPT

Finance and Economics Discussion SeriesDivisions of Research & Statistics and Monetary Affairs
Federal Reserve Board, Washington, D.C.
The Causes and Consequences of Economic Restructuring:Evidence from the Early 21st Century
Andrew Figura and William Wascher
2008-41
NOTE: Staff working papers in the Finance and Economics Discussion Series (FEDS) are preliminarymaterials circulated to stimulate discussion and critical comment. The analysis and conclusions set forthare those of the authors and do not indicate concurrence by other members of the research staff or theBoard of Governors. References in publications to the Finance and Economics Discussion Series (other thanacknowledgement) should be cleared with the author(s) to protect the tentative character of these papers.

THE CAUSES AND CONSEQUENCES OF ECONOMIC RESTRUCTURING: EVIDENCE FROM THE EARLY 21ST
CENTURY
Andrew Figura and William Wascher*
Board of Governors of the Federal Reserve System
August 2008
JEL codes: E24, E32, J24, J64 Keywords: industrial restructuring, permanent job loss
Abstract
A number of industries underwent large and permanent reductions in employment growth at the beginning of this decade, a process we label as restructuring. We describe how restructuring occurred and what its consequences were for the economy. In particular, we find that restructuring stemmed largely from relative demand shocks (though technology shocks were important in some industries) and that elevated levels of permanent job destruction and permanent layoffs were distinguishing features of industries subject to restructuring. In addition, most workers displaced in restructuring industries relocated to other sectors. While this process of reallocation led to large increases in productivity (and a reduction in labor’s share) in industries shedding workers, it also resulted in prolonged periods of unemployment for displaced workers. Moreover, relocating workers suffered sizable reductions in earnings, consistent with substantial losses in their specific human capital. Putting these pieces together, we estimate the cost of restructuring to have been between ½ and 1 percent of aggregate income per year. *Leslie Carroll provided excellent research assistance. The views expressed in this paper are the authors’ and do not necessarily those of the Federal Reserve Board.

I. Introduction The influence of structural adjustment and labor reallocation on the cyclical
behavior of employment and productivity has been a long-standing issue in economics.1
More recently, the performance of the labor market in the early part of this century,
which was characterized by a series of extended job losses from the beginning of the
2001 recession through 2003, has reignited this interest. One explanation that has been
offered for the prolonged weakness in employment that followed the 2001 recession is
that this period was characterized by an unusual amount of economic restructuring
relative to that in previous recessions and early recoveries. Groshen and Potter (2003),
for example, report that, by their metric, 79 percent of industries could be characterized
as restructuring in the 2001 downturn and subsequent recovery, compared with 50 to 60
percent of industries in the previous three business cycles.2 However, other researchers,
notably Aaronson, Rissman, and Sullivan (2004), disagree with this assessment. In
particular, these authors argue that the extent of restructuring between 2001 and 2003 was
below that in previous episodes.
One problem with interpreting analyses of restructuring and labor markets is that
the results are typically based on summary statistical measures that are derived from a
particular set of assumptions about the way in which restructuring occurs. For example,
Groshen and Potter measure the degree of restructuring as the percentage of industries
that experienced either increases in employment both during the recession and early
recovery or declines in employment in both periods, while Aaronson, Rissman, and
Sullivan define restructuring as the deviation of changes in employment shares from
1 See, for example, the exchange between Lilien (1982) and Abraham and Katz (1986). 2 In addition, Gordon (2003) and Oliner, Sichel and Stiroh (2007) argue that the large gains in productivity during this period were partly the result of economic restructuring.

- 2 -
“normal” cyclical behavior. As the differing conclusions of the aforementioned studies
suggest, the results tend to be sensitive to the way in which these summary statistics are
constructed.
In this paper, we take a different approach by digging beneath the summary
statistics to identify the sectors that appeared to be most affected by restructuring. In
particular, we look for industries that experienced unusually poor labor market
performance in the early part of this decade and assess the behavior of these
underperforming industries to characterize the process of restructuring. Specifically,
after identifying a set of restructuring industries, we proceed to examine cross-industry
correlations of changes in employment, productivity, and output to distinguish among
some of the competing hypotheses concerning the source of permanent job losses during
that period. We find that the primary cause of restructuring appears to have been a series
of industry-specific demand shocks that amplified what was already a declining trend in
demand in a number of important industries, although technological change also played a
role in a few key sectors.
Next, we examine how restructuring took place. Perhaps not surprisingly, we find
that the distinguishing feature of restructuring industries was a relatively heavy reliance
on job destruction, although a reduced pace of job creation was also evident in these
industries. In contrast, nonrestructuring industries relied exclusively on reduced job
creation to slow employment growth. In addition, increases in job destruction in
restructuring industries were accompanied by very large increases in permanent layoffs,
and a large share of these permanently laid off workers needed to leave their previous

- 3 -
industries to become reemployed. Thus, our results suggest that labor reallocation was an
important feature of the economic landscape in the first half of the decade.
We also examine some of the consequences of restructuring for overall economic
activity. Reallocation of factor inputs is likely to have two effects. First, a reduction in
the utilization of resources is likely to occur during the period required to move workers
and capital out of restructuring sectors and into new employment; this lower utilization
could be reflected either as low productivity growth or high unemployment. Second,
some capital specific to restructuring industries may be destroyed if it loses its value
when transferred elsewhere.
We find that utilization was indeed reduced during restructuring, but that this
reduction showed up predominantly as high unemployment. Because firms in
restructuring industries were quick to shed unneeded labor, worker displacements rose
dramatically as did the time required for workers to find new employment. The slow
transition of these displaced workers into expanding industries seems to have been an
important reason for the slow recovery of the labor market following the 2001 recession.
On the other hand, productivity, after an initial downturn, rose quite robustly in
restructuring industries, and labor’s share, after rising noticeable over the late 1990s,
declined from 2001 to 2003. Thus, restructuring also appears to have been an important
source of the robust gains in productivity and corporate profitability experienced during
that period.
We also find that restructuring resulted in the destruction of significant amounts
of specific capital. One indication of this is that displaced workers who were reemployed
outside their original industries experienced a large drop in earnings, while displaced

- 4 -
workers able to remain in their previous industry of employment experienced relatively
modest declines.
Putting these pieces together, we show how our estimates of utilization and
income loss can be used to assess the welfare costs of restructuring. We estimate these
costs to have been substantial—between 1/2 percent and 1 percent of aggregate income
per year—suggesting that restructuring had an important influence on economic activity
and well-being in the first years of the decade.
The rest of the paper is organized as follows. The next section describes our
framework for identifying restructuring industries and presents the particular
classification that results from implementing this framework. We then turn in section III
to examine the sources of restructuring before describing in section IV how restructuring
took place. Sections V and VI examine the implications of restructuring for the
aggregate economy, and Section VII concludes.
II. Identifying Restructuring Sectors
To identify industries that experienced significant amounts of restructuring during
the early part of this decade, we examine how employment patterns in the recent
downturn differed across sectors.3 In particular, for each industry we compute the
difference between the average percent change in employment between 2000 and 2003
and the average percent change in employment from 1990 to 2000; the 1990s period is
assumed to be a rough indicator of trend growth in each industry prior to the 2001
recession.
3 We adopt the industry breakdown used by the Bureau of Economic Analysis (BEA) in its publication of gross output by industry. For the private nonfarm sector, the BEA publishes annual data on output and employment for 59 industries.

- 5 -
We then use two criteria and some judgment to define persistently
underperforming, or restructuring, industries. First, an industry must have experienced a
large drop in its average percent change in employment between 1990-2000 and 2000-
2003, relative to other industries, to be characterized as underperforming. In this sense,
underperformance is measured by an industry’s relative deviation from its previous
employment trend. Second, trend employment growth in an underperforming industry
after 2003 must have remained considerably below its 1990-2000 trend. Specifically, if
an industry’s average growth rate over 2003-2005 is less than the mid-point of its growth
rates over the 1990-2000 and 2000-2003 periods, then it also satisfies the second criteria.
In other words, an industry satisfies the second criteria if its post-2003 performance is
more similar to its 2000-2003 performance than to its 1990-2000 performance.
Table 1 ranks industries according to the change in their performance from 1990-
2000 to 2000-2003 (the third column; worst to best). Of the 29 industries with relative
employment performance below the median (warehousing), 16 also had post-2003
employment growth that more closely resembled their 2000-2003 performances than their
1990-2000 performances. We amended this list of industries to include computer
systems design and related services because it was near the borderline of qualification
under our second criterion and it was the industry with the largest deterioration in relative
performance from 1990-2000 to 2000-2003. We also included chemical manufacturing
because it satisfied the second criteria and was close to satisfying the first. In contrast,
we excluded the apparel and leather manufacturing industry from our list because its
post-2000 declines looked little different from its trend over the late 1990s. The 17
remaining industries are highlighted in bold type in the table. Their employment

- 6 -
performances over the 1990-2003 period are also shown in figure 1. Because the post-
2000 period was one of persistent underperformance for these industries, we label them
as restructuring.
These restructuring industries accounted for 13.5 percent of employment in 2000
and experienced net job losses totaling 2,478,000 between 2000 and 2003—more than the
decline in total nonfarm payroll employment over this period. Thus, in terms of
aggregate employment loss, these industries were very important. Restructuring
industries also accounted for a large share (37 percent) of the change in employment
growth from 1990-2000 to 2000-2003. Nevertheless, three industries—administrative
support, retail trade, and construction—that made large contributions to the change in
employment growth from 1990-2000 to 2000-2003 were not restructuring industries
according to our criteria because all experienced reasonably strong employment growth
in 2004 and 2005. This suggests that while restructuring was an important part of the
2000-2003 deceleration in employment, temporary or cyclical employment losses also
played a role.
Although restructuring industries are similar in terms of their persistent relative
underperformance between 2000 and 2005, they differ considerably in some other
respects. For example, the dispersion across industries in the average rates of
employment growth during the 1990s is quite wide. A number of industries classified as
restructuring in the early 2000s enjoyed employment gains in the 1990s at a pace well
above the average rate for the private sector as a whole; indeed, computer systems design
and related services was one of the fastest growing industries in the 1990s, and
information and data processing services, broadcasting and telecommunications, and

- 7 -
motion pictures and sound recording all posted robust gains as well. In contrast, other
industries, including paper products, chemical products, electrical equipment, primary
metals, and textile mills, experienced below-average growth rates or outright employment
declines over the 1990s. Finally, employment growth in some industries, including
motor vehicle and parts production, publishing, and plastics and rubber products, was
close to the average growth rate over the 1990s for the private sector as a whole.
By economic sector, restructuring industries can be reclassified into four broad
groups: high-tech (both services and manufacturing); the information and entertainment
sectors; nondurable and durable manufacturing excluding high-tech; and airlines and
other miscellaneous industries. Each of these broad sectors has been associated
anecdotally with restructuring activities, often with what seem to be idiosyncratic
explanations.
With regard to the high-tech sector, for example, soaring investment in high-tech
capital (computers, communications equipment, and software) in the second half of the
1990s provided substantial impetus both to computer electronics manufacturing and to
the computer systems design and the information and data processing services industries.
However, the economic environment for these industries changed abruptly with the onset
of the 2001 recession, when investment in high-tech equipment and software dropped
sharply and remained depressed through early 2004. As businesses reduced spending on
IT capital, they also cut back on the purchases of IT services. In addition, some
observers have speculated that demand for IT services shifted from U.S. to foreign
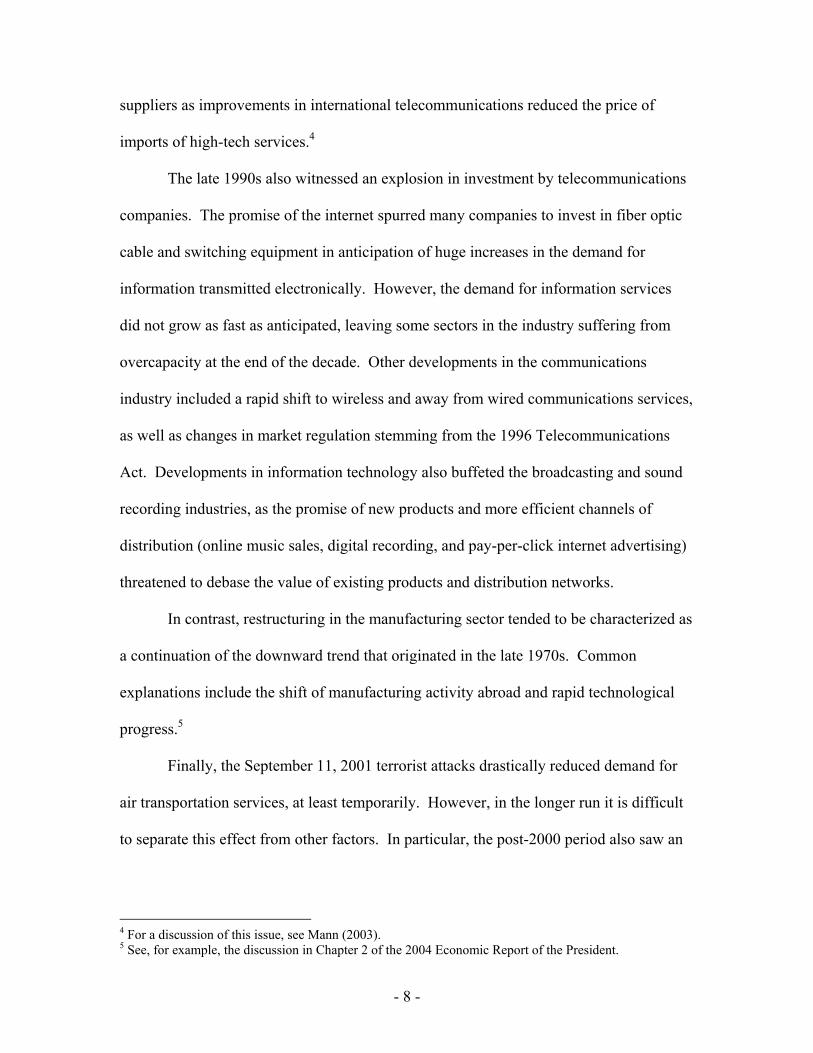
- 8 -
suppliers as improvements in international telecommunications reduced the price of
imports of high-tech services.4
The late 1990s also witnessed an explosion in investment by telecommunications
companies. The promise of the internet spurred many companies to invest in fiber optic
cable and switching equipment in anticipation of huge increases in the demand for
information transmitted electronically. However, the demand for information services
did not grow as fast as anticipated, leaving some sectors in the industry suffering from
overcapacity at the end of the decade. Other developments in the communications
industry included a rapid shift to wireless and away from wired communications services,
as well as changes in market regulation stemming from the 1996 Telecommunications
Act. Developments in information technology also buffeted the broadcasting and sound
recording industries, as the promise of new products and more efficient channels of
distribution (online music sales, digital recording, and pay-per-click internet advertising)
threatened to debase the value of existing products and distribution networks.
In contrast, restructuring in the manufacturing sector tended to be characterized as
a continuation of the downward trend that originated in the late 1970s. Common
explanations include the shift of manufacturing activity abroad and rapid technological
progress.5
Finally, the September 11, 2001 terrorist attacks drastically reduced demand for
air transportation services, at least temporarily. However, in the longer run it is difficult
to separate this effect from other factors. In particular, the post-2000 period also saw an
4 For a discussion of this issue, see Mann (2003). 5 See, for example, the discussion in Chapter 2 of the 2004 Economic Report of the President.

- 9 -
acceleration in the transfer of market share from so-called legacy airlines to lower-cost
start-ups, with uncertain effects on the level of employment in the industry.
In sum, anecdotal evidence suggests that a broad array of factors may have caused
employment in restructuring industries to exhibit a greater and more persistent
deceleration than in other industries. With these explanations in mind, in the next section
we assess the extent to which the performance of restructuring industries was driven
primarily by supply or demand shocks. In particular, we use a very simple model to
generate predictions about how the correlations between movements in employment,
output, wages, prices, and productivity should be related to the nature of the shock
experienced by an industry. We then compare these predicted correlations to those
observed in the data.
III. Evidence on the Causes of Restructuring
To investigate the types of shocks affecting restructuring industries, we use a
simple framework that assumes a constant returns to scale production function, a constant
elasticity of demand curve for industry output and a constant elasticity of supply schedule
for industry labor:
1/
t t t
t t t
rt t
Q A L
Q p
L w
εξ −
=
=
=
where Q refers to output, A is a technology parameter, ξ is a demand shift parameter, p is
the price of output, L is labor, and w is the real wage. An industry will hire labor until the
marginal revenue of an extra unit of labor equals the wage rate. This implies
11 111 11 11
r
t t tL Ar
ε εεξε
⎛ ⎞− − −⎜ ⎟⎝ ⎠
⎛ ⎞⎛ ⎞= −⎜ ⎟⎜ ⎟⎜ ⎟⎝ ⎠⎝ ⎠

- 10 -
From this setup, we can derive the relationship between each of these variables and the
industry-specific supply and demand shocks (A and ξ , respectively).
The implications of a permanent demand shock that reduces labor input are
relatively straightforward. In particular, output and prices will both fall in response to the
shock, so that the correlations of the change in labor input with changes in these variables
will be positive. In contrast, the correlation between labor input and productivity is
ambiguous (because L and Q both fall). If the decline in labor input associated with the
negative demand shock is concentrated at relatively inefficient firms (a “shakeout”
effect), then the correlation between changes in labor input and changes in productivity at
the industry level would be negative. However, if the demand shock reduces average
labor utilization (or effort) in the industry, then the correlation between changes in labor
input and changes in productivity would be positive.
Conditional Comovements
Shock ( , )c Q p ( , )c Q L , Qc LL
⎛ ⎞⎜ ⎟⎝ ⎠
( ),c w L
Demand + + ? +
Supply (with 1ε < ) - + + +
Supply (with 1ε > ) - - - +
The implications of a supply shock are somewhat more complicated. In general,
supply shocks impart a negative comovement between prices and output. However, the

- 11 -
correlations between labor input and output and between labor input and productivity
depend on the price elasticity of product demand (-ε). If the absolute value of this
elasticity is greater than 1, then these comovements will be positive. If it is less than 1,
then these comovements will be negative. The table above summarizes the correlations
between output, prices, labor input, and productivity predicted by this model for demand
(ξ ) and supply (A) shocks. In the absence of a labor supply shock, the correlation
between wages and employment will be positive regardless of whether the goods market
shock is one of demand or supply.
To measure these comovements in the data, we first calculate the change in the
growth rate of each variable from 1990-2000 to 2000-2003 by industry. We then
aggregate the relevant industry-level cross products using industry employment shares as
weights. For example, for a group of industries I:
( )2 2
,i i i
i II
i i ii I
sh Q pc Q p
sh Q p∈
∈
Δ Δ=
Δ Δ
∑
∑
where ish is the mean employment share for industry i from 1990 to 2000 and
2003 2000
2001 19911 1
2003 2000
2001 19911 1
log log
log log
it iti
t tit it
it iti
t tit it
Q QQQ Q
p ppp p
= =− −
= =− −
⎛ ⎞ ⎛ ⎞Δ = −⎜ ⎟ ⎜ ⎟
⎝ ⎠ ⎝ ⎠⎛ ⎞ ⎛ ⎞
Δ = −⎜ ⎟ ⎜ ⎟⎝ ⎠ ⎝ ⎠
∑ ∑
∑ ∑
Table 2 shows these aggregated cross products for our set of restructuring
industries, as well as for the set of nonrestructuring industries. Taken as a whole, the
cross products suggest that adverse changes in relative demand were the primary cause of
restructuring: For restructuring industries as a group, the estimated comovements

- 12 -
between output and prices, output and employment, and employment and wages are all
positive. Moreover, it appears that the shake out effect of demand changes outweighed
the utilization effect, causing a negative comovement between productivity and
employment changes. For the sake of comparison, we also report results for
nonrestructuring industries, where cross products are consistent with supply shocks in
output markets playing a more important role than in restructuring industries:
Correlations between employment and output are positive, while those between output
and prices and employment and productivity are negative.6
Table 3 shows the industry-specific cross products for the restructuring group of
industries. Of the 17 restructuring industries, 12 exhibit correlations consistent with
relative demand shocks, with output growth, inflation and employment growth all
decreasing between 1990-2000 and 2000-2003.7 In addition, 11 of these 12 industries
experienced a “shakeout” effect, with productivity growth accelerating as labor demand
declined.
IV. How did Restructuring Occur?
How restructuring occurred bears importantly on its economic effects and costs.
If restructuring affected the demand for capital as well as the demand for labor, then its
economic effects and costs likely extended beyond the labor market. Moreover, if
6 In particular, several industries—including ambulatory health care services and credit intermediation—appear to have benefited from positive supply shocks. Ambulatory health care services (a trend increasing industry) may have benefited from a looser labor market in 2000-2003, making it easier and less expensive to recruit new workers. Credit intermediation may have benefited from the sharp reduction in short-term interest rates over this period. 7 Three industries exhibited cross products more consistent with positive supply shocks, with all three cross products negative. These cross products could also be consistent with positive technology shocks biased against labor if the elasticity of substitution between labor and other factors of production is greater than 1. For example, the comovements for information and data processing services are consistent with advances in telecommunications technology making possible the substitution of lower-priced labor overseas for domestic labor.

- 13 -
restructuring occurred primarily through the destruction of jobs and capital, then its costs
were likely greater than if it occurred through a slowing in their creation.
To investigate whether restructuring affected the demand for capital, we examine
data on establishment openings and closings for the private sector and data on plant
capacity in the manufacturing sector. That is, we assume that the opening and closing of
establishments and the creation and destruction of plant capacity involved changes in the
demand for capital as well as jobs. Unfortunately, the data on plant openings and
closings are available only at the one-digit NAICS level from the BLS’s Business
Employment Dynamics statistical program. However, most of the industries we
identified as restructuring were in either manufacturing or information, and so we use
those one-digit NAICS categories to approximate the restructuring sector.
If the amount of capital at a plant is proportional to its number of employees, then
we can estimate the net change in plant capital by examining the net change in
employment due to plant openings and closings from 1991:Q3 to 2000:Q4 and 2000:Q4
to 2003:Q4. The top panel of table 4 shows that the percent change in employment due
to openings and closings in restructuring industries fell from about 0 in the 1990s to -0.3
percent per quarter from 2000:Q4-2003:Q4. This was only slightly larger than the
change in the contribution of plant openings and closings to net employment growth in
nonrestructuring industries over this period.
Data on changes in plant capacity from the Federal Reserve Board for two-digit
manufacturing industries over the periods 1990 to 2000 and 2000 to 2003 are shown in
the bottom panel of table 4. For all restructuring manufacturing industries, the average
annual percent change in capacity was considerably smaller over the 2000-2003 period
- 14 -
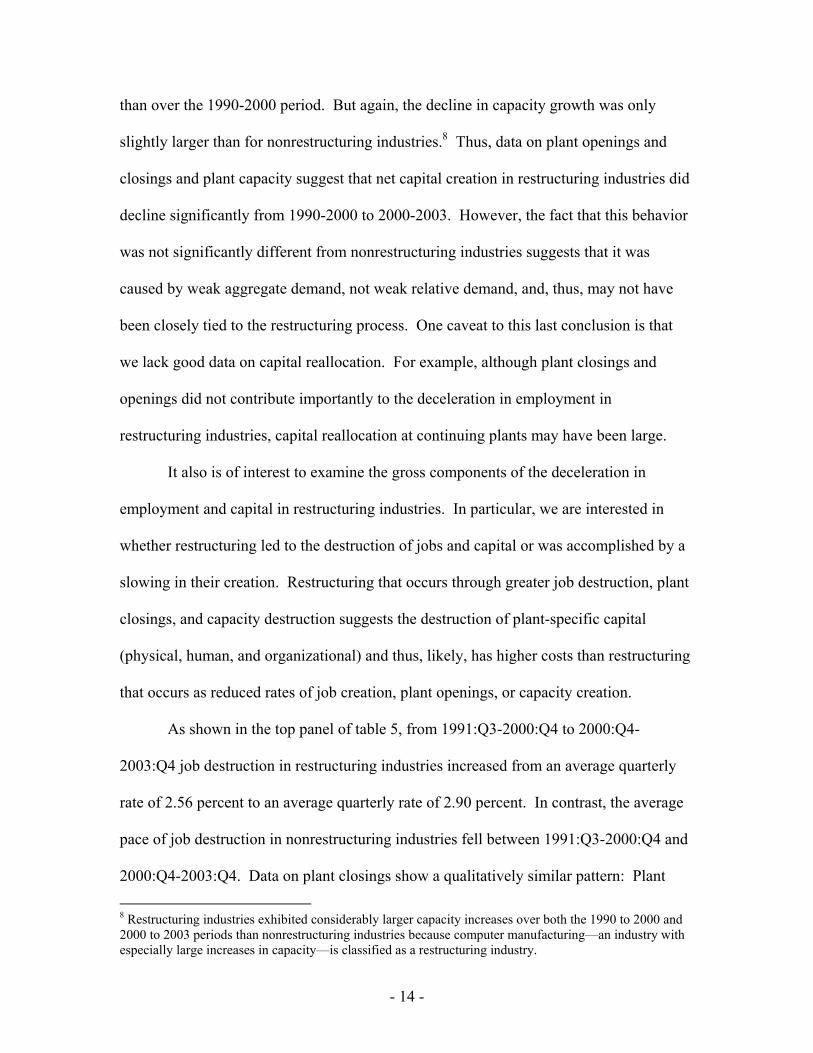
than over the 1990-2000 period. But again, the decline in capacity growth was only
slightly larger than for nonrestructuring industries.8 Thus, data on plant openings and
closings and plant capacity suggest that net capital creation in restructuring industries did
decline significantly from 1990-2000 to 2000-2003. However, the fact that this behavior
was not significantly different from nonrestructuring industries suggests that it was
caused by weak aggregate demand, not weak relative demand, and, thus, may not have
been closely tied to the restructuring process. One caveat to this last conclusion is that
we lack good data on capital reallocation. For example, although plant closings and
openings did not contribute importantly to the deceleration in employment in
restructuring industries, capital reallocation at continuing plants may have been large.
It also is of interest to examine the gross components of the deceleration in
employment and capital in restructuring industries. In particular, we are interested in
whether restructuring led to the destruction of jobs and capital or was accomplished by a
slowing in their creation. Restructuring that occurs through greater job destruction, plant
closings, and capacity destruction suggests the destruction of plant-specific capital
(physical, human, and organizational) and thus, likely, has higher costs than restructuring
that occurs as reduced rates of job creation, plant openings, or capacity creation.
As shown in the top panel of table 5, from 1991:Q3-2000:Q4 to 2000:Q4-
2003:Q4 job destruction in restructuring industries increased from an average quarterly
rate of 2.56 percent to an average quarterly rate of 2.90 percent. In contrast, the average
pace of job destruction in nonrestructuring industries fell between 1991:Q3-2000:Q4 and
2000:Q4-2003:Q4. Data on plant closings show a qualitatively similar pattern: Plant
8 Restructuring industries exhibited considerably larger capacity increases over both the 1990 to 2000 and 2000 to 2003 periods than nonrestructuring industries because computer manufacturing—an industry with especially large increases in capacity—is classified as a restructuring industry.

- 15 -
closings in restructuring industries increased slightly from 1991:Q3-2000:Q4 to 2000:Q4-
2003:Q4, while closings decreased in nonrestructuring industries.
As indicated in the bottom panel, quarterly rates of job creation fell by about ½
percentage point from 1991:Q3-2000:Q4 to 2000:Q4-2003:Q4 in both restructuring and
nonrestructuring industries. Data on plant openings are qualitatively similar, though
declines were somewhat larger in nonrestructuring industries. Thus, restructuring
industries adjusted employment along both job destruction and job creation margins.
Importantly, this pattern was different than other industries, where the adjustment
occurred exclusively on the creation margin. From these data, it appears that a
distinguishing feature of restructuring from 2000-2003 was its reliance on job
destruction. Further, the adjustment along the job destruction margin in restructuring
industries appears to have occurred predominantly at continuing plants.9
The data on manufacturing capacity are aggregated to the industry level and thus
do not allow us to measure gross plant reductions and increases in capacity.
Nevertheless, we can look at whether individual industries experienced net reductions in
capacity during 2000-2003. For six of the eleven restructuring manufacturing industries
capacity declined from 2000-2003, and for five of the six, the decline was greater than 1
percent per year. In comparison, three of eight nonrestructuring industries reduced
capacity in the 2000-2003 period, and two of those three industries reduced capacity by
more than 1 percent per year. In sum, the capacity data together with data on plant
closings suggest that restructuring industries relied more heavily on the destruction
margin than did nonrestructuring industries—both for changes in jobs and in capital.
9 The importance of job destruction in restructuring industries relative to nonrestructuring industries is undoubtedly due, at least in part, to manufacturing being a trend declining industry with little scope to react to a reduction in demand by reducing job creation.

- 16 -
Finally, table 6 shows data on total and permanent layoffs for restructuring and
nonrestructuring industries.10 From 1994-2000 to 2001-2003, the average monthly layoff
rate in restructuring industries increased from 0.89 percent to 1.18 percent, a noticeably
larger increase than in nonrestructuring industries. Even more striking, the average
monthly permanent layoff rate in restructuring industries increased from 0.41 percent to
0.63 percent over the same period, again a noticeably larger increase than in
nonrestructuring industries.
In sum, the data suggest that a sizable portion of the decline in the rate of
employment change from 1990-2000 to 2000-2003 in restructuring industries was
accomplished by a destruction of both jobs and capital. This contrasts with
nonrestructuring industries, which relied more on the creation margin to adjust
employment and capital, and suggests that the costs of restructuring, in terms of the need
to reallocate workers and capital across industries, were possibly quite large.
V. The Economic Impact of Restructuring
The reallocation of physical or human capital caused by restructuring is costly if
some of this capital is specific to its original industry. Previous research suggests that
this is the case. For example, Ruhm (1991), Topel (1991), and Neal (1995) all find that a
significant fraction of workers’ compensation derives from human capital specific to their
firm or industry. Similarly, Ramey and Shapiro (2001) find in their study of the aircraft
industry that a large portion of physical capital is industry specific. In addition, Bahk and
Gort (1993) and Rapping (1965) argue that organizational capital is often acquired via
10 The industry classification scheme in the CPS switched from an SIC basis to a NAICS basis in 2002. We develop a concordance between the two classifications that yields a fairly consistent definition of industry pre and post 2002. This requires a less disaggregated classification than the BEA’s (33 industries instead of 59). We label any CPS industry containing a BEA restructuring industry as restructuring. 13 of the 33 industries are restructuring and account for about 23 percent of employment.

- 17 -
learning through experience about specific production processes; when production
processes are scrapped, much of this specific knowledge loses its value. Finally,
Corrado, Hulten and Sichel (2004) point out that a firm’s investments usually include
intangible capital (e.g. brand recognition and loyalty through advertising, relationship
building with suppliers and clients, and organizational capital) as well as tangible capital.
By its nature, much of this intangible capital is also specific to the firm.
Because of the specificity of many types of capital investments to the firm or
industry, it may take time for factors of production to become fully reemployed following
a decline in the output previously produced with those inputs. As a result, one likely cost
of restructuring is reduced resource utilization. Two manifestations of declines in
resource utilization are reductions in productivity and increases in unemployment. How
productivity responds to relative demand shocks depends on the speed at which the
economy is able to move resources out of declining sectors. This, in turn, depends on the
specificity of capital and on factors that impede the reallocation of resources.11 Examples
of such factors include policies that limit the ability of firms to reduce employment
(Hopenhayn and Rogerson, 1993) or policies that subsidize inefficient firms (Caballero,
Hoshi, and Kashyap, 2004). If capital is very specific to an industry and/or if significant
inefficiencies exist, then the effect of restructuring on productivity can be prolonged, with
persistent effects on the macroeconomy.
Figure 2 shows the behavior of labor productivity in restructuring and
nonrestructuring industries after trends (as estimated by average productivity growth
11 In particular, Ramey and Shapiro (2001) find that the time required for reallocation is proportional to the specificity of capital, while Eisfeldt and Rampini (2003) find that liquidity in secondary physical capital markets is procyclical. This latter result suggests that the cost of moving resources out of restructuring industries will be higher if restructuring is concentrated in downturns.

- 18 -
from 1990 to 2000) are removed. Not surprisingly, given the relative shift in demand
across sectors, productivity declined in 2001 in restructuring industries relative to the rest
of the private economy. However, the subsequent recovery in productivity in
restructuring industries after 2001 was very rapid, suggesting that an unduly slow
movement of resources out of restructuring industries did not significantly hamper
economic activity after the 2001 recession.12
Another potential manifestation of reduced resource utilization is higher
unemployment. When human capital acquired in former industries is not easily
transferred to new industries, workers losing jobs in restructuring industries may require
considerable time and retraining before finding new job matches.13 To examine the
importance of this effect in the early 2000s, we use the 2000 and 2004 Displaced Worker
Surveys (DWS) to see whether restructuring industries were a disproportionate source of
displaced workers over the 2001-2003 period relative to the 1997-1999 period and
whether nonemployment durations for these workers were noticeably longer than for
workers displaced from nonrestructuring industries.14
Table 7 presents average displacement rates for the 1997-1999 and 2001-2003
periods. For the group of restructuring industries as a whole, the average displacement
rate from 2001-2003, at 6.86 percent of employment, was nearly four times as high as the
rate from nonrestructuring industries.15 Moreover, displacement rates in restructuring
12 One caveat to this result is that our estimates of the recovery of productivity in restructuring industries may be biased upwards. By identifying restructuring industries as those with relatively larger and more persistent employment declines, we have introduced a selection bias against finding a sluggish response of productivity to a drop in relative demand. 13 In support of this hypothesis, Loungani and Rogerson (1989) show that unemployment spells for workers who permanently change industries are longer lasting than other unemployment spells. 14 Because displacement is defined as a job loss that occurred as a result of a plant closing, insufficient work, or a position being abolished, these job losses were likely involuntary. 15 To compute displacement rates we use CPS measured employment in the denominator.

- 19 -
industries increased by 4.5 percentage points between the pre-2000 and post-2000
periods, while the displacement rate in nonrestructuring industries was essentially
unchanged over that period.16
In addition, we can use the DWS data to estimate the length of nonemployment
spells for workers displaced from their previous job. For workers reemployed at the time
of the DWS, we use the reported duration of post-displacement nonemployment as the
length of the spell. For workers who were not yet reemployed at the time of the DWS,
we calculate the observed duration of the incomplete nonemployment spell as the
reference date of the survey (the week of February 12) minus the midpoint of the reported
year of displacement and then adjust the spell to take account of the censoring of the
observed spells. More specifically, we estimate the completed duration of
nonemployment spells for the censored observations as the number of weeks of observed
nonemployment plus 1μ
, whereμ is a constant hazard rate estimated from the observed
completed spells.17 We then take the average of nonemployment durations for workers
with completed and uncompleted spells, where we substitute an estimate of expected
durations when actual durations are censored.
The middle panel of table 7 reports the estimated average nonemployment spell
for restructuring and nonrestructuring industries. According to these estimates, workers
displaced in the late 1990s averaged a little less than 20 weeks of nonemployment in both
sets of industries. In restructuring industries, nonemployment durations nearly doubled
16 Displacement rates in nonrestructuring industries rose noticeably in 2001, but they subsequently dropped off, leaving the average 2001-2003 displacement rate little different from its 1997-1999 average. 17 In fact, hazard rates appear to be slightly U shaped, decreasing from 0 to 50-75 weeks and then increasing thereafter, though the limited number of completed long-duration spells increases the uncertainty of the slope as duration increases. We also computed nonemployment durations without adjusting for censoring. Results were qualitatively similar to the results adjusting for censoring that we report here.

- 20 -
during the 2001-2003 period to more than 35 weeks, a considerably larger increase than
in nonrestructuring industries.
Because workers from restructuring industries suffered relatively high rates of
displacement from 2001 to 2003 and because once displaced these workers incurred
relatively long nonemployment spells, restructuring increased the level of aggregate
nonemployment and thus reduced the utilization of resources in production during this
period. To roughly quantify this effect, we can calculate steady state worker utilization
rates using average displacement rates and hazard rates in the same two periods: 1997-
1999 and 2001-2003. In particular, we define the steady state utilization rate u as:18
1 dud H
= −+
where d is the average displacement rate and H is the average hazard rate out of
nonemployment, computed as the inverse of the average nonemployment rate duration.19
The steady state utilization rate of workers from restructuring industries fell from around
99.1 percent from 1997-1999 to 95.6 percent from 2001-2003. The decrease in
nonrestructuring industries was much more modest, from 99.4 percent to 99.1 percent.
Thus, while firms in restructuring industries appeared to shed unneeded resources fairly
promptly, these resources required an extended period of time to find new employment.
18 The ratio
dd H+
is analogous to a steady state rate of unemployment. As shown by Shimer (2005),
steady state unemployment rates track actual unemployment rates quite closely over the business cycle. Although exit rates from nonemployment for displaced workers are, on average, lower than exit rates from unemployment for all workers—leading to a larger discrepancy between actual and steady state rates—the steady state approximation is still informative. 19 This equation follows from the steady state condition that (1 ) 0t t te H e d e= ∗ − − ∗ = , where e represents employment. We implicitly assume that nonemployed displaced workers were available for work and thus contributed to reduced resource utilization.

- 21 -
A second type of cost associated with restructuring is the loss in income from
capital specific to the restructuring industries. The flow of income lost includes both the
lost earnings attributable to the labor and capital that are displaced from restructuring
industries and the change in earnings for the labor and capital that remain. A measure of
the lost income for human capital displaced from restructuring industries is available
from the DWS. In particular, we can calculate the change in the average earnings of
displaced workers as a percent of pre-displacement average earnings for these workers.20
Table 8 shows this calculation separately for displaced workers in restructuring
and nonrestructuring industries and by whether the workers were reemployed in their
original industry or in a different industry. As a group, displaced workers from
restructuring industries experienced a decline in average earnings of 15½ percent. For
the 70 percent of displaced workers switching industries, the decline in average earnings
was larger (21.2 percent) than for workers not switching industries (3.3 percent). Thus,
the implied loss of human capital is substantial, although it is important to note that the
estimated magnitude of the loss depends critically on the assumption that changes in
wages reflect changes in marginal products and not changes in rents. Displaced workers
in nonrestructuring industries also saw a sizable drop in average earnings, although, as
indicated in Table 7, the displacement rates in these industries were considerably lower.
To estimate the loss in earnings of nondisplaced capital, we compare price
changes in restructuring industries with price changes in nonrestructuring industries. The
basic intuition underlying this calculation is that the value-added price deflator for
20 Following the literature (see, for example, Katz and Murphy, 1992), we multiply topcoded earnings by 1.5, based on the assumption of a Pareto distribution for earnings above the topcode limit with Pareto parameter k=2. About 1.4 percent of the observations relevant to the calculations in table 8 were adjusted in this way.

- 22 -
restructuring industries represents the return to capital and labor in these industries, so
that changes in earnings for capital and labor should be reflected in changes in the
deflator. Of course, changes in the deflator will reflect general inflation trends as well,
which we control for by subtracting out the average change in the price deflator for
nonrestructuring industries. In addition, we control for differing trends in productivity
and markups in restructuring and nonrestructuring industries using the average changes in
the deflator between 1990 and 2000.21 Thus, in essence, we use a triple differencing
procedure to estimate the losses.
The loss in earnings of nondisplaced specific capital in restructuring industries
can be equal to, greater, or smaller than the loss in earnings of displaced specific capital.
If specific capital is homogeneous within restructuring industries, then the decline in
earnings of displaced capital will equal the decline in earnings of capital not displaced.
In contrast, if capital is heterogeneous with respect to specificity, and demand shocks are
identical across firms within restructuring industries, then the decline in earnings of
displaced capital should provide a lower bound for the loss in earnings of capital that
remains in the restructuring sector because it is the relatively less specific capital that will
be displaced. Finally, heterogeneous demand shocks increase the likelihood that
displaced capital suffers greater earnings losses than nondisplaced capital because such
shocks make it more likely that workers suffering large declines in specific human capital
(or more-specific capital more generally) will be displaced and switch industries. In this
context, the larger loss in earnings for workers switching out of restructuring industries
21 As shown in section IV, correlations between real value added and the price deflator suggest that shocks that affected restructuring industries post 2000 were largely demand shocks. Thus, comparing average deflator changes from 1990-2000 to 2000-2003 should primarily reflect the relative change in demand for restructuring industries.

- 23 -
relative to those remaining in the sector suggests that heterogeneous demand shocks have
been an important source of restructuring.
Table 9 shows that the average rate of price change in restructuring industries fell
from -0.8 percent over the 1990-2000 period to -2.5 percent over the 2000-2003 period, a
difference of -1.7 percentage points. In contrast, in nonrestructuring industries, the
average change in prices was about the same in the two periods. The estimated
difference between the change in price inflation in the two sectors is -1.73 percentage
points and is statistically significant. If we exclude computer manufacturing from
restructuring industries, the results are similar, with a relative decline in the inflation rate
of -2.30 percentage points. These difference-in-differences estimates of the relative
changes in average prices over the two periods suggest that income for factors of
production specific to restructuring industries fell significantly in the post 2000 period,
even if these factors remained in their original industry.
It is also interesting to consider whether the declines in earnings were similar for
human and nonhuman (physical or organizational) capital. Although we lack data on
changes in the price of nonhuman capital displaced from restructuring industries, we can
use the behavior of labor’s share of total income to assess how changes in the total
returns to capital remaining in restructuring industries were distributed between human
capital and other capital. In this regard, Figure 3 indicates that from 1997 (the first year
of published data) through 2001, labor’s share rose rapidly in restructuring industries,
both in absolute terms and relative to labor’s share in nonrestructuring industries. Since
2001, however, labor’s share has fallen in restructuring industries in both absolute and
relative terms,

- 24 -
Possible explanations for the rise and decline in labor’s share in restructuring
industries include greater relative specificity of human capital, changes in technology,
and shifts in bargaining power between human and nonhuman capital. With regard to the
first possibility, theory suggests that a greater share of the change in income resulting
from a change in demand will be borne by the factor that has a greater proportion of
specific capital. Thus, the movements in labor’s share could be explained if human
capital is more specific than nonhuman capital. However, Ramey and Shapiro’s (2001)
study of the aircraft manufacturing industry suggests that the specificity of physical
capital is quite large, making it unlikely that human capital is even more specific.
Regarding the other possible explanations, although technology changes have
been ongoing over the 1990s, the 2001 recession may have increased the incentives or
lowered the costs of labor-saving technology adoption for firms. For example, employers
in restructuring industries may not have taken advantage of opportunities to increase
efficiency through reductions in labor input in the late 1990s, either because the cost of
reorganization, in terms of foregone output, was too high (Koenders and Rogerson,
2005), or because profits were above some threshold reference level (Rabin, 1998), so
that managers or owners of non-human capital had little incentive to increase efficiency
at that time. If so, these incentives likely changed abruptly after 2000, when profitability
dropped sharply. Spurred to action, managers may have instituted changes in production
processes to eliminate organizational inefficiencies and reduce labor’s share.22 At the
same time, improvements in the global transportation and telecommunications
infrastructure may have raised the bargaining power held by the owners of physical and
22 For an analysis of the large increases in productivity during this period, see Gordon (2003) and Oliner, Sichel and Stiroh (2007).

- 25 -
organizational capital by increasing the value of their outside opportunities. For example,
many companies at that time began to outsource their customer support services, data
entry work, and software writing, as well as other tasks, to countries with lower wages
and a significant number of educated English speakers.
VI. The Economic Costs of Restructuring
To estimate the overall economic costs of restructuring, we rely on a framework
provided by a simple two-sector model with sector-specific capital.23 This model, which
is described in the appendix, shows that the welfare cost of a relative demand shock can
be decomposed into two components. The first component is the cost of transferring
specific capital out of restructuring industries and into other industries. This cost
includes the lost income from specific capital for factors of production transferred across
sectors, as well as the time needed for these factors to become reemployed. The second
component is the misallocation of resources that results from the cost of transferring
sector-specific capital across sectors in response to a relative demand shock. As shown
in the appendix, unless the elasticity of demand in restructuring industries is very high,
the second component is likely to be negligible. Thus, we report costs only for the first
component.
We first consider the reduction in earnings from the lost specific capital of
workers displaced from restructuring industries. For this piece, we use the results
reported in table 8, which show a 17.9 percentage point difference in earnings loss
between displaced workers switching out of restructuring industries and displaced
23 Tapp (2008) takes a somewhat different approach to estimating the costs of restructuring. He calibrates a modified Mortensen and Pissarides (1994) style model to include industry-specific human capital and uses simulations from the model to calculate the welfare cost of a relative demand shock favoring resource-producing industries in Canada.

- 26 -
workers remaining in their original restructuring industry. However, as shown in the
appendix, to capture the welfare loss associated with destroyed specific capital, we need
to adjust this estimate to account for the difference in marginal utilities across industries
induced by the presence of specific capital.
More precisely, we assume that the marginal product of capital is constant, but
that when capital moves from restructuring to nonrestructuring industries, it is reduced by
the amount D T Tr nk k k= − , where T
rk is the amount of capital transferred out of
restructuring industries and Tnk is the amount of this capital reemployed in
nonrestructuring industries (because part of the capital transferred is specific to
restructuring industries, T Tr nk k> ). Thus, we would like to measure ( )T T
n k r np mp k k∗ ∗ − ,
where np is the price in the nonrestructuring sector (and under the assumption of perfect
competition also marginal utility) and mpk is the marginal product of capital. However,
what we measure in table 8 is T Tr k r n k np mp k p mp k∗ ∗ − ∗ ∗ . Because the cost of
transferring specific capital across industries prevents equalization of the marginal utility
product of capital across sectors, np will be greater than rp (there is an excess of capital
in restructuring sectors and a dearth in nonrestructuring sectors). As a result, the
calculations in table 8 are downward biased estimates of ( )T Tn k r np mp k k∗ ∗ − . However,
we can use the estimates of changes in prices in restructuring and nonrestructuring
industries to correct for this bias. The calculations shown in table 9 imply that the
average difference between pn and pr over 2000-2003 is 3.46 percent.24 Thus, we adjust
24 This figure is the average difference in the price levels in the two sectors resulting from the estimated cumulative relative decline in prices in the restructuring sector (1.73 percent per year for three years).

- 27 -
the estimate in table 8 of the income loss from destroyed specific capital upward by 3.46
percentage points to 21.36 percent.25
To compute a cost we must make an assumption about how persistent the
reduction in specific human capital is. We make two extreme assumptions: that the
reduction is permanent and that the reduction lasts one year. Under the first assumption
we compute the reduction in income in a year as the cumulative number of displacements
times the reduction in human capital per displacement. Under the second assumption we
compute the reduction in income in a year as the number of displacements per year times
the reduction in human capital per displacement. The average cumulative number of
displacements that switch industries over 2001-2003 is 1.75 percent of aggregate
employment, while the average number of displacements per year was 0.875 percent. 26
Multiplying the relevant number of displacements by the loss in earnings per
displacement times labor’s share of income (0.7) yields the total loss in income per year.
As shown in the first two entries in table 10, we estimate this to be 0.26 percent of
aggregate income per year if the loss in specific human capital is permanent and 0.13
percent if it is temporary. If reallocated specific physical capital experienced a loss in
income of a similar magnitude, the total income loss would increase to about 0.37 percent
per year if the reduction in specific capital is permanent and 0.18 percent of aggregate
25 As new specific human capital is acquired in the worker’s new industry, earnings should move back up toward previous levels. However, this reacquisition of capital may take some time and, for some workers (e.g. older workers) the costs of acquiring this new capital may exceed the benefits. As a result, the earnings loss from destroyed specific capital may extend beyond 2003. 26 The total number of workers displaced in restructuring industries from 2001-2003 was 5.1 million. Total employment (including self employment and government workers) over these years averaged 136.2 million. Dividing 5.1 by 136.2 yields 3.74 percent. Assuming that that displacement rates occurred approximately uniformly across 2001-2003, the average displacement rate per year was 1.25 percent and the average cumulative displacement rate was 2.5 percent. Multiplying each number by 0.7 (the share of displacements switching industries) yields 0.875 and 1.75, respectively.

- 28 -
income per year if it is temporary, where we compute the cost for physical capital to be
1αα−
times the cost for labor and α equals capital’s share of income.
We next consider the time cost of finding new employment for workers displaced
from restructuring industries. Table 7 shows that displaced workers who eventually
found employment outside their original industry were nonemployed for an average of a
little over 35 weeks (or 68 percent of a year). Multiplying this figure by labor’s share,
the proportion of workers displaced from restructuring industries each year, and the
proportion of displaced workers who switch industries yields an estimate of the time cost
of finding new employment for workers displaced from restructuring industries. As
indicated in the third row of table 10, we estimate this to be about 0.41 percent of annual
income per year. If the transfer of physical capital across industries was subject to a
similar time cost, the total time cost of restructuring would increase to 0.6 percent of
annual income.
The total cost, which is estimated to be between ½ and 1 percent of aggregate
income per year, is large and suggests that restructuring had an important effect on
economic welfare during the 2000-2003 period. However, movements of displaced
workers across industries occur all the time, and thus an important question is how much
of our estimated cost represents the effects of restructuring and how much is a
continuation from previous levels. To answer this question we can compare the 2000-
2003 period to the 1997-2000 period. In particular, the number of displaced industry
switchers in the earlier period was much smaller; similarly, both the difference in wage
changes between displaced workers switching industries and displaced workers
remaining in their original industry and the difference in the average duration of

- 29 -
unemployment for these two groups was noticeably less.27 As a result, we believe that
almost all of the cost of restructuring during the 2000-2003 period represented an added
burden to the economy.
A second question is whether our estimate of the cost of restructuring captures all
of the effects of the relative demand shocks that led to restructuring. The answer is likely
no. One reason is that such a large relative demand shock could have also acted as an
aggregate demand shock depressing activity in industries other than restructuring.28 In
that case, the full cost of restructuring should include not only the cost of moving
resources from restructuring to nonrestructuring industries but also at least some of the
decline in aggregate resource utilization. In addition, because the average rate of
permanent layoffs is considerably higher than rates of displacement, we may not be
counting all the workers affected by restructuring, directly or indirectly. On the other
hand, if, as suggested by Koenders and Rogerson (2004), the process of restructuring
helped to eliminate unusually large inefficiencies in restructuring industries, then we may
be overstating the cost of restructuring.
VII. Conclusion
In the 2001 recession and its aftermath, a number of industries suffered large and
permanent reductions in employment consistent with what previous researchers have
characterized as restructuring. In this paper, we have taken a closer look at developments
in these industries to assess the causes and consequences of this restructuring.
27 In an environment where demand is increasing and worker displacement is limited, it is likely that only workers with relatively small amounts of specific capital will choose to find new employment outside their original industries. This selection effect reduces differences in earnings changes between workers remaining in and workers switching out of restructuring industries relative to environments where demand is declining and displacement rates are high. 28 See, for example, Ramey and Shapiro (2001) and Phelan and Trejos (2000).

- 30 -
In principle, restructuring could occur in response to either supply or demand
shocks. We find that for most industries, the pattern of correlations between prices, value
added, wages, and productivity are more consistent with relative demand shocks being
the predominant cause. In particular, in the typical industry, the relative demand shock
led to a decline in labor demand and an increase in productivity, suggesting that the
effects of the shock were concentrated in the less efficient segments of the industry.
However, in a few industries, technology shocks (perhaps biased against labor) appeared
to be the source of restructuring.
With regard to the consequences of restructuring, our evidence suggests that the
economic costs were significant. Restructuring industries suffered more job destruction
and greater permanent layoffs than other industries, leading to a significant loss of capital
(human, physical, or organizational) specific to these industries. And, while the economy
appeared to react relatively efficiently in moving unneeded resources out of restructuring
industries, it took a considerable amount of time for these resources to be reemployed
elsewhere. As a result, the costs of restructuring were large. In particular, we estimate
that the cost to the aggregate economy, in terms of lost specific capital and the time
needed to transfer resources from restructuring industries to other sectors, was on the
order of between ½ percent and 1 percent of annual income per year from 2001 to 2003.

- 31 -
References
Aaronson, Daniel, Ellen R. Rissman, and Daniel G. Sullivan (2004), “Can Sectoral
Reallocation Explain the Jobless Recovery?” Federal Reserve Bank of Chicago
Economic Perspectives, vol. 28., no. 2, pp. 36-49.
Abraham, Katharine G., and Lawrence F. Katz, “Cyclical Unemployment: Sectoral Shifts
or Aggregate Disturbances?” Journal of Political Economy, vol. 94, no. 3, part 1,
pp. 507-522.
Bahk, Byong-Hyong, and Michael Gort (1993) “Decomposing Learning by Doing at
New Plants,” Journal of Political Economy, vol. 101, no. 4, pp. 561-583.
Bailey, Martin, and Robert Lawrence (2004), “What Happened to the Great U.S. Job
Machine? The Role of Trade and Electronic Offshoring,” Brookings Papers on
Economic Activity, no.2, pp. 211-270.
Caballero, Ricardo, Takeo Hoshi, and Anil Kashyap (2006), “Zombie Lending and
Depressed Restructuring in Japan,” NBER working paper no. 12129.
Corrado, Carol, Charles Hulten, and Daniel Sichel (2004), “Measuring Capital and
Technology: An Expanded Framework,” in Measuring Capital in the New
Economy, NBER Studies in Income and Wealth, Vol. 65, Chicago and London:
University of Chicago Press, pp. 11-41.
Eisfeldt, Andrea L., and Adriano A. Rampini (2003), “Capital Reallocation and
Liquidity,” Journal of Monetary Economics, Vol. 53, no. 3, pp. 369-399.
Groshen, Erica, and Simon Potter (2003), “Has Structural Change Contributed to a
Jobless Recovery?” Federal Reserve Bank of New York Current Issues in
Economics and Finance, Vol. 9, no. 8, pp. 1-7.

- 32 -
Gordon Robert (2003), “Exploding Productivity Growth: Context, Causes, and
Implications,” Brookings Papers on Economic Activity, no. 2, pp.207-279.
Hopenhayn, Hugo, and Richard Rogerson (1993), “Job Turnover and Policy Evaluation:
A General Equilibrium Analysis,” Journal of Political Economy, Vol. 101, no. 5,
pp. 915-938.
Katz, Lawrence F., and Kevin M. Murphy (1992), “Changes in Relative Wages, 1967-87:
Supply and Demand Factors,” Quarterly Journal of Economics, vol. 107, no. 1,
pp. 35-78.
Koenders, Kathryn, and Richard Rogerson (2005), “Organizational Dynamics Over the
Business Cycle: A View on Jobless Recoveries,” Federal Reserve Bank of St.
Louis Review, Vol. 87, no. 4, pp. 555-579.
Lilien, David M., “Sectoral Shifts and Cyclical Unemployment,” Journal of Political
Economy, Vol. 90, no. 4, pp. 777-793.
Loungani, Prakesh, and Richard Rogerson (1989), “Cyclical Fluctuations and the
Sectoral Reallocation of Labor: Evidence from the PSID,” Journal of Monetary
Economics 23, no. 2, pp. 259-273.
Mann, Catherine L. (2003) “Globalization of IT Services and White Collar Jobs: The
Next Wave of Productivity Growth,” Institute for International Economics
International Economics Policy Briefs, Number PB03-11, December.
McConnell, Margaret, and Joseph Tracy (2006), “Structural and Cyclical Adjustments in
U.S. Labor Markets,” Federal Reserve Bank of New York, mimeo.
Neal, Derek (1995), “Industry-Specific Human Capital: Evidence from Displaced
Workers,” Journal of Labor Economics, Vol. 13, no. 4, pp. 653-677.

- 33 -
Oliner, Stephen, Daniel Sichel, and Keven Stiroh (2007), “Explaining a Productive
Decade,” Brookings Papers on Economic Activity, no. 1, pp. 81-137.
Phelan, Christopher, and A. Trejos (2000), “The Aggregate Effects of Sectoral
Allocations,” Journal of Monetary Economics, vol. 45, no. 2, pp. 249-268.
Rabin, Matthew (1998), “Psychology and Economics,” Journal of Economic Literature,
vol. 3, no 1, pp. 11-46.
Ramey, Valerie A., and Matthew D. Shapiro (1998), “Costly Capital Reallocation and the
Effects of Government Spending,” Carnegie-Rochester Conference Series on
Public Policy, vol. 48, pp. 145-194.
Ramey, Valerie A., and Matthew D. Shapiro (2001), “Displaced Capital: A Study of
Aerospace Plant Closings,” Journal of Political Economy, 109, no. 5, pp. 958-
992.
Rapping, Leonard (1965), “Learning and World War II Production Functions,” Review of
Economics and Statistics, vol. 47, no. 1, pp. 81-86.
Ruhm, Christopher (1991), “Are Workers Permanently Scarred by Job Displacements?”
American Economic Review, vol. 81, no. 1, pp. 319-323.
Shimer, Robert (2005), “The Cyclicality of Hires, Separations, and Job-to-Job
Transitions,” Federal Reserve Bank of St. Louis Review, vol. 87, no. 4, pp.493-
507.
Tapp, Stephen (2008) “Lost in Transition: The Costs and Consequences of Sectoral
Labour Adjustment,” mimeo, www.Econ.queensu.ca/students/tapps/.
Topel, Robert (1991), “Specific Capital, Mobility and Wages: Wages Rise with Job
Seniority,” Journal of Political Economy, vol. 99, no. 1, pp. 145-176.
- 34 -
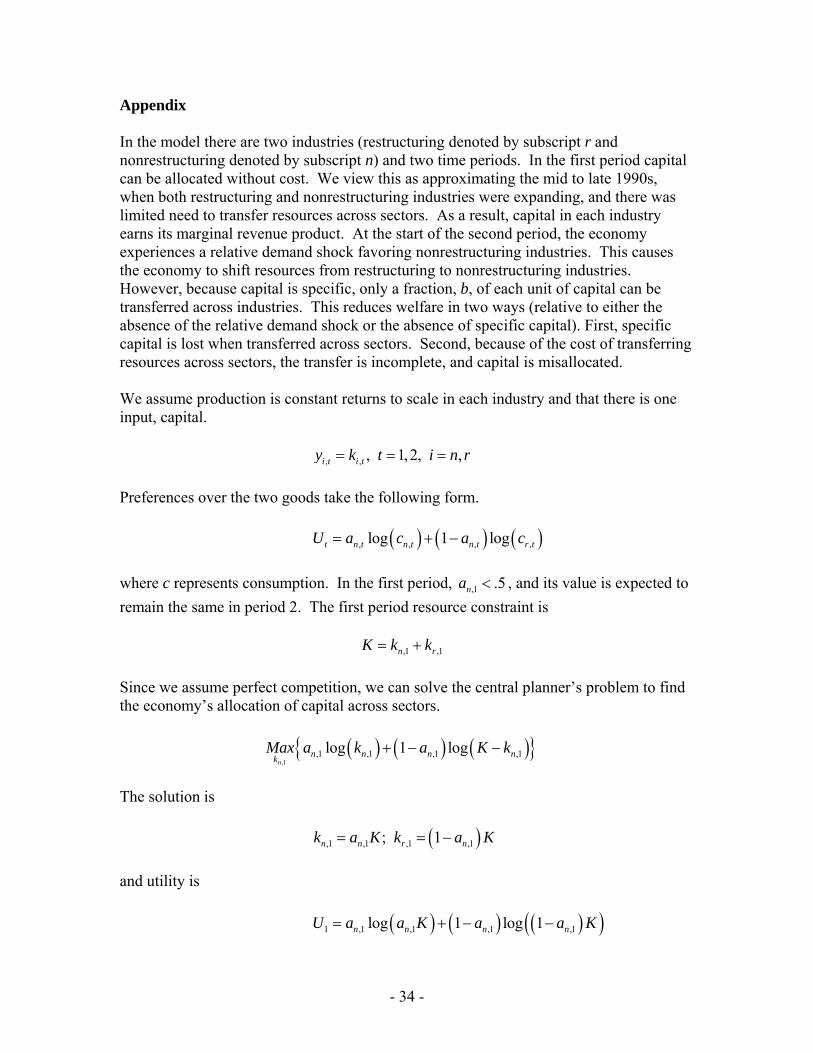
Appendix
In the model there are two industries (restructuring denoted by subscript r and nonrestructuring denoted by subscript n) and two time periods. In the first period capital can be allocated without cost. We view this as approximating the mid to late 1990s, when both restructuring and nonrestructuring industries were expanding, and there was limited need to transfer resources across sectors. As a result, capital in each industry earns its marginal revenue product. At the start of the second period, the economy experiences a relative demand shock favoring nonrestructuring industries. This causes the economy to shift resources from restructuring to nonrestructuring industries. However, because capital is specific, only a fraction, b, of each unit of capital can be transferred across industries. This reduces welfare in two ways (relative to either the absence of the relative demand shock or the absence of specific capital). First, specific capital is lost when transferred across sectors. Second, because of the cost of transferring resources across sectors, the transfer is incomplete, and capital is misallocated. We assume production is constant returns to scale in each industry and that there is one input, capital. , , , 1, 2, ,i t i ty k t i n r= = = Preferences over the two goods take the following form. ( ) ( ) ( ), , , ,log 1 logt n t n t n t r tU a c a c= + − where c represents consumption. In the first period, ,1 .5na < , and its value is expected to remain the same in period 2. The first period resource constraint is ,1 ,1n rK k k= + Since we assume perfect competition, we can solve the central planner’s problem to find the economy’s allocation of capital across sectors. ( ) ( ) ( ){ }
,1,1 ,1 ,1 ,1log 1 log
nn n n nk
Max a k a K k+ − −
The solution is ( ),1 ,1 ,1 ,1; 1n n r nk a K k a K= = − and utility is ( ) ( ) ( )( )1 ,1 ,1 ,1 ,1log 1 log 1n n n nU a a K a a K= + − −

- 35 -
At the beginning of period 2, there is a relative demand shock that increases ,1na . To make the change in relative demand utility-neutral (and thereby abstract from changes in relative demand directly affecting welfare) we assume ,2 ,11n na a= − As a result, in a frictionless economy, ,2nk would equal ,1rk , and ,2rk would equal ,1nk . Utility in period 2 would be unchanged from period 1. But when there exists specific capital, transferring capital across sectors reduces the transferred capital by a fraction b. ( ),2 ,1 ,1 ,2 ,2 ,1,n n r r n nk k b k k if k k= + − > Thus, in the second period, the central planner’s problem becomes
( ) ( ) ( ),2
,2 ,2 ,2 ,1 ,2 ,11log 1 log
nn n n r n nk
Max a k a k I k kb
⎧ ⎫⎛ ⎞+ − − −⎨ ⎬⎜ ⎟⎝ ⎠⎩ ⎭
where I is an indicator variable equaling 1 if the expression in the succeeding parentheses is greater than 0 and equaling 0 otherwise. The first order condition is
,2 ,2
,2 ,2
10n n
n r
a ak bk
−− ≤
This expression will hold as an equality if capital is transferred from restructuring to nonrestructuring industries, which will be the case if the cost of transferring capital is not too great. That is, the condition will hold as an equality as long as
( )
2,2
2,21
n
n
ab
a>
−
If capital is transferred, then
( ) ( )( ) ( )( ),2 ,2
,2 ,2 ,1 ,2 ,1 ,1 ,2
11 1 , 1n n
n n n r n n n
a ak a a K k a b a a K
b
⎛ ⎞−= + − − = + −⎜ ⎟⎜ ⎟⎝ ⎠
Denoting the level of capital in the absence of specific capital as ,2 , ,f
jk j n r= , one can show that

- 36 -
( ),2 ,2,1 ,1
,2 ,2
11 1, 1 1 1n rn nf f
n r
k kb a b a
k k b⎛ ⎞= + − < = + − >⎜ ⎟⎝ ⎠
Thus, capital is misallocated with too little capital in nonrestructuring industries and too much capital in restructuring industries.
The amount of capital destroyed is equal to ( ),1 ,2(1 ) r rb k k− ∗ − . Substituting for
,2rk and ,1rk , one gets the following expression for capital destroyed, Dk
2,1 ,1
1(1 ) 1 2Dn n
bk b a a Kb
⎛ − ⎞⎛ ⎞= − ∗ − − ⎜ ⎟⎜ ⎟⎝ ⎠⎝ ⎠
We compute the welfare cost of restructuring as the difference between the utility
obtained when there is no change in preferences (i.e. no restructuring) and the utility obtained when there is restructuring; equivalently, this is the difference between utility obtained when capital is not specific and when it is. We can decompose this welfare loss into two terms: (1) the utility value of the destroyed capital, and (2) the utility loss from the misallocation of capital across the two sectors (relative to an economy that did not experience a preference shock or does not have specific capital).
Figure 4 describes these two components graphically. The x axis measures the
proportion of total capital (K) allocated to each sector. The two curves represent the demand for output in the restructuring and nonrestructuring industries. Because the nonrestructuring sector is much larger, a given increase (decrease) in capital results in a much smaller decrease (increase) in price than in the restructuring sector. In the absence of specific capital, the demand curves would meet at point z, the frictionless optimum, where the marginal utility product of capital in restructuring industries equals the marginal utility product of capital in nonrestructuring industries. With specific capital, the economy is instead at points c and d. The amount of capital utilized at c and d do not sum to K because some capital has been destroyed during its transfer from restructuring to nonrestructuring industries. In addition, the economy has too much capital in the restructuring sector (relative to the socially optimal level)—c is to the right of z—because it is costly to transfer capital from restructuring to nonrestructuing industries. The economy has too little capital in nonrestructuring industries—d is to the right of z—both because of the excess capital in restructuring industries and because specific capital has been lost when it was transferred to nonrestructuring industries.
The difference in welfare between the economy’s current state and the frictionless
optimum is represented by the areas A and B. A is the area under the nonrestructuring demand curve as the economy moves toward the frictionless optimum by the amount of
destroyed capital. It equals ( ),20
Dk
n np k i di+∫ , where pn is the price (or marginal utility) of
output in nonrestructuring industries, and ,2nk is the amount of capital in the

- 37 -
nonrestructuring sector at point d. If, as in the figure, the amount of destroyed capital, relative to the amount of capital employed in nonrestructuring industries, is small and/or demand in nonrestructuring industries is not too inelastic, then this cost can be approximated by ( ),2
Dnp k k∗ , or the current marginal utility product of capital in
nonrestructuring industries times the amount of destroyed capital. B is the loss in welfare due to the misallocation of capital. It is the space between
the two demand curves as resources are transferred from restructuring to nonrestructuring industries and the economy moves toward the frictionless optimum. This area can be approximated as ½ the price difference between nonrestructuring and restructuring industries times the distance to the frictionless optimum. This latter distance depends importantly on the elasticity of demand in restructuring industries. Suppose the price difference between restructuring and nonrestructuring industries (the distance between c and f) is 3.5 percent (the average difference for the period 2001-2003 implied by the difference in differences calculation for the growth of the price deflator from 2000 to 2003 shown in table 9). Using the difference in differences calculation for the growth in real value added over the 2000-2003 period divided by the 3.5 percent change in relative price yields an estimated price elasticity that is close to -1. This implies that the distance to the frictionless optimum (segment ch) is 3.5 percent of restructuring industries’ capital, or, given the restructuring sector’s share of employment, about 0.45 percent of the economy’s capital (assuming approximately equal capital to employment ratios in each sector). Area B is then estimated to be approximately equal to triangle fch, or 1 .035*.0045 .0000792∗ = , or .0079 percent. Because of its small size, we ignore this
component when computing the welfare cost of restructuring.

Table 1. Changes in Industry Employment Growth
Industry
Average Growth
1990-2000
Average Growth
2000-20003
Difference in Growth 1990-2000
to 2000-2003
Average Growth 2003 to
2005 Computer Systems Design and Related Services 11.23 -5.26 -16.49 3.6 Information and Data Processing Services 6.97 -6.82 -13.79 -1.46 Securities, commodity contracts, and Investments 4.88 -5.17 -10.04 2.13 Computer and Electronic Products -0.29 -9.27 -8.98 -1.6 Apparel and Leather Manufacturing -5.97 -14.35 -8.37 -7.8 Machinery Manufacturing 0.28 -7.77 -8.05 0.52 Electrical Equipment, Appliance and Components -0.22 -8.22 -8 -2.64 Primary Metals -0.74 -8.69 -7.95 -1.06 Textiles -1.81 -9.41 -7.61 -6.61 Administrative and Support Services 4.92 -2.45 -7.37 4 Plastics and Rubber Products 1.96 -5.2 -7.16 -0.92 Motor Vehicles 1.72 -5.42 -7.14 -0.72 Fabricated Metal Manufacturing 1.23 -5.81 -7.04 1.34 Broadcasting and Telecommunications 2.54 -4.49 -7.03 -2.86 Furniture Manufacturing 1.01 -5.84 -6.85 -0.61 Other Transportation Services 4.61 -2.22 -6.83 1.73 Air Transportation 2 -4.81 -6.82 -2.6 Publishing 1.92 -4.21 -6.13 -0.69 Wood Product Manufacturing 1.45 -4.35 -5.8 2.23 Printing -0.14 -5.75 -5.6 -2.26 Management of Companies and Enterprises 3.05 -2.16 -5.21 1.82 Paper -0.6 -5.32 -4.72 -3.15 Truck Transportation 2.39 -2.12 -4.51 2.41 Nonmetallic Mineral Product Manufacturing 0.65 -3.82 -4.47 0.8 Miscellaneous Manufacturing 0.85 -3.61 -4.46 -1.1 Rental and Leasing Services 2.5 -1.79 -4.29 0.52 Motion Picture and Sound Recording 2.81 -0.94 -3.75 0 Miscellaneous Professional, Scientific and Technical Services 2.46 -1.26 -3.73 3.23 Funds, Trusts & other Fin. Vehicles 2.49 -1.16 -3.66 2.93 Warehousing 4.36 0.96 -3.41 4.85 Accomodation 1.65 -1.48 -3.13 1.16 Construction 2.63 0.02 -2.6 4 Chemicals -0.15 -2.75 -2.59 -1.72 Legal Services 0.77 -1.19 -1.96 0.76
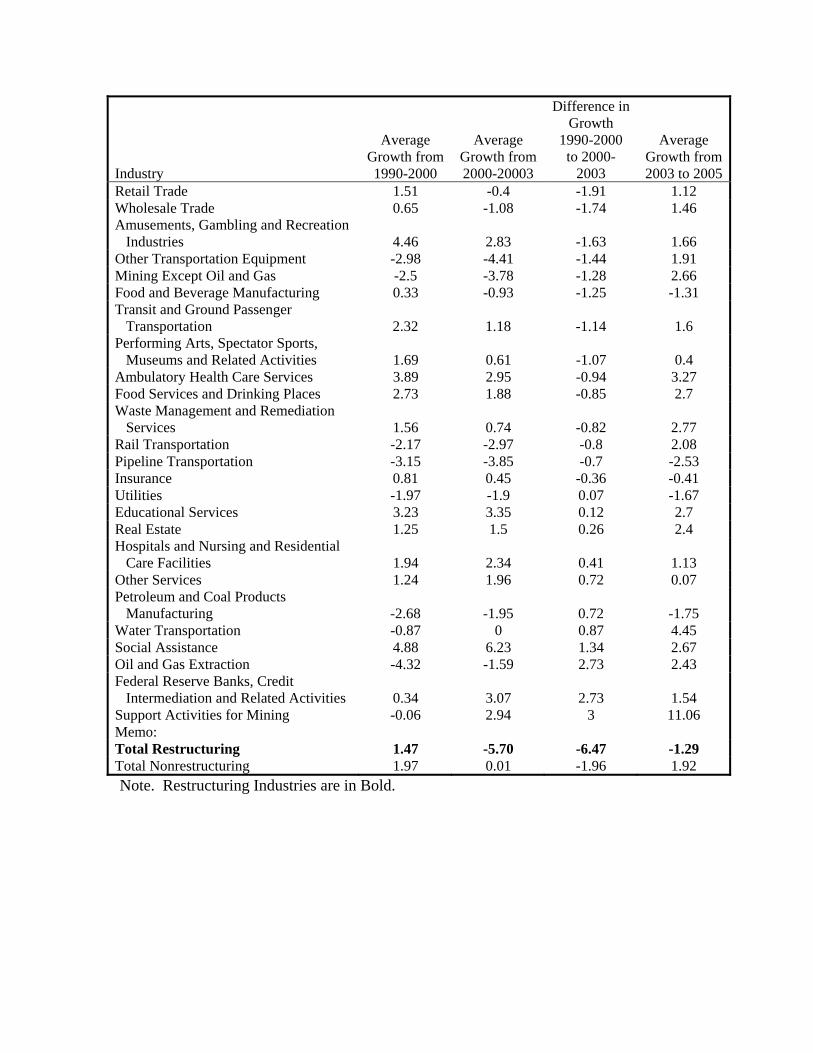
Industry
Average Growth from 1990-2000
Average Growth from 2000-20003
Difference in Growth
1990-2000 to 2000-
2003
Average Growth from 2003 to 2005
Retail Trade 1.51 -0.4 -1.91 1.12 Wholesale Trade 0.65 -1.08 -1.74 1.46 Amusements, Gambling and Recreation Industries 4.46 2.83 -1.63 1.66 Other Transportation Equipment -2.98 -4.41 -1.44 1.91 Mining Except Oil and Gas -2.5 -3.78 -1.28 2.66 Food and Beverage Manufacturing 0.33 -0.93 -1.25 -1.31 Transit and Ground Passenger Transportation 2.32 1.18 -1.14 1.6 Performing Arts, Spectator Sports, Museums and Related Activities 1.69 0.61 -1.07 0.4 Ambulatory Health Care Services 3.89 2.95 -0.94 3.27 Food Services and Drinking Places 2.73 1.88 -0.85 2.7 Waste Management and Remediation Services 1.56 0.74 -0.82 2.77 Rail Transportation -2.17 -2.97 -0.8 2.08 Pipeline Transportation -3.15 -3.85 -0.7 -2.53 Insurance 0.81 0.45 -0.36 -0.41 Utilities -1.97 -1.9 0.07 -1.67 Educational Services 3.23 3.35 0.12 2.7 Real Estate 1.25 1.5 0.26 2.4 Hospitals and Nursing and Residential Care Facilities 1.94 2.34 0.41 1.13 Other Services 1.24 1.96 0.72 0.07 Petroleum and Coal Products Manufacturing -2.68 -1.95 0.72 -1.75 Water Transportation -0.87 0 0.87 4.45 Social Assistance 4.88 6.23 1.34 2.67 Oil and Gas Extraction -4.32 -1.59 2.73 2.43 Federal Reserve Banks, Credit Intermediation and Related Activities 0.34 3.07 2.73 1.54 Support Activities for Mining -0.06 2.94 3 11.06 Memo: Total Restructuring 1.47 -5.70 -6.47 -1.29 Total Nonrestructuring 1.97 0.01 -1.96 1.92 Note. Restructuring Industries are in Bold.

Table 2. Correlations indicating supply or demand shocks Correlation between Restructuring Nonrestructuring Real Value Added/Prices
0.27
(<0.001)
-0.18
(0.374) Employment/Real Value Added
0.71
(<0.001 )
0.70
(<0.001) Employment/Wages
0.45
( 0.045 )
0.33
(0.020) Employment/Productivity
-0.32
( 0.144 )
-0.39
(0.061) Note. To obtain p values (in parentheses) we bootstrapped a distribution, drawing 1000 samples after first expanding the original data set to make the number of (identical) observations for an industry proportional to the industry’s share of employment.

Table 3. Types of Shocks Affecting Restructuring Industries
Industry Correlation Type of Shock (y, p) (y, L) (L, π ) Motor Vehicle Manufacturing
+ + - Demand, shakeout
Furniture Manufacturing
+ + - Demand, shakeout
Electrical Equipment, Appliance, and Component Manufacturing
+ + - Demand, shakeout
Textiles Manufacturing
+ + - Demand, shakeout
Printing
+ + - Demand, shakeout
Paper Manufacturing
+ + - Demand, shakeout
Publishing
+ + - Demand, shakeout
Broadcasting and Telecommunications
+ + - Demand, shakeout
Primary Metal Manufacturing
+ + - Demand, shakeout
Air Transportation
+ + - Demand, shakeout
Computer Systems Design and Related Services
+ + - Demand, shakeout
Computer manufacturing
+ + + Demand, low utilization
Information and Data Processing Services
- - - Positive Supply
Motion Picture and Sound Recording
- - - Positive Supply
Chemical Manufacturing
- - - Positive Supply
Miscellaneous Manufacturing
- + - Negative Supply
Plastics and Rubber Manufacturing - + - Negative Supply Note. Y represents output growth, p represents inflation, L represents employment growth, and π represents productivity growth.

Table 4. Changes in Plant Capital
Net Establishment Openings and Closings
Industry
Average rate 1991:Q3-2000:Q4
Average rate 2000:Q4-2003:Q4
Difference in average rates
Total restructuring industries
-0.00
-0.3
-0.29 ( <0.001)
Total nonrestructuring industries
0.24
0
-0.25 (<0.001)
Difference
-0.25 (<0.001)
-0.30 (<0.001)
-0.05 (0.43)
Changes in Plant Capacity
Average rate 1990-2000
Average rate 2000-2003
Difference in average rates
Total restructuring industries
4.65
2.34
-2.31 (0.015)
Total nonrestructuring industries
1.63
-0.58
-2.20 (0.061)
Difference
3.02 (<0.001)
2.91 (0.025)
-0.11 (0.94)
Note. Restructuring industries in bold. p values from least squares regressions are in parentheses. For establishment openings and closings, the unit of observation is industry/quarter, observations are weighted by employment, and the number of observations is 598. For plant capacity, the unit of observation is industry/year, observations are weighted by capacity, and the number of observations is 247.

Table 5. Changes in Job Creation and Job Destruction
Industry
Average rate 1991:Q3-2000:Q4
Average rate 2000:Q4-2003:Q4
Difference in average rates
Job Destruction Total restructuring industries
2.56
2.90
0.35 (0.38)
Plant Closings
0.95
0.98
0.04 (0.77)
Total nonrestructuring industries
4.07
3.94
-0.13 (0.51)
Plant Closings
1.77
1.65
-0.13 (0.03)
Difference
1.51 (<0.001)
0.96 (0.01)
0.49 (0.28)
Plant Closings
-0.83 (<0.001)
-0.66 (<0.001)
0.16 (0.24)
Job Creation
Total restructuring industries
2.64
2.12
-0.53 (0.21)
Plant Openings
0.94
0.68
-0.26 ( 0.07)
Total nonrestructuring industries
4.44
3.9
-0.54 (0.20)
Plant Openings
2.02
1.64
-0.38 (<0.001)
Difference
-1.79 (<0.001)
-1.77 (<0.001)
0.02 (0.97)
Plant Openings
-1.08 (<0.001)
-0.96 (<0.001)
0.12 (0.78)
Note. Restructuring industries in bold. p values from least squares regressions are in parentheses. Observations are weighted by employment. The unit of observations is industry/quarter, and the number of observations is 598.

Table 6. Changes in Layoffs
Industry
Average monthly rate 1994-2000
Average monthly rate 2001-2003
Difference in average rates
Total Layoffs
Total restructuring industries
0.89
1.18
0.29 (0.023)
Total nonrestructuring industries
0.77
0.88
0.12 (0.059)
Difference
0.12 (0.13)
0.29 (0.013)
0.18 (0.22)
Permanent Layoffs
Total restructuring industries
0.41
0.63
0.22 (<0.001)
Total nonrestructuring industries
0.35
0.44
0.1 (<0.001)
Difference
0.07 (0.023)
0.19 (<0.001)
0.12 (0.027)
Note. Restructuring industries in bold. p values from least squares regressions are in parentheses. Observations are weighted by employment. The unit of observations is industry/year, and the number of observations is 328.

Table 7. Changes in Worker Utilization
Industry Average
1997-1999 Average
2001-2003 Difference
in Averages
Displacement Rates Total restructuring industries
2.35
6.86
4.51 (<0.001 )
Total nonrestructuring industries
1.64
1.75
0.10 ( 0.87)
Difference
0.70 (0.49)
5.11 (<0.001)
4.41 (0.003)
Nonemployment Duration (weeks)
Total restructuring industries
19.44
35.16
15.72 (<0.001)
Total nonrestructuring industries
18.80
27.97
9.16 (<0.001)
Difference
0.64 (0.43)
7.19 (<0.001)
6.56 (<0.001)
Estimated Utilization Rates
Total restructuring industries
99.2
95.6
-3.6
Total nonrestructuring industries
99.4
99.1
-0.3
Difference
-0.2
-3.5
-3.3
Note. Restructuring industries in bold. p values from least squares regression are in parentheses. For displacement rates the unit of observation is industry/year, the number of observations is 193, and observations are weighted by employment. For nonemployment duration the unit of observation is individuals and the number of observations is 7340.

Table 8. Lost Income for Displaced Workers (2001-2003)
Average Earnings Change as Percent of Average Previous Earnings
Restructuring Industries
Nonrestructuring Industries
Workers finding new employment in
Percent of displaced workers
Earnings change
Percent of displaced workers
Earnings change
Any industry
100 -15.62 100 -11.77
Original industry
29.8 -3.3 37.7 -3.8
New industry
70.2 -21.2
62.3 -17.1
Difference between original and new
17.9 (0.001)
13.3 (<0.001)
Note. Restructuring industries in bold. p values from least squares regression are in parentheses. The number of observations is 4,441.

Table 9. Lost Income for Capital and Workers Remaining in Restructuring Industries
Changes in Value Added Deflators
Industry Average
1990-2000 Average
2000-2003 Difference
in Averages Total restructuring industries
-0.81
-2.51
-1.70 (0.05)
Total nonrestructuring industries
2.56
2.59
0.03 (0.96)
Difference
-3.37 (<0.001)
-5.10 (<0.001)
-1.73 (0.016)
Changes in Value Added Deflators (excluding computers)
Industry Average
1990-2000 Average
2000-2003 Difference
in Averages Total restructuring industries
1.52
-0.75
-2.27 (0.002)
Total nonrestructuring industries
2.56
2.59
0.03 (0.96)
Difference
-1.04 (0.004)
-3.34 (<0.001)
-2.30 (0.009)
Note. Restructuring industries in bold. p values from least squares regression are in parentheses. The unit of observation is industry group/year, where industry groups are restructuring and nonrestructuring industries. Observations are weighted by value added, and the number of observations is

Table 10. Economic Cost of Restructuring Only human capital
affected Human and physical
capital affected Lost Income from Destroyed Specific Capital
Loss in specific capital is Permanent
.2136*.7*.0175=0.26% .2136*.0175=0.37%
Loss in specific capital is Temporary
.2136*.7*.00875=0.13% .2136*.00875=0.18%
Lost Income from Time Cost of Finding New Employment
.68*.7*.00875=0.41% .68*.00875=0.6%
Total Cost Loss in specific capital is Permanent
0.67% 0.97%
Loss in specific capital is Temporary
0.54% 0.78%
Note. Restructuring industries in bold. p values in parentheses.

400
650
900
1150
1400
1990 1995 2000 2005
Computer Systems Design and Related Services
300
350
400
450
500
550
1990 1995 2000
Information and Data Processing Services
1200
1400
1600
1800
2000
1990 1995 2000
Computer and Electronic Product Manufacturing45
050
055
060
0
1990 1995 2000
Electrical Equipment, Applicanceand Component Manufacturing
450
500
550
600
650
700
1990 1995 2000
Primary Metal Manufacturing
400
500
600
700
1990 1995 2000
Textiles Manufacturing
(Thousands)Figure 1. Employment in Restructuring Industries
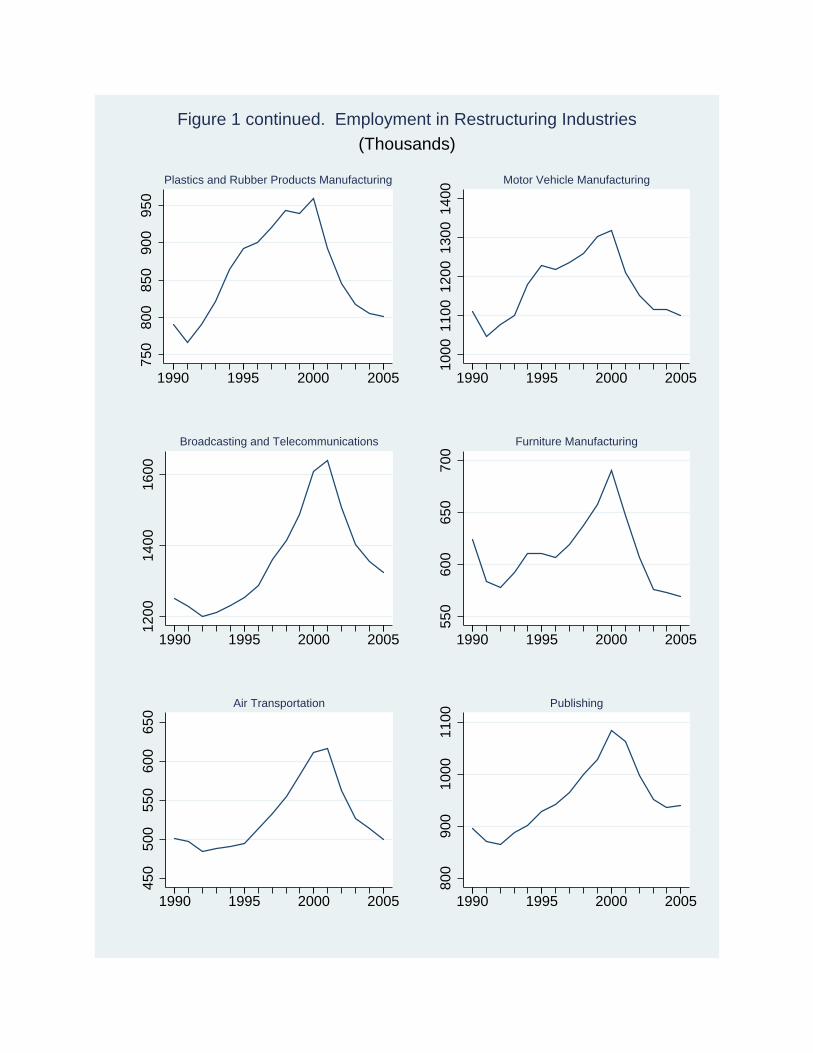
750
800
850
900
950
1990 1995 2000 2005
Plastics and Rubber Products Manufacturing
1000
1100
1200
1300
1400
1990 1995 2000 2005
Motor Vehicle Manufacturing
1200
1400
1600
1990 1995 2000 2005
Broadcasting and Telecommunications55
060
065
070
0
1990 1995 2000 2005
Furniture Manufacturing
450
500
550
600
650
1990 1995 2000 2005
Air Transportation
800
900
1000
1100
1990 1995 2000 2005
Publishing
(Thousands)Figure 1 continued. Employment in Restructuring Industries

650
700
750
800
850
1990 1995 2000 2005
Printing
450
500
550
600
650
1990 1995 2000 2005
Paper Manufacturing
660
700
740
780
1990 1995 2000 2005
Miscellaneous Manufacturing25
030
035
040
0
1990 1995 2000 2005
Motion Picture and Sound Recording
850
900
950
1000
1990 1995 2000 2005
Chemical Manufacturing
1200
013
000
1400
015
000
Res
truc
turin
g (s
olid
line
)
8000
090
000
1000
00N
onre
stru
ctur
ing
(das
hed
line)
1990 1995 2000 2005
Total Restructuring and Nonrestructuring
(Thousands)Figure 1 continued. Employment in Restructuring Industries

−4
−2
02
46
Per
cent
diff
eren
ce fr
om tr
end
1990 1995 2000 2005
RestructuringNonrestructuring
Figure 2. Productivity

05
1015
Per
cent
diff
eren
ce fr
om 1
997
1996 1998 2000 2002 2004 2006
RestructuringNonrestructuring
Figure 3. Labor Share

0 K
B
A
A
Restructuring
Nonrestructuring
c
dz
Figure 4. The Economic Cost of Restructuring
f
Marginal Utility
Capital in restructuring industries increases Capital in nonrestructuring industries increases
h
g