the influence of traffic management on emissions · 2013-11-28 · steunpunt mobiliteit &...
TRANSCRIPT

DIEPENBEEK, 2013.
STEUNPUNT MOBILITEIT & OPENBARE WERKEN
SPOOR VERKEERSVEILIGHEID
The influence of traffic management on emissions
Guidebook for good practice
RA-MOW-2011-023
B. Degraeuwe, B. De Coensel, B. Beusen, M. Madireddy, A. Can, I. De Vlieger
Onderzoekslijn Duurzame mobiliteit
Documentbeschrijving
Rapportnummer: RA-MOW-2011-023
Titel: The influence of traffic management on emissions
Ondertitel: Guidebook for good practice
Auteur(s): B. Degraeuwe, B. De Coensel, B. Beusen, M.
Madireddy, A. Can, I. De Vlieger
Promotor: Prof. dr. ir. Dick Botteldooren, ir. Ina De Vlieger
Onderzoekslijn: Duurzame mobiliteit
Partner: VITO en Universiteit Gent
Aantal pagina’s: 60
Projectnummer Steunpunt: 8.3
Projectinhoud: Invloed van verkeersmanagement op emissies, geluid
en veiligheid
Uitgave: Steunpunt Mobiliteit & Openbare Werken – Spoor Verkeersveiligheid, april 2012.
Steunpunt Mobiliteit & Openbare Werken Spoor Verkeersveiligheid
Wetenschapspark 5 B 3590 Diepenbeek T 011 26 91 12
F 011 26 91 99 E [email protected] I www.steunpuntmowverkeersveiligheid.be

Steunpunt Mobiliteit & Openbare Werken 3 RA-MOW-2011-023 Spoor Verkeersveiligheid
Samenvatting
Titel: Verkeersmanagement en milieu
Ondertitel: Gids goede praktijk
Het doel van werkpakket 8.3 was de invloed van verkeersmanagement te onderzoeken
op luchtvervuiling en geluid van wegverkeer. Hiervoor werden een emissiemodel en een
geluidsmodel verbonden aan het microscopisch verkeersmodel Paramics.
Een literatuurstudie die uitgevoerd werd in een voorafgaande fase van dit project,
onderzocht bestaande emissiemodellen en hun link met verkeersmodellen. De resultaten
hiervan werden neergeschreven in een apart rapport (zie Trachet et al., 2010). Hierin
werd aangetoond dat er geschikte modellen bestonden om de impact van
verkeersmaatregelen op emissies te berekenen. Zowel voor CO2 als geluid werd
aangetoond dat met microscopische verkeerssimulatie het effect van
verkeersmanagement bestudeerd kan worden nog voor deze praktisch geïmplementeerd
zijn.
Het huidige rapport gaat dieper in op de invloed van verkeersmanagement op emissies
en geluid. Het bestaat zowel uit een uitgebreide literatuurstudie als uit nieuwe simulaties
van specifieke verkeerssituaties. De onderstaande tabel vat de resultaten van de
literatuurstudie samen. Voor deze nieuwe simulaties werd rekening gehouden met de
suggesties van de stuurgroep. Zo werden de Antwerpse wijk Zurenborg en de E313
tussen Geel en Antwerpen als gevalstudie uitgekozen.
In de wijk Zurenborg werd het effect bestudeerd van een snelheidsverlaging in de week
van 50 naar 30 km/u, op de hoofdwegen (Singel) van 70 naar 50 km/h en op de Ring
van 100 naar 70 km/u. Dit leidt tot een vermindering van alle emissies en geluid.
Daarnaast werd het effect van een groene golf op de Plantin-Moretuslei onderzocht. De
aanwezigheid van een groene golf leidt tot een afname van de emissies maar tot een
toename van het geluid.
Uit de analyse van de E313 autosnelweg tussen Geel-Oost en Antwerpen kon afgeleid
worden dat variabele snelheidslimieten (VSL) slechts een zeer klein effect hebben op
luchtvervuiling en geluid. Er is waarschijnlijk een indirect effect door een vermindering
van het aantal ongevallen en de bijhorende congestie. Het VSL-systeem dient immers in
de eerste plaats voor filestaartbeveiliging. De emissies van wegverkeer zijn minimaal
rond 90 km/h en nemen vooral sterk toe bij lagere snelheden. De gemiddelde snelheid
tijdens de ochtendspits ligt tegenwoordig rond de 50 km/h op de E313. Meer verkeer zal
daarom leiden tot meer emissies, maar lagere geluidsniveaus op deze locatie. Aan de
andere kant zullen maatregelen die de doorstroming bevorderen zonder extra verkeer
aan te trekken leiden tot minder emissies en hogere geluidsniveaus.
In de literatuur vindt men soms verschillende effecten voor bepaalde maatregelen.
Specifieke infrastructuurkenmerken zoals de diameter van een rotonde, de heersende
snelheidslimieten of de breedte van de weg kunnen het effect van een maatregel sterk
beïnvloeden. Omwille van het belang van lokale kenmerken raden we aan om de impact
van verkeersmanagement op doorstroming, veiligheid, emissies en geluid daarom geval
per geval te bekijken. Prioriteiten moeten op voorhand gesteld worden om in iedere
situatie de meest geschikte oplossing te kiezen. In dit project werden enkele gevalstudies
uitgevoerd. De resultaten van een verkeerssimulatie geijkt met tellingen werd gebruikt in
een emissie- en geluidsmodel. Deze modellenketen bleek erg nuttig om beleidsvragen te
beantwoorden.
In het kader van de ‘vrije onderzoeksruimte’ werd met metingen in wagens onderzocht
hoe werkelijke rijsnelheden zich verhouden tot de heersende snelheidslimieten. Hieruit
bleek dat de gemiddelde werkelijke snelheid steeds iets onder de snelheidslimiet ligt. De
enige uitzondering hierop is de zone 30 waar de werkelijke gemiddelde snelheid boven de

Steunpunt Mobiliteit & Openbare Werken 4 RA-MOW-2011-023 Spoor Verkeersveiligheid
limiet ligt. Het laagste verbruik (CO2) wordt bereikt bij snelheiden tussen 70 en 90 km/h.
Op snelwegen aan hoge snelheid werkt een verbrandingsmotor efficiënt maar stijgen het
verbruik en de CO2 emissies door de hogere luchtweerstand.
Voor een gedetailleerde samenvatting van de bevindingen verwijzen we naar de
conclusies in hoofdstuk 5. Meer informatie omtrent de literatuurstudie en de uitgevoerde
gevalstudies is beschikbaar in het rapport.
Door-
stroming
Veiligheid Brandstof
besparing
CO2-
reductie
Locale
emissie-
reductie
(NOx, PM,
HC)
Geluid
Kruispunten
vervangen door
ronde punten:
1. stedelijke
gebieden ++ - + + +
2. hoofdwegen ++ + + + +
Snelheidsregeling op
snelwegen:
1. verlaagde snelheid
(80 km/h) ≈ ++ ++ ++ ++
2. variabele
snelheids-limieten ≈ + + + +
3. snelheidscontrole ≈ + ≈ ≈ ≈
Snelheidsverlaging
op lokale wegen ≈ ++ ≈ ≈ ++
Lage emissie zones ≈ ≈ + ++ ++
Groene golf ++ ≈ + + -
verkeersdrempels - ++ -- -- ≈
Legende:
++ Grote verbetering - Klein negatief effect
+ Lichte verbetering -- Belangrijk negatief effect
≈ Geen of niet-significante verbetering
Dankwoord
We zouden de Antwerpse politie willen bedanken voor de verkeersdata van Zurenborg en
het Vlaams Verkeerscentrum voor de informatie over de rijstrooksignalisatie en de
verkeerstellingen op de E313.

Steunpunt Mobiliteit & Openbare Werken 5 RA-MOW-2011-023 Spoor Verkeersveiligheid
English summary
Title: The influence of traffic management on emissions
Subtitle: Guidebook for good practice
The mission of work package 8.3 was to investigate the influence of traffic management
on the reduction of emissions of air pollution and noise from road traffic flows. This was
done by implementing an emission model and noise model as two external plug-ins into
the traffic simulation software Paramics.
A preceding literature study on emission models and initial tests with microscopic traffic
simulation, presented in a separate technical report (see Trachet et al., 2010),
demonstrated that suitable emission models are available for studying the effect of traffic
management. For CO2 and noise, it was shown that microscopic traffic simulation can be
used to study the effect of this traffic management prior to implementing.
The present report focuses on the influence of traffic management on emissions and
noise. It consists of both an elaborate literature study and the analysis of specific case
studies in separate model simulations. The table below gives an overview of the results
of the literature study. For these new simulations the suggestions of the steering
committee were taken into account. In this way the Zurenborg neighbourhood in Antwerp
and the E313 highway between Geel and Antwerp were selected as study areas.
In the Zurenborg neighbourhood the effect of speed reductions was studied. In the
proper neighbourhood the speed was reduced from 50 to 30 km/h, on the major roads
(Singel) from 70 to 50 km/h and on the freeway from 100 to 70 km/h. This results in a
decrease of emissions and noise. Also the effect of traffic light synchronization was
determined. The presence of a green wave results in a decrease of emissions but an
increase in traffic noise.
Specific analyses on the E313 freeway between Geel-Oost and Antwerpen indicate that
the introduction of variable speed limits (VSL) has only very little direct effect on air
pollutant and noise emissions. There may be an indirect effect through the reduction of
accidents and the corresponding congestion. Air pollutant emissions are minimal around
a speed of 90 km/h. Given that the current average speeds on the E313 during rush hour
are around 50 km/h, decreasing average speeds will lead to extra air pollution, but, on
the other hand, will lead to lower noise levels along the freeway. Furthermore, measures
that enhance traffic flow fluency without attracting more traffic can decrease air pollutant
emissions, but will increase noise emissions.
It has to be noted that various literature review studies indicate different results for the
same measure. Depending on the specific characteristics of the measure considered (e.g.
dimensions of the roundabout, magnitude of the speed reduction,...) or the features of
the local situation (e.g. dimensions of the road, applicable speed limits, amount of
traffic,...), the impact results might differ largely between locations/studies. Due to the
importance of local characteristics when assessing the impact of traffic management
schemes we therefore recommend to examine the impacts on traffic flow, emissions,...
case by case. Each situation should be examined thoroughly and priorities on the desired
outcome (e.g. on traffic flow, safety, air quality,...) need to be established in advance to
select the most valuable traffic management measure for each situation. The model chain
applied within the case studies of this project, combining information on vehicle
intensities, road characteristics and (noise)emission functions on a microscopic level,
appeared to be a very useful tool for examining this kind of policy questions.
In addition, on-the-field analyses were performed within a confined additional research
(‘vrije onderzoeksruimte’). Hereby we analysed on-the-road speed profiles (recorded by
an on-board logging device) to examine the link between speeds, speed limits and fuel
consumption (CO2 emission). The lowest average fuel consumption (CO2 emission) is
obtained for the 70 and 90 km/h speed limits. At highway speeds, engines are operating
Steunpunt Mobiliteit & Openbare Werken 6 RA-MOW-2011-023 Spoor Verkeersveiligheid
very efficiently but the air resistance is increasing sharply, leading to higher fuel
consumption, and CO2 emissions.
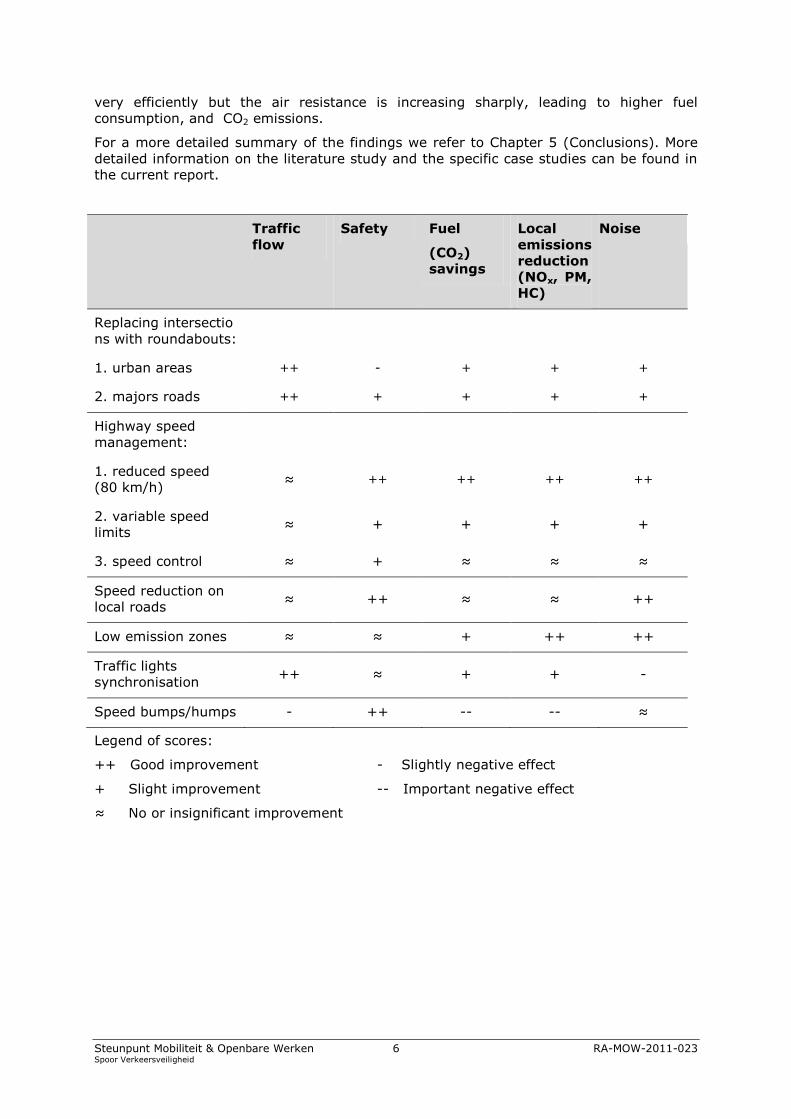
For a more detailed summary of the findings we refer to Chapter 5 (Conclusions). More
detailed information on the literature study and the specific case studies can be found in
the current report.
Traffic
flow
Safety Fuel
(CO2)
savings
Local
emissions
reduction
(NOx, PM,
HC)
Noise
Replacing intersectio
ns with roundabouts:
1. urban areas ++ - + + +
2. majors roads ++ + + + +
Highway speed
management:
1. reduced speed
(80 km/h) ≈ ++ ++ ++ ++
2. variable speed
limits ≈ + + + +
3. speed control ≈ + ≈ ≈ ≈
Speed reduction on
local roads ≈ ++ ≈ ≈ ++
Low emission zones ≈ ≈ + ++ ++
Traffic lights
synchronisation ++ ≈ + + -
Speed bumps/humps - ++ -- -- ≈
Legend of scores:
++ Good improvement - Slightly negative effect
+ Slight improvement -- Important negative effect
≈ No or insignificant improvement

Steunpunt Mobiliteit & Openbare Werken 7 RA-MOW-2011-023 Spoor Verkeersveiligheid
Content
1. INTRODUCTION .......................................................................... 9
2. OVERVIEW OF EFFECTS OF TRAFFIC MANAGEMENT ................................. 10
2.1 Replacement of the traditional signalized intersections with roundabouts 10
2.1.1 Safety ........................................................................................10
2.1.2 Traffic Flow .................................................................................15
2.1.3 Emissions and Fuel Usage .............................................................15
2.1.4 Noise Emissions ...........................................................................16
2.2 Freeway speed management 16
2.2.1 Safety ........................................................................................17
2.2.2 Traffic Flow .................................................................................18
2.2.3 Emissions and fuel consumption .....................................................18
2.3 Speed reduction on local roads 19
2.3.1 Safety ........................................................................................20
2.3.2 Emissions and Fuel Consumption ...................................................20
2.3.3 Noise Emissions ...........................................................................21
2.4 Low emission zones (LEZ) 22
2.4.1 Emissions ....................................................................................22
2.4.2 Noise Emissions ...........................................................................23
2.5 Effect of traffic lights synchronization 23
2.5.1 Traffic Flow .................................................................................24
2.5.2 Emissions and Fuel Consumption ...................................................25
2.5.3 Noise Emissions ...........................................................................25
2.6 Speed humps/bumps 26
2.6.1 Safety ........................................................................................26
2.6.2 Emissions and Fuel Consumption ...................................................27
2.6.3 Noise Emissions ...........................................................................27
3. CASE STUDIES ......................................................................... 28
3.1 Applied simulation models 28
3.1.1 Microscopic traffic simulation model ...............................................28
3.1.2 Emission models for air pollutants and noise ....................................28
3.1.3 Validation of the integrated model ..................................................30
3.2 Case Study A: Effect of reduced speed limits on emissions and noise in
Zurenborg (Antwerp) 30
3.2.1 Study area .................................................................................30
3.2.2 Policy measures ...........................................................................31
3.2.3 Emissions of air pollutants and noise ..............................................31

Steunpunt Mobiliteit & Openbare Werken 8 RA-MOW-2011-023 Spoor Verkeersveiligheid
3.3 Case Study B: Effect of green wave on emissions and noise in Zurenborg
(Antwerp) 32
3.3.1 Study area .................................................................................32
3.3.2 Policy measures ...........................................................................33
3.3.3 Emissions of air pollutants, CO2 and noise .......................................33
3.4 Case Study C: Effect of variable speed limits on emissions and noise on the E313
33
3.4.1 Introduction: study area and scenarios ...........................................33
3.4.2 The E313 model in Paramics ..........................................................36
3.4.3 Effect of VSL on air pollutant and noise emissions ............................39
3.4.4 Evaluation of other measures on the E313 ......................................41
3.4.5 Conclusions .................................................................................43
4. ANALYSIS SPEED PROFILE VERSUS MAXIMUM ALLOWED SPEED ................... 45
4.1 Speed profile as a function of the speed limit 45
4.2 Acceleration profiles as a function of the speed limit 47
4.3 Fuel consumption as a function of the speed limit 49
5. CONCLUSIONS ......................................................................... 51
6. REFFERENCES .......................................................................... 54
7. ANNEX – OVERVIEW EVENTS AND INTERNATIONAL PUBLICATIONS .............. 60

Steunpunt Mobiliteit & Openbare Werken 9 RA-MOW-2011-023 Spoor Verkeersveiligheid
1. IN T R O DU C T ION
Traffic affects liveability and the global environment, not only through objective and
subjective accident risks, but also through emissions of air pollutants and noise. The
global impact of CO2 emission via climate change is recognized by policy. Health impacts
of pollutants such as fine and ultrafine particles have been established and the strong
impact of local noise climate on liveability of a neighbourhood is obvious and explicated
in WP8.1 reports. Noise and air pollution thus have a global component that depends on
the overall emission only and a local component for which the location of the emission is
important.
Classical mitigation of traffic related air pollution focuses on vehicle fleet composition and
traffic volume. Classical assessment of traffic noise has to be more local by the nature of
the problem, but vehicle operation parameters are often abstracted by assuming that all
vehicles travel at a constant speed: the speed limit of the road segment. This classical
approach disregards the opportunities created by detailed traffic management and thus it
was decided to dedicate a study to it in the “Steunpunt Mobiliteit & Openbare werken”.
Traffic management can influence both the speed and acceleration and deceleration
patterns of vehicles. Speed is a main determinant in noise emissions. Acceleration and
deceleration result in incomplete combustion and emissions of CO, NOx, and carbon
based particulate matter. Speed and acceleration also influence CO2 emissions. The
relationship between operation parameters and emission of single vehicles used in this
study are obtained from previous work. After careful deliberation, the
Harmonoise/Imagine model was used for noise emission and the Versit+ model for air
pollutant emission (Trachet et al., 2010).
Relating traffic management and infrastructure to detailed operation characteristics of
single vehicles requires detailed traffic information, which can be obtained through so
called microscopic traffic simulation models. Paramics (www.paramics-online.com) was
chosen as a traffic simulation software package, and plugins for noise and air pollution
emission were developed at Ghent University (similar software was also developed
outside this project for the Aimsun microscopic traffic simulator). Over the years, the
combined simulation was thoroughly tested. The computational model together with field
measurements by VITO allows to perform detailed parameter studies that are used as
guidelines in this report.
The underlying report combines existing know-how, based on an extensive literature
search, with new simulations to produce a set of relationships between traffic
management and emissions of air pollution and noise. Although the report attempts to be
complete in its overview, specific focus is put on topics of interest suggested by the
steering committee members such as the effects of speed limits on the E313.
Also the results of the analyses of speed profiles and fuel consumption versus maximum
allowed speed are presented. This work is performed within a confined additional
research (vrije onderzoeksruimte) and is based on on-the-field measurements.
Steunpunt Mobiliteit & Openbare Werken 10 RA-MOW-2011-023 Spoor Verkeersveiligheid
2. OV E R V IE W OF E F F E C T S OF T R A F F IC M A N AG E M E N T
In this section the results of a literature study on different traffic management schemes
are presented. The focus lies on the evaluation of the effect on safety, traffic flow, fuel
consumption, emissions and noise of the following traffic management measures:
1. Replacement of signalized intersections with roundabouts
2. Highway speed management
3. Speed reduction on local roads
4. Introduction of environmental zones or Low Emission Zones
5. Traffic lights synchronization
6. Introduction of speed humps.
In the following sections these six measures are discussed successively.
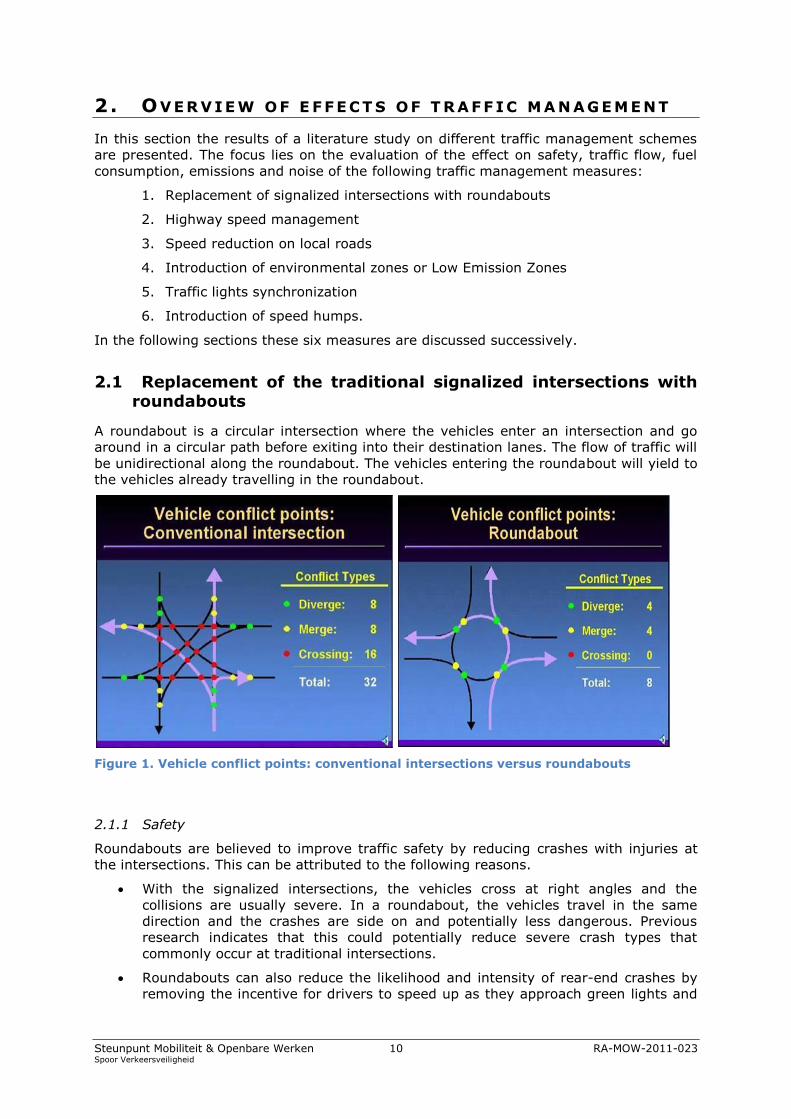
2.1 Replacement of the traditional signalized intersections with roundabouts
A roundabout is a circular intersection where the vehicles enter an intersection and go
around in a circular path before exiting into their destination lanes. The flow of traffic will
be unidirectional along the roundabout. The vehicles entering the roundabout will yield to
the vehicles already travelling in the roundabout.
Figure 1. Vehicle conflict points: conventional intersections versus roundabouts
2.1.1 Safety
Roundabouts are believed to improve traffic safety by reducing crashes with injuries at
the intersections. This can be attributed to the following reasons.
With the signalized intersections, the vehicles cross at right angles and the
collisions are usually severe. In a roundabout, the vehicles travel in the same
direction and the crashes are side on and potentially less dangerous. Previous
research indicates that this could potentially reduce severe crash types that
commonly occur at traditional intersections.
Roundabouts can also reduce the likelihood and intensity of rear-end crashes by
removing the incentive for drivers to speed up as they approach green lights and

Steunpunt Mobiliteit & Openbare Werken 11 RA-MOW-2011-023 Spoor Verkeersveiligheid
by reducing abrupt stops at red lights. This could be anticipated to have a
significant reduction of serious injury collisions.
The vehicle-to-vehicle conflicts that occur at roundabouts generally involve a
vehicle merging into the circular roadway, with both vehicles travelling at low
speeds. This is less dangerous. This is in strong contrast with the scenario where
vehicles try to speed up along their path often in perpendicular direction to each
other.
It has been proven that the conversion of intersections into roundabouts reduces the
number of crashes with injuries or fatalities, evaluation studies frequently showed
considerable individual differences in safety performance of roundabouts. In Daniels et al.
(2010a) crash data, traffic data and geometric data of a sample of 90 roundabouts in
Flanders-Belgium were used to examine the safety performance of roundabouts by
means of a state-of-the-art cross-sectional risk model. Without going into detail on the
methods applied and data sets used, results from this study can be listed as follows:
Vulnerable road users (moped riders, motorcyclists, bicyclists, pedestrians) are
more often involved in injury crashes at roundabouts then could be expected
based on their presence in traffic;
variations in crash rates at roundabouts are relatively small and mainly driven by
variations in traffic intensity;
roundabouts with cycle lanes are performing worse than roundabouts with cycle
paths;
there exists a safety-in-numbers-effects for bicyclists, moped riders and, with less
certainty, for pedestrians at roundabouts;
variables like the roundabout dimensions (circle diameter, road width, number of
lanes,...) are no meaningful predictors for the number of crashes.
However, the authors suggest to further explore the safety aspects of different
roundabout types and extend the study also to other countries. The following sections in
this report therefore give an overview of safety research results from other roundabout
studies performed in Belgium or in other countries. Since the impact on safety might
vary between different types of road users and different types of roundabouts, the safety
research results are classified into the following categories
Safety research results from studies on vehicle to vehicle crashes,
Safety results from studies on vehicle to pedestrian/bicyclist crashes,
Safety results as a function of speed and roundabout design
Safety Research Results from studies on Vehicle to Vehicle crashes
Motor vehicles can face several conflicts at roundabouts. However, the amount of
conflicts and severity of the impact can depend on different factors. The following results
and remarks are reported in national and international studies:
A study of roundabouts in Belgium by Antoine (2005) compared accident
frequencies between roundabouts and traffic lights. The study reports that, in
urban environments, traffic lights have a higher accidents frequency from 20 to
25% to the roundabouts. In open country, the accidents frequency at the traffic
lights is practically twice as high as on roundabouts.
Results reported by a Danish study mention a reduction of 53% of the bodily
accidents in urban areas and 84% in the rural areas when a signalised intersection
is replaced by a roundabout (Jorgensen and Jorgensen, 1996).

Steunpunt Mobiliteit & Openbare Werken 12 RA-MOW-2011-023 Spoor Verkeersveiligheid
In The Netherlands, where in the past 181 crossroads were converted to
roundabouts, a 71% reduction in accidents with a physical injury was reported by
Schoon and Minnen (1994).
In a study by the Insurance Institute for Highway Safety in Arlington, roundabouts
were associated with large reductions in crashes and injuries (Persaud et al. 2000)
. The results were attributed to the reduced speeds and reduced number of
conflict points.
Safety research results from studies on Vehicle to Pedestrian/Cyclist crashes
While, in general, roundabouts might have favourable effects on traffic safety, this might
not be the case for particular types of road users, such as bicyclists or pedestrians.
Concerning the safety impact of roundabouts for these vulnerable road users, the
following relevant studies and safety results can be mentioned:
Daniels et al. (2008, 2010b) examined crash data involving bicyclists at
roundabouts and concluded that the construction of a roundabout raises in general
the number of severe injury crashes with bicyclists. Concerning the design type of
the roundabout, roundabouts with cycle lanes appeared to perform worse
compared to three other design types (mixed traffic, separate cycle paths and
grade-separated cycle paths).
According to Rodegerdts et al. (2007), the conversion of intersections into
roundabouts resulted in a 27% increase in the number of injury accidents
involving bicyclists on or close to the roundabouts. The increase is even higher
(43%) for accidents involving fatal or serious injuries.
Some other studies conducted on roundabouts indicate however that on average,
converting conventional intersections to roundabouts can reduce pedestrian
crashes by about 75% (Schoon and Minnen, 1994).
Hyden and Varhelyi (2000) also argued that replacing intersections with
roundabouts reduced risk for bicyclists and pedestrians significantly, but not for
cars. They found large reductions at roundabouts for bicyclists and pedestrians
(60 and 80%, respectively). The expected number of injury accidents for car
drivers, however, increased slightly (12%).
Hels and Bekkevold (2007) conducted a study for the high incidence of accidents
at Danish roundabouts. The study concluded that the injury accidents for bicyclists
depend on the traffic volume and vehicle speed limits at the intersection. Moller et
al. (2008) investigated the reason for the bicycle accidents at Danish
roundabouts. They concluded from the structured interviews conducted on 1019
bicyclists at 5 roundabouts that the cyclists preferred the road designs with clear
regulation of the road user behaviour, and hence there is a need for increasing the
awareness of the road rules at the roundabouts.
Studies cited by Robinson et al. (2000) claimed that crash reductions were most
pronounced for motor vehicles, and smaller for pedestrians
Recently Daniels et al. (2011) suggested that the effects of roundabouts on
bicycle accidents differ depending on whether these roundabouts are built inside
or outside built-up areas. When inside built-up areas, the construction of
roundabouts increased the number of injury accidents involving bicyclists by 48%.
For accidents causing fatal or serious injuries inside built-up areas, an average
increase of 77% was found.
There is a significant difference in conclusions from several studies because in all the
studies the road parameters, traffic volume and driving behaviours are predominantly
different and hence no general conclusions can be drawn. Mixed results are therefore
available on who benefits the most from replacing the intersections with roundabouts.

Steunpunt Mobiliteit & Openbare Werken 13 RA-MOW-2011-023 Spoor Verkeersveiligheid
Safety as a function of speed and roundabout design
Several studies indicated that the safety impact of roundabouts can depend on the type
of roundabout constructed or on the speed of the adjacent roads. For any kind of crash at
a roundabout, it is generally accepted that unsafe speeds are significant factor. It is
possible that some drivers may not be aware of the roundabout ahead. This is fatal and
measures need to be taken to alert drivers to slow down. On the impact of speed and
roundabout design, the following study results can be noted:
A comprehensive study conducted on roundabouts in Flanders region in Belgium
concludes that a reduction of 34% in the total number of accidents with injury is
possible by replacement of signalized intersections with roundabouts. The study
also predicts an average 30% reduction for light injury accidents, and 38% for
serious injury accidents (Daniels et al. 2010b). The study further indicated that
the severity and frequency of accidents at the roundabouts is significantly
dependent on the speed limits of the approaching roads.
Research results from De Brabander et al. (2005) and Daniels et al. (2010b) both
concluded that the roundabouts are the best replacement for signalized
intersections where the main road with speed limits of 90 km/h intersects with
minor roads with speed limits of 50-70 km/h.
A study by Brude and Larsson (2000) on roundabout design concludes that single-
lane roundabouts, in particular, have been reported to involve substantially lower
pedestrian crash rates than comparable intersections with traffic signals and
multi-lane roundabouts .
Concerning the number of lanes in the roundabout, Daniels et al. (2010b) report
this aspect as a determining factor in crash intensities. Fewer traffic conflicts and
crashes are typically seen at single lane roundabouts compared with multi-lane
roundabouts; additional lanes allow for more points of contact between vehicles.
Elvik (2002) deduced that the three-leg roundabouts tend to perform worse than
roundabouts with four or more legs and that crashes occur frequently at
roundabouts with bypasses for traffic in some direction. Larger central islands
correlate with more single-vehicle crashes.
The safety effect is largely dependent on the original signalization situation.
Roundabouts replacing intersections without traffic lights reduce the number of
injury accidents by 44% compared to 32% for intersections initially designed with
traffic lights (De Brabander and Vereeck, 2007). The largest improvements are
observed on high speed roads without signalization on the original intersection (90
km/h×50 km/h and 90 km/h×90 km/h). The study also concludes that serious
injury accidents are estimated to increase by 117% on 70 km/h×50 km/h
intersections equipped with signalization before the roundabout. The number of
injury accidents involving vulnerable road users is also found to increase (28%) on
50 km/h×50 km/h junctions that were originally signalized. Moreover, the
vulnerable road user is more likely to get fatally or seriously injured. Therefore, it
is concluded that traffic lights protect vulnerable road users more effectively than
roundabouts, which, in turn, are superior to intersections without signalization.
On the ‘design’ aspect of roundabouts, Sakshaugh et al. (2010) made some interesting
discussions concerning the difference between a separated and an integrated roundabout
and the related safety aspects (especially for cyclists) (Figure 2):

Steunpunt Mobiliteit & Openbare Werken 14 RA-MOW-2011-023 Spoor Verkeersveiligheid
Figure 2. Separated roundabout (left) versus integrated roundabout (right) (source: Sakshaugh et al., 2010)
In a separated roundabout, the cycle paths, together with the pedestrian paths, run
parallel to and outside the carriageway. Contact between cyclists and motor-vehicle
traffic occurs only when a cyclist has to cross the carriageway at a roundabout approach
or exit, interacting then with drivers entering or leaving the roundabout. Cycling in both
directions on the cycle paths is permitted, which means that drivers have to pay
attention to cyclists coming from the left and from the right at the same time.
In an integrated roundabout, the cycle paths are separated from motor-vehicle traffic
along the approach to the roundabout, but cyclists are led onto the carriageway and
merged with motor vehicles approximately 30m before the roundabout. The intention of
the design is for cyclists and motor vehicles to form one mixed flow and enter the
roundabout and circulate in it as if it was just one lane. However, the widths of the
approaches and the ring itself allow cyclists to move in parallel with the vehicles, i.e., two
informal lanes are formed. After the roundabout, cyclists are led away from the
carriageway again. Cycling is allowed in one direction only on cycle paths along all the
approaches, i.e., the cycle path on the right is for those coming towards the roundabout
and on the left for those leaving it.
Sakshaugh et al. (2010) conclude that the separated roundabout is safer than the
integrated roundabout for cyclists. The integrated roundabout is more complex with a
higher number of conflict and interaction types. Moreover, the yielding situation is clearer
in the integrated roundabout, leading to a higher yielding rate but also to a greater trust
in the other road user’s willingness to yield. Hence the motorist and the cyclist are less
prepared to act when either fails to yield. The most dangerous situations in the
integrated roundabout seem to be when the motorist enters while the cyclist is
circulating, and when the motorist exits while they are circulating in parallel. In the
separated roundabout the situations with the lowest yielding rate to cyclists occur when
the motor vehicles exit the roundabout at the same times as cyclists are riding in a
circulating direction and hence coming from the right. Still, most of the accidents in
separated roundabouts take place when motorists enter or exit the roundabouts while
cyclists are moving against the circulating direction.
All-over conclusions on safety of roundabouts
Broadly put, roundabouts are good when there is less pedestrian and bicycle traffic
crossing at the intersection. For Flanders, since the safety of pedestrians and bikers is a
top priority, it is advisable that the speeds in the vicinity of the roundabout are reduced

Steunpunt Mobiliteit & Openbare Werken 15 RA-MOW-2011-023 Spoor Verkeersveiligheid
to safe levels and the drivers be made aware of the roundabout with signs. But
roundabouts are of good use if the traffic is unsaturated and when there is not a lot of
pedestrian traffic because this could reduce the frequency of vehicle to vehicle crashes.
In other words, residential neighbourhoods or school zones are not ideal candidates for
roundabouts, but major road crossings which are congestion prone can be selectively
replaced with roundabouts.
2.1.2 Traffic Flow
While there is some disagreement on the safety issues of roundabouts in the research
community in Flanders, there is little disagreement that the roundabouts usually improve
traffic flow. All the studies agree with the improved traffic flow at the roundabouts and
this is the major reason why city planners are leaning towards roundabouts in the design
of sustainable road transport systems. The results from various studies are as follows.
In a study of three intersections in Kansas, Maryland, and Nevada, where
roundabouts replaced the previously present stop signs, it was found that vehicle
delays were reduced 13-23% and the proportion of vehicles that stopped was
reduced 14-37% (Retting et al. 2002).
A similar study where roundabouts replaced traffic signals found vehicle delays
were reduced by 89% and average vehicle stops by 56% (Retting et al. 2006).
Roundabout replacement of 11 intersections in Kansas produced on an average
65% reduction in delays and a 52% average reduction in vehicle stops after
roundabouts were installed (Russel et al. 2004).
A 2005 study from Bergh et al. (2005) documented missed opportunities to
improve traffic flow and safety at 10 urban intersections suitable for roundabouts
where either traffic signals were installed or major modifications were made to
signalized intersections. It was estimated that the use of roundabouts instead of
traffic signals at these 10 intersections would have reduced vehicle delays by 62-
74 %.
The traffic flow can be improved by adding more lanes to the roundabout, but that
might compromise safety as suggested above. The dependence of the traffic flow
as a function of number of legs, number of lanes and traffic condition is presented
extensively in a study from Mishra (2010). According to the study, when the lane
is narrow (width of 4 meters), one lane and two lane approach roundabouts
perform better than the signalized intersections under only low volume traffic
conditions. However, when the lane is wide (5 meters), roundabouts show better
performance than signalized intersection under both low volume and high volume
traffic conditions. This is because the additional space provided by the lanes
facilitated easy movement in the central island.
While these are individual and isolated studies that were dependent heavily on several
factors such as the width of lanes, traffic speed variation, awareness of the people about
the roundabout, etc, the general conclusion can be drawn that the traffic flow can be
improved with roundabouts. Improving the traffic flow due to roundabouts is a widely
accepted and tested concept and this is accounting for the increasing replacement of
traditional intersections with roundabouts in areas of high urban traffic.
2.1.3 Emissions and Fuel Usage
Because roundabouts improve the efficiency of traffic flow, they also reduce vehicle
emissions and fuel consumption.

Steunpunt Mobiliteit & Openbare Werken 16 RA-MOW-2011-023 Spoor Verkeersveiligheid
In a case study examining the environmental impact of small roundabouts,
replacing a signalized intersection with a roundabout reduced nitrous oxide
emissions by 21 percent (Varhelyi, 2002).
Another study concluded that replacing traffic signals and stop signs with
roundabouts reduced nitrous oxide emissions by 34 percent and carbon dioxide
emissions by 37 percent (Mandavilli et al. 2004).
Concerning the impact on fuel consumption, constructing roundabouts in place of
traffic signals appeared to reduce fuel consumption by about 30 percent (Verhelyi,
2002; Niittymäki and Höglund, 1999). This was attributed to the fact that the
smoother traffic flow avoided the wait time at the signal reducing the fuel usage
while the vehicle is idling.
2.1.4 Noise Emissions
Roundabouts are not specifically designed to reduce noise. However, some studies
indicate that the traditional signalized intersections cause an unacceptable level of noise
and these levels can be brought down when these intersections are replaced with
roundabouts. This can be expected since roundabouts smoothen the traffic flow at the
intersections, they could reduce noise related to stop-and-go traffic. The noise increase
depends significantly on the traffic volume, street layout and driving behaviour and it is
very difficult to draw general conclusions from one unique intersection scenario:
El-Fadel et al. (2000) presents a comparative study of different types of
intersections and concludes that noise is predominantly a factor of how the
intersections are designed and several minor details of road design such as the
width of the road, distance between the road and the building, road surface, etc
affect the noise levels at the intersections.
Noise emissions from a given intersection can be modelled given parameters such
as the road dimensions, road texture, vehicle composition and traffic intensity
(Decky, 2009). These model predictions and some case studies support the idea
that the roundabout (if replacing a traditional intersection) is effective in reducing
the noise levels by 0.5 dBA or more depending on the specific parameters
(Makarewicz, 2007).
De Coensel et al. (2007) performed a comparative, computational study of
different intersection types, in which a wide range of operational parameters were
considered. They conclude that, when there is no congestion, replacing a
conventional intersection by a roundbout would reduce noise levels by no more
than 1 dBA. There are however more pronounced effects at close distance from
the roundabout due to the different spatial layout.
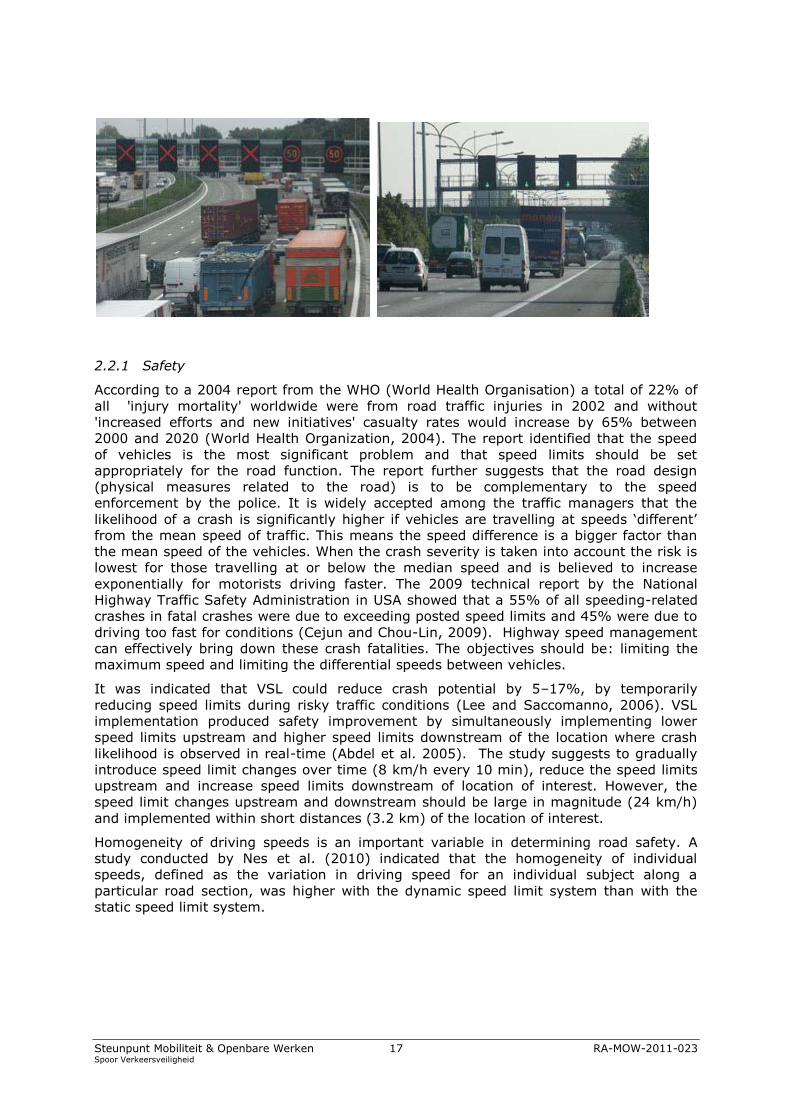
2.2 Freeway speed management
Concerning the highway speed management, the following three measures were
considered:
Reducing the speed limit
Introducing variable speed limits (VSL)
Performing speed controls
These measures are usually taken to regulate the speed of the vehicles, primarily to
improve road traffic safety. However, they can also have some benefits on fuel
consumption and reduced (noise) emissions.
Steunpunt Mobiliteit & Openbare Werken 17 RA-MOW-2011-023 Spoor Verkeersveiligheid
2.2.1 Safety
According to a 2004 report from the WHO (World Health Organisation) a total of 22% of
all 'injury mortality' worldwide were from road traffic injuries in 2002 and without
'increased efforts and new initiatives' casualty rates would increase by 65% between
2000 and 2020 (World Health Organization, 2004). The report identified that the speed
of vehicles is the most significant problem and that speed limits should be set
appropriately for the road function. The report further suggests that the road design
(physical measures related to the road) is to be complementary to the speed
enforcement by the police. It is widely accepted among the traffic managers that the
likelihood of a crash is significantly higher if vehicles are travelling at speeds ‘different’
from the mean speed of traffic. This means the speed difference is a bigger factor than
the mean speed of the vehicles. When the crash severity is taken into account the risk is
lowest for those travelling at or below the median speed and is believed to increase
exponentially for motorists driving faster. The 2009 technical report by the National
Highway Traffic Safety Administration in USA showed that a 55% of all speeding-related
crashes in fatal crashes were due to exceeding posted speed limits and 45% were due to
driving too fast for conditions (Cejun and Chou-Lin, 2009). Highway speed management
can effectively bring down these crash fatalities. The objectives should be: limiting the
maximum speed and limiting the differential speeds between vehicles.
It was indicated that VSL could reduce crash potential by 5–17%, by temporarily
reducing speed limits during risky traffic conditions (Lee and Saccomanno, 2006). VSL
implementation produced safety improvement by simultaneously implementing lower
speed limits upstream and higher speed limits downstream of the location where crash
likelihood is observed in real-time (Abdel et al. 2005). The study suggests to gradually
introduce speed limit changes over time (8 km/h every 10 min), reduce the speed limits
upstream and increase speed limits downstream of location of interest. However, the
speed limit changes upstream and downstream should be large in magnitude (24 km/h)
and implemented within short distances (3.2 km) of the location of interest.
Homogeneity of driving speeds is an important variable in determining road safety. A
study conducted by Nes et al. (2010) indicated that the homogeneity of individual
speeds, defined as the variation in driving speed for an individual subject along a
particular road section, was higher with the dynamic speed limit system than with the
static speed limit system.

Steunpunt Mobiliteit & Openbare Werken 18 RA-MOW-2011-023 Spoor Verkeersveiligheid
2.2.2 Traffic Flow
Highway traffic flow is especially complex and can be modelled only with great details of
inputs such as complex interactions between vehicles, routing and ramp metering, etc
(Boel and Mihaylova, 2006).
A variable speed limit, suitably operated and enforced, is often considered as a stand-
alone measure or in combination with ramp metering. Carlson et al. (2010)
demonstrated via several investigated control scenarios (within a software tool) that
traffic flow can be substantially improved using VSL schemes even without the aid of
ramp metering.
2.2.3 Emissions and fuel consumption
In general, highway traffic management is mainly aimed at increasing traffic safety or
smoothening the traffic flow. However, also impacts on emissions and fuel consumption
can be noted. Exhaust emissions are significantly increased by accelerating and
decelerating traffic, i.e., stop-and-go traffic, compared to traffic driving at an equivalent
constant speed, i.e. free-flowing traffic (Smit et al. 2008). Therefore, traffic flows can be
characterized by both mean average speed and speed variation. Traffic with high
dynamics (more stop and go traffic) is expected to have higher emissions than smooth
traffic (Coelho et al. 2009). Hence, it can be expected that the emissions can be
decreased if the highway traffic is effectively managed.
Several studies demonstrate that reduced highway speeds can reduce fuel
consumption and related emissions (e.g. Dijkema et al. 2008). Traffic management
studies conducted on Dutch highways suggested that the current highway speed limit
could be reduced to 80 km/h and this can produce the most desirable combined effects of
reducing energy use, emissions and accidents (Olde et al. 2005).
In a similar study conducted by Keuken et al. (2010) on highways in The Netherlands,
when the maximum speed limit of 80 km/h is imposed and tested, emissions were
reduced by 5–30% for NOx and by 5–25% for PM10. Actual emission reductions by speed
management at a specific motorway mainly depended on the ratio of congested traffic
prior and after implementation of speed management. The larger this ratio, the larger is
the relative emission reduction. Moreover, the impact on air quality of 80 km/h for NOx
and PM10 is largest on motorways with a high fraction of heavy-duty vehicles.
Apart from the reduced speed limits, variable speed limits are also suggested to
improve mobility and reduce emissions simultaneously. According to Zhong and Michael
(2006) up to a 5% reduction in distance based NOx (g/km) is possible by effective
variation of speed limits. Apart from the real time studies, simulation studies for speed
limit reductions on highways predicted congruent reductions in fuel consumption and
total emissions (e.g. EPA, 1996; Keller et al. 2008).
Speed control traffic signals are proved to be very effective instrument in reduction of
high speed crashes and pollutant emissions (Coelho et al. 2005). One concern about this
type of signals is that while they may be effective in reducing high speed crashes, they
lead to stop and go traffic. The drivers are likely to press the brakes suddenly as they
notice the sign and this could be fatal. This might slow down the following vehicles. As a
result, vehicle emissions are likely to increase, because of the existence of excessive
delays, queue formation and speed change cycles for approaching traffic. On the other
hand, if the speed control traffic signals modify drivers’ behaviour by inducing speed
reduction, they will also result in a decrease in relative pollutant emissions. This means
that the speed control signals are useful when the drivers know about the signals well in
advance and their driving behaviour is safe.

Steunpunt Mobiliteit & Openbare Werken 19 RA-MOW-2011-023 Spoor Verkeersveiligheid
2.2.4 Noise Emissions
The level of highway traffic noise depends on several factors:
The volume of the traffic
The speed of the traffic and traffic flow characteristics.
Numbers of heavy duty vehicles (usually vehicles with large diesel engines)
The road surface
Besides these factors, traffic noise levels are also increased by defective mufflers or other
faulty equipment on vehicles. Any condition (such as a steep incline) that causes heavy
labouring of motor vehicle engines will also increase traffic noise levels.
Reducing traffic volume or the amount of heavy vehicles are obvious measures to reduce
highway noise problems, but these are not always feasible on the short term. Moreover,
the effect of reducing traffic volumes should not be overestimated. Reducing traffic
volume by 50% will only reduce noise levels by 3 dBA. In practice, the effect may even
be smaller, as a reduced traffic volume may be associated with an increase in average
travel speeds. Measures that target source power, such as stimulating the use of low
noise tires, installing low noise road surfaces, or reducing travel speeds, are more
effective. For example, reducing the average speed from 120 km/h to 90 km/h will
reduce sound pressure levels by about 4 dBA (Peeters & van Blokland, 2007). Variable
speed limits are usually implemented to smoothen traffic flow, and this may increase
average speeds. Therefore, the effect of this measure on noise is less clear. A
computational study to assess the impact of implementing variable speed limits is
discussed in Section 3.4 of this report.
Congested highway traffic results in reduced average driving speed and an increase of
acceleration and deceleration. The positive effect of speed reduction on rolling noise
generally outbalances the increase in engine noise due to acceleration. Traffic noise
emission on highways during congestion is strongly correlated to driving parameters and
air pollutant emission but the relationship is far from a simple linear regression as can be
concluded from measurements on the Antwerp Ring road (Can et al., 2011).
2.3 Speed reduction on local roads
Speed reduction in residential neighbourhoods rank among the most common schemes to
improve traffic safety. Traffic managers understand very well that lower speeds reduce
the number of serious injuries, but they are forced to deal with drivers expressing their
dissent with reducing speed limits further and further for safety. However, in order to
protect residential areas from the impacts of high speed traffic, city planners devise
several methods to divert traffic away from these lower networks. Zones with 30 km/h
speed limit are becoming popular (Taylor, 2001). These are sometimes referred to as
‘Zone 30’. These are popular in busy city centres, highly dense residential
neighbourhood, near the parks where the children are expected to run across the streets,
etc.

Steunpunt Mobiliteit & Openbare Werken 20 RA-MOW-2011-023 Spoor Verkeersveiligheid
2.3.1 Safety
Several studies present the possible safety benefits of driving at lower and uniform
speeds at local roads.
Archer’s study (2008) suggested that reduced speed limits in urban areas is likely
to bring about a reduction in average travel speed and have a positive impact on
both the number of accidents and accident outcome severity. Besides, secondary
benefits suggested by the study included reduced fuel and vehicle operating costs,
and reduced vehicle emissions and noise.
Kloeden et al. (1997) proposes (from his experiments), a rule of thumb: “in a 60
km/h speed limit area, the risk of involvement in a casualty crash doubles with
each 5 km/h increase in travelling speed above 60 km/h”. According to his
analysis, a uniform 10 km/h reduction in the travelling speeds of the case vehicles
offered the greatest reduction in the number of crashes (42%) and persons injured
(35%) and also offered the greatest reduction in crash energy experienced by
injured parties in crashes that would still have taken place (39%). The 5 km/h
reduction scenario had much less effect on the elimination of crashes (15%) but
still reduced the average crash energy level experienced by the injured parties in
those crashes that still would have occurred by 24%.
Nilsson (1982), by using a number of evaluations of speed limit changes in
Sweden, developed a model that established power relationships between crashes
and proportional change in mean speed. The exponent ranged from 2 for injury
crashes to 4 for fatal crashes i.e., the risk of getting involved in a crash increases
two to four times faster with an increase in speed.
2.3.2 Emissions and Fuel Consumption
It is widely acknowledged within the scientific community that if traffic is allowed to flow
at a uniform speed, the reduction in acceleration and deceleration events associated with
stop-and-go traffic will result in increased fuel efficiency and reduced emissions. This
also calls for constant lower speeds.
Setting an ideal speed-limit for every road in a network is challenging because several
factors such as the temporal variation in traffic intensity, the direction of flow of traffic,
the amount of estimated exposure, etc. need to be considered. Hence, an optimal
approach is required since the speed reduction simultaneously influences traffic delays

Steunpunt Mobiliteit & Openbare Werken 21 RA-MOW-2011-023 Spoor Verkeersveiligheid
and waiting times as well. However, a review of the literature indicated that the
relationship between speed and fuel consumption and emissions is quite complex and is
presented in the Road Safety Handbook (Elvik and Vaa, 2004).
Some findings relating speed limits with emissions and fuel use are as follows.
Model predictions by Pelkmans et al. (2005) demonstrated that when average
speed is reduced from speeds above 100 km/h down to 80 or 60 km/h, fuel
consumption can be expected to decrease. However, when the average speed
drops below 30 or 40 km/h, fuel consumption increases significantly. Emissions of
NOx, CO and HC also increase in this case. So, according to Pelkmans, it is
necessary to prevent traffic jams and promote slow moving traffic for reduced fuel
usage.
The study by Int Panis et al. (2006) suggests that the analysis of the
environmental impacts of any traffic management and control policies is a
complex issue and requires detailed analysis of not only their impact on average
speeds but also on other aspects of vehicle operation such as acceleration and
deceleration. According to the study, there is a huge dependency of emissions on
average speed and speed variation.
Ihab et al. (2005) argued that the acceleration (reflective of traffic dynamics) is
key factor in determining emissions. The study predicted that when emissions are
gathered over a sufficiently long fixed distance, fuel-consumption and mobile-
source emissions rates per-unit distance increase as the level of acceleration
increases because of the rich-mode engine operations.
Road authorities in various countries (e.g. the United Kingdom, Spain, Switzerland
and Netherlands) have employed reduced speeds in their traffic management
schemes to improve air quality near heavy-traffic roads (Van Beek et al. 2007;
Gonçalves et al. 2008).
Similarly, a pilot study in Rotterdam concluded that reducing traffic dynamics (i.e.
uniform traffic flow) is especially important for effective reduction of traffic
exhaust Research results obtained from a case study on reduced speeds in a
residential area, report that reductions in CO2 and NOX emissions of the order of
25% were found if speed limits are lowered from 50 to 30 km/h (Madireddy et al.
2011).
2.3.3 Noise Emissions
The most important sources of noise in road vehicles are the engine (mainly emitting to
the environment via the exhaust but also through air inlet and frame vibration) the
transmission system, the tires (noise generated from the interaction of the tires with the
road surface) and the vehicle frame (aerodynamic noise). At lower travelling speeds, the
engine is the predominant source of noise, and the source power of the latter is directly
linked to the engine rpm and thus influenced by vehicle speed and acceleration. Thus,
reducing average speeds on local roads and in urban context can be expected to have a
direct reducing effect on sound pressure levels:
Desarnaulds et al. (2004) show that speed limitation (from 50 to 30 km/h)
induces a noise reduction of 2 to 4 dB(A) for passenger cars and 0 to 2dB(A)
for heavy vehicles (and 2 dBA more for the maximum noise level).
In another study, Berengier et al. (2008) studied the impacts of speed reducing
equipments and suggested that the noise can be mitigated through speed
reduction and smoothening of the traffic flow. Uncarefully designed speed
reduction equipment might however increase noise levels locally.

Steunpunt Mobiliteit & Openbare Werken 22 RA-MOW-2011-023 Spoor Verkeersveiligheid
Model predictions by OFEFP, a simplified road traffic noise model, showed that
with every 5 km/h reduction in speed levels of the vehicles, the noise subsided
by 0.5 dB(A) (Desarnaulds et al. 2004).
Care should be taken in mixed urban environments since reducing speed on the
minor roads may not have the expected effect if more distant higher level
roads contribute significantly to the overall noise level. This will be explicated in
case study A. Moreover speed limit reduction might change the temporal
structure of the overall sound climate: lower speed gives less distinct peaks
and more constant sound. This is expected to further reduce the effects on
people, in particular at night.
2.4 Low emission zones (LEZ)
A low emission zone is a geographical zone with special regulations and restrictions for
car and heavy vehicle traffic apply aimed at reducing air pollution. Environmental zone is
another name for Low Emission Zone (LEZ). Environmental zones are getting increasingly
popular in many European cities:
The environmental zone introduced in Stockholm, the capital city of Sweden
was extremely successful in improving the local air quality.
London has worked with reducing the accessibility for traffic in the city by
reducing the number of Entry points and by closing streets (or making one-
way streets).
In Prague, the restriction in the zone holds for heavy vehicles with a weight
over a special limit.
In Barcelona, the city is closed for traffic during a special time of the day.
German cities, under a law passed in 2006, are acquiring environmental
zones, areas into which you can't drive your car unless it bears a windshield
sticker certifying that it has an acceptable emission level.
There are at least 11 cities (Amsterdam, Utrecht, Rotterdam, Den Haag,
Eindhoven, Breda, Den Bosch, Tilburg, Delft, Leiden and Maastricht) in the
Netherlands that have introduced environmental zones in their city centres.
Only clean lorries, defined by the Euro norm may enter environmental zones.
2.4.1 Emissions
The major purpose of the LEZ is to reduce local emissions. This can be done by simply
restraining the high polluting fraction of the vehicle fleet, namely heavy duty trucks.

Steunpunt Mobiliteit & Openbare Werken 23 RA-MOW-2011-023 Spoor Verkeersveiligheid
These heavy duty trucks, even though they make a very small percentage of the total
vehicles on the road, their overall contribution to NOx and PM emissions is about 50%
(VMM, 2011). These emissions are compounded when the vehicles have to overcome
high inertial load during the acceleration and deceleration phases that are a significant
part of the city driving. Hence banning the heavy duty vehicles from the LEZ is expected
to improve the local air quality. This technique of restricting high polluting vehicles or
vehicles with lower euro norms from city centres and residential neighbourhoods is
getting common in European cities.
In Stockholm, the environmental zone covers around 30% of the total population
of the city. An assessment of the air quality benefits within this zone revealed
that the NOx emissions were reduced by 10% and emissions of particulates by
40% within the LEZ (Johansson and Burman, 2006)
In Goteborg, another city in Sweden, the introduction of an environmental zone
for heavy duty vehicles was posted in 1996. The entire diesel powered vehicles
over 3.5 tons were banned from the zone. Owing to this, there were significant
reductions in CO (3.6%), HC (6.1%), NOx (7.8%) and PM10 (33.2%) (Johansson,
2006). While some of these reductions can be partially attributed to the
technological improvements, the underlying cause is the introduction of
environmental zone.
In London, road transport is the single biggest source of PM and NOX. LEZs
introduced in Greater London were successfully able to reduce traffic pollution by
deterring the most polluting diesel-engine lorries, buses, coaches, minibuses and
large vans from driving within the city (Bush, 2006). A simulation study projected
that the total tonnes of NOx emitted in Greater London will reduce by about 1 100
tons in 2008 and by 1 200 in 2010 while the PM10 (which include exhaust and tire
and brake wear) will reduce by 100 tons in 2008 and by 200 tons in 2010. The
reductions of NOx were predominantly expected in the roads with the greatest
portion of heavy duty vehicles. However, future projections suggested that the
greatest reductions in NOx and PM10 concentrations are expected to occur after
2012 when the Euro VI norms will be introduced.
2.4.2 Noise Emissions
The noise emissions can also be reduced if a LEZ is introduced. Since heavy trucks, which
are normally banned from the LEZ, also produce higher noise power levels, in particular
at low frequencies, a significant drop in overall noise levels could be expected. Several of
the LEZs in major cities experienced a noise reduction, e.g. a network wide reduction by
0.3 dBA in the inner city of London (Barrowcliffe, 2006). In the future, noise reduction
could also become important if zones are restricted to hybrid and electric vehicles. At
urban driving speeds, where rolling noise is limited, these vehicles will produce
significantly lower noise levels. In addition they are often equipped with low-noise-
emission tires, which further reduce rolling noise. However, a potential side-effect could
be that through the implementation of a LEZ, heavy traffic is rerouted along arterial
access or ring roads, which could increase noise levels along these roads significantly.
2.5 Effect of traffic lights synchronization
To regulate traffic along major roads, city planners often employ synchronization of
traffic lights (the so-called ‘green wave’). A green wave is an intentionally induced
phenomenon in which a series of traffic lights (usually three or more) are coordinated to
allow continuous traffic flow over several intersections in one main direction. The
coordination of the signals is either done dynamically by using the sensor data of
currently existing traffic flows or statistically by the use of timers.

Steunpunt Mobiliteit & Openbare Werken 24 RA-MOW-2011-023 Spoor Verkeersveiligheid
2.5.1 Traffic Flow
A vehicle encountering a green wave, if travelling at the suggested road speed, will see a
progressive cascade of green lights, and not have to stop at intersections. The following
remarks or interesting studies can be mentioned on the impact of green waves on traffic
flow:
The green wave measure will be useful for only a set of vehicles through the
intersections before the flow is interrupted by other traffic flows (usually
perpendicular) through the intersections. This problem is compounded if there
is an equally higher traffic flow from all the legs to the intersection. If it is one
main arterial road with small minor roads, signal light timings can be timed to
maximize the total flow through the main road.
Grerhenson et al. (2008) proposed a scheme in which traffic lights self-
organize to improve traffic flow. Using simple rules and no direct
communication, traffic lights are able to self-organize and adapt to changing
traffic conditions, reducing waiting times, number of stopped cars, and
increasing average speeds.
Hewage et al. (2004) discusses a special-purpose simulation tool that can be
effectively used to optimize signal light timing.
Huang et al. (2003) argued that the green-light wave solutions can be realized
only for under-saturated traffic. However, for saturated traffic, the correlation
among the traffic signals has no effect on the throughput. While coordinating of
the traffic lights is simple enough to implement, the bigger challenge comes
when the traffic volume is near saturation. A green wave has a disadvantage
that slow drivers may reach a red signal at the traffic lights, with a queue of
traffic may build up behind them, thus ending the wave. In general, stopping
and then starting at a red light will require more time to reach the speed of the
wave coming from behind when the traffic light turns to green.
This saturation limit of traffic at which green wave is no longer effective was
addressed by Brockfeld et al. (2001). The study concluded that the capacity of
the network strongly depends on the cycle times of the traffic lights and that
the optimal time periods are determined by the geometric characteristics of the
network, i.e., the distance between the intersections. The study proposed that
when the lights were synchronized, the derivation of the optimal cycle times in
the network can be obtained through flow optimization of a single street with
one traffic light operating as a bottleneck.
Madireddy et al. (2011) however points out that, if traffic signal coordination
decreases travel times, the effect of facilitating traffic flow may, in the long
term, induce additional traffic with the potential side effect of offsetting some
of the beneficial environmental consequences of signal coordination.

Steunpunt Mobiliteit & Openbare Werken 25 RA-MOW-2011-023 Spoor Verkeersveiligheid
2.5.2 Emissions and Fuel Consumption
Traffic light synchronization is employed basically to maximize traffic flow while
minimizing stops for a given traffic volume, but the useful added benefits could be
realized in reduction of fuel consumption and improvement of air quality around the
intersections.
In a study conducted by Unal et al. (2003), the relationship between the signal
coordination and emissions is presented. For the selected test vehicles, the
emissions rates were highest during acceleration and tend to decrease for
cruise, deceleration, and idle. The study also concluded that the emissions
were lower at the congested conditions than uncongested conditions.
Li et al. (2004) proposed a signal timing model, in which a performance index
function for optimization is defined to reduce vehicle delays, fuel consumption
and emissions at intersections. This model optimizes the signal cycle length
and green time by considering the constraint of a minimum green time to allow
pedestrians to cross.
The concept of optimizing signal timings to reduce fuel consumption and
emissions was addressed in a study by Stevanovic et al. (2009) by linking
emissions models to optimize signal timings. This had minimized fuel
consumption, local and CO2 emissions. Based on this study, when estimated
fuel consumption is used as an objective function, fuel savings of 1.5% were
estimated.
Madireddy et al. (2010, 2011) reports that on a major urban road, the NOx and
CO2 emissions can be reduced by 10% when the lights were synchronized.
2.5.3 Noise Emissions
Research on the influence of traffic light coordination on noise emission is by no means
complete; literature on the effects of signal coordination on noise is sparse, as most
studies consider the noise emission at a single intersection at most. In general, most
recent studies show a mixed effect of signal coordination on noise levels, with increases
in noise level in between intersections, and decreases near intersections:
Based on a review of measurements performed in the UK and Switzerland,
Desarnaulds et al. (2004) found that coordination of traffic lights may lower the
sound pressure level near intersections by up to 2 dBA.
As part of the SILENCE project, simulations were carried out for a road with
three signalized intersections with 200m and 500m in between (Bérengier &
Picaut, 2008). Two situations with coordinated traffic lights were compared: a
green wave and a red wave, in which cars have to stop at all traffic lights.
Results indicated that, for the given traffic intensity of 1440 vehicles/hour,
sound pressure levels could be lowered by up to 4 dBA near the intersections
(comparing the green wave to the extreme case of the red wave), but could
increase by as much as 3 dBA in between intersections, due to higher average
speeds.
De Coensel et al. (2010) also examined the effects of traffic light coordination
on noise emissions. From their observations, they argued that while there can
be a reduction of up to 1 dBA in the noise levels near the intersections when
there is a coordination of traffic lights along an arterial road, there can be an
increase in the noise level by 1.5 dBA along the road between the intersections.
This study suggests that the net effect of synchronizing traffic lights is negative
in noise perspective.

Steunpunt Mobiliteit & Openbare Werken 26 RA-MOW-2011-023 Spoor Verkeersveiligheid
2.6 Speed humps/bumps
Speed humps/bumps are traffic calming devices intended to reduce vehicle speed. The
‘bumps’ usually refer to the shorter variants whereas the ‘humps’ are usually longer in
depth.
Figure 3. Speed humps and bumps on the road (picture: Kluwer)
Speed humps are fundamentally designed to slow traffic in residential areas. They are
usually referred to as “sleeping police”. These will reduce vehicle speed both upstream
and downstream of the humps, besides a significant speed reduction at the humps. In an
extensive study conducted by Hallmark and Smith (2002) the impact of speed bumps on
vehicle speeds and speed profiles is investigated. The speed reduction devices are found
to be effective in reducing the mean vehicle speeds and also the number of vehicles that
exceed the speed limit (Hallmark and Smith, 2002).
2.6.1 Safety
Traffic calming is typically implemented to address speeding and external traffic
concerns. It is intuitively recognized that successful traffic calming would therefore result
in safety benefits. The magnitude of these benefits varied among the projects, with an
average 40 percent reduction in collision frequency and 38 percent reduction in the
annual claims costs.
In Zein et al. (1997) a total of 85 case studies from Europe, Australia, and North
America were reviewed to determine the safety benefits of traffic calming as
measured by other jurisdictions. The international case studies in which more
than five pre-calming collisions per year occurred were analyzed separately. In
this group of 15 studies, the decrease in collision frequency ranged from 8
percent to 95 percent.

Steunpunt Mobiliteit & Openbare Werken 27 RA-MOW-2011-023 Spoor Verkeersveiligheid
A multivariate conditional logistic regression analysis showed that speed humps
were associated with lower odds of children being injured within their
neighbourhood (adjusted odds ratio [OR] = 0.47) and being struck in front of
their home (adjusted OR = 0.40) (Tester et al., 2004).
2.6.2 Emissions and Fuel Consumption
Kyoungho and Hesham (2009) found that speed bumps and humps increase the traffic
dynamics of the vehicles by creating acceleration and deceleration and this results in low
fuel efficiency and higher emissions. This was usually the biggest criticism towards
building road bumps. If they were built permanently, they could cause slowing traffic
even during the off peak hours, which would be unnecessary. Moreover they increase
vehicle wear and tear. Moreover speed bumps are often a hindrance to emergency
vehicles.
2.6.3 Noise Emissions
Besides improving safety, speed humps can also reduce traffic noise through speed
reduction. Traffic Advisory Leaflets for UK Roads (1996) mention significant noise level
reductions obtained with speed bumps of a height of 75 to 100 mm. Speed humps, are
found effective in reduction of noise levels for cars. However the effectiveness of speed
humps depends primarily on the distance between the humps and effective speed
reduction they introduce.
The report from Desnarnaulds et al. (2004) mentions also results for studies conducted
the UK and in Denmark. A study conducted in the towns of Slough and York showed that
when the speed reductions in the range of 10 km/h, speed humps can bring about a
noise level reduction 10 dB(A) for the cars and 4 dB(A) for busses (see also Abbott et al.
1997). Results from the study in Denmark, shows that humps lower the noise thanks to
the speed reduction they induce. There is however a slight increase in the noise before
and after the speed reducers due to braking followed by acceleration of the vehicles.
Speed humps and bumps should be designed carefully to avoid the local increase of noise
they may cause. Changing the road surface on the hump should be avoided since it
introduces additional noise. Speed bumps on roads that carry heavy traffic can introduce
significant amount of peak noise in case of loose cargo. Although this type of noise can
be the most important factor in noise annoyance and sleep disturbance, it does not
always show in the averaged noise level. For these reasons other infrastructure measures
such as lane narrowing and road axis displacement that effectively reduce driving speed
should be preferred over bumps and humps when it comes to reducing noise levels.

Steunpunt Mobiliteit & Openbare Werken 28 RA-MOW-2011-023 Spoor Verkeersveiligheid
3. CA SE ST U D IE S
In this chapter, the effect of three different traffic management measures on air pollutant
and noise emissions is considered:
A. reducing speed limits in urban environment;
B. coordinating traffic signals on arterial roads;
C. introducing variable speed limits on freeways.
For each of these traffic management measures, an existing case study was selected
(Zurenborg in Antwerp for measures A and B, and the E313 freeway for measure C). A
computational approach has been adopted for each measure/case study, and in the next
section, we will briefly describe the common methodology.
3.1 Applied simulation models
3.1.1 Microscopic traffic simulation model
We use Quadstone Paramics, a commercially available microscopic traffic simulation tool,
to simulate traffic conditions. Case study networks are constructed on the basis of
geographic information system (GIS) data and aerial photographs, which supply the
detailed positions of all roads and buildings in the area. Network wide traffic demands are
calibrated for the morning rush-hour in all case studies, based on traffic counts made
available by the Flemish Department of Mobility and Public Works. For case study A and
B, traffic signal parameters (cycle times, signal offsets between intersections, etc.) were
set according to the actual situation, based on data obtained from the Antwerp police
department. In all case studies, light- and heavy-duty vehicles are considered, which
were linked to the respective emission classes of the emission model. For case study A
and B, the railway passing through the area was not modeled, as we mainly consider
emissions by road traffic in this work. The simulation period was 1h for case studies A
and B, and 4h for case study C, all with a timestep of 0.5s. Vehicles are loaded onto the
network at the edge roads along the sides of the network, according to the traffic
demand. During simulation, the position, speed and acceleration of each vehicle is
recorded at each timestep, for subsequent calculation of emissions.
Although the microscopic traffic model is able to take into account a wide range of
vehicle driving behavior, a number of factors that have an influence on vehicle speeds
and accelerations cannot be fully embraced. Among those are the influence of
pedestrians crossing the street in urban context, cars slowing down to park or cars
leaving a parking spot, or the full extent of the stochastic component in driver’s behavior.
Next to this, the traffic counts used to calibrate the model reflect the average situation
during morning rush hour. Therefore, traffic counts and speed distributions measured at
a single instant in time within the simulated region could significantly differ from those
that are simulated. Nevertheless, as only average trends are usually considered,
microscopic traffic simulation models are increasingly being applied for estimating the
emissions from traffic flows. Earlier work has shown that, for emission modeling
purposes, a reasonably good agreement between simulated and measured speeds and
accelerations can be achieved (De Coensel et al., 2005).
3.1.2 Emission models for air pollutants and noise
The instantaneous CO2 and NOX emission of each vehicle in the simulation is calculated
using the VERSIT+ vehicle exhaust emission model, based on the speeds and
accelerations extracted from the traffic model. The latter model (Smit et al., 2007), is
based on more than 12,500 measurements on vehicles of a wide range of makes and
models, fuel types, Euro class, fuel injection technology, types of transmission, etc. It
uses multivariate regression techniques to determine emission factors for different
vehicle classes. As the model requires actual driving pattern data as input, it is fully
capable of accounting for the effects of congestion on emission. A derived model was

Steunpunt Mobiliteit & Openbare Werken 29 RA-MOW-2011-023 Spoor Verkeersveiligheid
recently developed by TNO (Ligterink and De Lange, 2009), specifically targeted at a
coupling with microscopic traffic simulation models. For this, emission parameters of
vehicles of varying age, fuel type, etc. are aggregated into a prototypical vehicle
emission model representing the average emission of the Dutch vehicle fleet. While there
may be differences between individual vehicles, the model aims at predicting aggregates
over a sufficiently large number of vehicles sampled from the Dutch vehicle fleet. Here
the VERSIT+ light and heavy-duty vehicle classes representing the fleet in Dutch urban
environments during 2009 are used. Finally, only overall emissions are considered; the
dispersion of air pollutants is not modeled.
When the layout of the network, the signal timing, road signs and origin-destination
matrices are defined, Paramics is able to simulate trips of individual vehicles on the
network. The result of these simulations is a file with a second by second record of
vehicle positions and speeds. These files are the input for the emission model Versit+,
which returns the instantaneous emission of CO2, NOx and PM10. The PM10 emissions are
the sum of exhaust and non-exhaust particulate matter. Because the emission functions
are valid for the Dutch fleet of 2009, and because in Belgium the share of Diesel cars is
higher than in the Netherlands, the emissions of NOx and PM10 will be underestimated and
the emissions of CO2 overestimated. However, the trends will be similar.
A small-scale validation of the dynamic properties of the emission model was carried out
using VOEM, VITO’s on-road emission and energy measurement system (De Vlieger,
1997). Measurements of instantaneous speed, acceleration, CO2 and NOX emissions were
carried out using four diesel vehicles subjected to the MOL30 driving cycle, which is
based on real driving behavior in urban, suburban and freeway traffic situations.
Subsequently, the emission model was used to estimate the CO2 and NOX emissions
based on measured speeds and accelerations. Finally, both measured and estimated
emission time series are compared. In general, a good dynamic agreement is found, with
temporal correlation factors of 0.90 ± 0.030 for CO2 and 0.72 ± 0.10 for NOX for all test
vehicles, indicating that the model is able to capture the dependencies on speed and
acceleration well. The somewhat lower correlations for NOX may be explained by the
presence of an exhaust gas recirculation system in some of the vehicles. Details of this
validation can be found in Trachet et al. (2010).
The instantaneous noise emission of each vehicle in the simulation is calculated using the
Imagine road traffic noise emission model (Peeters and van Blockland, 2007), which is in
itself an update of the earlier Harmonoise model. This model was specifically developed
with microscopic traffic simulation in mind, and has been validated widely on an
European scale, using measurements on a large number of vehicles, driven on a wide
range of road surface types. The model forms the basis for a potential future European
standard for road traffic noise prediction, and was calibrated to generate the average
noise emission in the European vehicle fleet. As with the air pollutant emission model,
the Imagine model aims to correctly predict measurements results aggregated over a
sufficiently large number of vehicles sampled from the European fleet.
The Imagine noise emission model produces point source sound power levels at a specific
height above the ground, on the basis of vehicle type, speed and acceleration. Two
sources of noise are considered: rolling noise generated by tire-road interaction, and
combined powertrain and exhaust noise. Emissions are calculated on a 1/3-octave band
basis; however, in this work we only considered the total (A-weighted) source sound
power level, noted as LW. When the noise emission of a vehicle trip through the network
is considered, we further define LWavg as the average source sound power level of the
particular vehicle over the course of its trip (energetically averaged). In a similar way,
the total source sound power level LWtot for the trip of a single vehicle can be defined,
which also takes into account the duration of the trip. The latter value is thus directly
related with sound pressure levels along the route of the vehicle.
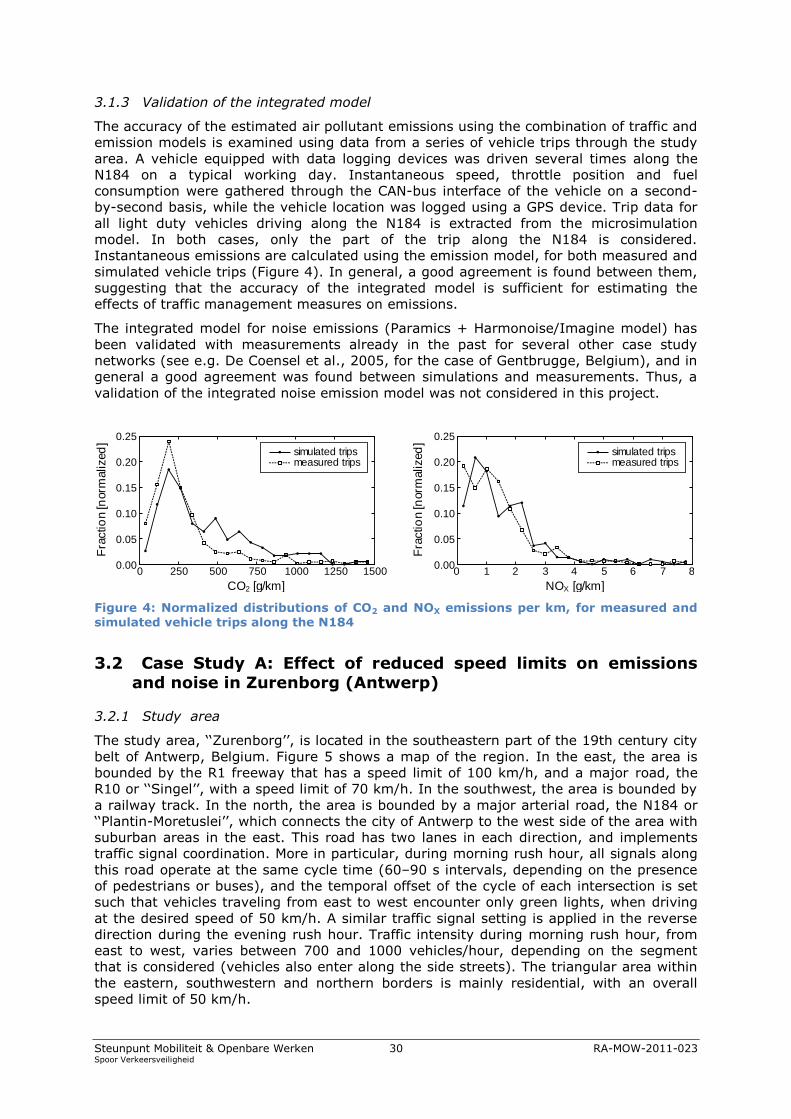
Steunpunt Mobiliteit & Openbare Werken 30 RA-MOW-2011-023 Spoor Verkeersveiligheid
3.1.3 Validation of the integrated model
The accuracy of the estimated air pollutant emissions using the combination of traffic and
emission models is examined using data from a series of vehicle trips through the study
area. A vehicle equipped with data logging devices was driven several times along the
N184 on a typical working day. Instantaneous speed, throttle position and fuel
consumption were gathered through the CAN-bus interface of the vehicle on a second-
by-second basis, while the vehicle location was logged using a GPS device. Trip data for
all light duty vehicles driving along the N184 is extracted from the microsimulation
model. In both cases, only the part of the trip along the N184 is considered.
Instantaneous emissions are calculated using the emission model, for both measured and
simulated vehicle trips (Figure 4). In general, a good agreement is found between them,
suggesting that the accuracy of the integrated model is sufficient for estimating the
effects of traffic management measures on emissions.
The integrated model for noise emissions (Paramics + Harmonoise/Imagine model) has
been validated with measurements already in the past for several other case study
networks (see e.g. De Coensel et al., 2005, for the case of Gentbrugge, Belgium), and in
general a good agreement was found between simulations and measurements. Thus, a
validation of the integrated noise emission model was not considered in this project.
Figure 4: Normalized distributions of CO2 and NOX emissions per km, for measured and simulated vehicle trips along the N184
3.2 Case Study A: Effect of reduced speed limits on emissions
and noise in Zurenborg (Antwerp)
3.2.1 Study area
The study area, ‘‘Zurenborg’’, is located in the southeastern part of the 19th century city
belt of Antwerp, Belgium. Figure 5 shows a map of the region. In the east, the area is
bounded by the R1 freeway that has a speed limit of 100 km/h, and a major road, the
R10 or ‘‘Singel’’, with a speed limit of 70 km/h. In the southwest, the area is bounded by
a railway track. In the north, the area is bounded by a major arterial road, the N184 or
‘‘Plantin-Moretuslei’’, which connects the city of Antwerp to the west side of the area with
suburban areas in the east. This road has two lanes in each direction, and implements
traffic signal coordination. More in particular, during morning rush hour, all signals along
this road operate at the same cycle time (60–90 s intervals, depending on the presence
of pedestrians or buses), and the temporal offset of the cycle of each intersection is set
such that vehicles traveling from east to west encounter only green lights, when driving
at the desired speed of 50 km/h. A similar traffic signal setting is applied in the reverse
direction during the evening rush hour. Traffic intensity during morning rush hour, from
east to west, varies between 700 and 1000 vehicles/hour, depending on the segment
that is considered (vehicles also enter along the side streets). The triangular area within
the eastern, southwestern and northern borders is mainly residential, with an overall
speed limit of 50 km/h.
0.25
0.20
0.15
0.10
0.05
0.000 1 2 3 4 5 6 7 8
Fra
ctio
n [n
orm
alized
]
NO [g/km]X
simulated tripsmeasured trips
0.25
0.20
0.15
0.10
0.05
0.000 250 500 750 1000 1250 1500
Fra
ctio
n [n
orm
alized
]
CO [g/km]2
simulated tripsmeasured trips

Steunpunt Mobiliteit & Openbare Werken 31 RA-MOW-2011-023 Spoor Verkeersveiligheid
Figure 5: Study area of ‘‘Zurenborg’’ in Antwerp, Belgium
Note: The triangular area bounded by the R1, the N184 and the railway forms the outline of the traffic simulation network. The circles along the N184 mark signalized intersections with coordinated traffic lights.
3.2.2 Policy measures
As a first traffic management measure, the effect of a speed limit reduction is studied.
Based on measures being considered by the traffic planning authorities of the city of
Antwerp, speed limits are reduced from 100 to 70 km/h on the freeway, from 70 to 50
km/h on the Singel, and from 50 to 30 km/h on the other residential roads and the
N184. For the latter, the traffic signal coordination is recalibrated for the lower speed
limit to have a green wave as in the original scenario. The microscopic traffic simulation
model applies dynamic traffic assignment: routes are chosen according to the
instantaneous congestion conditions. Traffic demands are kept constant.
3.2.3 Emissions of air pollutants and noise
The changes in the distribution of instantaneous speeds and accelerations for vehicles
driving within the residential part of the network (excluding the N184, R10 and R1) are
seen in Figure 6. Next to a reduction in average speeds, the speed distribution becomes
narrower, coupled with a reduction in the occurrence of maximum acceleration events.
Hence, the speed limit reduction results in a smoother traffic flow in the residential area.
Maximum speeds are about 10% above the speed limits because the traffic model also
accounts for speeding to resemble the actual situation as closely as possible.
R10
R1
N184
Railway
0 100 200 300 400m
N
E
S
W

Steunpunt Mobiliteit & Openbare Werken 32 RA-MOW-2011-023 Spoor Verkeersveiligheid
Figure 6: Normalized distributions of instantaneous speed and acceleration, for vehicles
driving within the residential part of the network (original versus reduced speed limits)
Figure 7 shows the corresponding change in distribution of instantaneous distance-based
emissions for the light duty vehicles; the results for heavy-duty vehicles show a similar
trend. The distance travelled by all vehicles within the residential area fell by 14.1%
because of traffic rerouting, but CO2 and NOX emissions fell by 26.8% and 26.7%.
Consequently, a reduction in distance-based emissions is also seen in Figure 7. For the
vehicles moving along the N184, similar results are found. Although the distance
travelled by all vehicles along the N184 only falls by 0.2%, still, a reduction in CO2 and
NOX emissions by 9.9% and 10.4% is recorded. Considering noise emissions, reducing
speeds has a clear beneficial influence, with reductions in total noise emission from 1.2 to
1.9 dB(A).
Figure 7: Normalized distributions of CO2 and NOX emissions per km, for vehicles driving within the residential part of the network (original versus reduced speed limits)
It should be remarked that the speeds simulated by paramics are on the high side. In
reality in is not possible to drive at an average speed of about 50 km/h in a
neighbourhood like Zurenborg (see Figure 6). Many obstacles like crossing pedestrians,
parking cars, cyclists and crossroads with a poor view limit the speed considerably.
However, modelling these features is very time consuming and was not possible in this
project. This might influence the magnitude of the effects calculated above but not the
overall trends.
3.3 Case Study B: Effect of green wave on emissions and noise in
Zurenborg (Antwerp)
3.3.1 Study area
For case study B, the same study area as for case study A is considered, and therefore
we refer to section 3.2.1 . In particular, case study B focuses on the major arterial road,
the N184 or ‘‘Plantin-Moretuslei’’ (Figure 5).
1.0
0.8
0.6
0.4
0.2
0.0-2 -1 0 1 2
Fra
ctio
n [n
orm
alized
]
Acceleration [m/s ]2
original scenarioreduced speed limits
0.5
0.4
0.3
0.2
0.1
0.00 10 20 30 40 50 60
Fra
ctio
n [n
orm
alized
]
Speed [km/h]
original scenarioreduced speed limits
1.0
0.8
0.6
0.4
0.2
0.00.0 0.5 1.0 1.5 2.0
Fra
ctio
n [n
orm
alized
]
NO [g/km]X
original scenarioreduced speed limits
1.0
0.8
0.6
0.4
0.2
0.00 250 500 750 1000 1250 1500
Fra
ctio
n [n
orm
alized
]
CO [g/km]2
original scenarioreduced speed limits

Steunpunt Mobiliteit & Openbare Werken 33 RA-MOW-2011-023 Spoor Verkeersveiligheid
3.3.2 Policy measures
For the N184 also the effect of traffic signal coordination is studied. The original situation,
with implementation of a green wave from east to west, is compared to a scenario in
which coordination is removed. To desynchronize the traffic signals, a small but random
number of seconds (≤2) is added or subtracted from the cycle times of all lights along
the N184. This results in a wide range of waiting times and queue lengths at each
intersection being encountered over the course of the simulation run, with the results
representing the average over all possible schemes in which there is no signal
coordination. Again, traffic demands were kept constant.
3.3.3 Emissions of air pollutants, CO2 and noise
Figure 8 shows the changes in the distribution of trip emissions for the light duty vehicles
that drove along the N184, completing their trips during the simulation run; only that
part of the trip along the N184 is considered. When the signal coordination is removed,
the combined light and heavy-duty vehicles CO2 and NOX emissions increase by 9.5%
and 8.7% because of the more interrupted traffic flow.
Figure 8: Distributions of CO2 and NOX emissions, for light duty vehicle trips along the
N184 (original versus without green wave)
Considering noise, it was found that the average vehicle sound power would decrease by
0.6 dBA (for heavy duty vehicles) to 0.9 dBA (for light duty vehicles) when the green
wave is removed. However, because trips would take a longer time to complete, the
average total emission was found to still increase with 0.1 to 0.3 dBA. The effect of the
green wave on total noise emissions thus seemed to be negligible. However, there are
large spatial variations. Sound pressure levels, calculated using an ISO 9613 sound
propagation model, were found to increase by up to 1 dBA near the signalized
intersections, but to decrease by up to 1.5 dBA in between intersections, when the green
wave is removed.
3.4 Case Study C: Effect of variable speed limits on emissions and noise on the E313
3.4.1 Introduction: study area and scenarios
The E313 between the cities of Antwerp and Liege is a major link in the Belgian highway
network. Its primary functions are:
An east-west link for long distance traffic.
A link between the harbour of Antwerp and the Ruhrgebiet in Germany.
Providing access from the Kempen, in the Northeast of Belgium, to the capital
area of Brussels.
Providing access to the large industrial areas along the Albert Canal.
100
80
60
40
20
00.0 0.5 1.0 1.5 2.0 2.5
Num
be
r of
trip
s
NO [g]X
original scenariowithout green wave
50
40
30
20
10
00 200 400 600 800 1000
Num
be
r of
trip
s
CO [g]2
original scenariowithout green wave

Steunpunt Mobiliteit & Openbare Werken 34 RA-MOW-2011-023 Spoor Verkeersveiligheid
Figure 9: Degree of congestion on the E313 highway between Liege and Antwerp (Vlaams Verkeerscentrum, 2009a).
On the stretch between Antwerpen-Oost and Wommelgem (on top of Figure 9) pass up to
150 000 vehicles per day. Because 23% are trucks, a passenger car equivalent of
180 000 vehicles per day is reached. All day long the traffic volume on this stretch of
highway lies over 90% of its maximum capacity. As a consequence traffic jams are a
daily problem. On a normal morning a traffic jam starts building up from the junction
with the Antwerp ring road in the direction of Liege (top of Figure 9). A second traffic jam
starts to form at the junction between the E34 and the E313. During the morning rush
hour these traffic jams grow together. Accidents are very frequent in both directions
(Vlaams Verkeerscentrum, 2009b). In the direction of Antwerp 595 accidents occurred in
the period 2006-2008 or almost 1 accident every 3 days. In the direction of Antwerp
24% of the accidents are related to traffic jams. Drivers do not notice the traffic jam in
time and crash into the queuing vehicles. Other causes are a wet road surface and sharp
turns on some approaches. Due to the high traffic density, each incident causes even
bigger traffic jams.

Steunpunt Mobiliteit & Openbare Werken 35 RA-MOW-2011-023 Spoor Verkeersveiligheid
Figure 10: VSL gantries around Antwerp (Vlaams Verkeerscentrum, 2011).
To tackle the problem of accidents at the tail of traffic jams, the Vlaams Verkeerscentrum
(VVC - Flemish Traffic Centre) implemented variable speed limits (VSL) between Geel-
Oost and Antwerpen-Oost. In 2007 the system was finished and equipped with a semi-
automatic control. The infrastructure consists of gantries and loop detector about every
750 m over about 40 km (Figure 10). Each gantry has a digital panel above each lane.
This panel can display a speed limit or other traffic information. For example in the case
of an accident an evacuation arrow or a red cross will be shown above a blocked lane.
The loop detectors count vehicles and measure their speed. If a traffic jam is detected
(high vehicle density and low speed) the speed limits on the upstream panels will be
reduced gradually. Figure 11 shows the algorithm used to determine the speed limit as a
function of the speed and occupation measured by the loop detectors of the next
downstream gantry. The speed limit is updated each time the speed or occupation moves
out of the overlapping intervals. In a next step the speed limits are equalized over each
gantry. Finally it is checked if the difference between successive gantries is not bigger
than 20 km/h. In this case the speed limits are reduced in steps of 20 km/h.
The objective of this study is to evaluate the effect of VSL on tailpipe emissions (CO2,
NOX and PM10) and on noise levels along the freeway. The study area is the section
between Geel-Oost and Antwerp (Figure 9). The VSL system warns people in advance of
a traffic jam further ahead. Hence, they are able to slow down more gradually instead of
breaking at the last moment when they see the traffic jam. This may have a small effect
on emissons. The speed limits are compulsory. However, in reality the variable speed
limits are ignored by most car drivers and not enforced by the police. Hence, there
expected effect will be small. In Paramics, the speed limit reductions are adhered to, so
Paramics will overestimate the effects.
Besides VSL other measures will be studied:
The VSL signs can also be used to deliberately reduce speed limits to reduce air
pollution. The effect of a 90 km/h speed limit will be evaluated.
An extra lane between Ranst and Antwerp.
Reduction of the traffic flow. This could be the effect of road pricing, higher fuel
taxes or a modal shift to public transport or cycling.

Steunpunt Mobiliteit & Openbare Werken 36 RA-MOW-2011-023 Spoor Verkeersveiligheid
Figure 11: Control algorithm of the VSL gantries (Vlaams Verkeerscentrum, 2010).
3.4.2 The E313 model in Paramics
A model of the E313 was constructed in Quadstone Paramics, as with case studies A and
B. The first step was to implement the road network. All relevant features of the highway
were taken into account:
Between Geel-Oost and the junction with the E34 highway in Ranst there are 2
lanes with a speed limit of 120 km/h.
After the E34 merges with the E313 there are 3 lanes with a speed limit of 120
km/h.
VSL gantries were placed as in Figure 12. The positions were provided by the VVC.
Three types of vehicles were used in the simulation: passenger cars, light trucks
and heavy trucks. These types correspond to the types for which traffic counts
were available and for which emission functions are defined in Versit+ and
Imagine, the air pollutant and noise emission models.
The second step is the definition of the traffic load. The VVC provided traffic counts of a
normal morning (Monday 28/2/2011) between 6 am and 10 am every 5 minutes. Counts
were available for the approaches, exits and some intermediate points. The counts were
split up in three vehicle types: light vehicles, light trucks and heavy trucks.
Table 1Table 1lists the counting stations used in the simulation. Counts at the junction at
Ranst were not available due to a technical failure. These data were calculated as the
difference between a counting station right before and right after the merging point of
the E34 with the E313. As an example Figure 13 shows the counts at the approach of
Wommelgem. One can see that the truck avoid a bit the peak of passenger traffic around
8 a.m.

Steunpunt Mobiliteit & Openbare Werken 37 RA-MOW-2011-023 Spoor Verkeersveiligheid
Figure 12: Positions of the VSL gantries on the E313.
Table 1: Counting post used to define the traffic load
Locpost site description post description
106411 cloverleaf at Antwerpen-Oost from E313 to ring 1
106407 cloverleaf at Antwerpen-Oost from E313 to ring 2
106491 cloverleaf at Antwerpen-Oost exit Borgerhout
106105 Wommelgem approach Wommelgem
106107 Wommelgem exit Wommelgem
118505 junction of Ranst from E34 to E313
118305 Massenhoven approach Massenhoven
118307 Massenhoven exit Massenhoven
117905 Herentals-West approach Herentals-West
117907 Herentals-West exit Herentals-West
117805 Herentals-Industrie approach Herentals-Industrie
117807 Herentals-Industrie exit Herentals-Industrie
117605 Herentals-Oost approach Herentals-Oost
117607 Herentals-Oost exit Herentals-Oost
117305 Geel-West approach Geel - West
117307 Geel-West exit Geel - West
117101 between Geel-West and Geel-Oost main road

Steunpunt Mobiliteit & Openbare Werken 38 RA-MOW-2011-023 Spoor Verkeersveiligheid
Figure 13: Traffic counts of light vehicles (CAR) and trucks (rigid and articulated) per 5
minutes on the approach of Wommelgem. (Source: Vlaams Verkeerscentrum)
Also the destination of the traffic entering the network has to be defined. There was no
information about the destinations of the incoming vehicles. To obtain such data, number
plate recognition on all entrance and exit points is needed. Hence, each entering flow was
distributed over all possible exits proportionally with the total vehicle count on each exit.
The flow on the exits was made to match the counts as much as possible. A perfect
match is not possible because during the whole simulation the total inflow does not
match the outflow. However, the imbalance is small (0.7% of the total number of cars
and 0.4% of the total number for trucks). Because the flows on approaches and exits
match, also the flows on intermediate points on the highway will match closely.
The VSL gantries were put in place but the control strategy had to be simplified. The
overlapping speed and occupancy bands could not be taken into account in the standard
implementation of VSL in Paramics. Figure 14 shows the decision matrix used to
determine the speed limit that will be shown on a gantry as a function of the speed and
occupancy measured at the next, downstream gantry. The measured speed is an average
over the lanes and over a period of time. The occupancy is the density of vehicles per
meter.
0
5
10
15
20
25
30
35
40
0
20
40
60
80
100
120
140
160
180
6:00 6:30 7:00 7:30 8:00 8:30 9:00 9:30 10:00
Tru
cks
pe
r 5
min
Ligh
t ve
hic
les
pe
r 5
min
Hour
CAR
HDVr
HDVa

Steunpunt Mobiliteit & Openbare Werken 39 RA-MOW-2011-023 Spoor Verkeersveiligheid
Figure 14: Variable Speed limit as a function of occupation and speed measured downstream the gantry.
3.4.3 Effect of VSL on air pollutant and noise emissions
For each scenario, without and with VSL, 5 model runs with different seeds were done.
The seed determines the random release of vehicles within each time interval of five
minutes. Both scenarios use the same 5 seeds. The results are in Table 2. The application
of VSL reduces the average speed significantly from 42.0 to 40.7 km/h (paired t-test with
p-value=0.0004). As a consequence the distance travelled and the total emissions
decrease. These changes occur within the period from 6 to 10 am. A part of the trips is
moved outside this time interval. The change in emissions per km gives a better idea of
what VSL does with the emissions. All emissions increase a little and the increase of CO2
and PM10 is significant. This is further explained in Figure 15. This figure shows the
average trip emissions in g/km as a function of the average trip speed. Emissions are
minimal around 90 km/h and they rise sharply at lower speeds and a little at higher
speed. Both scenarios are represented on the graphs with red dots.
Because in reality the variable speed limits are not compulsory, we can conclude that
they will not have very limited influence on air pollutant emissions. The only indirect
effect on emissions is the prevention of accidents. Accidents cause traffic jams that
reduce the average trip speed and will increase the emissions per distance travelled as
shown in Figure 15.
Table 2: Average results of 5 runs without and with VSL, relative differences and p-values of a paired t-test.
Scenario Distance (km)
Speed (km/h)
CO2 (ton) NOx (ton) PM10 (ton)
CO2 (g/km)
NOx (g/km)
PM10 (g/km)
NOVSL 360280 42.0 170.8 0.7563 0.03573 474.0 2.099 0.09918
VSL 357234 40.7 170.8 0.7517 0.03566 475.9 2.104 0.09983
rel. diff. -0.85% -3.27% -0.46% -0.60% -0.19% 0.39% 0.24% 0.66%
p-value 0.0004 0.0112 0.0314 0.0982 0.2765 0.0185 0.3561 0.0050
120
115
110
105
100
95
90
85
80
75
70
65
60
55
50
45
40
35
30
25
20
15
10
0 10 20 30 40 50 60 70 80 90 100
50
70 50spee
d (
km/h
)
Occupation [%]
90 70
90
90
120
120

Steunpunt Mobiliteit & Openbare Werken 40 RA-MOW-2011-023 Spoor Verkeersveiligheid
Figure 15. Emissions of CO2, NOx and PM10 in g/km as a function of average trip speed for passenger cars.
Figure 16. Location of the receiver points along the E313 for noise calculations.
In order to assess the influence of the implementation of VSL on noise levels along the
freeway, a series of receiver points were placed along the freeway. The locations of these
receivers are shown in Figure 16. All receivers were placed north of the E313 freeway, at
a distance of 15m from the centre of the rightmost lane, and at a height of 1.5m.
Receivers 1 and 2 were placed near the ring road of Antwerp, receivers 3 and 4 in
between Antwerp and Ranst, and receivers 5 and 6 in between Ranst and Herentals. The
odd-numbered receivers were placed next to a VSL sign board, while the even-numbered

Steunpunt Mobiliteit & Openbare Werken 41 RA-MOW-2011-023 Spoor Verkeersveiligheid
receivers were placed in between sign boards. Instantaneous noise levels at the location
of these receivers were calculated using the ISO 9613 sound propagation model, based
on the instantaneous sound power calculated for all vehicles on the freeway.
Subsequently, the equivalent sound pressure level for the 4-hour simulation period was
calculated. Table 3 summarizes the change in LAeq,4h (average over 5 runs) due to the
VSL implementation. A decrease in noise levels was found for all locations and for all
simulation runs. However, decreases were very small. The largest decrease in levels is
found along the stretch of freeway between Ranst and the Antwerp ring road, with a
maximal decrease of about 0.5 dBA at most, which could be expected based on the small
decrease in average speeds. Traffic jams build up in the upstream direction from
Antwerp, and therefore the VSL will be in effect first in this stretch of road. Nevertheless,
as with the case of air pollutant emissions, the implementation of VSL has only a small
influence on noise levels.
Table 3: Average changes in sound pressure level (LAeq,4h) at 15m from the E313
freeway, resulting from an implementation of VSL, and from a network wide speed limit reduction to 90 km/h.
Location No VSL Implementation of VSL Speed limit to 90 km/h
LAeq,4h (dBA) LAeq,4h (dBA) Change (dBA) LAeq,4h (dBA) Change (dBA)
1 73.21 73.12 -0.09 73.05 -0.16
2 73.55 73.03 -0.52 73.35 -0.20
3 74.48 74.13 -0.34 74.17 -0.30
4 74.57 74.27 -0.30 74.24 -0.34
5 75.15 75.11 -0.04 74.43 -0.71
6 75.41 75.38 -0.03 74.69 -0.73
3.4.4 Evaluation of other measures on the E313
The model that was developed to evaluate the effect of VSL can be used to assess the
effect of other measures that could be taken.
a. A general speed limit of 90 km/h
The VSL panels could be used to impose a permanent maximum speed of 90 km/h.
The reduction was implemented in the Paramics model of the E313. Figure 15 and
Table 4 show that a considerable reduction of CO2 and NOx emissions can be
achieved when the maximum speed is reduced from 120 km/h to 90 km/h.
Table 5 shows the results in real traffic. The effects are smaller than shown in Table 4
because most of the time vehicles are not able to drive more than 90 km/h. However,
significant reductions of CO2 and NOx are achieved.
Table 4: Effect of a reduction of the average trips speed from 120 to 90 km/h on emissions.
Veh. Type Avg . trip speed (km/h) CO2 (g/km) NOx (g/km) PM10 (g/km)
CAR 120 208.5 0.6876 0.04251
CAR 90 191.0 0.5027 0.04199
rel. diff. -25.0% -8.4% -26.9% -1.2%
Table 5: Effect of a general speed limit of 90 km/h on emissions
scenario Distance (km)
Speed (km/h)
CO2 (ton) NOx (ton) PM10 (ton)
CO2 (g/km)
NOx (g/km)
PM10 (g/km)

Steunpunt Mobiliteit & Openbare Werken 42 RA-MOW-2011-023 Spoor Verkeersveiligheid
NOVSL 360280 42.0 170.8 0.7563 0.03573 474.0 2.099 0.09918
SPEED 90 360149 40.3 168.0 0.7374 0.03546 468.4 2.057 0.09890
rel. diff. -0.48% -4.25% -1.66% -2.50% -0.76% -1.18% -2.03% -0.27%
p-value 0.0088 0.0114 0.0017 0.0014 0.0271 0.0154 0.0045 0.4308
Table 3 also summarizes the results of the speed limit reduction on noise levels at the
receiver locations defined in the previous section. It is found that noise levels decrease
due to a speed limit reduction, up to 0.7 dBA for the stretch of freeway between Ranst
and Herentals. In contrast to the VSL implementation, the largest effect is found more
upstream of the E313 freeway, as this stretch is less affected by traffic jams and thus
initial average speeds are higher than downstream of the E313 freeway. It has to be
noted that here we only consider the morning rush hour with the associated traffic jams;
the effect of a network-wide speed limit reduction will obviously have a much larger
effect on noise levels during periods of the day with lower traffic volumes.
b. A fourth lane between Ranst and Antwerpen-Oost
A possible way to reduce congestion is increasing the capacity of existing roads. On the
28th September 2011 a 4th lanes was opened between Antwerpen-Oost and Ranst in the
direction of Liege (opposite direction of this study). This reduced travel times during the
evening rush hour for people leaving Antwerp. There are no plans to do the same
between Ranst and Antwerp but in the Paramics a 4th lane was added in the direction to
Antwerp. Nowadays in Ranst 2 highways with each 2 lanes come together on 3 lanes.
This capacity drop causes traffic jams. Also the approach of Wommelgem is responsible
for a big influx of vehicles. In Table 6 one can see that the average trip speed increases
from 42 to 75 km/h with a 4th lane. Emissions decrease considerably because at the new
trip average speeds emissions are lower (see Figure 15). It is important to mention that
the traffic demand was not changed in this simulation. In reality, the decrease in travel
time might attract more traffic. Thus, the total emissions on the highway with 4 lanes
might be higher than in the 3 lane situation.
Table 6: Effect of a 4th lane between Ranst and Antwerp on emissions
Scenario Distance (km)
Speed (km/h)
CO2 (ton)
NOx (ton)
PM10 (ton)
CO2 (g/km)
NOx (g/km)
PM10 (g/km)
NOVSL 360280 42.0 170.8 0.7563 0.03573 474.0 2.099 0.09918
LANES 385507 75.0 158.0 0.7116 0.03097 409.9 1.846 0.08033
rel. diff. +7.00% +78.5% -7.47% -5.91% -13.33% -13.53% -12.07% -19.00%
c. A Reduction of the traffic demand
Another way to reduce pollution and congestion is road pricing or a fuel tax. These
measures will reduce the traffic demand. Scenarios with other demands were simulated
with Paramics. Runs were done with flows between 20% and 120% of the baseline
scenario without VSL. Emissions were calculated with Versit+. Figure 17 shows what
happens with the average speed, the vehicle kilometres and the emissions with respect
to the reference situation without VSL. The total vehicle kilometres go through a
maximum near the baseline scenario (purple line). This means that even with higher
flows on the entries, the number of vehicle kilometres does not rise. The traffic in the
baseline situation is saturated. When the traffic load is increased the average trip speed
goes down (blue line) and the emissions per kilometre (red line) go up (see also Figure
15). The total emissions just stagnate, because queues build up outside the study area.
When the traffic flow is decreased the total emissions decrease faster than the vehicle

Steunpunt Mobiliteit & Openbare Werken 43 RA-MOW-2011-023 Spoor Verkeersveiligheid
kilometres. The traffic gets more fluid, average trip speed rises and vehicles emit less per
kilometre. The picture for the emissions of NOx and PM10 is similar.
Figure 17. Average trip speed, emissions of CO2 (total and per km) and vehicle kilometers on the E313 for different traffic demands.
3.4.5 Conclusions
VSL has only very little direct effect on air pollutant and noise emissions. There
may be an indirect effect through the reduction of accidents and the
corresponding congestion.
Air pollutant emissions are minimal around a speed of 90 km/h. Given that the
current average speeds on the E313 during rush hour are so low, decreasing
average speeds will lead to extra air pollution, but, on the other hand, will lead to
lower noise levels along the freeway.
Measures that enhance traffic flow fluency without attracting more traffic can
decrease air pollutant emissions, but will increase noise emissions.
The model can be improved on several points:
o Put the real VSL control logic into the simulation.
o Incorporate the Antwerp Ring road into the simulation. Events on the ring
road have an influence on the E313.
It may be interesting to investigate the effect of adding extra lanes on existing
freeways. On the E40 between Leuven and Brussels the emergency lane was
converted to a permanent 4th lane.
As in Case study A some remarks have to be made about the Paramics simulations:
It was noticed that lane shifting is not well modelled in Paramics. Vehicles move
suddenly from one lane to another which results in a monentary high speed and
acceleration. However, leaving out these points showed that the effect on
emissions was negligible.
-90%
-80%
-70%
-60%
-50%
-40%
-30%
-20%
-10%
0%
10%
0.0
20.0
40.0
60.0
80.0
100.0
120.0
140.0
0 20 40 60 80 100 120 140
Re
lati
ve c
han
ge t
o b
ase
lin
e
Ave
rage
tri
p s
pe
ed
(km
/h)
traffic flow (% from baseline)
avg. trip speed (km/h)
relative CO2 (g/km)
relative CO2 (ton)
relative vkm

Steunpunt Mobiliteit & Openbare Werken 44 RA-MOW-2011-023 Spoor Verkeersveiligheid
The traffic on the E313 near the connection with the Antwerp ring is strongly
influenced by events on the ring. This could not be taken into account in this
simulation. Modelling the whole ring and the surrounding highways was out of the
scope of this study. It would be interesting to apply this methodology on available
models of the Flemish Traffic Centre.

Steunpunt Mobiliteit & Openbare Werken 45 RA-MOW-2011-023 Spoor Verkeersveiligheid
4. AN AL Y S I S S PE E D P R O F IL E V E R SU S MA X I MU M
A L L OW E D SP E E D
In this section we report on the analysis of speed profile and fuel consumption (CO2)
versus maximum allowed speed. This task has been defined within a confined additional
research (vrije onderzoeksruimte).
A total of 19 passenger cars were equipped by VITO with an on-board logging device.
The logging device recorded vehicle position and speed through a GPS device, but at the
same time the device was connected to the electronic data network of the vehicle (“CAN-
bus”). The CAN connection provided information on instantaneous fuel consumption,
engine speed and throttle position. These parameters were logged at a frequency of 1Hz,
and were transmitted daily via GPRS (General Packet Radio Service) to a data server at
VITO. All vehicles were monitored for a period of minimum 6 months, and all vehicles
were registered in Flanders. Of the 19 vehicles that were monitored, 17 used diesel
engines and 2 used gasoline engines. Vehicle type ranged from small (e.g. Renault Clio)
to medium sized family cars (e.g. Ford Mondeo).
In a next step, the vehicle positions were mapped to a specific road segment specified by
the Tele Atlas Multinet. Every road segment of the Tele Atlas Multinet has a speed limit
associated with it. However, only a subset of the road segment speed limits were verified
by Tele Atlas, so only for this subset we were certain that the Multinet speed limit
conforms to the real world speed limit at that location (at a particular date). In the
analysis of the vehicle’s speed profiles as a function of the maximum allowed speed (or
“speed limits”), only data on road segments with a verified speed limit were taken into
account.
4.1 Speed profile as a function of the speed limit
For every vehicle we calculated the average speed for all road segments with the same
speed limit. In total 5 different speed limits are taken into account: 30, 50, 70, 90 and
120 km/h. For every speed limit category, we thus have a distribution of 19 values
indicating the average speed on that speed limit of the 19 different vehicles.
First, the average speed was calculated on a time basis:
average speed = sum(speed)*time/sum(time)
The results are displayed as a box plot in the Figure 18, below. On each box, the central
mark is the median, the edges of the box are the 25th and 75th percentiles, the whiskers
extend to the most extreme data points not considered outliers, and outliers are plotted
individually.

Steunpunt Mobiliteit & Openbare Werken 46 RA-MOW-2011-023 Spoor Verkeersveiligheid
Figure 18: Box plot of the average speed (time-based) of all vehicles for each speed limit
Secondly, the average speed was also calculated on a distance basis:
average speed = sum(speed)*distance/sum(distance)
The distance-based average speed is a better approximation to the actual speeds at
which the vehicles drove. The values are presented in the Figure 19.
Figure 19: Box plot of the average speed (distance-based) of all vehicles for each speed limit
From the figures we can conclude that the average speeds (distance-based) correspond
closely to the speed limits, but are always somewhat lower than the speed limit itself.
The only exception is the average speed for the 30 km/h zones. The table below presents
the average over all 19 vehicles of the average speeds (distance-based) for every speed
limit.

Steunpunt Mobiliteit & Openbare Werken 47 RA-MOW-2011-023 Spoor Verkeersveiligheid
Table 7: average over all 19 vehicles of the average speeds for every speed limit
Speed limit 30 50 70 90 120
av. speed (km/h)
38,1 44,7 62,0 79,0 108,8
4.2 Acceleration profiles as a function of the speed limit
The same methodology, as mentioned above for the speed profiles, is also applied to the
data on accelerations. Acceleration values are calculated as the first time-derivative of
the speed values. Average accelerations are calculated for positive values (acceleration)
and negative values (decelerations) separately.
For every vehicle, the average (positive) acceleration is calculated separately for each
speed limit. For every speed limit category (30, 50, 70, 90 and 120), we thus have a
distribution of 19 values indicating the average acceleration on that speed limit of the 19
different vehicles.
The average positive accelerations for every speed limit are displayed in the Figure 20.
Figure 20: Box plot of the average (positive) acceleration values of all vehicles for each speed limit
In the same way the average values for the decelerations were calculated, as presented
in the Figure 21.

Steunpunt Mobiliteit & Openbare Werken 48 RA-MOW-2011-023 Spoor Verkeersveiligheid
Figure 21: Box plot of the average deceleration values of all vehicles for each speed limit
When driving at low speeds, a low gear is used. As a consequence, a lot of motor torque
is available on the wheels for acceleration. At higher speeds, less torque can be
transmitted to the wheels because of the higher gear ratio (“torque reduction”). Thus, at
low speeds higher acceleration values can be achieved. To judge the acceleration in a
speed-independent way, the RPA or “Relative Positive Acceleration” is used. RPA is
defined as:
RPA = sum(speed x acceleration (positive values) x time step)/sum(distance)
The values for the RPA are presented in the Figure 22.
Figure 22: Box plot of the RPA for every speed limit
In the same way, the “Relative Negative Acceleration” can be calculated (RNA)

Steunpunt Mobiliteit & Openbare Werken 49 RA-MOW-2011-023 Spoor Verkeersveiligheid
RNA = sum(speed x acceleration(negative values) x time step)/sum(distance)
These values are presented in the Figure 23.
Figure 23: Box plot of the RNA (relative negative acceleration) for every speed limit
Overall the figures show a substantial decrease in average acceleration and deceleration
for increasing speed limits, indicating less variation in driving speeds at higher speed
limits.
4.3 Fuel consumption as a function of the speed limit
For every speed limit category, the relative average fuel consumption was calculated, i.e.
the average fuel consumption per vehicle and per speed limit divided by the average fuel
consumption for that vehicle over all speed limits. If a vehicle did not have a total
distance of more than 5 kilometres for a certain speed limit, the data for this vehicle was
discarded for that specific speed limit.
From Figure 24, it is clear that average fuel consumption in low speed regions (30 and
50) is high in comparison to overall average fuel consumption. This was to be expected
since low speed regions involve a lot of stop-and-go traffic and internal combustion
engines are not used efficiently at low speeds. However, the number of data points
available for the 30 km/h speed limit was low, decreasing the statistical power for this
speed limit. Of all 19 vehicles, only 3 vehicles had covered a distance of more than 5
kilometres in the 30 km/h speed zones. Only the fuel consumption values for these 3
vehicles are therefore taken into account for this speed limit.
The lowest average fuel consumption is obtained for the 70 and 90 km/h speed limits. At
highway speeds, engines are operating very efficiently but the air resistance is increasing
sharply, leading to higher fuel consumption. In addition, due to the high engine
temperature at high speeds, NOx emissions are high for freeway traffic.

Steunpunt Mobiliteit & Openbare Werken 50 RA-MOW-2011-023 Spoor Verkeersveiligheid
Figure 24: Box plot of the relative fuel consumption for every speed limit
The averages over all 19 vehicles for the relative fuel consumption are presented in Table
8.
Table 8: average of the relative fuel consumptions over all 19 vehicles
Speed limit 30 50 70 90 120
Relative fuel consumption
1,32 1,13 0,92 0,94 0,97

Steunpunt Mobiliteit & Openbare Werken 51 RA-MOW-2011-023 Spoor Verkeersveiligheid
5. CON C L U S IO N S
Based on an extensive literature review and case study results on a selection of traffic
management measures, conclusions on the effect on traffic flow, safety, fuel
consumption, and emissions of pollutants and noise of the following traffic management
schemes are drawn:
Replacement of traditional signalized intersections with roundabouts
Highway speed management
Speed reduction on local roads
Introduction of low emission zones
Traffic lights synchronization
Introduction of speed humps/bumps.
Results often differed between studies and/or locations. However, we tried to summarize
the main results in one table (Table 9) in order to give a clear overview of the general
effects.
Replacing traditional signalized intersections with roundabouts has, in general, positive
effects on traffic flow, fuel savings, emission reductions and noise abatement. In the
literature, little disagreement was found on the fact that the roundabouts usually improve
traffic flow. And, due to the general improvement in the efficiency of traffic flow,
roundabouts reduce vehicle fuel consumption and emissions of pollutants and noise.
Concerning the effect on safety, the effects depend on the location and on the type of
traffic passing by (see score +/- in Table 9). In general, safety at roundabouts is
considered good when there is not much pedestrian and bicycle traffic. Therefore,
residential neighbourhoods and school zones in urban areas are not ideal candidates for
roundabouts. On the other hand, major road crossings which are congestion prone can
better be replaced with roundabouts. Further, to reduce severity and frequency of
accidents at the roundabouts, it is advisable to reduce the speed in the vicinity of the
roundabouts to safe levels and to make drivers aware they are approaching a
roundabout. It seems that roundabouts are the best replacement for signalized
intersections where a main road with speed limits of 90 km/h intersects with minor roads
with speed limits of 50-70 km/h. Furthermore, for cyclists it is preferable to construct
cycle paths at the roundabout.
Concerning highway speed management, three different types of measures were
distinguished: reducing maximum speed (to 80 km/h), introducing variable speed limits
and applying speed control. Traffic safety is improved by all these measures. Reducing
the maximum speed to 80 km/h on highways could increase the traffic flow depending on
the configuration of the highway and the traffic density. It is clear that this lower speed
decreases the fuel consumptions and emissions of pollutants and noise. To a lesser
extent this will also be the case for variable speed limits. The impact of speed control on
highways is to raise drivers’ awareness, stimulating the to drive more safely. Here the
other aspects are of minor relevance.
Specific analyses on the E313 freeway between Geel-Oost and Antwerpen indicate VSL
has only very little direct effect on air pollutant and noise emissions. There may be an
indirect effect through the reduction of accidents and the corresponding congestion. Air
pollutant emissions per km are minimal around a speed of 90 km/h. Given that the
current average speeds on the E313 during rush hour are so low, decreasing average
speeds will lead to extra air pollution, but, on the other hand, will lead to lower noise
levels along the freeway. Furthermore, measures that enhance traffic flow fluency
without attracting more traffic can decrease air pollutant emissions, but will increase
noise emissions. However, in the literature was found that VSL can have a positive effect
on traffic flow and emissions (see Table 9). This was not seen on the E313 because on
this freeway the maximum capacity is reached during rush hours.

Steunpunt Mobiliteit & Openbare Werken 52 RA-MOW-2011-023 Spoor Verkeersveiligheid
Table 9: Overview of the effect of different traffic management measures
Traffic
flow
Safety Fuel
(CO2)
savings
Local
emissions
reduction
(NOx, PM,
HC)
Noise
Replacing intersectio
ns with roundabouts:
1. urban areas ++ - + + +
2. majors roads ++ + + + +
Highway speed
management:
1. reduced speed
(80 km/h) ≈ ++ ++ ++ ++
2. variable speed
limits ≈ + + + +
3. speed control ≈ + ≈ ≈ ≈
Speed reduction on
local roads ≈ ++ ≈ ≈ ++
Low emission zones ≈ ≈ + ++ ++
Traffic lights
synchronisation ++ ≈ + + -
Speed bumps/humps - ++ -- -- ≈
Legend:
++ Good improvement - Slightly negative effect
+ Slight improvement -- Important negative effect
≈ No or insignificant improvement
Speed reduction on local roads generally results in less (severe) accidents and lower
noise emission. Speed reductions to speeds smaller than 30-40 km/h might however
result in increases of the fuel consumption and pollutant emissions. Furthermore, since
the engine noise is predominantly associated with speed, noise emissions can be
controlled by reducing the speed.
The major purpose of low emissions zones (LEZs) is to reduce local emissions by
means of banning certain vehicles in these zones (e.g. heavy duty vehicles, older
vehicles, …). In the future, noise reduction could also become important if zones are
restricted to hybrid and electric vehicles. The effect on traffic flow and safety strongly
depends on the avoided kilometres driven in the LEZ.
Improving traffic flow by means of installing green waves (traffic lights
synchronization) is most effective on main arterial roads with smaller minor roads.
Implementing green waves in these situations will result in fuel savings and less local
pollutions as they generate smooth traffic and less stop-and-go traffic. Noise emissions
Steunpunt Mobiliteit & Openbare Werken 53 RA-MOW-2011-023 Spoor Verkeersveiligheid
lower at the intersections, but there could be an increase between two intersections,
resulting in an overall negative effect for noise. However, if traffic signal coordination
decreases travel times, the effect of facilitating traffic flow may, in the long term, induce
additional traffic with the potential side effect of offsetting some of the beneficial
environmental consequences of signal coordination.
Speed humps/bumps are designed to slow down traffic in residential areas. They
clearly result in safety benefits due to their traffic calming effect. However, speeds
humps have a negative effect on traffic flow, fuel consumptions and emissions of
pollutants. Also, effects on noise could be negative due to braking when approaching a
speed hump/bump.
It has to be noted that various literature review studies indicate different results for the
same measure. Depending on the specific characteristics of the measure considered (e.g.
dimensions of the roundabout, magnitude of the speed reduction,...) or the features of
the local situation (e.g. dimensions of the road, applicable speed limits, amount of
traffic,...), the impact results might differ largely between locations/studies.
Due to the importance of local characteristics when assessing the impact of traffic
management schemes we therefore recommend to examine the impacts on traffic flow,
emissions,... case by case. Each situation should be examined thoroughly and priorities
on the desired outcome (e.g. on traffic flow, safety, air quality,...) need to be established
in advance to select the most valuable traffic management measure for each situation.
The model chain applied within the case studies of this project, combining
information on vehicle intensities, road characteristics and (noise)emission functions on a
microscopic level, appeared to be a very useful tool for examining this kind of policy
questions.
Concerning the E313 freeway case study, the model can be improved on several points:
1° put the real VSL control logic into the simulation, 2° incorporate the Antwerp Ring
road into the simulation. Events on the ring road have an influence on the E313.
Furthermore, it may be interesting to investigate the effect of adding extra lanes on
existing freeways. On the E40 between Leuven and Brussels the emergency lane was
converted into a permanent 4th lane.
In addition, on-the-field analyses performed within the confined additional research
space (vrije onderzoeksruimte) show that measured average speeds correspond closely
to the speed limits, but are always somewhat lower than the speed limit itself. The only
exception is the average speed for the 30 km/h zones. The lowest average fuel
consumption (CO2) is obtained for the 70 and 90 km/h speed limits. At highway speeds,
engines are operating very efficiently but the air resistance is increasing sharply, leading
to higher fuel consumption, and CO2 and NOx emissions.

Steunpunt Mobiliteit & Openbare Werken 54 RA-MOW-2011-023 Spoor Verkeersveiligheid
6. RE F F E R E N C E S
Abbott, P., Taylor, M. and Layfield ,R.E. (1997). The effects of traffic calming measures
on vehicle and traffic noise. Traffic Engineering and Control 38 (8).
Abdel, M., Dilmore, J., Dhindsa, A. (2005). Evaluation of variable speed limits for real-
time freeway safety improvement, Accident Analysis and Prevention, Vol.38. 335-
345.
Antoine, D. (2005). The safety of roundabouts and traffic lights in Belgium, National
Roundabout Conference, May 2005, Vail Colorado, US.
Archer, J., Fotheringhan, N., Symmons, M., Corben, B. (2008). The Impact of Lowered
Speed Limits in Urban/Metropolitan Areas. Monash University Accident Research
Centre. Report, Vol. 276. Victoria, Australia.
Barrowcliffe, R. (2006). Health impact assessment of the low emission zone. Final
Report, Transport for London. Environmental Resources Management, London.
Berengier, M. C., Picaut, J. (2008). Methods for noise control by traffic management:
Impact of speed reducing equipments. Deliverable H.R2; SILENCE project, sixth
framework programme, European Commission, Brussels, Belgium.
Bergh, C., Retting, R. A., Myers, E. J. (2005). Continued reliance on traffic signals the
cost of missed opportunities to improve traffic flow and safety at urban intersections.
Arlington, VA: Insurance Institute for Highway Safety.
Boel, R., Mihaylova, L. (2006). A compositional stochastic model for real time freeway
traffic simulation, Transportation Research Part B, Vol. 40. 319-334.
Brockfeld, E., Barlovic, R., Schadschneider, A., Schreckenberg, M. (2001). Optimizing
traffic lights in a cellular automaton model for city traffic, Physical Review Letters E
64, 056132.
Brude, U., Larsson, J. (2000). What roundabout design provides the highest possible
safety, Nordic Road & Transport Research, Vol. 2, 17-21.
Bush, C. (2006). London Low Emission Zone: Environmental Appraisal, Environmental
Report, Proposed London Low Emission Zone Summary of the Environmental Report
(PDF 183KB) – Nov.
Can A, Dekoninck L, Rademaker M, Van Renterghem T, De Baets B, Botteldooren D.
(2011) Noise measurements as proxies for traffic parameters in monitoring networks.
Sci Total Environ. 410(411):198-204
Carlson, R. C., Papamichail, I., Papageorgiou, M., Messmer, A. (2010). Optimal
mainstream traffic flow control of large-scale motorway networksTransportation
Research Part C: Emerging Technologies, Vol. 18, 193-212.
Cejun, L., Chou-Lin, C. (2009). An Analysis of Speeding-Related Crashes: Definitions
and the Effects of Road Environments. National Highway Traffic Safety
Administration.
Coelho, M, C., Farias, T. L., Rouphail, N. M. (2009). A numerical tool for estimating
pollutant corridors. International Journal of Sustainable Transportation Vol. 3(4),
246–262.
Coelho, M. C., Farias, T. L., Rouphail, N. M. (2005). A methodology for Modeling and
Measuring Traffic and Emission Performance of Speed Control Traffic Signals.
Atmospheric Environment, Vol. 39 (13), 2383–2392.
Daniels, S., Brijs, T., Nuyts E. and Wets, G. (2008). Injury accidents with bicyclists at
roundabouts. Rapport Steunpunt Mobiliteit en Openbare Werken. Spoor
Verkeersveiligheid. 25 p.

Steunpunt Mobiliteit & Openbare Werken 55 RA-MOW-2011-023 Spoor Verkeersveiligheid
Daniels, S., Brijs, T., Nuyts, E. and Wets, G. (2010a). Risicomodellen voor ongevallen op
rotondes. Rapport Steunpunt Mobiliteit en Openbare Werken. Spoor
Verkeersveiligheid. 38 p.
Daniels, S., Nuyts. E., Wets, G. (2010b). Effects of roundabouts on traffic safety for
bicyclists. Accident Analysis and Prevention, Vol.42, 518-526.
Daniels, S., Brijs, T., Nuyts. E., Wets, G. (2011). Extended prediction models for crashes
at roundabouts. Safety Science, Vol. 49, 198-207.
De Brabander B., Nuyts, E. and Vereeck, L. (2005). Road safety effects of roundabouts in
Flanders. Rapport Steunpunt Verkeersveiligheid. 23 p.
De Brabander, B.,Vereeck, L., (2007). Safety effects of roundabouts in Flanders signal
type, speed limits and vulnerable road users. Accident Analysis and Prevention, Vol.
39, 591- 599.
De Coensel, B., Botteldooren, D., Vanhove, F., Logghe, S. (2007). Microsimulation based
corrections on the road traffic noise emission near intersections. Acta Acustica, 93
(2), 241-252.
De Coensel, B., Can, A., Madireddy, M., De Vlieger, I., Botteldooren, D. (2010).
Combined Assessment of Noise and Air Pollution Caused by Road Traffic. Proceedings
of the Institute of Acoustics & Belgium Acoustical Society, Noise in the Built
Environment, Ghent.
De Coensel, B., De Muer, T., Yperman, I., Botteldooren, D. (2005). The influence of
traffic flow dynamics on urban soundscapes. Applied. Acoustics 66, pp. 175–194.
Decky, M. (2009). Noise Pollution from Roundabouts traffic in the outer environment of
built-up areas of towns. International Conference Q- 2008. Žilina 15.-16.5.2008,
ISBN 978-80-969681-5-2, p.152-157.
Desarnaulds, V., Monay, G., Carvalho, A. (2004). Noise Reduction by urban traffic
management, In: Proceedings of the 18th International Congress on Acoustics, Kyoto,
Japan.
De Vlieger, I. (1997). On-board emission and fuel consumption measurement campaign
on petrol-driven passenger cars. Atmospheric Environment 31, pp. 3753–3761.
Dijkema, M., VanderZee, S., Brunekreef, B., Strien, V. R. (2008). Air Quality Effects of an
Urban Highway Speed Limit Reduction. Atmospheric Environment, Vol. 42, 9098–
9105.
El-Fadel, M., Sbayti, H. (2000). Noise control at congested urban intersections:
Sensitivity analysis of traffic management alternatives. Noise Control Engineering
Journal, Vol. 48(6):206-213, 2000.
Elvik, R., Vaa, T. (2004). Handbook of Road Safety Measures. Elsevier Science, Oxford.
Elvik, R. (2002). Effects on road safety of converting intersections to roundabouts: a
review of evidence from non-US studies. Institute of Transport Economics.
EPA (1996). Emissions Impact of Elimination of the National 55 mph Speed Limit,
Information from the EPA Office of Mobile Sources, EPA Memo reproduced by Drive
55 Conservation Project.
Gonçalves, M., Guerrero, P, J., López, E., Baldasano, J. M. (2008). Air quality models
sensitivity to on-road traffic speed representation: effects on air quality of 80 km h
speed limit in the Barcelona metropolitan area. Atmospheric Environment, Vol. 42,
8389–8402.
Grerhenson, C. (2008). Self-Organizing Traffic Lights. Centrum Leo Apostel, Vrije
Universiteit Brussels, Belgium.
Steunpunt Mobiliteit & Openbare Werken 56 RA-MOW-2011-023 Spoor Verkeersveiligheid
Hallmark, S. and Smith, D. (2002). Temporary speed humps impact evaluation. Center
for Transportation Research and Education, USA.
Hels, T., Bekkevold, I, O. (2007). The effects of roundabouts design features on cyclist
accident rate. Accident Analysis and Prevention, Vol. 39, 300- 307.
Hewage, K.N., Ruwanpura, J.Y. (2004). Optimization of traffic signal light timing using
simulation. WSC’04 Proceedings of the 36th conference on winter simulation.
Huang, D., Huang, W. (2003). Traffic Light Synchronization. Journal of American Physical
Society, Vol. 6 7(5).
Hyden, C., Varhelyi, A. (2000). The effects on safety, time consumption and environment
of large scale use of roundabouts in an urban area: a case study, Accident Analysis &
Prevention, Vol. 32, 11-23.
Ihab, E., Kyoungho, A., Rakha, H. (2005). Comparative Field Evaluation of Vehicle Cruise
Speed and Acceleration Level Impacts on Hot Stabilized Emissions. Transportation
Research Part D: Transport and Environment, Vol. 10 (1), 13-30.
Int Panis, L., Broekx, S., Liu, R. (2006). Modeling Instantaneous Traffic Emission and the
Influence of Traffic Speed Limits, Science of the Total Environment, Vol. 371, 270-
285.
Johansson, C., & Burman, L. (2006). The Stockholm Trial – Effects on Air Quality and
Health. SLB Report 4:2006. Environment and Health Administration. Stockholm,
Sweden. http://www.slb.nu/slb/rapporter/pdf/TheStockhTrial_engSLB_4_2006.pdf
Johansson, H. (2006). Assessment of Environmental Zone in Goteborg. A report for the
traffic and public transit authority of the city of Goteborg.
Jorgensen, E., Jorgensen, N.O. (1996). Traffic Safety at Danish Roundabouts -
Constructed after 1985. VTI Konferens, 4A, Linköping, Sweden.
Keller, J., Andreani, A. S., Tinguely, M., Flemming, J., Heldstab, J., Keller, M., Zbinden,
R., Prevot, A. S. H. (2008). The Impact of Reducing the Maximum Speed Limit on
Motorways in Switzerland to 80kmh on Emissions and Peak Ozone. Environmental
Modeling and Software Vol. 23, 322–332.
Keuken, M. P., Jonkers, S., Wilmink, I. R., Wesseling, J. (2010). Reduced NOx and PM10
emissions on urban motorways in The Netherlands by 80km/h speed management.
Science of the Total Environment, Vol. 408, 2517–2526.
Kloeden, C. N., McLean, A. J., Moore, V. M., Ponte, G. (1997). Travelling speed and the
risk of crash involvement. NHMRC Road Accident Research Unit, The University of
Adelaide, Adelaide.
Kyoungho, A., Hesham, R. (2009). A field evaluation case study of the environmental and
energy impacts of traffic calming, Transportation Research Part D: Transport and
Environment, Vol. 14, 411-424
Lee, C., Saccomanno, F. (2006). Evaluation of variable speed limits to improve traffic
safety, Transportation Research Part C, Vol.14, 213-228.
Li, X., Li, G., Pang, S., Yang, X., Tian, J. (2004). Signal timing of intersections using
integrated optimization of traffic quality, emissions and fuel consumption.
Transportation Research Part D, Vol. 9, 401–407.
Ligterink, N.E., De Lange, R. (2009). Refined vehicle and driving-behaviour dependencies
in the VERSIT+ emission model. In Proceedings of the Joint 17th Transport and Air
Pollution Symposium and 3rd Environment and Transport Symposium, Toulouse.
Madireddy, M., De Coensel, B., Can, A., Degraeuwe, B., Beusen, B., De Vlieger, I. and
Botteldooren, D. (2011). Assessment of the impact of speed limit reduction and traffic
signal coordination on vehicle emissions using an integrated approach. Transportation
Research part D, Vol. 16, 504-508.

Steunpunt Mobiliteit & Openbare Werken 57 RA-MOW-2011-023 Spoor Verkeersveiligheid
Madireddy, M., De Coensel, B., De Vlieger, I., Botteldooren, D., Beusen, B., Degraeuwe,
B., Lenaers, G., Can, A., Eijk, A. (2010). Micro-Simulation of a Traffic Fleet to Predict
the Impact of Traffic Management on Exhaust Emissions. 19th International
Symposium, Transport and Air Pollution, Zurich.
Makarewicz, R. and Golebiewski, R. (2007) Modeling of the Roundabout Noise Impact.
Journal of the Acoustical Society of America, Vol. 122, pp. 860-868.
Mandavilli, S., Russell, E. R., and Rys, M. (2004). Modern roundabouts in United States:
an efficient intersection alternative for reducing vehicular emissions. Poster
presentation at the 83rd Annual Meeting of the Transportation Research Board,
Washington DC.
Mishra, S. (2010). Traffic Flow Characteristics Comparison between Modern Roundabouts
and Intersections, ITE Student Paper, retrieved from the Worldwide web on at http://
www.smartgrowth.umd.edu/pdf/TrafficFlowRoundaboutsIntersections_ Mishra_ 3-9-
09.pdf
Moller, M., Hels, T. (2008). Cyclists’ perception of risk in roundabouts. Accident Analysis
and Prevention, Vol. 40, 1055- 1062.
Nes, V., Brandenburg, G., Twisk, D. (2010). Improving homogeneity by dynamic speed
limit systems, Accident Analysis and Prevention, Vol. 42, 944-952.
Niittymäki, J., Höglund P. G. (1999). Estimating vehicle emissions and air pollution
related to driving patterns and traffic calming. Presented at the Urban Transport
Systems Conference, Lund, Sweden.
Nilsson, G. (1982). The effects of speed limits on traffic accidents in Sweden. VTI
Sartryck, Vol. 68, 1-10.
Olde, M., Vanbeek, P., Stemerding, M., Havermans, P. (2005). Reducing Speed Limits on
Highways. Dutch Experiences and Impact on Air Pollution, Noise-Level, Traffic Safety
and Traffic Flow Proceedings of ETC, Strasbourg, France.
Peeters, B. and van Blokland, G. (2007). The noise emission model for European road
traffic. Technical Report IMA55TR-060821-MP10, Deliverable 11 of the IMAGINE
project, M+P Consulting Engineers, Vught, The Netherlands.
Pelkmans, L., Verhaeven, E., Spleesters, G., Kumra, S., Schaerf, A. (2005). Simulations
of Fuel Consumption and Emissions in Typical Traffic Circumstances. Brasil Fuels and
Lubricants Meeting and Exhibition, Vol. 2159.
Persaud, B. N., Retting, R. A., Garder, P. E., Lord, D. (2000). Crash reduction following
installation ofroundabouts in the United States, Insurance Institute for Highway
Safety,
Retting, R. A., Luttrell, G., Russell, E. R. (2002). Public opinion and traffic flow impacts of
newly installed modern roundabouts in the United States. ITE Journal, Vol. 72, 30-32,
37.
Retting, R. A., Mandavilli, S., Russell, E. R., McCartt, A. T. (2006). Roundabouts traffic
flow and public opinion. Traffic Engineering and Control, Vol. 47, 268-72.
Robinson, B. W., Rodegerdts, L., Scarborough W, Kittelson, W. (2000). Roundabouts: An
Informational Guide, Federal Highway Administration.
Rodegerdts, L., Blogg, M., Wemple, E., Myers, E., Kyte, M., Dixon, M., List, G., Flannery,
A., Troutbeck, R., Brilon, W., Wu, N., Persaud, B., Lyon, C., Harkey, D., Carter, D.
(2007). Roundabouts in the United States. National Cooperative Highway Research
Program Report no. 572. Washington, DC: Transportation Research Board.
Russell, E. R., Mandavilli, S., Rys, M. J. (2004). Operational performance of Kansas
roundabouts: phase II. Report no. K-TRAN KSU-02-04, Final Report 01-04.
Manhattan, KS: Department of Civil Engineering, Kansas State University.

Steunpunt Mobiliteit & Openbare Werken 58 RA-MOW-2011-023 Spoor Verkeersveiligheid
Sakshaug, L., Laureshyn, A., Svensson, A., Hyden, C. (2010). Cyclists in roundabouts-
Different design solutions. Accident Analysis and prevention, Vol. 42, 1338- 1351.
Schoon, C., Minnen, J. (1994). The Safety of Roundabouts in The Netherlands", Traffic
Engineering and Control, vol. 35, n° 3, 142-148, London.
Smit, R., Brown, A. L., Chan, Y. C. (2008). Do air pollution emissions and fuel
consumption models for roadways include the effects of congestion in the roadway
traffic flow? Environmental Modeling & Software, Vol. 23, 1262–1270.
Smit, R., Smokers, R., Rabé, E. (2007). A new modelling approach for road traffic
emissions: VERSIT+. Transportation Research Part D 12, pp. 414–422.
,
Stevanovic, A., Stevanovic, J., Zhang, K., Batterman, S. (2009). Optimizing Traffic
Control to Reduce Fuel Consumption and Vehicular Emissions, Transportation
Research Record: Journal of the Transportation Research Board, Vol. 2128 .
Taylor, M. (2001). Network modeling of the traffic, environmental and energy effects of
lower urban speed limits. Road and Transport Research, Vol. 9 (4) 48-57.
Tester, JM., Rutherford, GW., Wald, Z. and Rutherford, MW. (2004). Matched Case–
Control Study Evaluating the Effectiveness of Speed Humps in Reducing Child
Pedestrian Injuries, Vol. 94, 4. American Journal of Public Health 646-6502004
American Public Health Association.
Trachet, B., Madireddy, M., Botteldooren, D., De Vlieger, I. (2010). The influence of
traffic management on emissions: literature study of existing emission models and
initial tests with microscopic traffic simulation. Technical Report RA-MOW-2010-001.
Flemish Policy Research Centre for Mobility & Public Works, Brussels.
Traffic Advisory Leaflets (1996), TRL, Crowthrone, Report 2/96. Leaflets are
downloadable from www.dft.gov.uk.
Unal, A., Nagui M., Rouphail, H. (2003). Christopher Frey Effect of Arterial Signalization
and Level of Service on Measured Vehicle Emissions. Transportation Research Record:
Journal of the Transportation Research Board, Vol. 1842, 47-56.
Van Beek, W., Derriks, H., Wilbers, P., Morsink, P., Wismans, L., Van Beek, P. (2007).
The effect of speed measures on air pollution and traffic safety, Association of
European Transport and Contributors.
Várhelyi, A. (2002). The effects of small roundabouts on emissions and fuel consumption:
a case study. Transportation Research Part D: Transport and Environment, Vol.7, 65-
71.
Vlaams Verkeerscentrum (2009a). Tactische Studie E313 – Syntheserapport.
Vlaams Verkeerscentrum (2009b). Tactische studie – Bijlage 2 – Analyse.
ongevalgegevens.
Vlaams Verkeerscentrum (2010). TPS-RSS snelheidsaansturing.
Vlaams Verkeerscentrum (2011).
http://www.verkeerscentrum.be/verkeersinfo/verkeerscentrum/vc_middelen_rss
VMM (2011). MIRA Achtergronddocument 2010, Transport.
http://www.milieurapport.be/nl/publicaties/Achtergronddocumenten/
World Health Organization (2004). World report on road traffic injury prevention.
http://www.who.int/violence_injury_prevention/publications/road_traffic/world_repor
t/
Zein, S.R., Geddes, E., Hemsing, S. and Johnson, M. (1997). Safety benefits of traffic
calming. Transportation Research Record, Vol. 1578, 3-10.

Steunpunt Mobiliteit & Openbare Werken 59 RA-MOW-2011-023 Spoor Verkeersveiligheid
Zhong, W., Michael, W, C. (2006). An Investigation on the Environmental Benefits of a
Variable Speed Control Strategy. U.S. Department of Transportation, University
Transportation Centers Program, Report 473700-00072-1.

Steunpunt Mobiliteit & Openbare Werken 60 RA-MOW-2011-023 Spoor Verkeersveiligheid
7. AN N E X – OVE R V IE W E VE N T S A N D I N T E R N AT IO N AL
P U B L IC AT I ON S
During the project mid-term results of WP8.3 have been presented at national and
international events:
M. Madireddy and B. De Coensel (2009) “Modelleren van dynamische emissies en
geluid voor Vlaamse verkeerssituaties” op de “onderzoekersdag” van het
Steunpunt Mobiliteit op 23/10/2009 in Diepenbeek.
M. Madireddy, B. De Coensel, I. De Vlieger, D. Botteldooren, B. Beusen, B.
Degraeuwe, G. Lenaers, A, Can, A. Eijk (2010), Micro-Simulation of a Traffic Fleet
to Predict the Impact of Traffic Management on Exhaust Emissions.Conference
proceedings, 18th International Symposium 2010 ‘Transport and Air Pollution’,
Dübendorf, Switzerland, May 2010.
B. De Coensel, A. Can, M. Madireddy, I. De Vlieger and D. Botteldooren.
Combined assessment of noise and air pollution caused by road traffic. In
Proceedings of Noise in the Built Environment, Meeting of the Institute of
Acoustics and the Belgian Acoustical Society, Ghent, Belgium, Apr. 2010. (UK) en
de Belgische Akoestische Vereniging (2010).
Workshop Steunpunt – Presentation of Midterm results of WP8.3 to the steering
committee (Brussels, Februari 2011).
We also have used the noise model to compute the noise climate in the Antwerp urban
development project "New Zurenborg”.
Furthermore, some peer-reviewed publications have been achieved with the results of
Work Package 8.3:
Madhava Madireddy, Bert De Coensel, Arnaud Can, Bart Degraeuwe, Bart Beusen,
Ina De Vlieger, Dick Botteldooren (2011) Assessment of the impact of speed limit
reduction and traffic signal coordination on vehicle emissions using an integrated
approach, Transportation Research Part D: Transport and Environment, Volume
16, Issue 7, Pages 504-508. See ScienceDirect Alert.
Arnaud Can, Dick Botteldooren (2011). Towards traffic situation noise emission
models, Acta Acustica united with Acustica, Volume 97, Issue 5, Pages 900-903.
Bert De Coensel, Arnaud Can, Bart Degraeuwe, Ina De Vlieger, Dick Botteldooren,
(2011) Effects of traffic signal coordination on noise and air pollutant emissions,
Environmental Modelling and Software (accepted, publication 2012).