the profitability of rice farming in polmas … · the research report “the profitability of rice...
TRANSCRIPT

THE PROFITABILITY OF RICE FARMING IN POLMAS DISTRICT, SOUTH SULAWESI, INDONESIA
by
Muslim Salam and Rahmadani
Department of Socio-economics of Agriculture Faculty of Agriculture and Forestry Hasanuddin University, Makassar
February 20, 2003

ACKNOWLEDGMENTS
We are grateful to Allah for his mercy and guidance that enabled us to complete the research report “The Profitability of Rice Farming in Polmas District, South Sulawesi Indonesia”.
During the preparation and the construction of the report, we received help from many people. Above all, we wish to acknowledge our deepest gratitude to Mr. James Gingerich, Team Leader of Food Policy Support Activity, DAI ,Jakarta who agreed to fund the research and to Professor Scott R. Pearson (Stanford University, USA), our distinguished supervisor, co-author of the Policy Analysis Matrix (PAM) book, who has guided us and sharpened our proposal through to the final report.
We thank Bapak Drs. Sjaiful Bahri, M.Com. (DAI, Jakarta), our co-supervisor, for
his “never-stop-guidance” on data collection and PAM Table construction. We also thank Bapak Dr. Ronnie S. Natawidjaja (Padjajaran University, Bandung) whose comments on our first draft presented at the Mataram Workshop were very helpful. We are grateful to Ibu Nurhayati (DAI Jakarta) who helped us with financial administration.
We would also like to express our gratitude to members of the Faculty of Agriculture and Forestry, Hasanuddin University, where we serve as lecturerers. They are Bapak Prof. Dr. Ir. Syawal S. M.Sc. (Dean of the faculty), Bapak Ir. H. Nazaruddin, LO. MS. (Vice Dean for Financial Affair), and Bapak Ir. Darwis Ali, MS. (Head of Department of Socio-economics of Agriculture) who sent us to join the PAM Workshop in Manado and supported the research.
In the data collection process, we received help from many people in the field. In particular, we thank Bapak Bahrun Bando, SP.,MM. (Head of Food & Agriculture Office of Polmas District) and Bapak Massualle Pasang, SP. (Officer of Food & Agriculture Office of Polmas District) who made all the necessary arrangements and hosted us during the fieldwork. We are very grateful to the enumerators and farmers who participated in our Focus Group Discussions. Without their kindness and willingness to spend their valuable time to take a part in the research, this study would not have been possible. We would like also to thank our Manado-PAM’s colleagues for sharing ideas on our report and Ms. Nur Asia for her great skill in computer and data tabulation.
We hope this academic work will make a contribution to existing knowledge on
rice farming in Indonesia. We also hope it will help planners in local governments such as Polmas District to understand better the role of regional governments in forming national rice policy. We invite comments and suggestions for expanding this research in the future.
Muslim Salam and Rahmadani
HasanuddinUniversity, Makassar
20 February 2003
2

TABLE OF CONTENTS
TABLE OF CONTENTS.................................................................................................................. 3
SUMMARY ...................................................................................................................................... 4
1. RESEARCH PLAN..................................................................................................................... 5 1.2. Background and Research Objectives: Policy Issues ............................................. 5 1.2. Research Methods................................................................................................... 5 1.3. Brief Description of the Research Site................................................................... 7
2. PROFITABILITY AND COMPETITIVENESS: COMPUTING PRIVATE BUDGETS ................ 8 2.1. Input-Output Data ................................................................................................... 8 2.2. Analysis of Private Profitability.............................................................................. 9
3. EFFICIENCY AND COMPARATIVE ADVANTAGE: COMPUTING SOCIAL BUDGETS....... 13 3.1. Analysis of Social Prices and Competitiveness .................................................... 13 3.2. Social Budget and Profitability Analysis.............................................................. 16
4. POLICY ANALYSIS AND MARKET FAILURE: COMPUTING THE PAM ............................. 18 4.1. Policy Analysis Matrix ......................................................................................... 18 4.2. Revenue and Domestic Factors:............................................................................ 18
5. CONCLUSIONS ....................................................................................................................... 19
3

SUMMARY
Agriculture has consistently been a central focus of the Indonesian government’s development strategies and priorities. The sector has performed a major role in developing the Indonesian economy since the New Order era. Agriculture has contributed to national economic development by providing employment, food, raw material for industries, and foreign exchange earnings. Since the economic crisis, this sector has continued to show its important role as a “buffer sector” in the economy.
Indonesia had its greatest production success when it moved from being the world’s greatest rice importer to being self-sufficient (Heytens, 1991: 114-137). Unfortunately, this success did not continue for long. Currently, the Indonesian government is importing rice and using a tariff to make itself less dependent on foreign markets.
The PAM analysis shows that if tradable inputs and outputs are valued at
international prices and domestic resources (land, labor, and capital) are valued at opportunity costs, rice producers would earn substantial profits. When commodities have positive social profits, the country has a comparative advantage in producing that commodity. Additional incentives in the form of tariffs or other types of protection are unnecessary.
Increasing rice output in Polmas District is not dependent on higher output prices.
Rather, agricultural representatives need to lobby the national and regional governments for expenditures on research programs that would increase rice yields. At the district level, improvements in extension efforts and expenditures on water control would also help to increase rice production.
4

1. RESEARCH PLAN
1.2. Background and Research Objectives: Policy Issues
Agriculture has consistently been a central focus of the Indonesian government’s development strategies and priorities. The sector has performed a major role in developing the Indonesian economy since the New Order era. Agriculture has contributed to national economic development by providing employment, food, raw material for industries, and foreign exchange earnings. Since the economic crisis, this sector has continued to show its important role as a “buffer sector” in the economy.
Due to its role as the staple food, rice is the most important agricultural commodity
in Indonesia. From 1969 to 1988, production grew at 4.5% annually. In 1984 and 1985, Indonesia had its greatest production success when it moved from being the world’s greatest rice importer to being self-sufficient (Heytens, 1991: 114-137). Unfortunately, this success did not continue for long. Currently, the Indonesian government is importing rice and using a tariff to make itself less dependent on foreign markets.
In South Sulawesi Province, the growth rate of rice production is higher than the
national average. In 2001, total production of rice in the province was 3,610,669 tons. Wet-land paddy (padi sawah) – irrigated and rainfed systems – contributed about 99% of the production (3,583,114 tons) and the rest, about 1% (27,600 tons), came from dryland farming (padi ladang) (BPS, 2000).
The most important research questions in this study relate to the private and social
profitability of rice production. Is rice sufficiently profitable to provide farmers with the incentive to continue or expand output? Does the rice that is being produced use resources efficiently, i.e., does Indonesia have a comparative advantage in growing rice? Answers to these questions are needed evaluate the current policy environment and to consider the desirability of various proposals, especially those that deal with improving the country’s food security.
1.2. Research Methods
One of the most suitable research tools for examining the profitability, competitiveness, and efficiency of commodity production is the Policy Analysis Matrix (PAM). In addition to estimating of profitability of producing commodities at private and social prices, the matrix format also produces a breakdown of commodity budgets into revenues, tradable input costs, and domestic resource costs. When budget elements valued at social prices are subtracted from those valued at private prices, the PAM’s matrix format makes it possible to pinpoint the location of government policies and market failures with a good deal of precision.1
1 For a detailed discussion of the PAM approach see Eric A. Monke and Scott R. Pearson, 1989.
The Policy Analysis Matrix for Agricultural Development. Cornell University Press, USA.
5

1.2.1. Research Sites
The research was carried out in Polmas District, South Sulawesi Province, Indonesia.2 Polmas is one of the main rice growing districts in the Province. Campurjo Village, the site at which data were collected, was randomly selected. The village is located in a lowland zone that has good irrigation and water control. Data were collected in three stages: (1) field orientation and preparation (secondary data collection, permission of survey from local government), pre-survey (pre-test of questionnaire), and community meeting; (2) household survey, focus group discussion, and in-depth interviews; and (3) the communication of results to receive feedback from various groups. Data collection was carried out during October-December, 2002.
1.2.2. Data Collection Method
In the present research, both primary and secondary data, including post-farm costs and returns, were needed. Primary data – estimates of physical input and output items and their associated prices at the farmgate level – were gathered by household survey during the dry season of 2002. Forty households were chosen randomly. Post-farm costs and returns data were obtained from World Bank publications provided by CASER (Center for Agro Socio Economic Research), CASER training materials, and related research reports. Secondary data, such as prices of tradable inputs and outputs, were collected from government offices (BPS, Agricultural Service Office, Trade and Industry Office). Other prices, particularly transportation costs, were collected from local wholesale markets in Polewali (capital city of Polmas District) and Makassar (capital city of South Sulawesi Province).
The household survey was the main tool for developing farm budgets. This quantitative method was complemented with a qualitative approach that used community meetings, in-depth interviews, and focus group discussions, for gathering data not obtained in the household survey.
1.2.3. Communicating Results
Research findings were communicated in three stages. First, a small discussion group (pre-seminar) was conducted at the district level before the research was undertaken. This was intended to promote the PAM approach to analyzing agricultural development. Second, two officials of the Polmas local government (agricultural service) were involved in the fieldwork, giving them experience in using primary data collection techniques. Third, a post-seminar was conducted to disseminate the results of the research. The seminar was aimed particularly at local government officials who are involved in agricultural policy-making at the district level.
2 Soon after we did the first field visit, the district officially was divided into two government
administrations, Polewali District and Mamasa District. In this report, however, we still use Polmas District because the secondary data are not available separately.
6

1.3. Brief Description of the Research Site
Polewali Mamasa (Polmas) District is one of 23 districts in South Sulawesi Province. It is located in the northern part of the province, about 250 km from Makassar, the capital city of South Sulawesi. Polmas is bounded by Mamuju District in the north, Tana Toraja and Pinrang Districts in the east, Makassar Strait in the south, and Majene District in the west.
In 1999, the total area of Polmas was 4,781.53 km2, which was divided into 9 sub-districts and 201 villages; they are the Sub-Districts of Tinambung, Tutallu, Campalagian, Wonomulyo, Polewali, Sumarorong, Pana, Mamasa, and Mambi. Among the sub-districts, Mambi has the largest area (25% of the total), while Tinambung is the smallest (2%). This area lies between 3 m – 1,100 m above sea level; Mamasa Sub-district is highest area (1,110 m).
The research was conducted at Campurjo Village. The village is located in
Wonomulyo Sub-district, 18 km north of Polewali. According to 2001 census data, the physical area of Campurjo is 293.26 hectares with a population of 2,001. The population consists of 1,051 men and 1,041 women in 498 households. The man-land ratio in the village is 7.14 per hectare. The rice field ratio is 0.9 hectare per person. All rice fields (180.74 hectares) in the village are serviced by an irrigation network. The village can be reached by any kind of vehicle. The closest local market is in Wonomulyo. It is the major local market in the Wonomulyo area. Farmers can easily find any agricultural input in the market. Some farmers, however, prefer buying their daily food needs or their agricultural inputs in the Polewali town market.
7

2. PROFITABILITY AND COMPETITIVENESS: COMPUTING PRIVATE
BUDGETS
2.1. Input-Output Data
The data collected from the rice farm survey, focus group discussions, and in-depth interviews were used to construct an input-output table. Data were crosschecked with local experts to ensure their validity and reliability. The input-output data for rice farming are shown in Table 2.1.
Table 2.1. Physical Input-Output Data
Input-Output Items Amount Tradable inputs Fertilizer (kg/ha)
Urea 223 KCl 15 SP-36 12 ZA 50 Chemicals Ally 20 WDG 0.06 Thiodan 0.00 Bassa 0.00 Furdan 0.10 Drusban 0.13 Seed (kg/ha) 36 Fuel (liters/ha) Tractor 30
Thresher 6 Domestic Factors Labor (hr/ha)
Seedbed Prep 4 Land preparation 0 Planting 0 Seed extraction 6 Planting 12 Crop care Weeding 10 Fertilizer application 3 Chemical application 8 Harvesting 45 Capital
Working Capital (Rp/ha) 1,353,299 Tractor Services (hr/ha) 16 Thresher (hr/ha) 6
Land (ha) 1 Output (kg/ha) 5,799
8

The average rice yield (gabah kering panen, GKP or dry paddy) for the farms sampled was was 5,799 kg per hectare at the site. Inputs are divided into two categories – tradable inputs and domestic factors. Tradable inputs are inputs that are imported or exported. In rice farming, inputs such as fertilizers, chemicals, seed, and fuels fall into this category. Domestic factors used in production are labor, capital, and land.
2.2. Analysis of Private Profitability
2.2.1. Determining Private Price
Private prices are the actual prices of all inputs and outputs used in production. These prices were derived from farm surveys, focus group discussions, and in-depth interviews (Table 2). Prices of tradables were collected during interviews with farmers and crosschecked at the nearest Toko Tani (retail shop for agricultural inputs), transport service providers, and PT (pertani). Domestic factor prices such as labor costs, capital, and land rent were collected from farm surveys and checked with extension experts.
Table 2.2. Private Prices
Input-Output Items Amount Tradable Inputs Fertilizer (kg/ha)
Urea 1,199 KCl 1,895 SP-36 1,700 ZA 1,230 Chemicals Ally 20 WDG 50,000 Thiodan 70,000 Bassa 48,000 Furdan 9,000 Drusban 58,000 Seed (kg/ha) 2,363 Fuel (liters/ha) 0 Tractor 1,550 Thresher 1,550
Domestic Factors Labor (hr/ha) Seedbed Prep 10,000 Land preparation Planting Seed extraction 20,572 Planting 20,572 Crop care Weeding 10,000 Fertilizer application 15,000 Chemical application 15,000 Harvesting 15,139 Capital
9

Table 2.2. Private Prices Input-Output Items Amount
Working Capital (Rp/ha) 0 Tractor Services (hr/ha) 23,656 Thresher (hr/ha) 28,385
Land (ha) 1,000,000 Output (Rp/ha) 1,028
Land Preparation
Land preparation in the area is done by tractor service providers. Therefore, the cost of land preparation in the prices table was based on the cost of tractor services. The UPJA (Usaha Pelayanan Jasa Alsintan, Services Provider for Agricultural Machinery) charged Rp. 378,500 per hectare (including lunch for the operators).
Family Labor
Seedbed preparation and crop care (weeding, fertilizer application, and chemical application) are generally done by the farmers themselves. The wage rate varies based on the type of work. The wage rate for seedbed preparation and weeding was Rp. 10,000 per man-day, while the daily wage rate for fertilizer and chemical application was Rp. 15,000.
Hired Labor
The valuation of hired labor was more complicated than family labor. All respondents hired labor in two activities – planting and harvesting. In planting, the bayaran or borongan system was the prevalent labor institution. Each labor group had 10–20 farmer members. Seed extraction (cabut-bibit) and planting (tanam-padi) were generally treated as a package. Farmers generally paid about Rp. 360,000 per hectare for these services.
Working Capital, Services, Land Rent, and Others
Working Capital: Working capital is cash used by farmers to run the rice farming operation and pay for the cash costs of chemicals, fertilizer, and hired-labor. Farmers got their working capital from various sources – capital accumulation from the previous season, borrowing from other farmers, neighbors and relatives, or borrowing from an input retailer. Other forms of lending institutions were government-supported credit and commercial credit issued by private and state banks. However, few farmers availed themselves of these two credit sources. Reasons given were the uncertainty of an agricultural business environment that could lead to an inability to pay back of the loan and a lack of familiarity with the lending procedures of official financial institutions. Information on working capital was obtained from farmers who had experience in getting loans from BRI (Bank Rakyat Indonesia, a state-owned bank). Farmers could get Rp. 800,000 for a 0.5 hectare rice farming operation for one year. The interest rate was 11.8%
10

for the one-year period. Based on this figure, interest for a four-month period (a production cycle) was assumed to be 4%.
Land Rent, Tractor and Thresher Services: According to an agricultural officer, the land rental rate for a rice field was about Rp. 1,000,000. However, land rental in the district is very rare. Almost no landowners rented land out; they preferred sharecropping. For the purpose of calculating private profits, Rp. 1,000,000 was used as an estimate of the private land rental rate.
Tractor and thresher service prices were based on the direct costs paid to UPJA
providers. The cost for the services was Rp. 378,500 for the tractor and Rp. 170,311 for the thresher. These figures were divided by a rough estimate of time used to obtain a price.
2.2.2. Private Budget and Profitability Analysis
The results in Table 2.3 were obtained by multiplying the physical input-output coefficients (Table 2.1) times their related prices (Table 2.2).
Table 2.3. Private Budget
Input-Output Items Amounts CategoriesTradable Inputs Fertilizer (kg/ha) 529,847
Urea 266,849 SP-36 28,330 KCl 20,281 ZA 62,078 Chemicals 0 Ally 20 WDG 3,000 Thiodan 0 Bassa 0 Furdan 900 Drusban 7,540 Seed (kg/ha) 85,068 Fuel (liters/ha) 0 Tractor 46,500 Thresher 9,300
Domestic Factors Labor (hr/ha) 1,343,465 Seedbed Prep 40,400 Land preparation 0 Planting 0 Seed extraction 123,432 Planting 236,578 Crop care 0 Weeding 96,200 Fertilizer application 45,300 Chemical application 120,300 Harvesting 681,255
11

Table 2.3. Private Budget Input-Output Items Amounts Categories
Capital 602,938 Working Capital (Rp/ha) 54,132 Tractor Services (hr/ha) 378,496 Thresher (hr/ha) 170,310
Land (ha) 1,000,000 1,000,000Revenue 5,961,372 5,960,909
Total Cost (excluding land) Rp/ha 2,476,250 Profit (excluding land rent) Rp/ha 3,485,122 Net Profit (including rent ) Rp/ha 2,485,122 2,484,660
The total revenue of rice farming, shown in Table 2.3 is Rp. 5,960,909 per hectare.
Total costs are Rp. 2,476,250, excluding land rent. Net profit is Rp. 2,484,660 per hectare. Rice farming in Polmas District during the 2002 dry season thus was highly profitable. With these profits, farmers can be expected to expand rice production unless the area suitable for rice is limited or there are other competing crops that are even more profitable.3
3 See Monke and Pearson (1989:19-20) for the interpretation of private profitability.
12

3. EFFICIENCY AND COMPARATIVE ADVANTAGE: COMPUTING SOCIAL BUDGETS
3.1. Analysis of Social Prices and Competitiveness
The next task needed to create a PAM matrix is to compute a social budget table. The first step is to calculate the social prices for tradable and nontradable inputs and outputs. These social prices must then be multiplied by the related physical input-output in Table 2.1 to produce the social budget.
3.1.1. Social Prices Table
Table 3.1. Social Prices
Input-Output Items Amount Tradables Fertilizer (kg/ha)
Urea 1,090 KCl 1,361 SP-36 1,361 ZA 1,361 Chemicals Ally 20 WDG 34,739 Thiodan 34,739 Bassa 34,739 Furdan 34,739 Drusban 34,739 Seed (kg/ha) 2,005 Fuel (liters/ha) - Tractor 2,192 Thresher 2,192
Factors Labor (hr/ha) Seedbed Prep 10,000 Land preparation - Planting - Seed extraction 20,572.00 Planting 20,572.00 Crop care Weeding 10,000 Fertilizer application 15,000 Chemical application 15,000 Harvesting 15,139 Capital
Working Capital (Rp/ha) 0.04 Tractor Services (hr/ha) 23,656 Thresher (hr/ha) 28,385
Land (ha) 2,000,000 Output (kg/ha) 845
13

3.3.2. Tradable Output-Inputs Prices
Output Price
As Table 3.2 indicates, this calculation requires both macro economic and trade data. The f.o.b. (free on board) price of 35 percent broken rice in Bangkok in 2002 was $150 per ton. The international insurance and freight costs to Jakarta, the capital of Indonesia, were US$ 15 per ton. The resulting international price was US$ 165 per ton. To convert the international price to domestic currency, this figure was multiplied by an exchange rate of Rp. 8,800 per US$. The result was Rp. 1,452,000 per ton or Rp. 1,452 per kg.
Table 3.2. Import Parity Prices for Output
Rice, 35% broken Beras (F.o.b in Bangkok ($/ton)) 150Freight & Insurance ($/ton) 15C.i.f. Indonesia ($/unit) 165Exchange rate (Rp/$) 8,800Exchange rate premium (%) 0%Equilibrium exchange rate 8,800C.i.f. in Indonesia Currency (Rp/ton) 1,452,000 Weight conversion factor (kg/ton) 1000C.i.f. in Indonesia Currency (Rp/kg) 1,452 Distribution costs (Jakarta-Makassar) (Rp/kg) 105Import parity value at Makassar (Rp/kg) 1,557 Distribution costs (Makassar-Polmas) (Rp/kg) 100Import parity value at Farm Gate/Polmas-research site (Rp/kg) 1,657 Conversion factor (51%)(Beras to GKP at the research site) 845
There were two transportation costs – shipping costs, from the port of Jakarta to
the wholesaler at Makassar, and trucking costs from the wholesaler in Makassar to the retailer in Polewali. As shown in Table 3.2, the shipping cost was Rp. 105 per kg and the transportation cost from Makassar to Polewali was Rp. 100 per kg.
Inputs Prices
Similar procedures were used to compute social prices for inputs. Tables 3.3 and 3.4 show the input parity price calculations for seed and fuel. (Detailed calculations for fertilizers and chemicals are shown in Tables A1-A2.)
Table 3.3. Import Parity Prices for Input Seed F.o.b ($/ton) 187Freight & Insurance ($/ton) 15
14

Table 3.3. Import Parity Prices for Input Seed C.i.f. Indonesia ($/unit) 204.5Exchange rate (Rp/$) 8,800Exchange rate premium (%) 0%Equilibrium exchange rate 8,800C.i.f. in Indonesia Currency (Rp/ton) 1,800,000 Weight conversion factor (kg/ton) 1000C.i.f. in Indonesia Currency (Rp/kg) 1,800 Distribution costs (Jakarta-Makassar) (Rp/kg) 105Import parity value at Makassar (Rp/kg) 1,905Distribution costs (Makassar-Polmas) (Rp/kg) 100Import parity value at Farm Gate/Polmas-research site (Rp/kg) 2005
Table 3.4. Import Parity Prices for Input
Fuel F.o.b in Bangkok ($/liter) 0.2Freight & Insurance ($/liter) 0.04C.i.f. Indonesia ($/liter) 0.24Exchange rate (Rp/$) 8,800Exchange rate premium (%) 0%Equilibrium exchange rate 8,800C.i.f. in Indonesia Currency (Rp/liter) 2,112.00Transport cost (Jakarta-Makassar) (Rp/liter) 55Import parity value at Makassar (Rp/liter) 2,167.00 Distribution costs (Makassar-Polmas) (Rp/liter) 25Import parity value at Farm Gate/Polmas- the research site) (Rp/liter) 2,192.00
3.3.3. Domestic Factors
Labor Valuation
Because labor costs account for a large share of total costs, a proper procedure for estimating labor value is important for social budget construction. Labor in the rural areas is not homogeneous in terms of skill. Farm laborers in Polmas District were semi-skilled labor and mobile. All respondents were Javanese immigrants who could take jobs elsewhere. There were no divergences (distorting policies or market failures) in the labor market of Polmas District. The social price of labor, therefore, was assumed to be equal to its private price in every activity.
Capital Valuation
15

The social price for capital was assumed to be 12%, the same as the private price. During the rice production cycle, the social interest rate is 4% for 4 months (Table 3.1). For tractor, thresher, and rice miller services, social prices were assumed to be the same of private prices determined by the owner.
Land Valuation.
Like other factors of production, land use has social value (economic opportunity cost) that is estimated by what it can produce in its next best alternative use. A few farmers in the village produced soybeans in the dry season as a substitute commodity for rice. The net social profit of soybeans, Rp. 2,000,000, was used as an estimate of the social price of land.4 This figure reflects the net benefits foregone as a result of using land for rice cultivation.
3.2. Social Budget and Profitability Analysis
The principal aim of social profitability analysis is to find out if a production system is efficient and thus contributing to the growth of national income. This will be the case if social profits are positive. The social budget (Table 3.5) was constructed by multiplying the input-output table (Table 2.1) by the social prices of the physical components of production (Table 3.1). For example, revenue (Rp.4,900,151 per hectare) resulted from multiplying rice output (5,799 kg/ha) times by its social price (Rp 845/kg).
Social profit was calculated in Table 3.5. The total cost of the rice system
(excluding land rent) was Rp. 2,455,394 per hectare, and the net profit was Rp. 444,761 per hectare (Table 3.5). This amount showed that, based on international price comparisons of tradables and opportunity costs of domestic resources, the return to rice management in 2002 was positive socially.
Table 3.5. Social Budget
Input-Output Items Amount Categories Tradables 508,991
Fertilizer (Rp/ha) Urea 242,581 242,581 SP-36 20,343 20,344 KCl 16,234 16,234 ZA 68,680 68,680 Chemicals - - Ally 20 WDG 2,084 2,084 Thiodan - - Bassa - - Furdan 3,473.94 3,474 Drusban 4,516 4,516
4 This figure is based on the estimation of farmers who had experience in cultivating soybeans.
16

Table 3.5. Social Budget Input-Output Items Amount Categories
Seed (kg/ha) 72,166 72,166 Fuel (liters/ha) - - Tractor 65,760 65,760
Thresher 13,152 13,152 Factors Labor (Rp/ha) - 1,343,465
Seedbed Prep 40,400 40,400 Land preparation - - Planting - - Seed extraction 123,432 123,432 Planting 236,578 236,578 Crop care - - Weeding 96,200 96,200 Fertilizer application 45,300 45,300 Chemical application 120,300 120,300 Harvesting 681,255 681,255 Capital - 602,938
Working Capital (Rp/ha) 54,132 54,132 Tractor Services (hr/ha) 378,496 378,496 Thresher (hr/ha) 170,310 170,310
Land (ha) 2,000,000 2,000,000 Revenue 4,900,155
Total Cost (excluding land) Rp/ha 2,455,394 Profit (excluding land rent) Rp/ha 2,444,761
Profit Net Profit (including rent ) Rp/ha 444,761 444,786
17
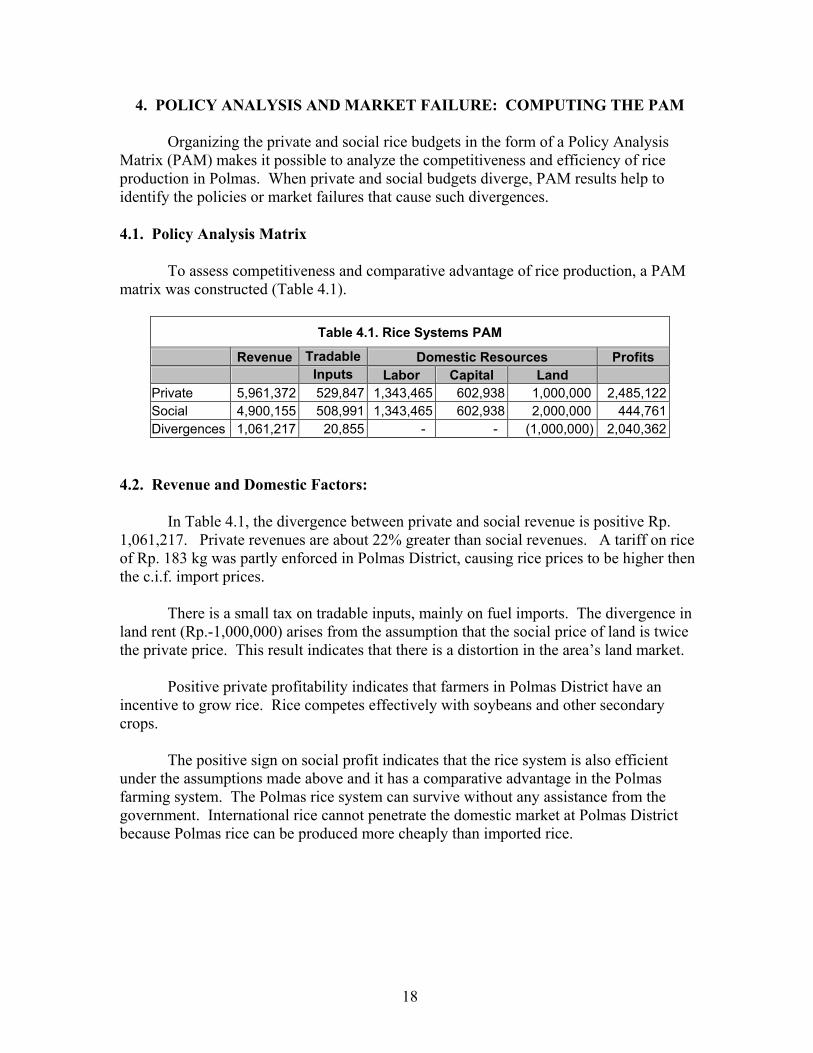
4. POLICY ANALYSIS AND MARKET FAILURE: COMPUTING THE PAM
Organizing the private and social rice budgets in the form of a Policy Analysis Matrix (PAM) makes it possible to analyze the competitiveness and efficiency of rice production in Polmas. When private and social budgets diverge, PAM results help to identify the policies or market failures that cause such divergences.
4.1. Policy Analysis Matrix
To assess competitiveness and comparative advantage of rice production, a PAM matrix was constructed (Table 4.1).
Table 4.1. Rice Systems PAM
Revenue Tradable Domestic Resources Profits Inputs Labor Capital Land
Private 5,961,372 529,847 1,343,465 602,938 1,000,000 2,485,122 Social 4,900,155 508,991 1,343,465 602,938 2,000,000 444,761 Divergences 1,061,217 20,855 - - (1,000,000) 2,040,362
4.2. Revenue and Domestic Factors:
In Table 4.1, the divergence between private and social revenue is positive Rp. 1,061,217. Private revenues are about 22% greater than social revenues. A tariff on rice of Rp. 183 kg was partly enforced in Polmas District, causing rice prices to be higher then the c.i.f. import prices.
There is a small tax on tradable inputs, mainly on fuel imports. The divergence in
land rent (Rp.-1,000,000) arises from the assumption that the social price of land is twice the private price. This result indicates that there is a distortion in the area’s land market.
Positive private profitability indicates that farmers in Polmas District have an incentive to grow rice. Rice competes effectively with soybeans and other secondary crops.
The positive sign on social profit indicates that the rice system is also efficient
under the assumptions made above and it has a comparative advantage in the Polmas farming system. The Polmas rice system can survive without any assistance from the government. International rice cannot penetrate the domestic market at Polmas District because Polmas rice can be produced more cheaply than imported rice.
18

5. CONCLUSIONS
The main questions addressed in this paper are: Is the rice farming system at Polmas District profitable at private prices, i.e., do farmers have an incentive to grow rice at current prices? Is rice socially profitable and thus a crop in which the District has a comparative advantage? Are there significant government policies or market failures that should be addressed to promote a more efficient use of the country’s domestic resources?
The conclusions and lessons learned are as follow:
1. The rice farming system of the District is privately and socially very profitable.
There are substantial private incentives, and, under the assumptions used, the District has a comparative advantage in growing rice. Government policies that raise the price of rice through a tariff are unnecessary. The same can be said of policies that subsidize the cost of inputs. The substantial positive social profits mean that market mechanisms will create sufficient incentives for farmers to provide the rice that is needed for the country’s food security.
2. An area in which the national government can assist in increasing rice productivity is new research on rice varieties and the development of improved pest control practices. Local governments can play a significant role in raising yields by disseminating the best rice practices as widely as possible. For example, the “sowing rice seed directly” (tabela tabur benih langsung) system could reduce planting costs. Local governments also have a role in improving infrastructure to provide better roads and water control systems.
19

Appendix A
Table A1. Import Parity Prices for Input
Fertilizer Urea KCl SP-36 ZA
F.o.b ($/ton) 96.6 127.4 127.4 127.4
Freight & Insurance ($/ton) 13.6 13.6 13.6 13.6
C.i.f. Indonesia ($/unit) 110.2 141 141 141
Exchange rate (Rp/$) 8,800 8,800 8,800 8,800
Exchange rate premium (%) 0% 0% 0% 0%
Equilibrium exchange rate 8,800 8,800 8,800 8,800
C.i.f. in Indonesia Currency (Rp/ton) 969,760.0 1,240,800.0 1,240,800.0 1,240,800.0
Weight conversion factor (kg/ton) 1000 1000 1000 1000
C.i.f. in Indonesia Currency (Rp/kg) 969.76 1,240.80 1,240.80 1,240.80
Distribution costs (Jakarta to Makassar port) (Rp/kg) 70 70 70 70
Import parity value at Makassar (Rp/kg) 1,039.76 1,310.80 1,310.80 1,310.80
Distribution costs (Makassar to Polmas) (Rp/kg) 50 50 50 50Import parity value at Farm Gate/Polmas-research site (Rp/kg) 1,089.76 1,360.80 1,360.80 1,360.80
Table A2. Import Parity Prices for Input
Chemicals Alli Thiodan Bassa Furadan Drusban F.o.b ($/ton) 3750 3750 3750 3750 3750
Freight & Insurance ($/ton) 163 163 163 163 163
C.i.f. Indonesia ($/unit) 3913 3913 3913 3913 3913
Exchange rate (Rp/$) 8,800 8,800 8,800 8,800 8,800
Exchange rate premium (%) 0% 0% 0% 0% 0%
Equilibrium exchange rate 8,800 8,800 8,800 8,800 8,800
C.i.f. in Indonesia Currency (Rp/ton) 34,434,400.0 34,434,400.0 34,434,400.0 34,434,400.0 34,434,400.0
Weight conversion factor (kg/ton) 1000 1000 1000 1000 1000
C.i.f. in Indonesia Currency (Rp/kg) 34,434.40 34,434.40 34,434.40 34,434.40 34,434.40 Distribution costs (Jakarta-Makassar) (Rp/kg) 105 105 105 105 105
Import parity value at Makassar (Rp/kg) 34,539.40 34,539.40 34,539.40 34,539.40 34,539.40 Distribution costs (Makassar-Polmas) (Rp/kg) 200 200 200 200 200Import parity value at Farm Gate/Polmas-research site (Rp/kg) 34,739.40 34,739.40 34,739.40 34,739.40 34,739.40
20

21
REFERENCES
BPS (Badan Pusat Statistik) (2000). South Sulawesi in Figures. BPS Sulawesi Selatan
Province. BPS (Badan Pusat Statistik) (2001). Polmas in Figures. BPS Polmas District. Heytens, P. (1991). ‘Policy Alternatives for Future Rice Production Growth’ in Pearson,
S., et al, Rice Policy in Indonesia, Cornell University Press, Ithaca. Monke, E.A. and S.R. Pearson (1989). The Policy Analysis Matrix for Agricultural
Development. Cornell University Press, Ithaca. Pearson, S., & C. Gotsch. (2001). The Policy Analysis Matrix: A Computer Tutorial (A
Lecture Material of Manado Workshop). Pearson, S., R. Naylor., and W. Falcon. (1991). ‘Recent Policy Influences on Rice
Production’ in Pearson, S., et al, Rice Policy in Indonesia, Cornell University Press, Ithaca.
Pearson, S., S. Bahri., C. Gotsch. (2003). Is Rice Production in Indonesia Still
Profitable? BAPPENAS/ USAID/ DAI Food Policy Support Activity and The Center for Agro-Socio Economic Research (CASER), Indonesian Food Policy Program www.macrofoodpolicy.com
The Center for Agro-Socio Economic Research (CASER) and the BAPPENAS/ USAID/
DAI Food Policy Support Activity (year?). Rice Production and Marketing in Sidrap South Sulawesi (paper).