the real economy 57 - tma. sep... · truck driving jobs today, with a total of 7.4 million american...
TRANSCRIPT

RSM US MANUFACTURING OUTLOOK INDEX POINTS TO MANUFACTURING DECLINE
RSM MONTHLY GDP MODEL SIGNALS SLOWING GROWTH
INDUSTRY SPOTLIGHT:HEALTH CARE FACES DEMAND FOR PRICING TRANSPARENCY
MIDDLE MARKET TREND WATCH:HELP WANTED: WILLING AND AVAILABLE WORKERS
THE REAL ECONOMYVOLUME 57
ECONOMIC SLOWDOWN ANDMANUFACTURING CONTRACTION

2 | S E P T E M B E R 2 0 1 9
Joseph Brusuelas Chief Economist, RSM US LLP
Kevin DepewDeputy Chief Economist, Industry Eminence Program Leader,RSM US LLP
Rick Kes Senior Manager, Health Care Senior Analyst, RSM US LLP
Jason AlexanderPrincipal, Industrial Products Senior Analyst, RSM US LLP
ABOUT THE AUTHORS
Our thought leaders are professionals with years of experience in their fields who strive to help you and your business succeed. Contributors to this issue include:

R S M | T H E R E A L E C O N O M Y | 3
This publication represents the views of the author(s), and does not necessarily represent the views of RSM. This publication does not constitute professional advice.
Central banks brace for economic slowdown as manufacturing reflects contraction 4
RSM US Manufacturing Outlook Index points tomanufacturing decline 10
RSM monthly GDP model signals slowing growth 14
Industry spotlight: Health care faces demand for pricing transparency 16
Middle market trend watch: Help wanted: Willing and available workers 19
TABLE OF CONTENTS

4 | S E P T E M B E R 2 0 1 9
A SLOWING GLOBAL ECONOMY and declining bond yields across the developed world—some negative—portend a deteriorating business climate. To combat this broad slowdown, global central banks are shifting monetary policy toward more accommodative stances that include real negative rates, nominal negative rates, large-scale asset purchases and possibly further unorthodox policy moves such as temporary price-level targeting. The amount of
government securities with negative yields globally now totals more than $13 trillion and is likely to remain a permanent feature of the global economic and financial landscape.
As global central banks, including the U.S. Federal Reserve, prepare to proactively stave off this slowdown, we turn our attention to the primary rationale behind the push to alter monetary policy: the global economic downturn in manufacturing.
In past slowdowns—particularly before China’s ascent to economic powerhouse—the global economy typically looked to the United States to kick-start economic recoveries. Even with the reemergence of protectionism in developed economies, co-dependency still exists, perhaps even more so with the maturation of global supply chains. For example, the chart to the left shows Boeing’s international suppliers, spread across every continent and into dozens of other countries.
Source: Boeing
Boeing share price and U.S. manufacturing sales
CENTRAL BANKS BRACE FOR ECONOMIC SLOWDOWN AS MANUFACTURING REFLECTS CONTRACTION
BY JOSEPH BRUSUELAS AND JASON ALEXANDER

IN PAST SLOWDOWNS—PARTICULARLY BEFORE CHINA’S ASCENT TO ECONOMIC POWERHOUSE—THE GLOBAL ECONOMY TYPICALLY LOOKED TO THE UNITED STATES TO KICK-START ECONOMIC RECOVERIES. EVEN WITH THE REEMERGENCE OF PROTECTIONISM IN DEVELOPED ECONOMIES THAT CO-DEPENDENCY STILL EXISTS, PERHAPS EVEN MORE SO WITH THE MATURATION OF GLOBAL SUPPLY CHAINS.
R S M | T H E R E A L E C O N O M Y | 5
Meanwhile, most economists are expecting a convergence of growth in the major economies of North America, Western Europe and Asia. Economic analysts surveyed by Bloomberg are projecting sub-2% growth in 2020-21 in North America and Western Europe, and for a slowdown in China to 6%, as well as a continuation of Japan’s malaise.
As these growth forecasts suggest, the economic community has integrated deteriorating conditions in the manufacturing sector into forecasts. Meanwhile, global business sentiment in the Organisation for Economic Cooperation and Development economies has deteriorated to levels below 100, suggesting pessimism regarding future growth. This marks the first time since the European debt crisis and the collapse of commodity prices in 2015 that the index has dropped to pessimistic levels, suggesting that developed economies are nearing the end of the business cycle uptrend.
Most disturbing for the U.S. economy, including the middle market, the OECD business sentiment index has at times been a leading indicator of U.S. manufacturing sales, with sentiment indicators reported earlier than developments in the real economy. The relationship between global business sentiment and domestic manufacturing output can be attributed to the integration of the developed economies through global supply chains and the financial channel.
Source: ECFC; Bloomberg; RSM US LLP
-8
-6
-4
-2
0
2
4
6
2007 2009 2011 2013 2015 2017 2019
Rea
l GD
P (Y
OY
%)
U.S. U.K. Germany
Analyst forecasts
Expectations of U.S., U.K. and Germany real GDP growth
Source: ECFC; Bloomberg; RSM US LLP
Expectations of U.S., China and Japan real GDP growth
-10
-5
0
5
10
15
2007 2009 2011 2013 2015 2017 2019
Rea
l GD
P (Y
OY
%)
U.S. China Japan
Analyst forecasts
OECD global business confidence index as a leading indicator of U.S. manufacturing sales
Source: OECD; Bloomberg
Glo
bal b
usin
ess
confi
denc
e in
dex
-24
-20
-16
-12
-8
-4
0
4
8
12
16
94
95
96
97
98
99
100
101
102
103
104
1984 1989 1994 1999 2004 2009 2014 2019
U.S
. man
ufac
turin
g sa
les
(YO
Y %
)
U.S. manufacturing sales (YOY %) (RHS)
Total OECD business confidence index

If U.S. manufacturing is so small, why is it so important?
The manufacturing sector has long been considered the backbone of the U.S. economy, attaining mythic status for generations of working-class households from Freehold, New Jersey to Gary, Indiana and Long Beach, California. At their peak, immediately after World War II, and following its resurgence in the early 1980s, manufacturing sales represented 12% to 14% of total U.S. nominal gross domestic product. Since then, production has been affected due to the first wave of automation, and in some cases, off-shored to centers with lower labor costs. U.S. manufacturing sales now account for only 7% of GDP within what today’s more diversified service and information-based economy.
The chart below shows the impact of the 2007-09 collapse of the financial sector on the real economy and the importance of the manufacturing sector on the direction of overall economic activity.
Neither the financial sector nor the manufacturing sector exists in isolation. Advances within the transportation industry and the digitalization of production controls have allowed for the development of interstate supply chains. The ripple effects of income
derived from production now move beyond the plant’s immediate neighborhood to an out-of-state supplier.
On national accounts by industry basis, manufacturing accounts for only 11% of nominal GDP, down from 13% in 2005. So if manufacturing has occupied, at most, 14% of the space within a complex economy at its very peak, why is there such a strong relationship between the business cycle and the ups and downs of the manufacturing sector? In short, it’s because of economic interconnectivity.
In a recent paper by the Federal Reserve Bank of San Francisco, “How have changing sectoral trends affected GDP growth?,” Andrew Foerster, Andreas Hornstein, Pierre-Daniel Sarte and Mark Watson, found three sectors that carried outsize influence on GDP growth based on how influential they are in the production of other sectors: construction, manufacturing of nondurable goods, and professional and business services. The following explores the interconnectivity impact of manufacturing on other subsectors.
Aerospace
The aerospace industry is a good example of a global industry with international product and supply chains and interconnectivity. The demand for airplanes is reflective both of the discretionary income of consumers and the logistic needs of manufacturers; that is, moving people or manufactured goods from one place to another. The two biggest producers are Boeing (based in Seattle) and Airbus, the multinational European company.
Yearly data from Airbus shows a declining trend in orders, with 2018 orders half of what they were at the peak in 2013. Monthly delivery data from Boeing indicates that orders have plummeted in 2019 relative to the same month of the previous year, and that orders in the first six months of 2019 were down more than 30% relative to the same period of 2018.
6 | S E P T E M B E R 2 0 1 9
CENTRAL BANKS BRACE FOR ECONOMIC SLOWDOWN (CONTINUED)
Real manufacturing sales and U.S. real GDP YEAR-OVER-YEAR GROWTH RATES
-6
-4
-2
0
2
4
6
-15
-10
-5
0
5
10
1999 2001 2003 2005 2007 2009 2011 2013 2015 2017 2019
Rea
l GD
P (Y
OY
%)
Real GDP (YOY %) (smo) (RHS)Real manufacturing sales (YOY %)
Rea
l man
ufac
turin
g sa
les
(YO
Y %
)
2007-09 Financial crisisand Great Recession
2017-19 Manufacturingdowntrend
Source: BEA; Census; Bloomberg; RSM US LLP
R S M | T H E R E A L E C O N O M Y | 7
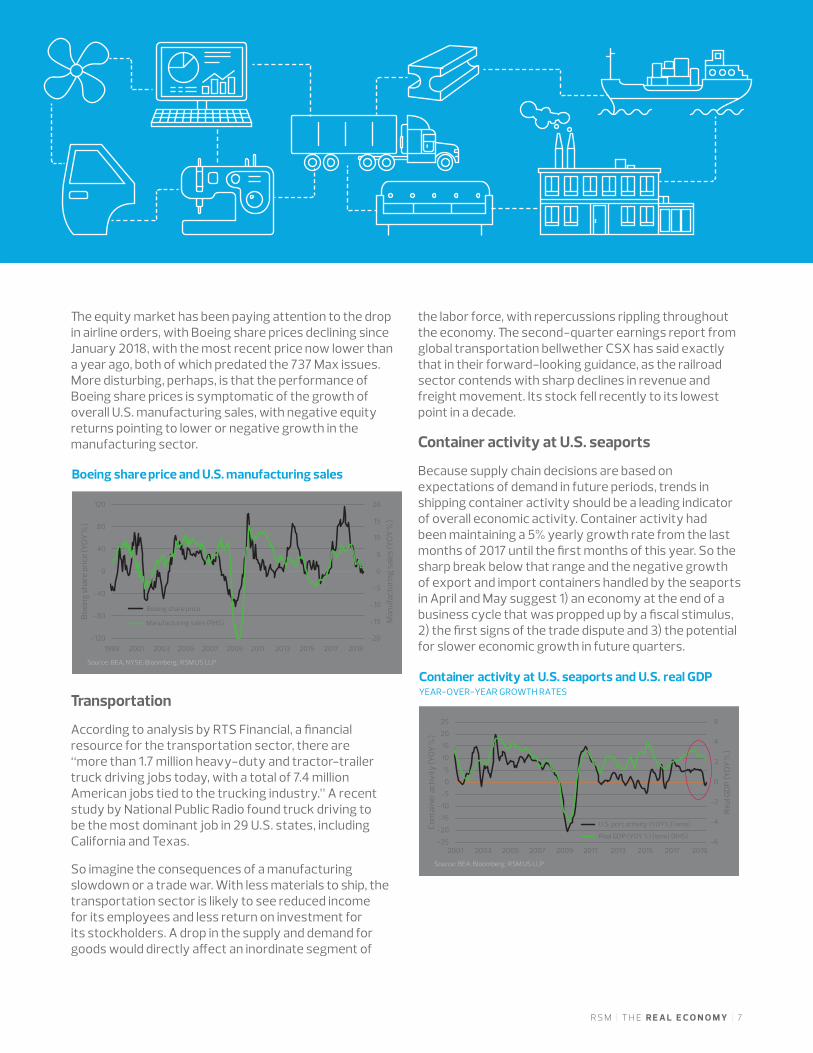
The equity market has been paying attention to the drop in airline orders, with Boeing share prices declining since January 2018, with the most recent price now lower than a year ago, both of which predated the 737 Max issues. More disturbing, perhaps, is that the performance of Boeing share prices is symptomatic of the growth of overall U.S. manufacturing sales, with negative equity returns pointing to lower or negative growth in the manufacturing sector.
Transportation
According to analysis by RTS Financial, a financial resource for the transportation sector, there are “more than 1.7 million heavy-duty and tractor-trailer truck driving jobs today, with a total of 7.4 million American jobs tied to the trucking industry.” A recent study by National Public Radio found truck driving to be the most dominant job in 29 U.S. states, including California and Texas.
So imagine the consequences of a manufacturing slowdown or a trade war. With less materials to ship, the transportation sector is likely to see reduced income for its employees and less return on investment for its stockholders. A drop in the supply and demand for goods would directly affect an inordinate segment of
the labor force, with repercussions rippling throughout the economy. The second-quarter earnings report from global transportation bellwether CSX has said exactly that in their forward-looking guidance, as the railroad sector contends with sharp declines in revenue and freight movement. Its stock fell recently to its lowest point in a decade.
Container activity at U.S. seaports
Because supply chain decisions are based on expectations of demand in future periods, trends in shipping container activity should be a leading indicator of overall economic activity. Container activity had been maintaining a 5% yearly growth rate from the last months of 2017 until the first months of this year. So the sharp break below that range and the negative growth of export and import containers handled by the seaports in April and May suggest 1) an economy at the end of a business cycle that was propped up by a fiscal stimulus, 2) the first signs of the trade dispute and 3) the potential for slower economic growth in future quarters.
Boeing share price and U.S. manufacturing sales
Source: BEA; NYSE; Bloomberg; RSM US LLP
-20
-15
-10
-5
0
5
10
15
20
-120
-80
-40
0
40
80
120
1999 2001 2003 2005 2007 2009 2011 2013 2015 2017 2019
Man
ufac
turin
g sa
les
(YO
Y %
)
Boei
ng s
hare
pric
e (Y
OY
%)
Manufacturing sales (RHS)
Boeing share price
Container activity at U.S. seaports and U.S. real GDPYEAR-OVER-YEAR GROWTH RATES
Source: BEA; Bloomberg; RSM US LLP
-6
-4
-2
0
2
4
6
-25
-20
-15
-10
-5
0
5
10
15
20
25
2001 2003 2005 2007 2009 2011 2013 2015 2017 2019
Con
tain
er a
ctiv
ity (Y
OY
%)
Real GDP (YOY %) (smo) (RHS)
U.S. port activity (YOY%) (smo)
Rea
l GD
P (Y
OY
%)

Transportation equity prices
At the same time that GDP growth has been trending upward, transportation sector stocks have been signaling concern of a slowdown. The chart below shows that the Dow Jones transportation and transportation services indices have plummeted since third quarter 2018, echoing drops that occurred during the Great Recession (2007-09), the European debt crisis (2011-13) and the commodity-price crash (2014-15).
What to watch
Our preferred recession probability model from the New York Federal Reserve is currently forecasting a 32.87% probability of a recession in the next 12 months. For now, the data indicate the slowdown is largely concentrated in global manufacturing. A closer look at manufacturing survey data in the United States shows the deterioration in sentiment here. Surveys by the Federal Reserve banks suggest that regional business conditions have deteriorated since the third quarter of 2018 in anticipation of a manufacturing contraction. As
well, the Institute for Supply Management Purchasing Managers Index has deteriorated over the same time and is threatening to move below its pivot point of 50.
Capacity utilization
Capacity utilization in manufacturing tends to move with the ups and downs of business cycles, but has been declining on trend since the late 1960s as the economy began its transition from being manufacturing-based to services-centered.
8 | S E P T E M B E R 2 0 1 9
Source: Federal Reserve; Bloomberg; RSM US LLP
55
60
65
70
75
80
85
90
95
1969 1974 1979 1984 1989 1994 1999 2004 2009 2014 2019
Nondurables manufacturing (%)
Durables manufacturing (%)
Cap
acity
util
izat
ion
(%)
1970sStagflation Era
1991-92Bush Recession
2000-01Dot.com Recession-
9/11 Slowdown2007-09
Great Recession
Capacity utilization–long-term trends in durableand nondurable manufacturing
Source: ISM; Bloomberg; RSM US LLP
ISM manufacturing PMI
30
35
40
45
50
55
60
65
70
1999 2001 2003 2005 2007 2009 2011 2013 2015 2017 2019
ISM
man
ufac
turin
g P
MI (
diff
usio
n in
dex)
Dow Jones transportation indices and U.S. real GDPYEAR-OVER-YEAR GROWTH RATES
Source: Dow Jones; Bloomberg; RSM US LLP
-6
-4
-2
0
2
4
6
-60
-40
-20
0
20
40
60
80
1997 1999 2001 2003 2005 2007 2009 2011 2013 2015 2017 2019
Dow Jones transportation services indexDow Jones transportation index
Real GDP (YOY %) (smo) (RHS)
Real
GD
P (Y
OY
%)
Tran
spor
tatio
n in
dice
s (Y
OY
%)
CENTRAL BANKS BRACE FOR ECONOMIC SLOWDOWN (CONTINUED)
THIS MARKS THE FIRST TIME SINCE THE EUROPEAN DEBT CRISIS AND THE COLLAPSE OF COMMODITY PRICES IN 2015 THAT THE OECD BUSINESS CONFIDENCE INDEX HAS DROPPED TO PESSIMISTIC LEVELS, SUGGESTING THAT DEVELOPED ECONOMIES ARE NEARING THE END OF THE BUSINESS CYCLE UPTREND.

The latest drop in capacity utilization is a potential sign that the economy peaked in the third quarter and that the surge in economic growth in 2018 was a result of a fiscal stimulus, the effects of which are beginning to wane.
New orders
New manufacturing orders are forward-looking by definition; a merchant or downstream producer considers the prospects for future profit and orders additional stock of goods if warranted.
As we show below, new orders for manufacturing of durable and nondurable goods rebounded after the 2000 recession and the shock of the 9/11 attacks. During the recovery from the 2007-09 financial crisis and Great Recession, however, new orders began pushing lower toward recession levels as manufacturing production
moved offshore. Manufacturing new orders reversed trend, increasing again from 2015 until the imposition of the trade tariffs in early 2018.
Meanwhile, new manufacturing orders have often been a leading indicator of U.S. economic growth, often moving lower or higher before the rest of the economy catches up. So the deceleration of new orders beginning in 2018 correctly anticipated that the straight-line increases in real GDP growth between 2016 and early 2019 would be in jeopardy as manufacturers respond to the administration’s repeated threats to free trade.•
R S M | T H E R E A L E C O N O M Y | 9
New manufacturing orders–long-term trends in durableand nondurable manufacturing
Source: Census; Bloomberg; RSM US LLP
-40
-30
-20
-10
0
10
20
30
1991 1995 1999 2003 2007 2011 2015 2019
New
ord
ers
(YO
Y %
)
2007-09Great Recession
2000-01Dot.com Recession-
9/11 slowdown
Nondurables new orders (YOY %)Durables new orders (YOY %)
Late-cycleslump in orders
Source: Census; Bloomberg; RSM US LLP
-6
-4
-2
0
2
4
6
-50
-40
-30
-20
-10
0
10
20
30
1999 2001 2003 2005 2007 2009 2011 2013 2015 2017 2019
Real GDP (YOY %) (smo) (RHS)Durables new orders (YOY %)
New
ord
ers
(YO
Y %
)
Real
GD
P (Y
OY
%)
Late-cycleslump in new orders
Late-cycle fiscalstimulus
Increase in GDP
growth
Increase in neworders
2007-09Financial crisis
and Great Recession
New manufacturing and U.S. real GDP growthDURABLE GOODS MANUFACTURING SECTOR
Capacity utilization and U.S. real GDP growthDURABLE GOODS MANUFACTURING
Source: Federal Reserve; Bloomberg; RSM US LLP
-6
-4
-2
0
2
4
6
8
10
55
60
65
70
75
80
85
90
95
1969 1974 1979 1984 1989 1994 1999 2004 2009 2014 2019
Real GDP (YOY %) (smo) (RHS)
Capacity utilization: durables (%)2007-09
Financial Crisis andGreat Recession
2019 Resumption ofmanufacturing downtrend
Capa
city
util
izat
ion
(%)
Real
GD
P (Y
OY
%)
THIS MARKS THE FIRST TIME SINCE THE EUROPEAN DEBT CRISIS AND THE COLLAPSE OF COMMODITY PRICES IN 2015 THAT THE OECD BUSINESS CONFIDENCE INDEX HAS DROPPED TO PESSIMISTIC LEVELS, SUGGESTING THAT DEVELOPED ECONOMIES ARE NEARING THE END OF THE BUSINESS CYCLE UPTREND.

1 0 | S E P T E M B E R 2 0 1 9
A NEW MANUFACTURING INDEX from RSM has been declining on trend for 14 months since peaking in June 2018 and has been negative since December of last year. The performance of the new measure, the RSM US Manufacturing Outlook Index, suggests the potential for negative growth in manufacturing sales in the months ahead.
The composite index is based on surveys of business sentiment conducted by six regional Federal Reserve banks. The index can be considered representative of the general direction of national manufacturing activity.
The RSM US MOI is reported as a Z-score (the number of standard deviations that manufacturing sentiment is above or below normal conditions). A Z-score value of zero indicates normal levels of sentiment, while a Z-score of greater than 2.0 or less than negative 2.0 represents periods that are significantly different from normal levels of sentiment and indicative of bubbles or burst bubbles, both of which are of concern.
The chart to the left shows the RSM US MOI was significantly below normal levels of sentiment in the periods immediately preceding the recent recessions of 2001 and 2007-09, and during the commodity price crash of 2014-15. In the current cycle, the index turned negative in December of last year, which points to a U.S. economy potentially nearing the end of the decadelong recovery from the Great Recession.
RSM US Manufacturing Outlook Index andU.S. manufacturing sales
Source: Federal Reserve banks; Census; Bloomberg; RSM US LLP
U.S. manufacturing sales (YOY %) (RHS)
RSM US Mfg. Outlook Index (Z-score)
-25
-20
-15
-10
-5
0
5
10
15
20
25
-5
-4
-3
-2
-1
0
1
2
3
4
5
1999 2001 2003 2005 2007 2009 2011 2013 2015 2017 2019
Man
ufac
turin
g sa
les
(YO
Y %
)
RSM
US
Mfg
. Out
look
Inde
x (Z
-sco
re)
RSM US MANUFACTURING OUTLOOK INDEX POINTS TO MANUFACTURING DECLINE
BY JOSEPH BRUSUELAS, KEVIN DEPEW AND LOGAN FLAKS

The ISM benchmark
The Institute for Supply Management Purchasing Managers Index is the benchmark business conditions index for the financial world. It often leads changes in the direction of the business cycle. Consequently, knowing the pivot points of the economy should lend insight into the direction of monetary and fiscal policy and the potential returns on asset prices.
The ISM index is based on a monthly national survey, with the ISM diffusion index reported on the first business day of the following month. Respondents are asked to evaluate business conditions, answering if those in the current period are better, worse or about the same
than in the prior month. The percentages for those three choices are determined, and the diffusion index is calculated such that a value of 50 represents no change from the prior month, with the distance above or below 50 representative of the direction and rate of change.
Building a better mousetrap
With the ISM entrenched as a benchmark manufacturing sentiment gauge, the question is: Can we come up with a better mousetrap? We’ve calculated RSM US MOI by combining business condition surveys maintained by six regional Federal Reserve banks. The RSM US MOI has a correlation of 0.91 with the ISM index (see chart below ).
R S M | T H E R E A L E C O N O M Y | 1 1
MIDDLE MARKET INSIGHT: The monthly
RSM US MOI and ISM PMI should be viewed
as essential guides for middle market
decision-makers, helping to gauge future
supply and demand requirements. In its June
2019 “Report on Business,” the ISM reported
that while the manufacturing sector
continues to grow, June was the third month
in a row of “slowing expansion,” a trend that
began in September 2018.
Source: Federal Reserve Banks; BEA; Bloomberg; RSM US LLP
ISM manufacturing PMI and U.S. real GDP growth
-8
-6
-4
-2
0
2
4
6
8
30
35
40
45
50
55
60
65
70
1999 2001 2003 2005 2007 2009 2011 2013 2015 2017 2019
ISM
man
ufac
turin
g P
MI (
diff
usio
n in
dex)
Real GDP (YOY%) (smo) (RHS)
ISM manufacturing PMI (RHS)
Real
GD
P (Y
OY
%)
RSM US Manufacturing Outlook Index and the ISM manufacturing index
Source: Federal Reserve Banks; ISM; Bloomberg; RSM US LLP
30
35
40
45
50
55
60
65
70
-6
-4
-2
0
2
4
6
1969 1974 1979 1984 1989 1994 1999 2004 2009 2014 2019
ISM manufacturing PMI (YOY %) (RHS)RSM US Mfg. Outlook Index (Z-score)
ISM
inde
x
RSM
US
Mfg
. Out
look
Inde
x (Z
-sco
re)

1 2 | S E P T E M B E R 2 0 1 9
More important, the RSM US MOI has higher rates of correlation than the ISM index with respect to the growth of real (0.73) and nominal (0.68) manufacturing sales and the growth of real gross domestic product (0.66) (see table below ).
RSM US MANUFACTURING OUTLOOK INDEX (CONTINUED)
Correlations of the ISM PMI and RSM Manufacturing Outlook Index with U.S. manufacturing sales and GDP growthMONTHLY CORRELATIONS, JANUARY 1998 - MAY 2019
ISM mfg. PMI(index)(RHS)
RSM USMfg. Outlook
Index (Z-score)
Real GDP(YOY %) (smo)
(RHS)
U.S.mfg. sales
(YOY %) (RHS)
U.S. realmfg. sales
(YOY %) (RHS)
ISM mfg. PMI (index) (RHS) 1 1.00
RSM US Mfg. Outlook Index (Z-score) 0.91 1.00
Real GDP (YOY %) (smo) (RHS) 0 .490 .661 1.00
U.S. mfg. sales (YOY %) (RHS) 0 .630 .680 .661 1.00
U.S. real mfg. sales (YOY %) (RHS) 0 0.63 0.73 0.86 0.79 1.00
Cross-country outlook for manufacturing
Because of geographic differences and the dominance of local industry, it is expected that there would be variance in sentiment levels by region and industry composition. For example, business sentiment in Texas and western New York is probably more dependent on energy prices than other regions, while sentiment in the Kansas City region is more dependent on the outlook for commodity markets. As would be expected, the inclusion of additional regions into our RSM US MOI increases its correlation with national manufacturing sales and overall economic growth.
A couple points to note: (1) the outlook for manufacturing in each of the six sectors is substantially lower than the post-crisis peaks in sentiment; and (2) the outlook for manufacturing in each of the regions has been declining on trend since summer 2018.
Calculating the RSM MOI
The RSM US MOI is a composite of diffusion indices from monthly surveys conducted by six regional Federal Reserve Banks:
• Philadelphia: Manufacturing Business Outlook Survey • New York: Empire State Manufacturing Survey
• Richmond: Fifth District Survey of Manufacturing Activity
• Chicago: Midwest Manufacturing Activity Index • Dallas: Texas Manufacturing Outlook Survey: General
Business Conditions Index • Kansas City: Manufacturing Survey: 10th District
Manufacturing Activity
The survey results are normalized relative to a base period of pre-financial crisis behavior (January 1994 to June 2008) and then averaged. The normalized values of the survey average are reported, representing the number of standard deviations that business conditions are perceived to be above (+) or below (-) normal levels. [Note: The normalized values are referred to as Z-scores, with values above 1.96 or below -1.96 are considered to be significantly different from the average level, with zero defined as normal.]•

R S M | T H E R E A L E C O N O M Y | 1 3
RESEARCH SHOWS MIDDLE MARKET CYBER-RISK
Nearly 50% of midsize companies expect they will face unauthorized users attempting to breach their data or systems this year, according to executives RSM surveyed. Despite incidents of rising cybercrime, just half of the businesses surveyed carry cyber insurance policies to protect against internet-based risk. Our study shows that many of those policies may fall short of comprehensive coverage.
Meanwhile, the C-level executives we surveyed may be overly confident in their firms’ internal abilities to thwart an attack. Some 93% of respondents were confident in their organizations’ ability to safeguard customer data. The reality—based on actual incident reports—is proving that confidence may be misguided.
Learn more in the full report.
THE REAL ECONOMY BLOGREAL INSIGHTS FOR THE REAL ECONOMY
Get timely updates on the middle market economy by subscribing to The Real Economy Blog.
Follow RSM Chief Economist Joe Brusuelas and our senior industry analysts as they cover the latest economic and business trends affecting middle market companies.
From industry issues to breaking economic news, get insights to help you anticipate and address the unique issues and challenges you’re facing as a middle market business.
Subscribe today.

1 4 | S E P T E M B E R 2 0 1 9
MIDWAY THROUGH 2019’s third quarter and less than six weeks from the first official estimate of the period’s growth on Oct. 30, it’s never too soon for middle market businesses to begin planning. A continual flow of economic data releases and revisions can provide the means to assess what might be coming down the pike.
The initial estimate from the Bureau of Economic Analysis shows growth in the second quarter slowed to a 2.1% annualized pace (2.2% on a year-over-year basis), following an inventory buildup that powered surprise growth of 3.1% in the first quarter.
RSM has developed a monthly measure of gross domestic product, which indicates that GDP growth has been decelerating since November 2018, pacing at 3% in the early months of 2019 before dropping to 2.2% by June (see chart to the right ). The RSM US Real GDP Index confirms that growth would have been worse if not for the injection of buoyancy from the stockpiling of inventory, likely the result of business uncertainty
stemming from threats to the global supply chain such as tariffs. With July’s industrial production dropping to less than 0.5%, and signs of deterioration in the labor market, the third quarter has begun with a whimper.
RSM MONTHLY GDP MODEL SIGNALS SLOWING GROWTHBY KEVIN DEPEW
Source: BEA; BLS; Census; Bloomberg; RSM US LLP
U.S. real GDP growth and RSM model index ofeconomic activity
Model index
Real GDP by expenditure (YOY %) (smo)
Projection
-10
-8
-6
-4
-2
0
2
4
6
1992 1995 1998 2001 2004 2007 2010 2013 2016 2019
RSM US LLP projection
(YO
Y %
cha
nge)

R S M | T H E R E A L E C O N O M Y | 1 5
What accounts for the slowdown in growth?
The current business cycle—extended by the Tax Cuts and Jobs Act passed at the end of 2017—likely peaked in the third quarter of 2018 after the immediate effect of the front-loaded corporate tax cuts dwindled. At least some of the slowness in growth since 2018 appears to have been self-inflicted.
As shown below , nonresidential investment (blue line ) did not respond to the tax cut and continued to decelerate before turning negative.
The most likely reason for the economic slowdown is the indirect cost of the trade war between the United States and China. Tariffs implemented by the United States in the first half of 2018 have resulted in disruptions and diversions in the global supply chain, uncertainty for businesses and investors, and subsequently, retaliatory reduction in purchases of U.S. goods by China.
As shown below , growth of exports has diminished since the tariffs began, first turning negative in the third quarter of 2018 and then again in the second quarter of 2019. Import growth has diminished as well, which adds to the global slowdown.
Where do we go from here?
We suspect the business cycle might have peaked in the last half of 2018 and that the 10-year economic recovery following the Great Recession has finally run out of steam. The 2.2% GDP growth rate fits well within the range of growth during the period of recovery after the financial crisis of 2007-09 and the subsequent Great Recession. But growth has nevertheless fallen below its medium-term trend.•
Source: BEA; Bloomberg; RSM US LLP
Growth of exports and imports GDP NATIONAL ACCOUNTS DURING THE 2011-19 RECOVERY PERIOD
-4
-2
0
2
4
6
8
10
12
2011 2012 2013 2014 2015 2016 2017 2018 2019
ExportsGDP (QOQ %, SAAR) Imports
Q %
, SA
AR)
(fou
r-qt
r mov
avg
)
Source: BEA; Bloomberg; RSM US LLP
Components of investment growthGDP NATIONAL ACCOUNTS DURING THE 2011-19 RECOVERY PERIOD
NonresidentialResidential Investment
-10
-5
0
5
10
15
20
2011 2012 2013 2014 2015 2016 2017 2018 2019
Q %
, SA
AR)
(fou
r-qt
r mov
avg
)

1 6 | S E P T E M B E R 2 0 1 9
INDUSTRY SPOTLIGHT
HEALTH CARE FACES DEMAND FOR PRICING TRANSPARENCYMore control over choice for the patient consumerBY RICK KES
PRESIDENT TRUMP SIGNED an executive order earlier this summer designed to improve transparency in the pricing of health care. It’s the latest move in an environment where consumers are exercising power over the cost of treatment, an area that historically offered them little wiggle room. Health care executives must consider that their consumers (patients) are now looking at their service offerings the way they look at any other products or services in the marketplace—with an eye toward quality and value.
The stated purpose of the administration’s executive order, “Improving Price and Quality Transparency in American Healthcare to Put Patients First,” is to “enhance the ability of patients to choose the health care that is best for them. To make fully informed decisions about their health care, patients must know the price and quality of a good or service in advance.”
On July 29, the Centers for Medicare and Medicaid Services issued a proposed rule related to the executive order. The rule would require hospitals to display negotiated charges for at least 300 services, 70 of which CMS would select, the other 230 to be selected by the hospital. The proposed rule as written would go into effect Jan. 1, 2020.
The executive order goes on to discuss milestones focused on pricing transparency:
• Within 60 days of the executive order: The Secretary of Health and Human Services shall propose a
regulation to post not only the health care providers’ charges but also information about their negotiated rates with health plans.
• Within 90 days of the executive order: The Secretaries of HHS, Treasury and Labor shall issue an advance notice of proposed rule-making, soliciting comment on a proposal to require providers, health plans and self-insured groups to provide (or facilitate) access to information about expected out-of-pocket costs for items or services before they receive care.
• Within 180 days of the executive order: The Secretary of HHS shall issue a report describing the manners in which the federal government or the private sector are impeding health care price and quality transparency for patients.
Pricing transparency is a widely discussed topic in the health care ecosystem as patients increasingly view themselves as consumers with more control over choice. According to the Centers for Disease Control and Prevention, 47% of the commercially insured, pre-Medicare population was covered by a high-deductible health plan in 2018. With so many people covered by HDHPs, it is no wonder more patients are focused on the out-of-pocket costs they face when receiving medical care.
Technology and demographic changes are also driving the push for lower costs. The Pew Research Center expects that sometime in 2019 the millennial generation will—or likely have already—overtaken the baby-
HEALTH CARE
R S M | T H E R E A L E C O N O M Y | 1 7
boomer generation. This shift, which coincided with the digitization of information and the ease with which consumers can access it, has accelerated market demand for transparency.
Consumers’ experiences with on-demand service providers like Uber and Netflix have also helped to shape expectations in the health care market. Although these online platforms have different core services–Netflix for entertainment, Uber for transportation–they both offer three elements critical to their user experience: on-demand service, customization and mobility. They have also added adjacent services; Uber created Uber Eats, while Netflix started its own production studios.
Netflix, Uber and other online platform businesses are often valued in some part by the number of subscribers they have. Netflix, which recently announced it did not add as many subscribers as it had forecasted, saw its stock price drop from about $362 a share to $321, an 11% decrease.
One reason subscribers matter to Netflix is that they represent a recurring revenue stream to offset fixed costs. Perhaps an even more valuable component is the data that they bring to the platform. This intelligence allows the platform to bring its customized user experience to life. Similarly, in the health care sector, using data provided by patients to deliver personalized care allows health care systems to bring customizable advantages to the organization. And, if systems can use artificial intelligence and machine learning to suggest adjacent services, even better.
Subscribers and transparency
Transparency is just one of many expectations of the new health care consumer. Recently, RSM interviewed several health care executives among our clients and heard a common theme—they noted that users of the health care
system simply don’t have the time to shop around before treatment is sought. That may be true for emergencies or nonscheduled surgeries. However, offering transparency is not a strategy to gain market share of patients who utilize your services for an emergency; it is a strategy to gain shares of subscribers who use your services on a routine basis. Consider if your health system had more proactive offerings such as wellness applications, fitness trackers and other similar on-demand services. Subscribers to these services will provide valuable information to help you better understand their behaviors and expectations. Moreover, a lack of transparency could drive the growing cohorts of millennial consumers to
other providers.
The executive order and the link to data
The executive order had an interesting segment in section 5, “Increasing access to data to make health care information more transparent and useful to patients.” It states:
“Within 180 days of the date of this order, the Secretary of Health and Human Services, in consultation with the Secretaries of the Treasury, Defense, Labor and Veterans Affairs, and the
Director of the Office of Personnel Management, shall increase access to de-identified claims data from taxpayer-funded health care programs and group health plans for researchers, innovators, providers and entrepreneurs, in a manner that is consistent with applicable law and that ensures patient privacy and security. Providing access to this data will facilitate the development of tools that empower patients to be better informed as they make decisions related to health care goods and services. Access to this data will also enable researchers and entrepreneurs to locate inefficiencies and opportunities for improvement, such as patterns of performance of medical procedures that are outside the recommended standards of care. Such data may
PRICING TRANSPARENCY IS A WIDELY DISCUSSED TOPIC IN THE HEALTH CARE ECOSYSTEM AS PATIENTS INCREASINGLY VIEW THEMSELVES AS CONSUMERS WITH MORE CONTROL OVER CHOICE.
1 8 | S E P T E M B E R 2 0 1 9
be derived from the Transformed Medicaid Statistical Information System (T-MSIS) and other sources. As part of this process, the Secretary of Health and Human Services shall make a list of priority datasets that, if de-identified, could advance the policies set forth by this order, and shall report to the president on proposed plans for future release of these priority datasets and on any barriers to their release.”
We understand through several interviews with our clients that one impediment to sharing data is the fear of breaching patient privacy laws. The above section signals a potential shift in government regulation that could facilitate data sharing, providing a framework around how health care providers could go about sharing de-identified patient information.
Additional observations
Our clients have also noted a few barriers to pricing transparency:
• The chargemaster is built upon historical pricing models which may have no basis. In other industries, charges for goods and services are built on cost to produce or provide; however, in health care this is sometimes not the case.
• There is a concern about sharing contracted rates. • Depending on the types of payor contracts,
rationalizing the chargemaster may negatively affect the margin.
• It is difficult to provide transparency for nonemployed providers.
• There is generally a lack of specific patient level cost data.
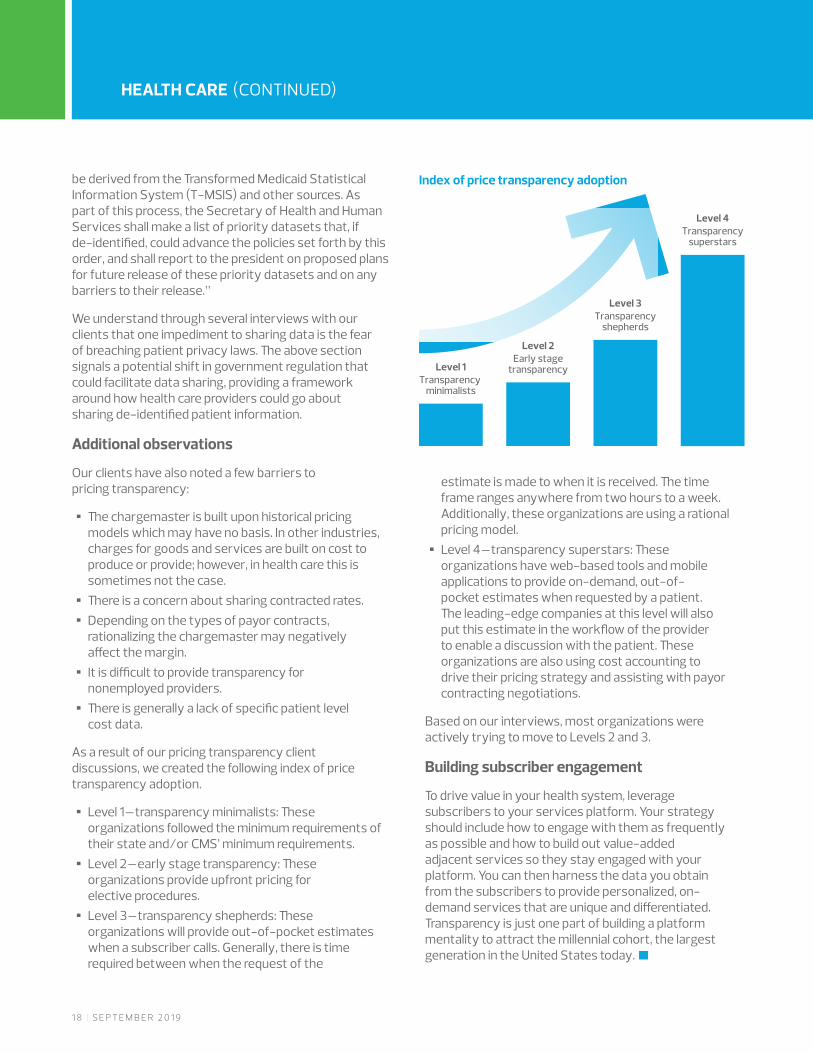
As a result of our pricing transparency client discussions, we created the following index of price transparency adoption.
• Level 1–transparency minimalists: These organizations followed the minimum requirements of their state and/or CMS’ minimum requirements.
• Level 2–early stage transparency: These organizations provide upfront pricing for elective procedures.
• Level 3–transparency shepherds: These organizations will provide out-of-pocket estimates when a subscriber calls. Generally, there is time required between when the request of the
estimate is made to when it is received. The time frame ranges anywhere from two hours to a week. Additionally, these organizations are using a rational pricing model.
• Level 4–transparency superstars: These organizations have web-based tools and mobile applications to provide on-demand, out-of-pocket estimates when requested by a patient. The leading-edge companies at this level will also put this estimate in the workflow of the provider to enable a discussion with the patient. These organizations are also using cost accounting to drive their pricing strategy and assisting with payor contracting negotiations.
Based on our interviews, most organizations were actively trying to move to Levels 2 and 3.
Building subscriber engagement
To drive value in your health system, leverage subscribers to your services platform. Your strategy should include how to engage with them as frequently as possible and how to build out value-added adjacent services so they stay engaged with your platform. You can then harness the data you obtain from the subscribers to provide personalized, on-demand services that are unique and differentiated. Transparency is just one part of building a platform mentality to attract the millennial cohort, the largest generation in the United States today.•
Index of price transparency adoption
Level 1Transparency
minimalists
Level 2Early stage
transparency
Level 3Transparency
shepherds
Level 4Transparency
superstars
HEALTH CARE (CONTINUED)

R S M | T H E R E A L E C O N O M Y | 1 9
HELP WANTED: WILLING AND AVAILABLE WORKERS
MIDDLE MARKET TREND WATCH
AMONG ORGANIZATIONS filling positions over the last 12 months, just over two-thirds (67%) of those staffing line production, manufacturing or assembly positions indicated major or moderate shortages in the availability of qualified workers. In this month’s The Real Economy, we examine businesses’ need for qualified personnel and the difficulty attracting them; data provided by our recent RSM US Middle Market Business Index survey.
While it may seem intuitive to outsource some operations to help close a workforce gap, only about one-third or fewer middle market businesses outsourced some functions or capabilities in the last 12 months due to staffing challenges.
Given the competition for talent, employee turnover has also become a challenge for eight out of 10 companies. Turnover is particularly pronounced in sales, marketing and business development roles among larger middle market companies (59%) compared to smaller organizations (31%).
In the last year, nearly two-thirds of middle market companies (62%) had significant or moderate hiring needs. More than half of the executives participating in the survey (53%) said that filling open staffing positions was extremely or very challenging.
Less than half–and as little as one-third–of middle market companies are providing the nontraditional incentives that younger workers crave such as free Wi-Fi, flexible work hours, tuition reimbursement or morning yoga classes.
KEY TAKEAWAY: Sustained levels of low unemployment, increased competition for talent and higher employee turnover are creating significant headwinds for U.S. companies seeking to augment their workforce. Middle market businesses, however, have clear opportunities to offer more nontraditional incentives to attract and retain a new generation of employees, and when appropriate, to look into technology or outsourcing to solve unmet staffing needs. According to the RSM US Middle Market Business Index second-quarter survey, most midsize businesses have yet to significantly engage on these fronts.

This document contains general information, may be based on authorities that are subject to change, and is not a substitute for professional advice or services. This document does not constitute audit, tax, consulting, business, financial, investment, legal or other professional advice, and you should consult a qualified professional advisor before taking any action based on the information herein. RSM US LLP, its affiliates and related entities are not responsible for any loss resulting from or relating to reliance on this document by any person. Internal Revenue Service rules require us to inform you that this communication may be deemed a solicitation to provide tax services. This communication is being sent to individuals who have subscribed to receive it or who we believe would have an interest in the topics discussed.
RSM US LLP is a limited liability partnership and the U.S. member firm of RSM International, a global network of independent audit, tax and consulting firms. The member firms of RSM International collaborate to provide services to global clients, but are separate and distinct legal entities that cannot obligate each other. Each member firm is responsible only for its own acts and omissions, and not those of any other party. Visit rsmus.com/aboutus for more information regarding RSM US LLP and RSM International.
RSM® and the RSM logo are registered trademarks of RSM International Association. The power of being understood® is a registered trademark of RSM US LLP.
© 2019 RSM US LLP. All Rights Reserved. TRE-NT-ALL-ALL-0919
For more information on RSM, please visit rsmus.com.
For media inquiries, please contact Terri Andrews, National Public Relations Director, +1 980 233 4710 or [email protected].
For more information on RSM thought leadership, please contact Deborah Cohen, Thought Leadership Director, +1 312 634 3975 or [email protected].