the university of hong kong librariesebook.lib.hku.hk/hkg/b35813465v1.pdf · the university of hong...
TRANSCRIPT
THE UNIVERSITY OF HONG KONGLIBRARIES
Hong Kong Collectiongift from
Hong Kong (China). Civil Engineering Dept.
FILL MANAGEMENT STUDY - PHASE II
INVESTIGATION AND DEVELOPMENT
OF
MARINE BORROW AREAS
The accuracy or reliability of this report and of other information supplied, prepared or commissioned atany time by Government in connection with the Fill Management Study is not warranted and Governmentand its agents shall not be responsible therefore in any manner whatsoever. The Tenderer's attention isdrawn to Clauses 5(3) and 13 of the General Conditions of Contract (GCC) in this regard. The Tenderershould examine and consider the Site and will be deemed to have satisfied itself of the risks andobligations under the Contract.
NORTH TATHONG AREAFINAL ASSESSMENT REPORT
JANUARY 1993Binnie Consultants Limited
in association withMaunsell Geotechnical Services Limited
Dredging Research LimitedLondon Offshore Consultants Limited
Applied Geology LimitedAshdown Environmental Limited
CIVBL ENGINEERING DEPARTMENTGEOTECHNICAL ENGINEERING OFFICE

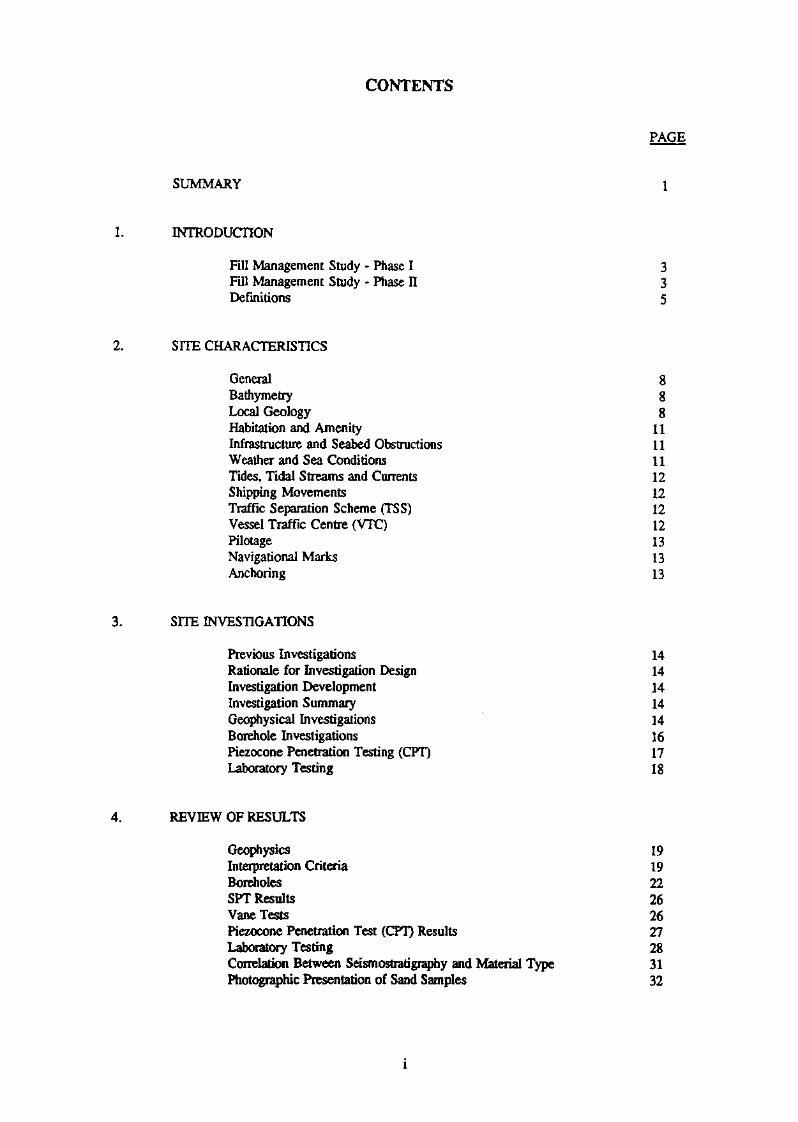
CONTENTS
PAGE
SUMMARY 1
1. INTRODUCTION
Fill Management Study - Phase I 3Fill Management Study - Phase II 3Definitions 5
2. SITE CHARACTERISTICS
General 8Bathymetry 8Local Geology 8Habitation and Amenity 11Infrastructure and Seabed Obstructions 11Weather and Sea Conditions 11Tides, Tidal Streams and Currents 12Shipping Movements 12Traffic Separation Scheme (TSS) 12Vessel Traffic Centre (VTC) 12Pilotage 13Navigational Marks 13Anchoring 13
3. SITE INVESTIGATIONS
Previous Investigations 14Rationale for Investigation Design 14Investigation Development 14Investigation Summary 14Geophysical Investigations 14Borehole Investigations 16Piezocone Penetration Testing (CPT) 17Laboratory Testing 18
4. REVIEW OF RESULTS
Geophysics 19Interpretation Criteria 19Boreholes 22SPT Results 26Vane Tests 26Piezocone Penetration Test (CPT) Results 27Laboratory Testing 28Correlation Between Seismostratigraphy and Material Type 31Photographic Presentation of Sand Samples 32
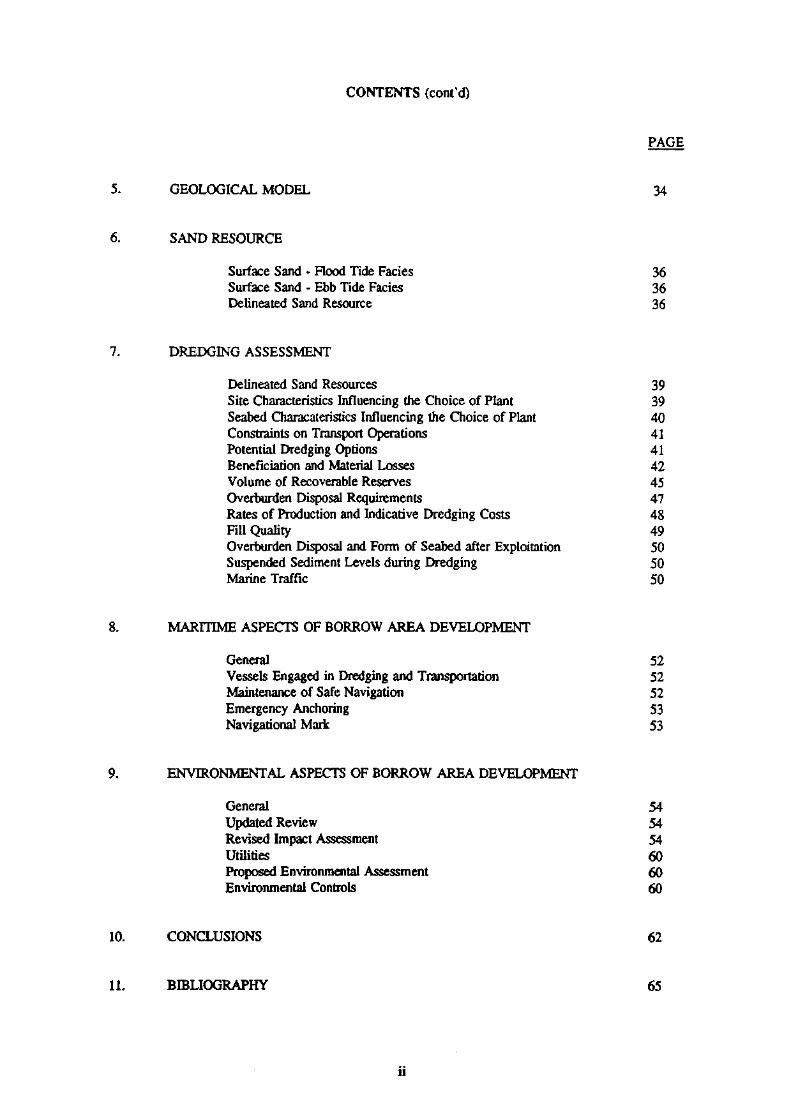
CONTENTS (cont'd)
PAGE
5. GEOLOGICAL MODEL 34
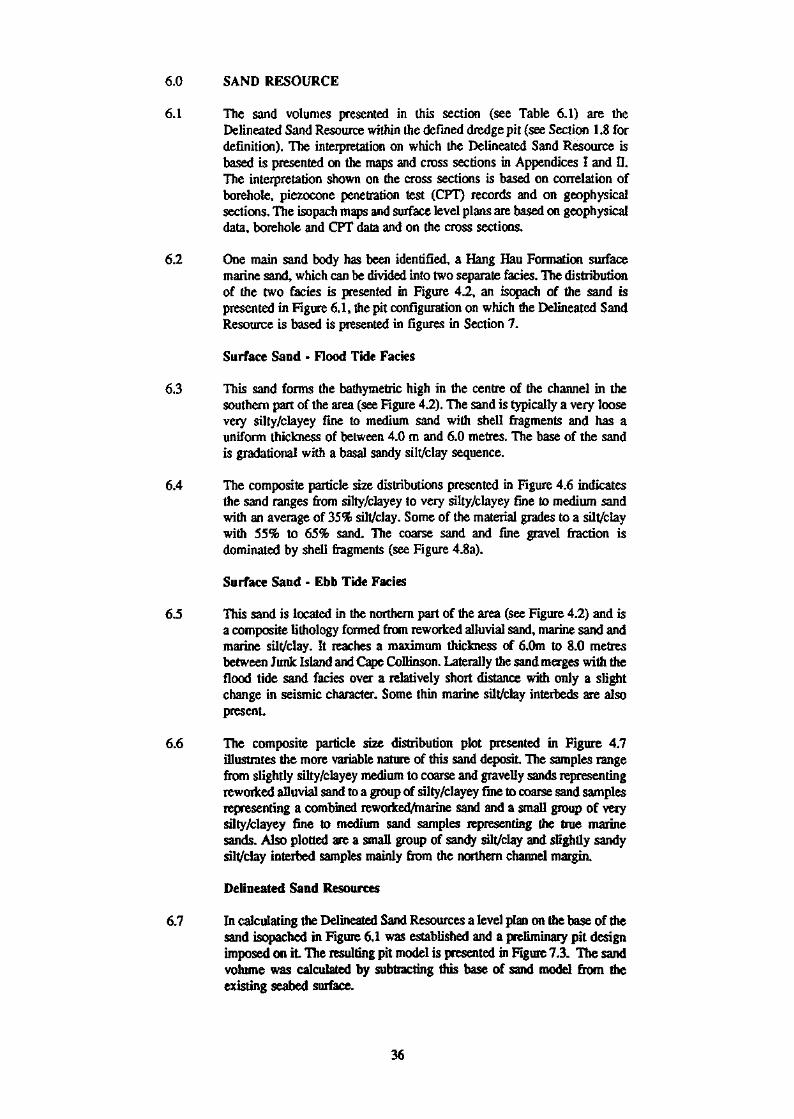
6. SAND RESOURCE
Surface Sand - Flood Tide Facies 36Surface Sand - Ebb Tide Facies 36Delineated Sand Resource 36
7. DREDGING ASSESSMENT
Delineated Sand Resources 39Site Characteristics Influencing the Choice of Plant 39Seabed Characateristics Influencing the Choice of Plant 40Constraints on Transport Operations 41Potential Dredging Options 41Beneficiation and Material Losses 42Volume of Recoverable Reserves 45Overburden Disposal Requirements 47Rates of Production and Indicative Dredging Costs 48Fill Quality 49Overburden Disposal and Form of Seabed after Exploitation 50Suspended Sediment Levels during Dredging 50Marine Traffic 50
8. MARITIME ASPECTS OF BORROW AREA DEVELOPMENT
General 52Vessels Engaged in Dredging and Transportation 52Maintenance of Safe Navigation 52Emergency Anchoring 53Navigational Mark 53
9. ENVIRONMENTAL ASPECTS OF BORROW AREA DEVELOPMENT
General 54Updated Review 54Revised Impact Assessment 54Utilities 60Proposed Environmental Assessment 60Environmental Controls 60
10. CONCLUSIONS 62
11. BIBLIOGRAPHY 65
11
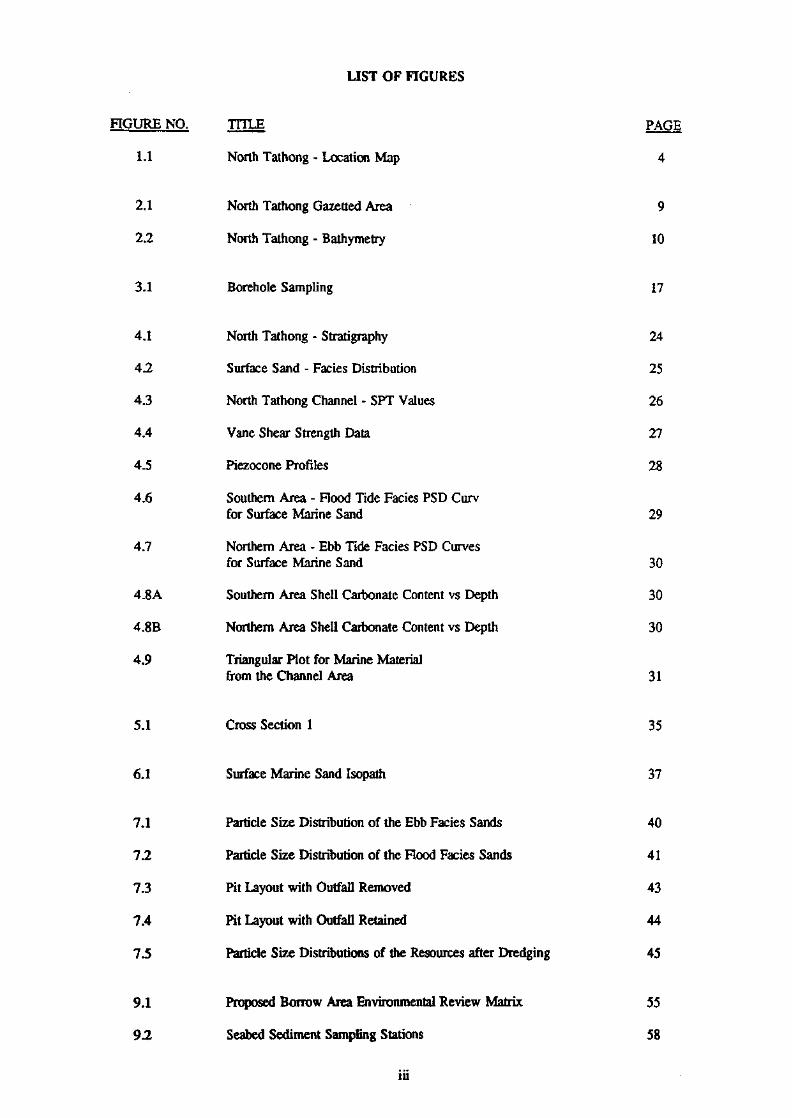
LIST OF FIGURES
FIGURE NO. TITLE PAGE
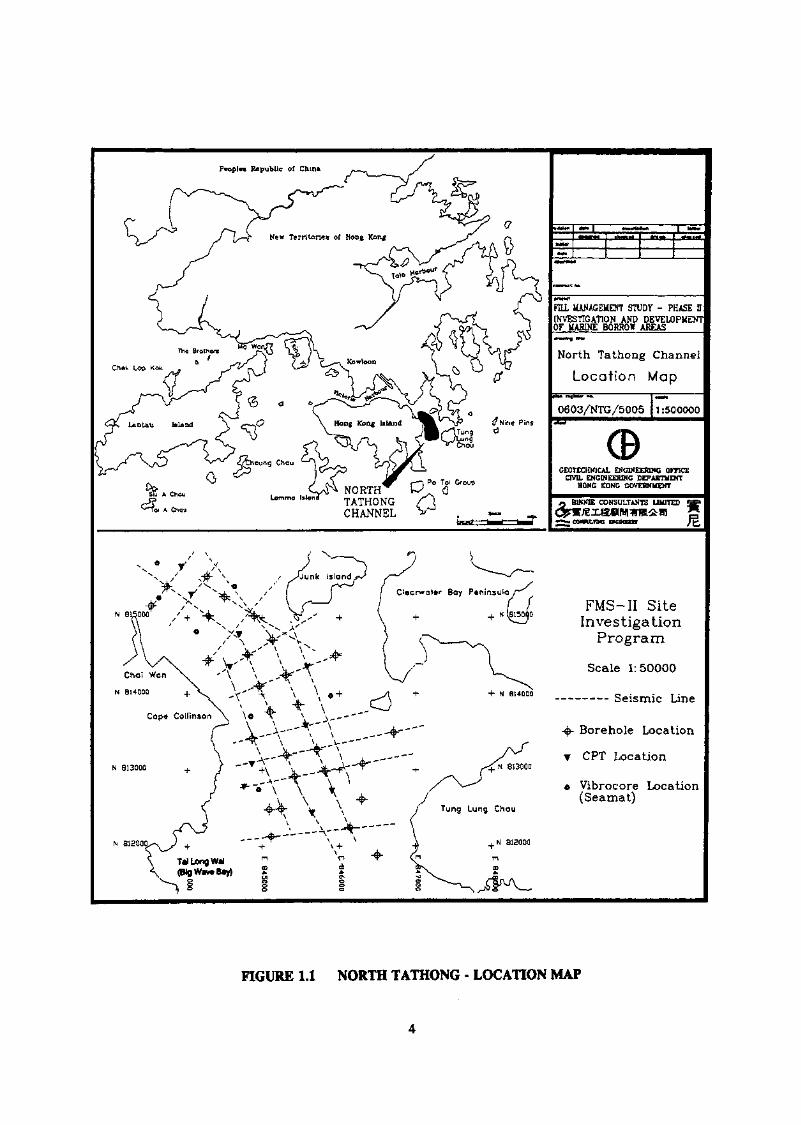
1.1 North Tathong - Location Map 4
2.1 North Tathong Gazetted Area 9
2.2 North Tathong - Bathymetry 10
3.1 Borehole Sampling 17
4.1 North Tathong - Stratigraphy 24
4.2 Surface Sand - Fades Distribution 25
4.3 North Tathong Channel - SPT Values 26
4.4 Vane Shear Strength Data 27
4.5 Piezocone Profiles 28
4.6 Southern Area - Hood Tide Facies PSD Curvfor Surface Marine Sand 29
4.7 Northern Area - Ebb Tide Facies PSD Curvesfor Surface Marine Sand 30
4.8A Southern Area Shell Carbonate Content vs Depth 30
4.8B Northern Area Shell Carbonate Content vs Depth 30
4.9 Triangular Plot for Marine Materialfrom the Channel Area 31
5.1 Cross Section 1 35
6.1 Surface Marine Sand Isopath 37
7.1 Particle Size Distribution of the Ebb Facies Sands 40
7.2 Particle Size Distribution of the Flood Facies Sands 41
7.3 Pit Layout with Outfall Removed 43
7.4 Pit Layout with Outfall Retained 44
7.5 Particle Ske Distributions of the Resources after Dredging 45
9.1 Proposed Borrow Area Environmental Review Matrix 55
9.2 Seabed Sediment Sampling Stations 58
iii
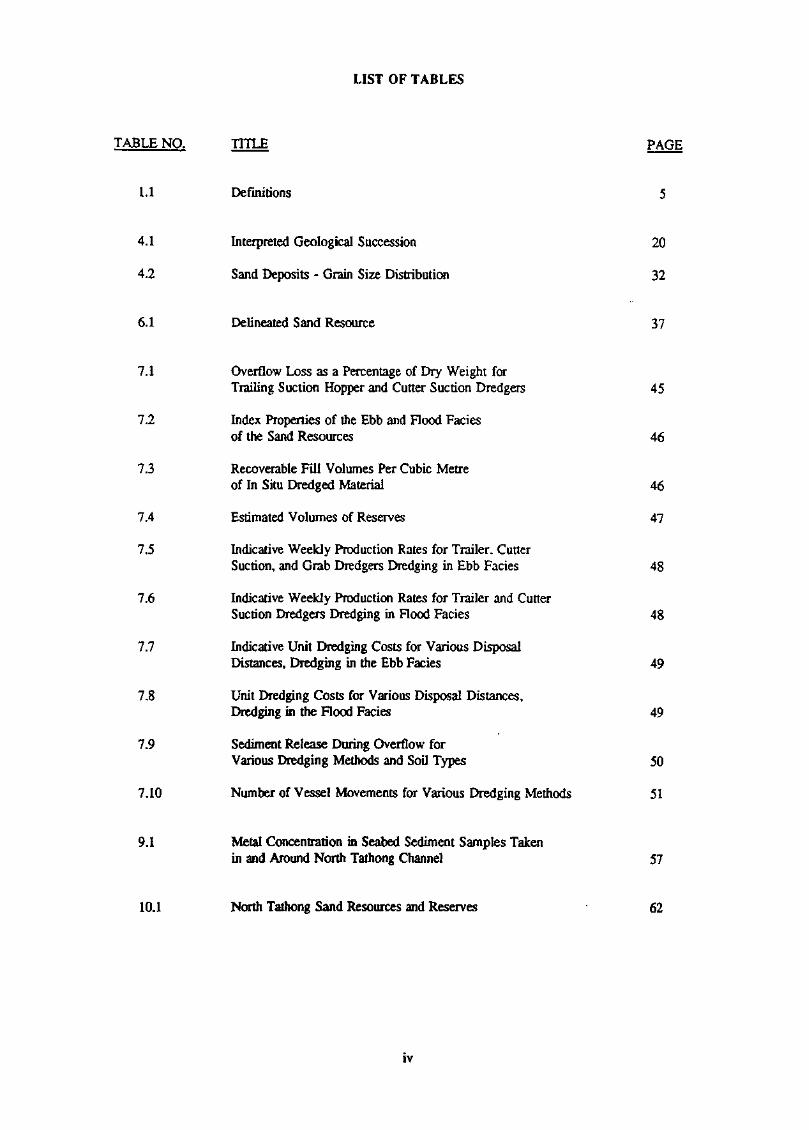
LIST OF TABLES
TABLE NO. TTTLE PAGE
1.1 Definitions 5
4.1 Interpreted Geological Succession 20
4.2 Sand Deposits - Grain Size Distribution 32
6.1 Delineated Sand Resource 37
7.1 Overflow Loss as a Percentage of Dry Weight forTrailing Suction Hopper and Cutter Suction Dredgers 45
7.2 Index Properties of the Ebb and Flood Faciesof the Sand Resources 46
7.3 Recoverable Fill Volumes Per Cubic Metreof In Situ Dredged Material 46
7.4 Estimated Volumes of Reserves 47
7.5 Indicative Weekly Production Rates for Trailer, CutterSuction, and Grab Dredgers Dredging in Ebb Facies 48
7.6 Indicative Weekly Production Rates for Trailer and CutterSuction Dredgers Dredging in Flood Facies 48
7.7 Indicative Unit Dredging Costs for Various DisposalDistances, Dredging in the Ebb Facies 49
7.8 Unit Dredging Costs for Various Disposal Distances,Dredging in the Flood Facies 49
7.9 Sediment Release During Overflow forVarious Dredging Methods and Soil Types 50
7.10 Number of Vessel Movements for Various Dredging Methods 51
9.1 Metal Concentration in Seabed Sediment Samples Takenin and Around North Tathong Channel 57
10.1 North Tathong Sand Resources and Reserves 62

LIST OF PLATES
PLATE NO, TITLE PAGE
4.1 Northern Area - Surface Marine Sand 32
4.2 Southern Area - Surface Marine Sand 33
APPENDIX
APPENDIX I - PLANS AND SECTIONS (BOUND IN SEPARATE VOLUME)
Drawing No. Title
NTG1/1 Seismic Track Plots and Site Investigation Stations
NTG1/2 Seabed Contour (- mPD)
NTG1/3 Surface Marine Sand Isopach (m)
NTG1/4 Pit Configuration at Base of Surface Sand (mPD)
NTG1/5 Section 1
NTG1/6 Section 2
NTG1/7 Section 3
NTG1/8 Section 4
NTG1/9 Section 5
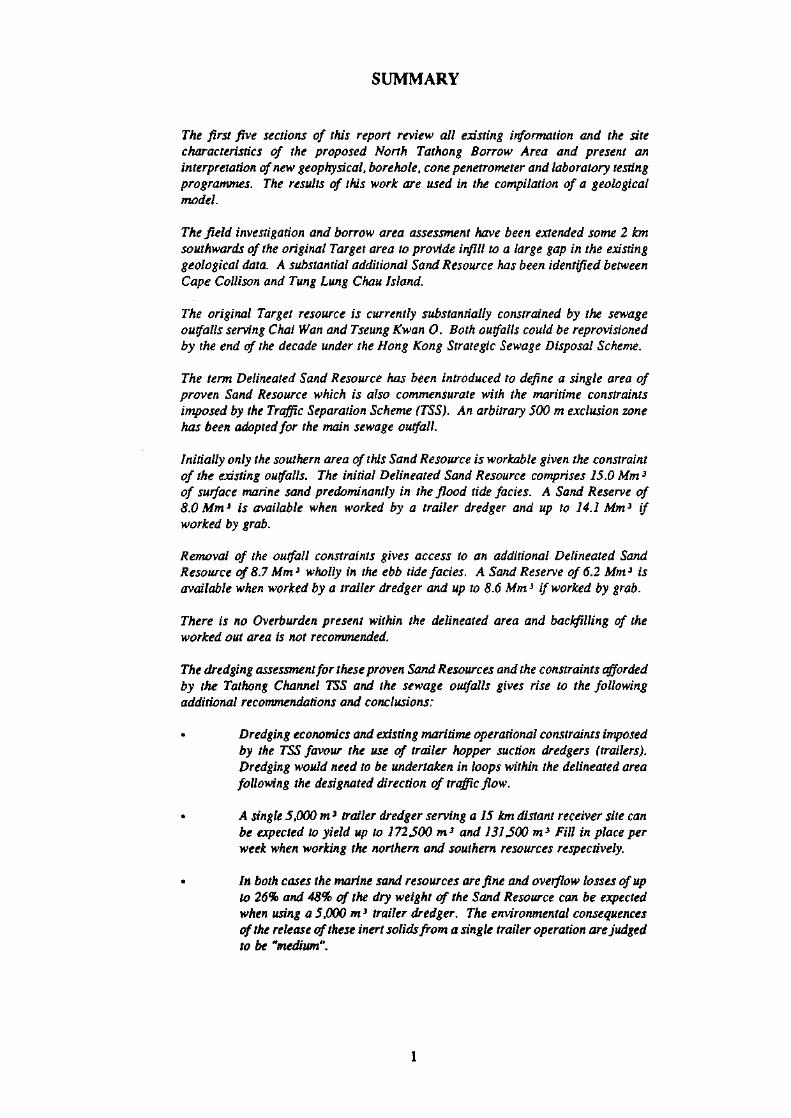
SUMMARY
The first five sections of this report review all existing information and the sitecharacteristics of the proposed North Tathong Borrow Area and present aninterpretation of new geophysical, borehole, cone penetrometer and laboratory testingprogrammes. The results of this work are used in the compilation of a geologicalmodel
The field investigation and borrow area assessment have been extended some 2 kmsouthwards of the original Target area to provide infill to a large gap in the existinggeological data. A substantial additional Sand Resource has been identified betweenCape Collison and Tung Lung Chau Island.
The original Target resource is currently substantially constrained by the sewageoutfalls serving Chai Wan and Tseung Kwan O. Both outfalls could be reprovisionedby the end of the decade under the Hong Kong Strategic Sewage Disposal Scheme.
The term Delineated Sand Resource has been introduced to define a single area ofproven Sand Resource which is also commensurate with the maritime constraintsimposed by the Traffic Separation Scheme (TSS). An arbitrary 500 m exclusion zonehas been adopted for the main sewage outfall.
Initially only the southern area of this Sand Resource is workable given the constraintof the existing outfalls. The initial Delineated Sand Resource comprises 15.0 Mm3
of surface marine sand predominantly in the flood tide fades. A Sand Reserve of8.0 Mm3 is available when worked by a trailer dredger and up to 14.1 Mm3 ifworked by grab.
Removal of the outfall constraints gives access to an additional Delineated SandResource of 8.7 Mm3 wholly in the ebb tide fades. A Sand Reserve of 6.2 Mm3 isavailable when worked by a trailer dredger and up to 8.6 Mm3 if worked by grab.
There is no Overburden present within the delineated area and backfilling of theworked out area is not recommended.
The dredging assessment for these proven Sand Resources and the constraints affordedby the Tathong Channel TSS and the sewage outfalls gives rise to the followingadditional recommendations and conclusions:
• Dredging economics and existing maritime operational constraints imposedby the TSS favour the use of trailer hopper suction dredgers (trailers).Dredging would need to be undertaken in loops within the delineated areafollowing the designated direction of traffic flow.
• A single 5,000 m3 trailer dredger serving a 15 km distant receiver site canbe expected to yield up to 172,500 m3 and 131JSOO m3 Fill in place perweek when working the northern and southern resources respectively.
• In both cases the marine sand resources are fine and overflow losses of upto 26% and 48% of the dry weight of the Sand Resource can be expectedwhen using a 5,000 m3 trailer dredger. The environmental consequencesof the release of these inert solids from a single trailer operation are judgedto be "medium".
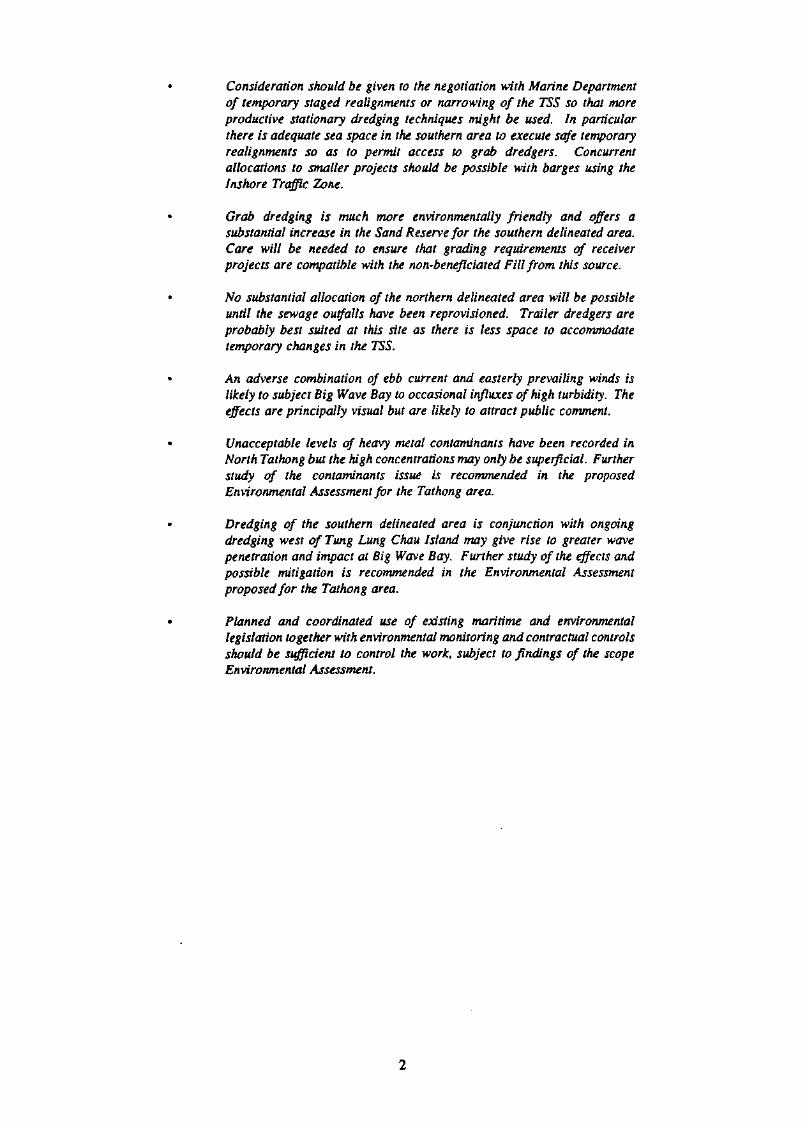
Consideration should be given to the negotiation with Marine Departmentof temporary staged realignments or narrowing of the TSS so that moreproductive stationary dredging techniques might be used. In particularthere is adequate sea space in the southern area to execute safe temporaryrealignments so as to permit access to grab dredgers. Concurrentallocations to smaller projects should be possible with barges using theInshore Traffic Zone.
Grab dredging is much more environmentally friendly and offers asubstantial increase in the Sand Reserve for the southern delineated area.Care will be needed to ensure that grading requirements of receiverprojects are compatible with the non-beneflciated Fill from this source.
No substantial allocation of the northern delineated area will be possibleuntil the sewage outfalls have been reprovisioned. Trailer dredgers areprobably best suited at this site as there is less space to accommodatetemporary changes in the TSS.
An adverse combination of ebb current and easterly prevailing winds islikely to subject Big Wave Bay to occasional influxes of high turbidity. Theeffects are principally visual but are likely to attract public comment.
Unacceptable levels of heavy metal contaminants have been recorded inNorth Tathong but the high concentrations may only be superficial. Furtherstudy of the contaminants issue is recommended in the proposedEnvironmental Assessment for the Tathong area.
Dredging of the southern delineated area is conjunction with ongoingdredging west of Tung Lung Chau Island may give rise to greater wavepenetration and impact at Big Wave Bay. Further study of the effects andpossible mitigation is recommended in the Environmental Assessmentproposed for the Tathong area.
Planned and coordinated use of existing maritime and environmentallegislation together with environmental monitoring and contractual controlsshould be sufficient to control the work, subject to findings of the scopeEnvironmental Assessment.
FILL MANAGEMENT STUDY - PHASE II
NORTH TATHONGBORROW AREA ASSESSMENT REPORT
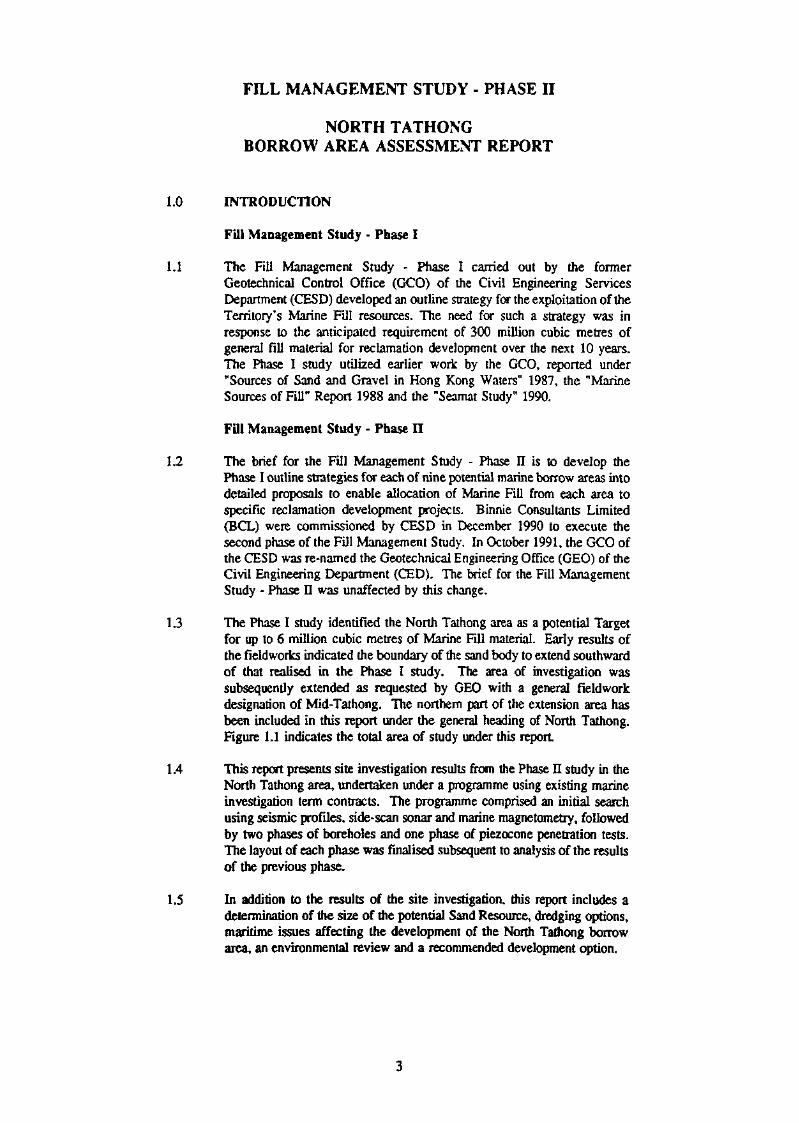
1.0 INTRODUCTION
Fill Management Study * Phase I
1.1 The Fill Management Study - Phase I carried out by the formerGeotechnical Control Office (GCO) of the Civil Engineering ServicesDepartment (CESD) developed an outline strategy for the exploitation of theTerritory's Marine Fill resources. The need for such a strategy was inresponse to the anticipated requirement of 300 million cubic metres ofgeneral fill material for reclamation development over the next 10 years.The Phase I study utilized earlier work by the GCO, reported under"Sources of Sand and Gravel in Hong Kong Waters" 1987, the "MarineSources of Fill" Report 1988 and the "Seamat Study" 1990.
FU1 Management Study - Phase II
1.2 The brief for the Fill Management Study - Phase II is to develop thePhase I outline strategies for each of nine potential marine borrow areas intodetailed proposals to enable allocation of Marine Fill from each area tospecific reclamation development projects. Binnie Consultants Limited(BCL) were commissioned by CESD in December 1990 to execute thesecond phase of the Fill Management Study. In October 1991, the GCO ofthe CESD was re-named the Geotechnical Engineering Office (GEO) of theCivil Engineering Department (CED). The brief for the Fill ManagementStudy - Phase II was unaffected by this change.
1.3 The Phase I study identified the North Taihong area as a potential Targetfor up to 6 million cubic metres of Marine Fill material. Early results ofthe fieldworks indicated the boundary of the sand body to extend southwardof that realised in the Phase I study. The area of investigation wassubsequently extended as requested by GEO with a general fieldworkdesignation of Mid-Tathong. The northern part of the extension area hasbeen included in this report under the general heading of North Tathong.Figure 1.1 indicates the total area of study under this report
1.4 This report presents site investigation results from the Phase II study in theNorth Tathong area, undertaken under a programme using existing marineinvestigation term contracts. The programme comprised an initial searchusing seismic profiles, side-scan sonar and marine magnetometry, followedby two phases of boreholes and one phase of piezocone penetration tests.The layout of each phase was finalised subsequent to analysis of the resultsof the previous phase.
1.5 In addition to the results of the site investigation, this report includes adetermination of the size of the potential Sand Resource, dredging options,maritime issues affecting the development of the North Tathong borrowarea, an environmental review and a recommended development option.
People* Republic of China
^>Siu A Chou
C^-To. A Cnau
NORTHTATHONGCHANNEL
FELL MANAGEMENT STUDY - PHASE flINVESTIGATION AND DEVELOPMENTOF MARINE BORROW AREAS
North Tathong Channel
Location Map
0603/NTG/5005 1:500000
(BGEOTECHHICAL ENGINEERING OFFICE
CIVIL ENGWEERINC DEPART1IENTHONG KONG GOVERNMENT
BINNffi CONSULTANTS LIMITEDIMITED tap
H! 2
Choi Wan
N 814000
FMS-II SiteInvestigation
Program
Scale 1:50000
Seismic Line
N 813000
4- Borehole Location
T CPT Location
o Vibrocore Location(Seamat)
N 812001
FIGURE 1.1 NORTH TATHONG - LOCATION MAP
Definitions
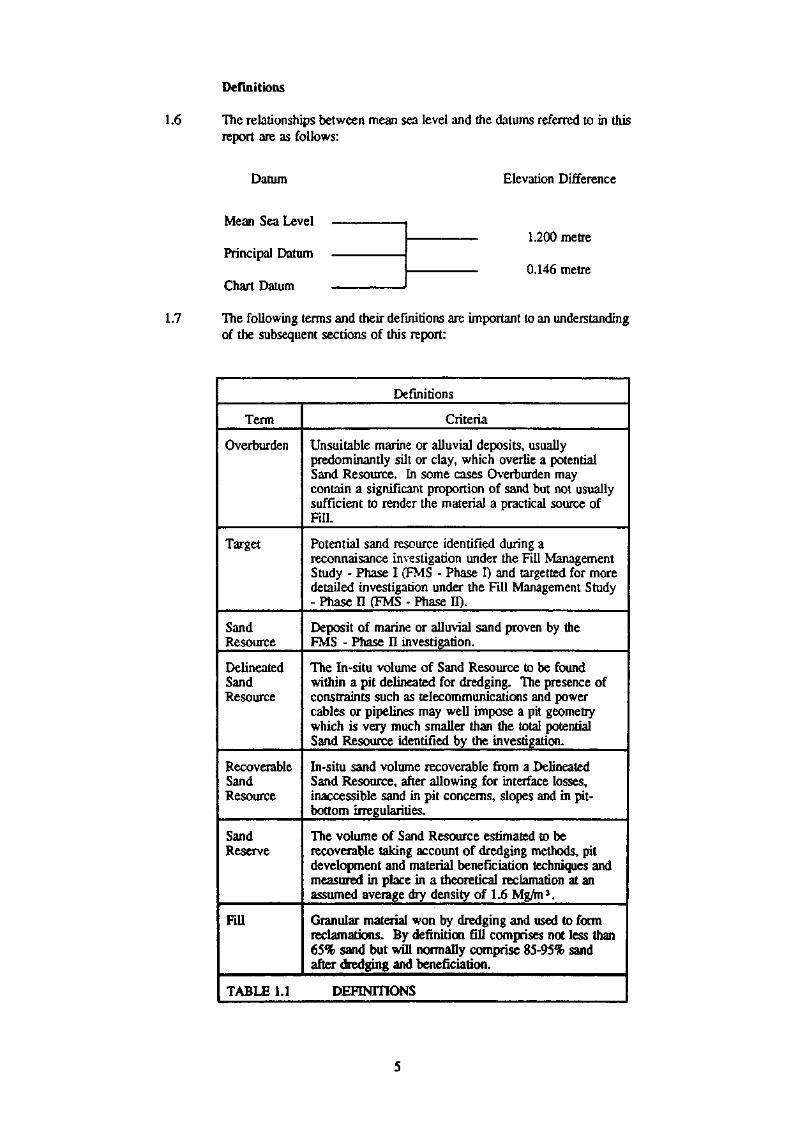
1.6 The relationships between mean sea level and the datums referred to in thisreport are as follows:
Datum Elevation Difference
Mean Sea Level
Principal Datum
Chart Datum
1.200 metre
0.146 metre
1.7 The following terms and their definitions are important to an understandingof the subsequent sections of this report:
Definitions
Term
Overburden
Target
SandResource
DelineatedSandResource
RecoverableSandResource
SandReserve
Fill
Criteria
Unsuitable marine or alluvial deposits, usuallypredominantly silt or clay, which overlie a potentialSand Resource. In some cases Overburden maycontain a significant proportion of sand but not usuallysufficient to render the material a practical source ofFill.
Potential sand resource identified during areconnaisance investigation under the Fill ManagementStudy - Phase I (FMS - Phase I) and targetted for moredetailed investigation under the Fill Management Study- Phase H (FMS - Phase II).
Deposit of marine or alluvial sand proven by theFMS - Phase II investigation.
The In-situ volume of Sand Resource to be foundwithin a pit delineated for dredging. The presence ofconstraints such as telecommunications and powercables or pipelines may well impose a pit geometrywhich is very much smaller than the total potentialSand Resource identified by the investigation.
In-situ sand volume recoverable from a DelineatedSand Resource, after allowing for interface losses,inaccessible sand in pit concerns, slopes and in pit-bottom irregularities.
The volume of Sand Resource estimated to berecoverable taking account of dredging methods, pitdevelopment and material beneficiation techniques andmeasured in place in a theoretical reclamation at anassumed average dry density of L6 Mg/m3 .
Granular material won by dredging and used to formreclamations. By definition fill comprises not less than65% sand but will normally comprise 85-95% sandafter dredging and beneficiation.
TABLE 1.1 DEFINITIONS
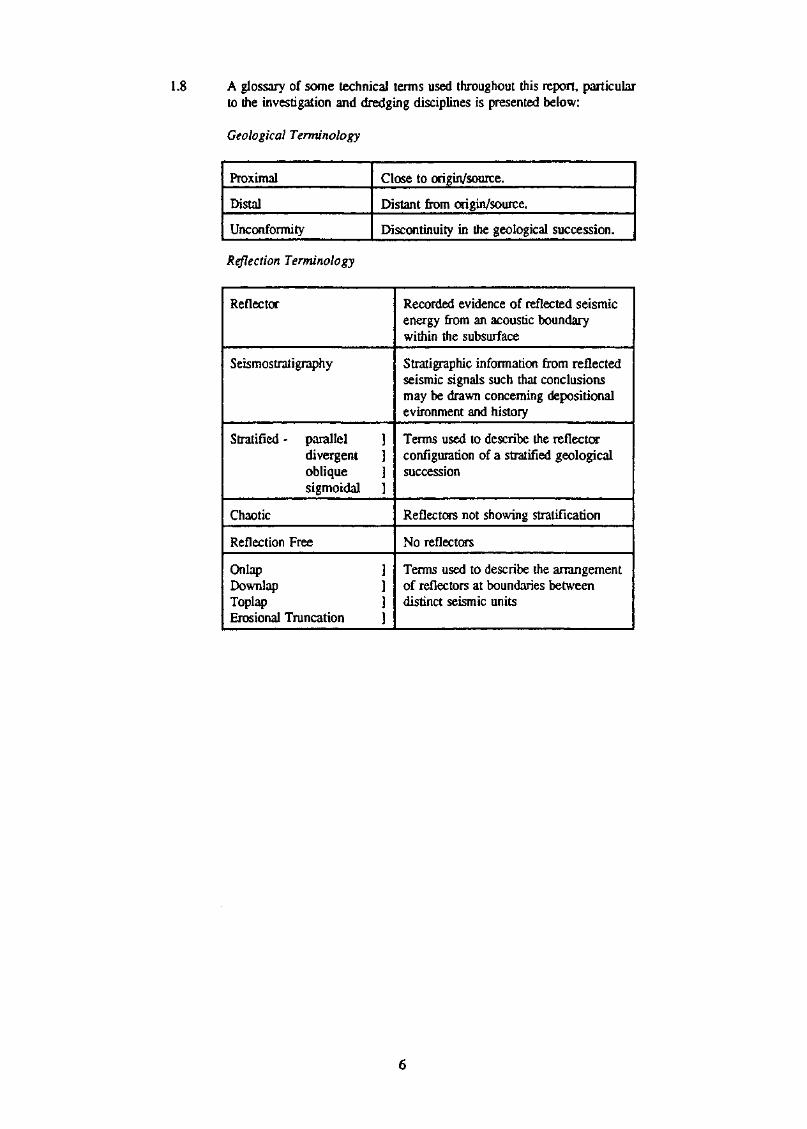
1.8 A glossary of some technical terms used throughout this report, particularto the investigation and dredging disciplines is presented below:
Geological Terminology
Proximal
Distal
Unconformity
Close to origin/source.
Distant from origin/source.
Discontinuity in the geological succession.
Reflection Terminology
Reflector
Seismostratigraphy
Stratified - parallel ]divergent ]oblique ]sigmoidal ]
Chaotic
Reflection Free
Onlap ]Downlap ]Toplap ]Erosional Truncation ]
Recorded evidence of reflected seismicenergy from an acoustic boundarywithin the subsurface
Stratigraphic information from reflectedseismic signals such that conclusionsmay be drawn concerning depositionalevironment and history
Terms used to describe the reflectorconfiguration of a stratified geologicalsuccession
Reflectors not showing stratification
No reflectors
Terms used to describe the arrangementof reflectors at boundaries betweendistinct seismic units
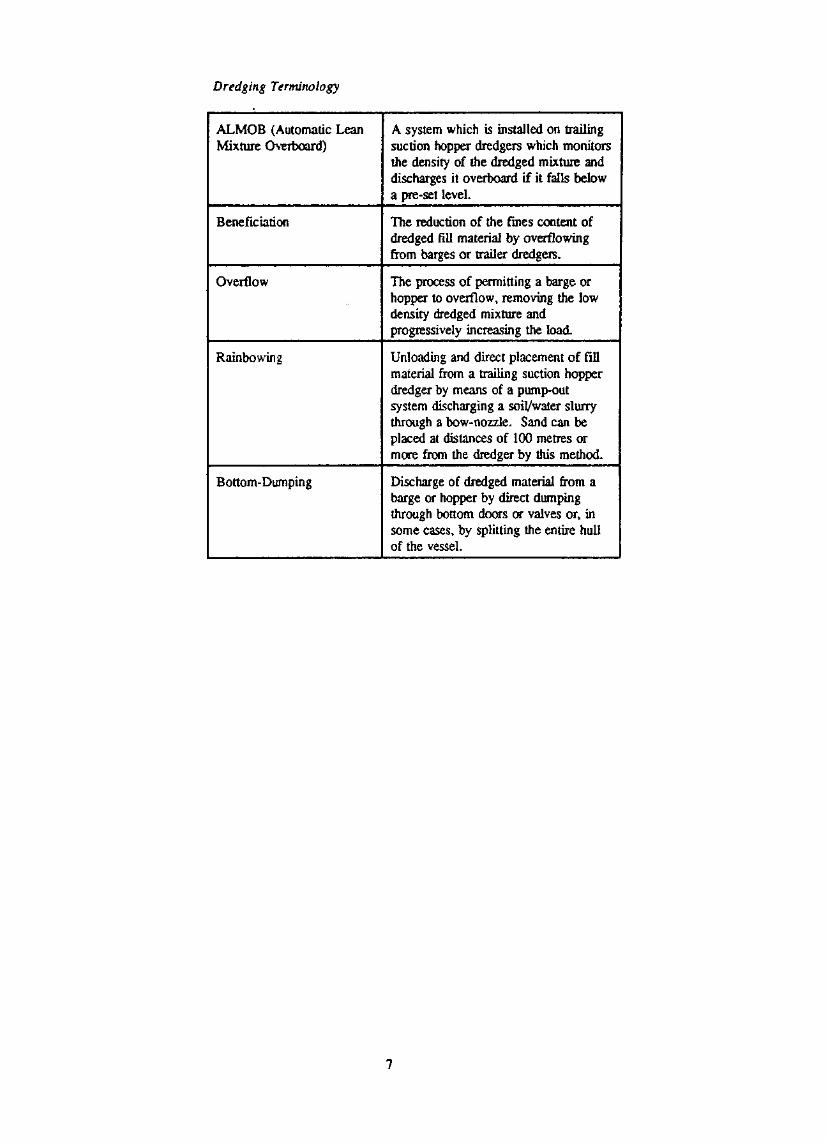
Dredging Terminology
ALMOB (Automatic LeanMixture Overboard)
A system which is installed on trailingsuction hopper dredgers which monitorsthe density of the dredged mixture anddischarges it overboard if it falls belowa pre-set level.
Beneficiation The reduction of the fines content ofdredged fill material by overflowingfrom barges or trailer dredgers.
Overflow The process of permitting a barge orhopper to overflow, removing the lowdensity dredged mixture andprogressively increasing the load.
Rainbowins Unloading and direct placement of fillmaterial from a trailing suction hopperdredger by means of a pump-outsystem discharging a soil/water slurrythrough a bow-nozzle. Sand can beplaced at distances of 100 metres ormore from the dredger by this method.
Bottom-Dumping Discharge of dredged material from abarge or hopper by direct dumpingthrough bottom doors or valves or, insome cases, by splitting the entire hullof the vessel.
2.0 SITE CHARACTERISTICS
General
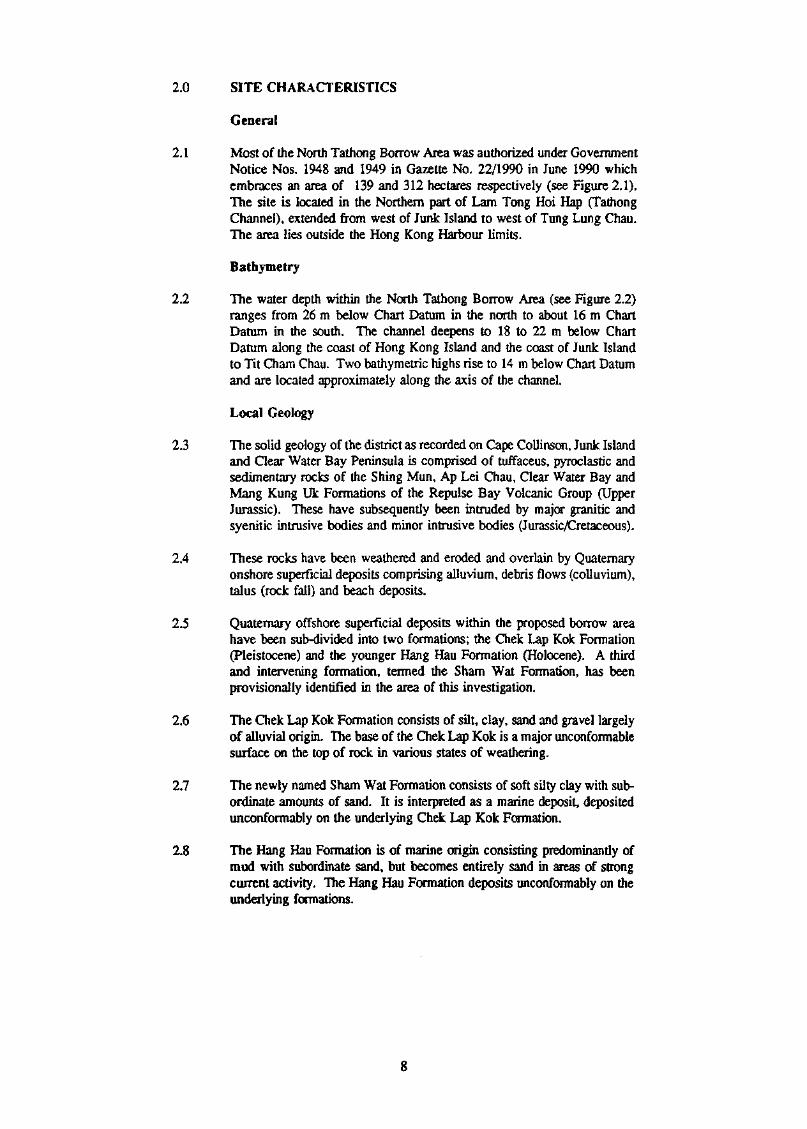
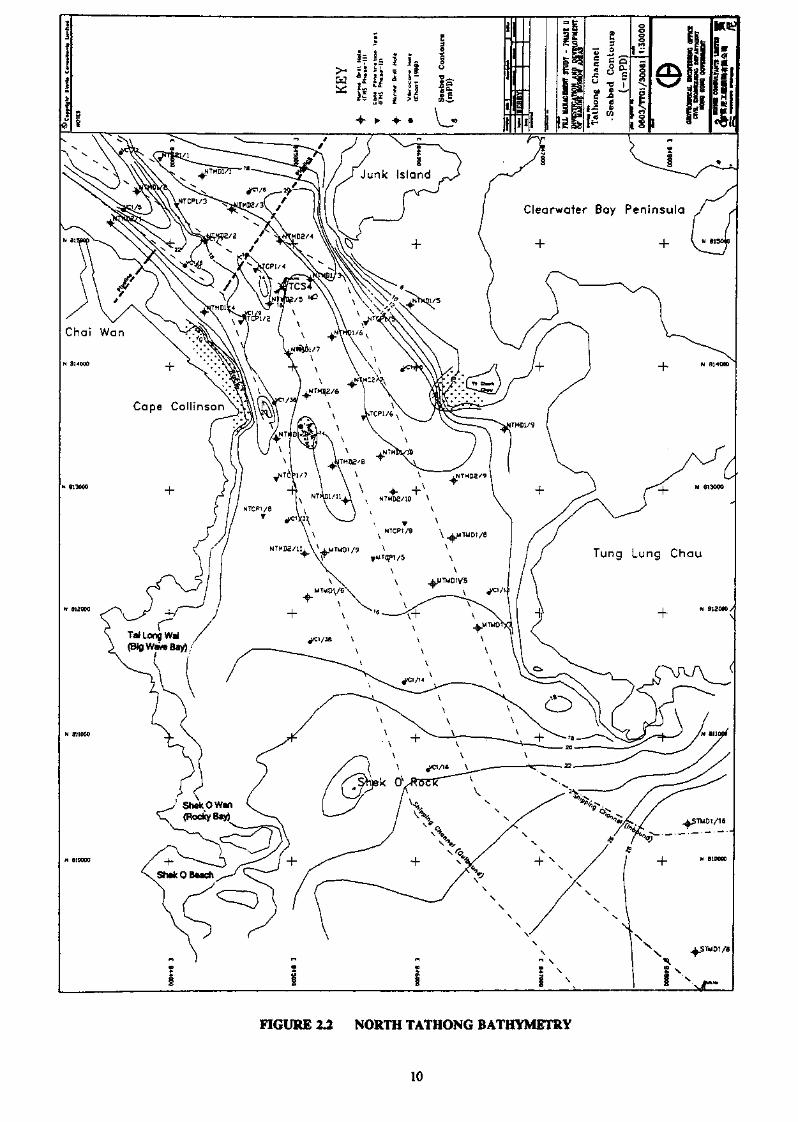
2.1 Most of the North Tathong Borrow Area was authorized under GovernmentNotice Nos. 1948 and 1949 in Gazette No. 22/1990 in June 1990 whichembraces an area of 139 and 312 hectares respectively (see Figure 2.1).The site is located in the Northern part of Lam Tong Hoi Hap (TathongChannel), extended from west of Junk Island to west of Tung Lung Chau.The area lies outside the Hong Kong Harbour limits,
Bathymetry
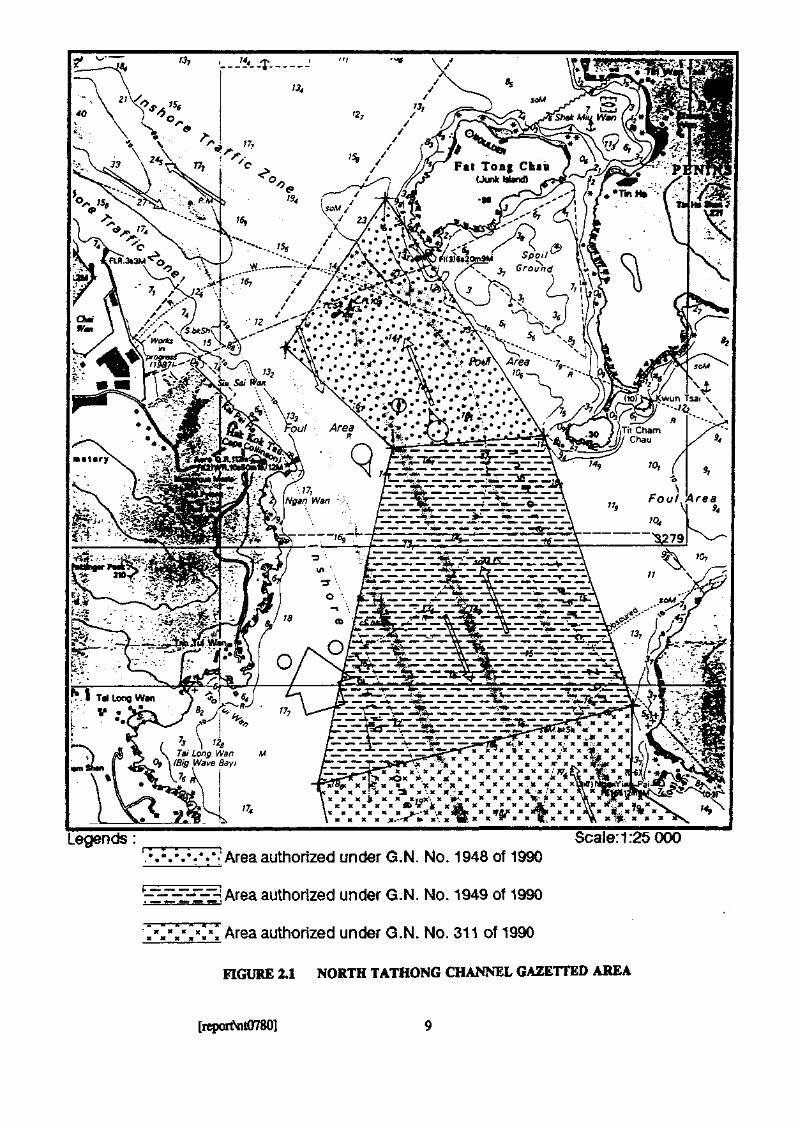
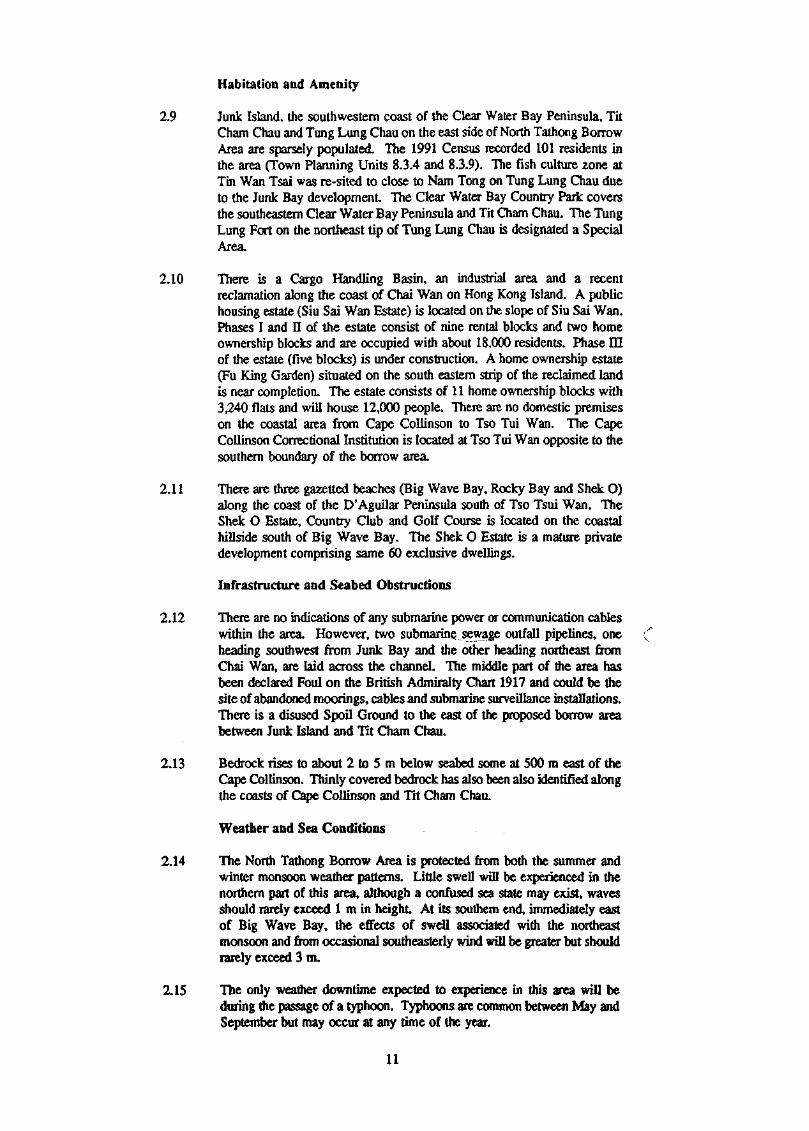
2.2 The water depth within the North Tathong Borrow Area (see Figure 2.2)ranges from 26 m below Chart Datum in the north to about 16 m ChartDatum in the south. The channel deepens to 18 to 22 m below ChartDatum along the coast of Hong Kong Island and the coast of Junk Islandto Tit Cham Chau. Two bathymetric highs rise to 14 m below Chart Datumand are located approximately along the axis of the channel.
Local Geology
2.3 The solid geology of the district as recorded on Cape Collinson, Junk Islandand Clear Water Bay Peninsula is comprised of tuffaceus, pyroclastic andsedimentary rocks of the Shing Mun, Ap Lei Chau, Clear Water Bay andMang Kung Uk Formations of the Repulse Bay Volcanic Group (UpperJurassic). These have subsequently been intruded by major granitic andsyenitic intrusive bodies and minor intrusive bodies (Jurassic/Cretaceous).
2.4 These rocks have been weathered and eroded and overlain by Quaternaryonshore superficial deposits comprising alluvium, debris flows (colluvium),talus (rock fall) and beach deposits.
2.5 Quaternary offshore superficial deposits within the proposed borrow areahave been sub-divided into two formations; the Chek Lap Kok Formation(Pleistocene) and the younger Hang Hau Formation (Holocene). A thirdand intervening formation, termed the Sham Wat Formation, has beenprovisionally identified in the area of this investigation.
2.6 The Chek Lap Kok Formation consists of silt, clay, sand and gravel largelyof alluvial origin. The base of the Chek Lap Kok is a major unconformablesurface on the top of rock in various states of weathering.
2.7 The newly named Sham Wat Formation consists of soft silty clay with sub-ordinate amounts of sand. It is interpreted as a marine deposit, depositedunconformably on the underlying Chek Lap Kok Formation.
2.8 The Hang Hau Formation is of marine origin consisting predominantly ofmud with subordinate sand, but becomes entirely sand in areas of strongcurrent activity. The Hang Hau Formation deposits unconformably on theunderlying formations.
T^ Long Wan
V •
Wan MOy } {Big Wave Bay)
Scale: 1:25 000'•Area authorized under G.N. No. 1948 of 1990
l"-r:£HHH?l Area authorized under G.N. No. 1949 of 1990
Area authorized under G.N. No. 311 of 1990
FIGURE 2.1 NORTH TATHONG CHANNEL GAZETTED AREA
[reporlNnt0780]
Cleorwaier Bay Peninsula
FIGURE 2J NORTH TATHONG BATHYMETRY
10
Habitation and Amenity
2.9 Junk Island, the southwestern coast of the Clear Water Bay Peninsula, TitCham Chau and Tung Lung Chau on the east side of North Tathong BorrowArea are sparsely populated. The 1991 Census recorded 101 residents inthe area (Town Planning Units 83.4 and 8.3.9). The fish culture zone atTin Wan Tsai was re-sited to close to Nam Tong on Tung Lung Chau dueto the Junk Bay development The Clear Water Bay Country Paric coversthe southeastern Clear Water Bay Peninsula and Tit Cham Chau. The TungLung Fort on the northeast tip of Tung Lung Chau is designated a SpecialArea,
2.10 There is a Cargo Handling Basin, an industrial area and a recentreclamation along the coast of Chai Wan on Hong Kong Island. A publichousing estate (Siu Sai Wan Estate) is located on the slope of Siu Sai Wan.Biases I and n of the estate consist of nine rental blocks and two homeownership blocks and are occupied with about 18,000 residents. Phase IEof the estate (five blocks) is under construction. A home ownership estate(Fu King Garden) situated on the south eastern strip of the reclaimed landis near completion. The estate consists of 11 home ownership blocks with3,240 flats and will house 12,000 people. There are no domestic premiseson the coastal area from Cape Collinson to Tso Tui Wan. The CapeCollinson Correctional Institution is located at Tso Tui Wan opposite to thesouthern boundary of the borrow area.
2.11 There are three gazetted beaches (Big Wave Bay, Rocky Bay and Shek O)along the coast of the D'Aguilar Peninsula south of Tso Tsui Wan. TheShek O Estate, Country Club and Golf Course is located on the coastalhillside south of Big Wave Bay. The Shek O Estate is a mature privatedevelopment comprising same 60 exclusive dwellings.
Infrastructure and Seabed Obstructions
2.12 There are no indications of any submarine power or communication cableswithin the area However, two submarine sewage outfall pipelines, oneheading southwest from Junk Bay and the other heading northeast fromChai Wan, are laid across the channel. The middle part of the area hasbeen declared Foul on the British Admiralty Chart 1917 and could be thesite of abandoned moorings, cables and submarine surveillance installations.There is a disused Spoil Ground to the east of the proposed borrow areabetween Junk Island and Tit Cham Chau.
2.13 Bedrock rises to about 2 to 5 m below seabed some at 500 m east of theCape Collinson. Thinly covered bedrock has also been also identified alongthe coasts of Cape Collinson and Tit Cham Chau.
Weather and Sea Conditions
2.14 The North Tathong Borrow Area is protected from both the summer andwinter monsoon weather patterns. Little swell will be experienced in thenorthern part of this area, although a confused sea state may exist, wavesshould rarely exceed 1 m in height At its southern end, immediately eastof Big Wave Bay, the effects of swell associated with the northeastmonsoon and from occasional southeasterly wind will be greater but shouldrarely exceed 3 m.
2.15 The only weather downtime expected to experience in this area will beduring the passage of a typhoon. Typhoons are common between May andSeptember but may occur at any time of the year.
11
Tides, Tidal Streams and Currents
2.16 The North Tathong Borrow Area experiences a flood tide heading northwestand a ebb tide flowing southeast. The range varies from 2.62 m at highwater springs and 1.46 m at high water neaps. The diurnal pattern for thisarea is similar to that predicted at Quarry Bay (see Hong Kong TideTables).
2.17 As recorded in the Admiralty Tidal Stream Altas NP217, the rates of tidalcurrent rarely exceed 1.6 knots at spring tides but may increase slightlyclose to Lei Yue Mun. The residual flows in Tathong Channel on springand neap tides are both heading northwest and at the rate of less than 0.1knots.
Shipping Movements
2.18 The North Tathong Borrow Area embraces the northern end of the SouthEastern Approach Channel to Hong Kong which is used by smaller bulkcarriers, multi purpose semicontainer vessels, traditional cargo vessels andlocal coastal craft
2.19 It has been estimated that over recent years up to 15% of the vesselsentering and departing the Port of Hong Kong did so via Tathong ChannelBased on the 1990 statistics (Statistic Tables, Marine Department 1990) itis estimated that 5,700 ocean-going vessels and 28300 coastal vesselstransit the channel during the year. The total number and the overallproportion of vessels using the Tathong Channel is expected to increasesignificantly in the short term. The continuing Port expansion, increasingcongestion in the East Lamma Channel and multiple movements of largedredgers serving concurrent reclamation projects will all contributed to thisexpected increase.
2.20 According to the statistics by the Agricultural and fisheries Department in1991, about 16% (738) of the fishing vessels in Hong Kong are stationedin the Shaukeiwan and Chaiwan, Most of these vessels are expected totransit the borrow area on trips to and from the fishing grounds. The scenicbeaches and islands around the Sai Kung peninsula attract a large numberof pleasure vessels during summer weekends and holidays which will alsotransit the borrow area. There are no statistics on these transits but thefrequency can be considerable.
Traffic Separation Scheme (TSS)
2.21 The proposed borrow area straddles the northern portion of the TathongChannel TSS and the associated narrow Inshore Traffic Zones on either sideof the TSS. This section of TSS is about 1,000 m wide where it enters theproposed borrow area from the south and reduces to 450 m after changingdirection opposite to Siu Sai Wan on Hong Kong Island. There are nophysically defined boundaries to mark the outer edge of the scheme.However, the centre is maiked by mid channel buoys at either end andwhere alteration of course is required. The TSS is recognised and operatedunder International Maritime Organisation (IMO) rules.
12
Vessel Traffic Centre (VTC)
2.22 The proposed borrow area lies across the watched channel and vesselstransiting the area will be under constant radar surveillance from the VTC.All dredging, associated operations and traffic movements in or near thearea can be monitored and necessary advice and instructions given. Allocean-going vessels of 300 gross registered tonnage and above are requiredto carry VHP radio and should maintain a continuous listening watch on thedesignated VHP channels. Surveillance by the VTC in no way relievesMasters of dredging vessels of their obligations.
Pilotage
2.23 The whole of Hong Kong waters is a pilotage area. At present all ships of5,000 gross registered tonnage (CRT) and above, or ships of 300 GRT andabove which are unable to proceed under their own power, are required totake a pilot while navigating within the pilotage area, unless they areexempted by the Director of Marine. A pilot boarding station is located inthe centre of the proposed borrow area, some 800 m south of the JunkIsland light Vessels on inbound or outbound voyages may proceed directlyto or from the pilot boarding station through Hong Kong waters without apilot on board provided that notification to the VTC has been given.
Navigational Marks
2.24 The area contains a mid-channel buoy (TCS4) at the change of course ofthe TSS, located south southwest of the Junk Island Light The buoy islikely to present a local temporary constraint on to exploitation of theproposed borrow pit
Anchoring
2.25 Most of the proposed borrow area lies in the TSS where anchoring isprohibited except in an emergency. There is a Dangerous Goods Anchorageat the entrance to Junk Bay. It is considered unlikely that vessels woulddrag their anchors from the Dangerous Goods Anchorage into the borrowarea, because of the protected nature of this area from the prevailingweather pattern.
13
3.0 SITE INVESTIGATIONS
Previous Investigations
3.1 Previous field investigation of this area was limited to nine vibrocores and5 seismic lines carried out in early 1989 under the Marine Sources of FillStudy and previous GCO study. This work identified the area as a Targetfor Sand Fill, with a potential Sand Resource of up to 6 million cubicmetres.
3.2 The Target identified from the Marine Sources of Fill Study and FillManagement Phase I study included a surface sand encountered invibrocores VC1/1 and VC1/9 and there were also deeper alluvial sandsintersected in vibrocores VC1/4, VC1/8 and VC1/10 which provided asecondary target for the investigation.
Rationale for Investigation Design
3.3 The Fill Management Phase II site investigation programme used acombination of seismic profiling, continuously sampled boreholes andpiezocone penetration testing in a phased sequence. The fieldworfcprogramme was devised to maintain a flexible approach throughout theexploration, reviewing the results of each phase, before finalizing the layoutof any subsequent phase so that the investigation was continually re-directedas results were obtained. The objective was to locate and prove suitabledeposits of sand and produce a comprehensive database of information fromwhich an assessment of Fill quality and volume could be made.
Investigation Development
3.4 The results of the initial phase of 11 boreholes were evaluated andcorrelated with the earlier seismic work and used to design a second phaseof 11 boreholes. The subsequent phase of 9 piezocone penetration tests(CPT) were used to augment the borehole and seismic data. The area ofstudy for North Tathong was extended southward to include an additionalgeophysics survey, 5 boreholes and 1 CPT originally assigned for Mid-Tathong.
Investigation Summary
3.5 The completed investigation comprised 26 kilometres of seismic boomerand side scan sonar and bathymetric survey lines, 27 boreholes and10 CPTs, This produced a seismic grid with 250 metre line spacing and acombined borehole and CPT programme with a station density of one per17 hectares.
Geophysical Investigations
3.6 The initial geophysical programme was conducted between 5th and 16thApril 1991, using the Geophysical Survey Tenn Contract No. GC/89/01 andWorks Order No. PW 7/2/(25.41A and 25.41D). Additional data wasacquired between the llth and 13th October 1991 under the GeophysicalSurvey Term Contract No. GC/91/01 and Works Order No. PW 7/2/31.7A.
14
Equipment
3.7 The geophysical investigation used the following equipment:
The Electronic & Geophysical Services (EGS) seismicprofiling system
EGS high resolution boomerEGS hydrophoneEG&G seismic power packEPC recorderEGS signal processor, TVF and swell filter
Raytheon hull mounted echo sounder
The EGS echo sounder digitizer (built into an IBM PC)
Seba recording tide gauges
Del Norte Trisponder 562 positioning system (employing6 shore stations)
The EGS computerized navigation system (IBM PC, printer,plotter, record annotator, interfacing and in-house software)
Generators, spares
Class IV commercially licensed survey vessel
Survey Coverage
3.8 Existing seismic data (excluding utilities surveys) comprised approximately20 km in the vicinity of the proposed borrow area. This data had beenacquired on a regular but open grid.
3.9 A total of 22 km of new data was acquired to provide infilling survey linesto the existing grid. This gives a survey line spacing of approximately250 m over the proposed borrow area.
Geophysical Records
3.10 A summary of the geophysical survey results can be found in Section 5 ofthis report and the cross sections presented in Appendix n includeinterpreted data from the geophysical sections. A complete interpretation ofgeophysical data is included in the Contractor's final report.
Utility Search and Location Using Geophysics
3.11 Two sewage pipelines and a Foul Ground probably comprising oldmoorings cables and military surveillance equipment are known to existwithin the proposed North Tathong borrow area (see Section 2.10).Confirmation of the location of these utilities was sought using the seismicsub-bottom profiling technique only.
Survey
3.12 A number of short seismic lines were run perpendicular to and crossing theapproximately known utility position. The density of coverage wasincreased to locate the termination points of the utilities.
15
Results of Geophysical Utilities Search and Location
3.13 Detailed results can be obtained from the Contractor's report. Thetechnique proved successful in determining the location of the twosubmarine sewage outfalls.
Borehole Investigations
3.14 The phases 1 and 2 borehole programme for North Tathong was conductedbetween 26th September and 15th October 1991 using a SupplementaryAgreement to the Marine Site Investigation Term Contract No. GC/89/05under Worts Order No. PW 7/2/29.69F. The Mid-Tathong boreholeprogramme was conducted between 28th October and 12th November 1991under Works Order No. PW 7/2/29.69K. Full time supervision on eachbarge was provided by geotechnical engineers supplied by the FillManagement Study Team.
Equipment
3.15 Two barges "Gammon-17" and "Gammon-18" were deployed for theboreholes in North Tathong and another two barges "Charlotte" and"Gammon-19" were deployed for the five boreholes in Mid-Tathong."Gammon-17, -18 and -19" are purpose built drilling barges with a centremoon pool and a 12 m x 30 tonne drilling tower. The "Charlotte" is a 45m flat top barge with centre moon pool and drilling tower. A cable toolboring technique was used with continuous sampling. Casing was flushjointed of either 250 mm or 200 mm diameter. A 200 mm or 150 mmbailer was used to recover the soil from which bulk samples were taken.
3.16 Investigation stations were positioned using a trisponder and 3 shore stationssupplied by EGS, with accuracy to within 5 metres horizontally.
Sampling
3.17 The cable tool boring technique with continuous sampling was employed inall holes, A two metre repeated sample cycle as shown in Figure 3.1 wasused. Bulk samples were stored in sealed plastic buckets.
3.18 Borehole samples were examined and logged on site. From thisexamination preliminary logs were prepared and used for geologicalinterpretation. On receipt of laboratory test results the preliminary logswere checked and corrected where required and the final logs prepared.Standards for sample description were in accordance with the GeotechnicalControl Office's GEOGUIDE 3.
16

Sampling SequenceDepth (m)
0.0
0.15
1.0
1.45
2.0
Sample Type
1. U100
2. Bulk Sample
3. SPT
4. Bulk Sample
Sample size and Information
blow count + 100mm diameterundisturbed sample + {ar sample
10—15Kg disturbed sample•f- {ar sample
"N" Value + {ar sample
10-15Kg disturbed sample+ Jar sample
FIGURE 3.1 BOREHOLE SAMPLING
3.19
3.20
3.21
3.22
3.23
Borehole Density and Objectives
In North Tathong the average borehole density achieved was one boreholeper 24 hectares.
The aim of the borehole programme was to define the lateral extent andquality of surface marine sands. The prospect of deeper sands that couldbe used as fill material was, however, kept in view. Borehole depths inmost cases were about -40 mPD to -50 mPD, one went to -65 mPD.
The main information expected from the borehole programme includeddetailed descriptions and laboratory test data for determining soil quality,fill definition and dredging attributes. The programme provided vertical andlateral lithological boundary information for the interpretation of seismicdata and Fill volume calculation. Soil strength information was obtainedfrom SPT, CPT and vane tests.
Borehole Records
A summary of the borehole results can be found in Section 4 of this reportwith selected borehole records presented on cross sections in Appendix ELA complete set of borehole records is included in the Contractor's finalreport
Piezocone Penetration Testing (CPT)
The piezocone penetration testing programme was conducted between 21stand 31st October 1991, and was carried out under a SupplementaryAgreement to Contract No. GC 89/05. Full time supervision was providedby geotechnical engineers from the Fill Management Study Team.
17
Equipment
3.24 A Fugro-McClelland Wheeldrive Seacalf unit was used for the piezoconepenetration testing programme. This is a ballasted seabed unit withpenetration force provided by an electric wheeldrive system acting on thetest rods. The seabed unit was lowered from a conventional drilling bargewith an end mounted drilling tower. An electrically monitored piezoconepenetrometer tip was used to give continuous tip resistance, sleeve frictionand pore pressure measurements. A 7.5 tonne cone was used and the unitballasted to provide a maximum 20 tonne reaction force if required Datadisplay included tip resistance, effective (normalised) tip resistance, sleevefriction, sleeve/tip friction ratio, pone pressure and pore pressure/tipresistance ratio. Investigation stations were positioned using a trisponder and3 shore stations supplied by EGS, with accuracy to within 5 metreshorizontally.
CPT Density and Aim of Programme
3.25 The main aim of the piezocone penetration tests was to provide acontinuous record of the soil profile to improve correlation with seismicsections and to provide a final phase of infill stations for correlation withthe borehole programme. A target depth in the region of -55 mPD to -65mPD was used. The resulting station density was one CPT per 58 hectaresover the area of interest.
Piezocone Penetration Test Records
3.26 A summary of the piezocone penetration test results can be found inSection 4 of this report with selected records presented on cross sections inAppendix EL A complete set of piezocone penetration test data with aninterpretation is included in the Contractor's final report.
Laboratory Testing
3.27 All samples with significant sand content as well as a representative groupof sandy silt and clay samples were sent for laboratory testing. In generala U100 sample was used for testing with the equivalent bulk sampleperiodically sent as a check. Bulk samples were repeatedly quartered on atray until a suitable sample size was reached. The U100 samples thesample were extruded, split in half and one half split again with theresulting quarter used for testing.
3.28 Wet sieving of sand samples and hydrometer analysis of fine samples wascarried out with shell carbonate content analysis undertaken for shellymarine samples. A set of Atterberg limits, moisture content, bulk density,specific gravity, organic content, sulphate, pH and soil compaction test werealso taken on selected samples. All laboratory testing was conductedaccording to BS 1377 in an approved laboratory under a SupplementaryAgreement to Contract No. GC 89AM Laboratory Testing - Urban Areas(Term Contract) under Works Older Nos. PW (5/3/26.107 andPW 6/3/26.109.
3.29 A summary of laboratory test results can be found in Section 4 of thisReport with several composite PSD curves presented A complete set oflaboratory test data can be found in the Contractor's final report.
18
4. REVIEW OF RESULTS
Geophysics
4.1 The first phase of seismic sub-bottom profiling survey resulted in 16.4 kmof newly acquired data, combined with 7.4 km of existing data to providea total of 23.8 km of data for interpretation. A further 19.9 km of newlyacquired data and 5.95 km of reinterpretation of existing data was orderedwhen the decision was taken to extend the investigation into Mid-Tathong.
Record Quality
4.2 The quality of the first set newly acquired data is good with a minimalexternal noise component. Strong multiple reflectors are present on someprofiles. However in areas of previous dredging activity (inshore to CapeCollinson) distortion to reflector configurations has occurred, and likewiseto localized areas of dumping. The quality of the additional data is not asgood suffering from external noise. The quality of existing seismic data ison the whole good.
Interpretation Criteria
4.3 From the geophysical profiles a number of major surfaces or geologicalinterfaces can be identified. The inteipretational approach adopted is basedon the construction of a 'framework" of these interfaces. The interfacesidentified can be correlated within the area from one geophysical surveyline to another and represent unconformable horizons or a hiatuses withinthe geological record. The interfaces identified are:
N3 - erosion surface within the marine deposits (Hang HauFormation)
N4 - erosion surface within the marine deposits (Hang HauFormation) - Mid and South Tathong only
N5 - erosion surface at top of 'transitional* deposits (Sham WatFormation)
N10 - erosion surface at top of alluvial deposits (Chek Lap KokFormation)
SR - base of superficial deposits/top weathered rock
R3 - interpreted top of grade HI rock
4.4 Using the above major surfaces to provide a structural frainewoik* a moredetailed study was made of the intervening minor reflectors and seismiccharacter to establish the depositional geometry of the sediments formingthe seismostratigraphic units.
19
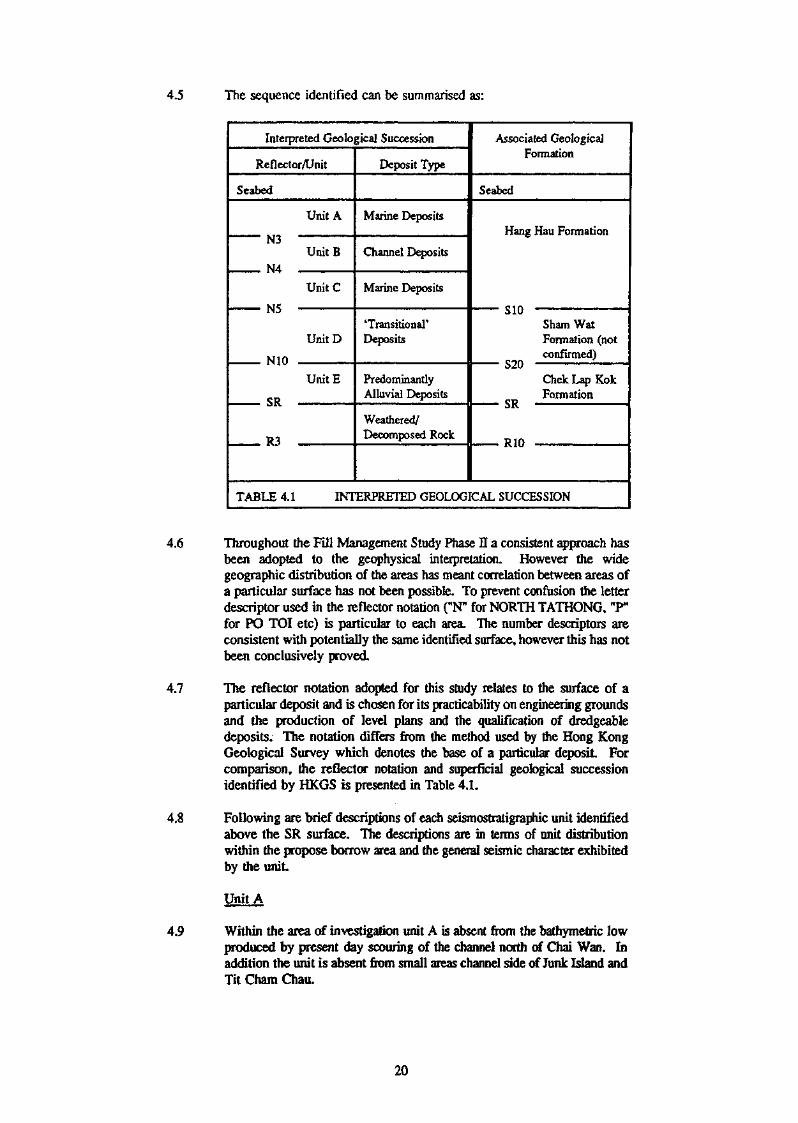
4.5 The sequence identified can be summarised as:
Interpreted Geological Succession
Reflector/Unit
Seabed
Unit A
obUnitB
N4
UnitC,,-,,,,.,,-T, ,_, M*T - inn, i rnrir i
UnitD
M10
UnitE
5R
m
Deposit Type
Marine Deposits
Channel Deposits
Marine Deposits
Transitional*Deposits
PredominantlyAlluvial Deposits
Weathered/Decomposed Rock
Associated GeologicalFormation
Seabed
Hang Hau Formation
Sham WatFormation (notconfirmed)
ChekLapKokFormation
in.nnr-1 £T? 11 '«* . in,,. -
RIO
TABLE 4. 1 INTERPRETED GEOLOGICAL SUCCESSION
4.6 Throughout the Fill Management Study Phase II a consistent approach hasbeen adopted to the geophysical interpretation. However the widegeographic distribution of the areas has meant correlation between areas ofa particular surface has not been possible. To prevent confusion the letterdescriptor used in the reflector notation ("N" for NORTH TATHONG, "P"for PO TOI etc) is particular to each area. The number descriptors areconsistent with potentially the same identified surface, however this has notbeen conclusively proved.
4.7 The reflector notation adopted for this study relates to the surface of aparticular deposit and is chosen for its practicability on engineering groundsand the production of level plans and the qualification of dredgeabledeposits. The notation differs from the method used by the Hong KongGeological Survey which denotes the base of a particular deposit Forcomparison, the reflector notation and superficial geological successionidentified by HKGS is presented in Table 4.1.
4.8 Following are brief descriptions of each seismostratigraphic unit identifiedabove the SR surface. The descriptions are in terms of unit distributionwithin the propose borrow area and the general seismic character exhibitedby the unit
Unit A
4.9 Within the area of investigation unit A is absent from the bathymetric lowproduced by present day scouring of the channel north of Chai Wan. Inaddition the unit is absent from small areas channel side of Junk Island andTit Cham Chau.
20
4.10 The unit reaches a maximum thickness of 20 m in Junk Bay but moregenerally attains a thickness of 6 m. Scouring within the present channelreduces the unit thickness to 2-3 m. Thickening southwards is observed asthe channel centre splits and passes either side of a bathymetric high wherea peak thickness of 12 m is attained A local maximum of 12 m is foundsouth west of Junk Island.
4.11 The seismic character displayed by the unit is one of relatively lowamplitude parallel reflectors passing to an almost reflection free characterin parts. Occasional laterally persistent moderate amplitude reflectors areobserved.
4.12 Where the unit has been disrupted by dredging a higher amplitude chaoticcharacter is found partly as a result of the uneven seabed surface.
4.13 On a bathymetric high south of Junk Island oblique reflectors indicate anapparent north easterly progradation direction.
UnitB
4.14 Within the area of investigation unit B is absent from most of the northernpart of the area. The unit occurs sporadically elsewhere infilling possiblechannel features preserved below the N3 surface.
4.15 Seismically a stratified reflector configuration is exhibited by the unit ofmoderate to high amplitude reflections. Reflectors are observed to onlapthe channel sides and possible consolidation is exhibited.
UnitC
4.16 Unit C is absent from inshore areas near Chai Wan, Cape Collinson, JunkIsland extending southwards, and a more significant area west and south ofTit Cham Chau. Locally the unit is removed by the aforementioned scournorth of Chai Wan and is missing from a rockhead high east of CapeCollinson.
4.17 The unit thickens rapidly from Hong Kong Island outcrop to reach amaximum thickness of 8 m, prior to thinning gently eastwards andsouthwards to attain a general thickness of 3-4 m. Continued thinning toeasterly outcrop is then observed.
4.18 For the most part low to moderate amplitude reflectors describe the internalseismic character to the unit Stratified reflector configurations aredisrupted by probable channel features internal to the unit. Locally complexconfigurations are found associated with probable infilling of a scouradjacent to a rockhead high.
Unit D
4.19 As with previous units, unit D was not identified inshore to Chai Wan andCape Collinson, the southern inshore coiner of Junk Island, and to a greaterextent and extending westwards the inshore area of Tit Cham Chau.
4J20 The unit thickens away from outcrop to reach a maximum thickness of12 m east of Chai Wan and south of Junk Island. Over much of the areaa thickness of 6 m is attained. Between lit Cham Chau and CapeCollinson the unit does not exceed a thickness of approximately 3 m.
21
4.21 The seismic character exhibited by the unit is varied but for the most partis chaotic with reflections of moderate to high amplitude. Oblique andparallel reflection configurations are also observed* the later of whichdisplay possible effects of consolidation over the lower undulating N10surface.
UnitE
422 Unit E is found throughout most of the area investigated and is absent onlyfrom the near shore areas of rock outcrop and the rockhead high east ofCape Collinson.
4.23 The unit thickens away from rockhead towards the centre of the channelreaching a thickness of 20-25 m between Chai Wan and Junk Island.Continued thickening occurs to the south along the primary drainagechannel described by rockhead to a thickness of 30 m. Similarly thickeningfrom Junk Bay is observed. South of Tit Cham Chau broadening of thechannel occurs.
4.24 Seismically the unit comprises of high to moderate amplitude chaoticreflector configurations. More continuous reflectors are observed but arenot laterally persistent. Areas of stratified reflectors are observed in theupper part of the unit The lower part of the unit is commonly interferedby multiple reflections.
Bedrock
425 From outcrop on both sides of the North Tathong channel, rockhead leveldecreases towards the centre of the channel. Completely decomposed rockhas been interpreted to be present only in the central areas of the channel.
426 Rockhead highs are observed to protrude from the northern corner of theinvestigation area, south of Junk Island, south and westerly from Tit ChamChau and east of Cape Collinson where a rock pinnacle is located.
421 The general southerly drainage direction is joined by a minor channelemerging from Junk Bay. South of a constriction between Tit Cham Chauand Cape Collinson the main channel broadens.
Boreholes
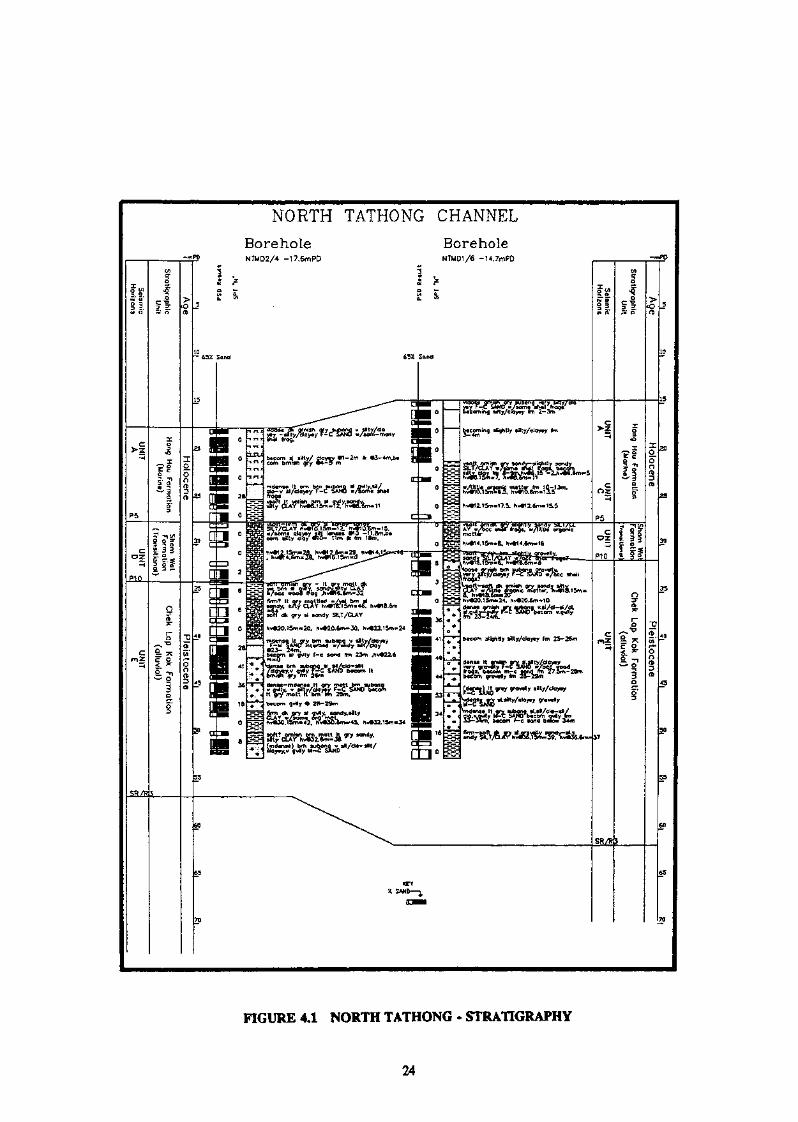
4.28 The sequence intersected in boreholes indicates there are some quite rapidlateral changes in lithology. The stratigraphy comprises a marine Hang HauFormation sequence overlying a lower marine/transitional Sham WatFormation sequence, this in turn overlies the Chek Lap Kok Formationalluvial sequence (see Figure 4.1).
429 The major sand body is a surface Hang Hau Formation marine sand. Thickalluvial sands were intersected in some boreholes but their lateral continuitywas poor and they were overlain by thick silt/clay Overburden (seeFigure 4.1).
Hang Hau Formation
430 The Holocene Hang Hau Formation surface marine sand comprises anumber of fades. In the southern part of the area the formation is theproduct of the flood tide and to the southeast of Junk Island a product ofthe ebb tide (see Figure 4.2).
22
4.31 The flood tide facies comprise a uniform siJty/clayey fine to medium marinesand with shell fragments which grades down into a sandy silt/clay andforms a baihymetric high along the channel axis. On the eastern side of thechannel the sand grades rapidly to a very thick occasionally sandy silt/claysequence.
4.32 Southwest of Junk Island the surface sand has a more variable compositionand appears to be a reworked sand eroded from near Lei Yue Mun on theebb tide and redeposited between Junk Island and Cape Collinson. The sandbody is fine to coarse with shell fragments and thin discontinuous interbedsof silt/clay and silty/clayey fine to medium sand.
4.33 The two sand facies overlay a basal Hang Hau sequence of silt and clay.
Sham Wat Formation
4.34 A transitional sequence provisionally correlated with the Sham WatFormation lies between the Hang Hau Formation and the underlying alluvialsequence. It has an erosional upper surface and comprises dominantly ofgrey slightly sandy silt and clay with some shell fragments and traces oforganic matter. Occasional thin silty/clayey sand interbeds are present
4.35 This unit sits on and is draped over an uneven erosion surface forming thetop of the Chek Lap Kok Formation.
Chek Lap Kok Formation
4.36 The Pleistocene Chek Lap Kok Formation comprises a variable inteibeddedsequence of silt, clay and sand. Thick sand sequences were intersected insome holes but they were of limited lateral extent and had a thickOverburden. The only alluvial sand with any continuity occurs in thenarrowest part of the channel between Junk Island and Cape Collinson andwas intersected in boreholes NTMD2/4, NTMD1/3, NTMD1/6 andNTMD2/7.
4.37 The silt/clay sequences are typically soft to firm green grey mottled yellowbrown silt/clay occasionally slightly sandy and with some organic matter.The sands are dense to very dense silty/clayey fine to coarse and gravellysand.
23
NORTH TATHONG CHANNEL
Borehole BoreholeNTMD2/4 ~l7.6mPD NTMD1/6 -14.7mPD
txcom s! silty/ Clayey <m-2tn it «3-4m.t>«com bmish gfy **^5 m
soft OHVTsft oryy»t bm if o*y.v/occ woo) *r
? It gry mottled <"/y«< bm tldy. sifty CXAY hv*TBfl5m=*«. hv<M8.6m
dk gry 41 »ondy SLT/CXAY
hv*20.6m- 30. hv«22.l5»n
vitv/doyty^v^y
b«ccyn si pUly f-c sond ftrn 2>n ,hv«22.6
becom ijhtly slty/cloyey fm 25-26vn
FIGURE 4.1 NORTH TATHONG - STRATIGRAPHY
24
* S * v0~ ~S o ± 3z= *f X o-, oi to. 105 *;a* t*. = »$ § J jM
» C v
EBB/FLOODFACIES BOUNDARY
FIGURE 4.2 SURFACE SAND - FACIES DISTRIBUTION
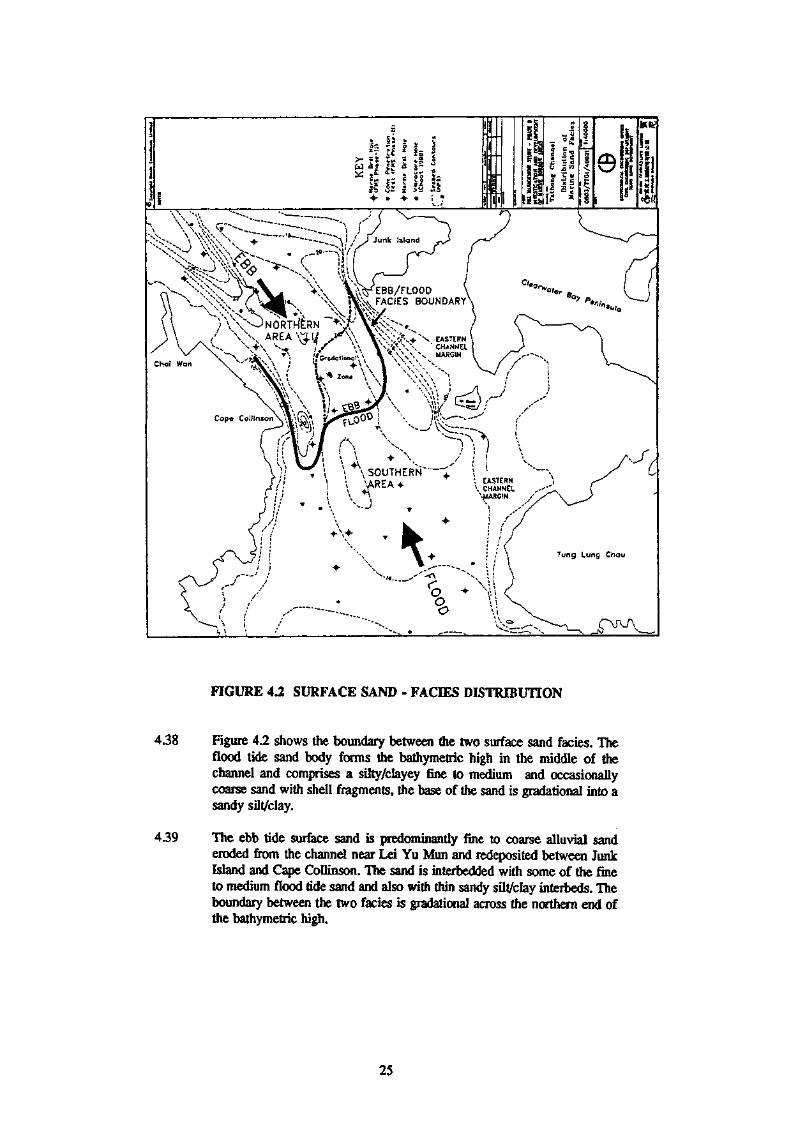
4.38 Figure 4.2 shows the boundary between the two surface sand fades. Theflood tide sand body forms the bathymetric high in the middle of thechannel and comprises a silty/clayey fine to medium and occasionallycoarse sand with shell fragments, the base of the sand is gradational into asandy silt/clay.
4.39 The ebb tide surface sand is predominantly fine to coarse alluvial sanderoded from the channel near Lei Yu Mun and redeposited between JunkIsland and Cape Collinson. The sand is interbedded with some of the fineto medium flood tide sand and also with thin sandy silt/clay interbeds. Theboundary between the two fades is gradational across the northern end ofthe bathymetric high.
25
SPT Results
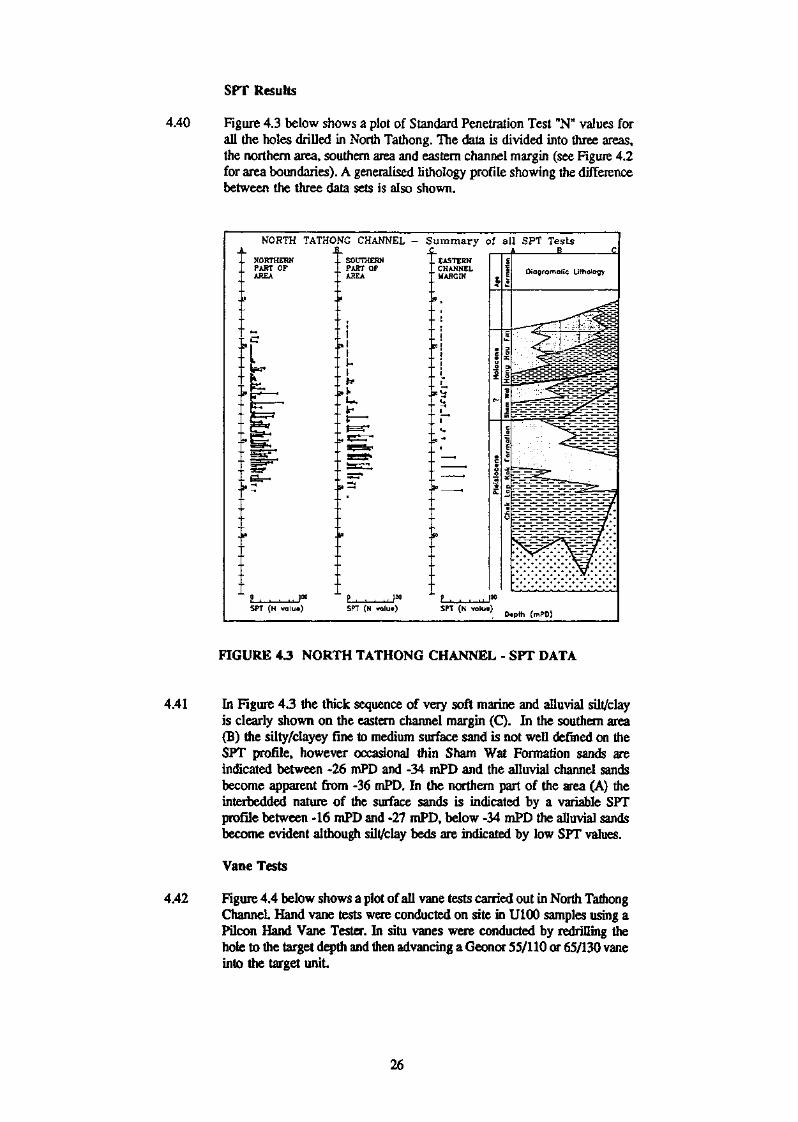
4.40 Figure 4.3 below shows a plot of Standard Penetration Test "N" values forall the holes drilled in North Tathong. The data is divided into three areas,the northern area, southern area and eastern channel margin (see Figure 4.2for area boundaries). A generalised lithology profile showing the differencebetween the three data sets is also shown.
NORTH TATHONG CHANNEL - Summary of all SPT Tests
.. NORTHERN i SOUTHERNPART OFAREA
-,I
$.1
I-I
P . . . .. SPT (N valu*) SPT (N volu*) SPT (N volu*)
. D«pth (mPD)
FIGURE 4.3 NORTH TATHONG CHANNEL - SPT DATA
4.41 In Figure 43 the thick sequence of very soft marine and alluvial silt/clayis clearly shown on the eastern channel margin (C). In the southern area(B) the silty/clayey fine to medium surface sand is not well defined on theSPT profile, however occasional thin Sham Wat Formation sands areindicated between -26 mPD and -34 mPD and the alluvial channel sandsbecome apparent from -36 mPD. In the northern part of the area (A) theinterbedded nature of the surface sands is indicated by a variable SPTprofile between -16 mPD and -27 mPD, below -34 mPD the alluvial sandsbecome evident although sill/clay beds are indicated by low SPT values.
Vane Tests
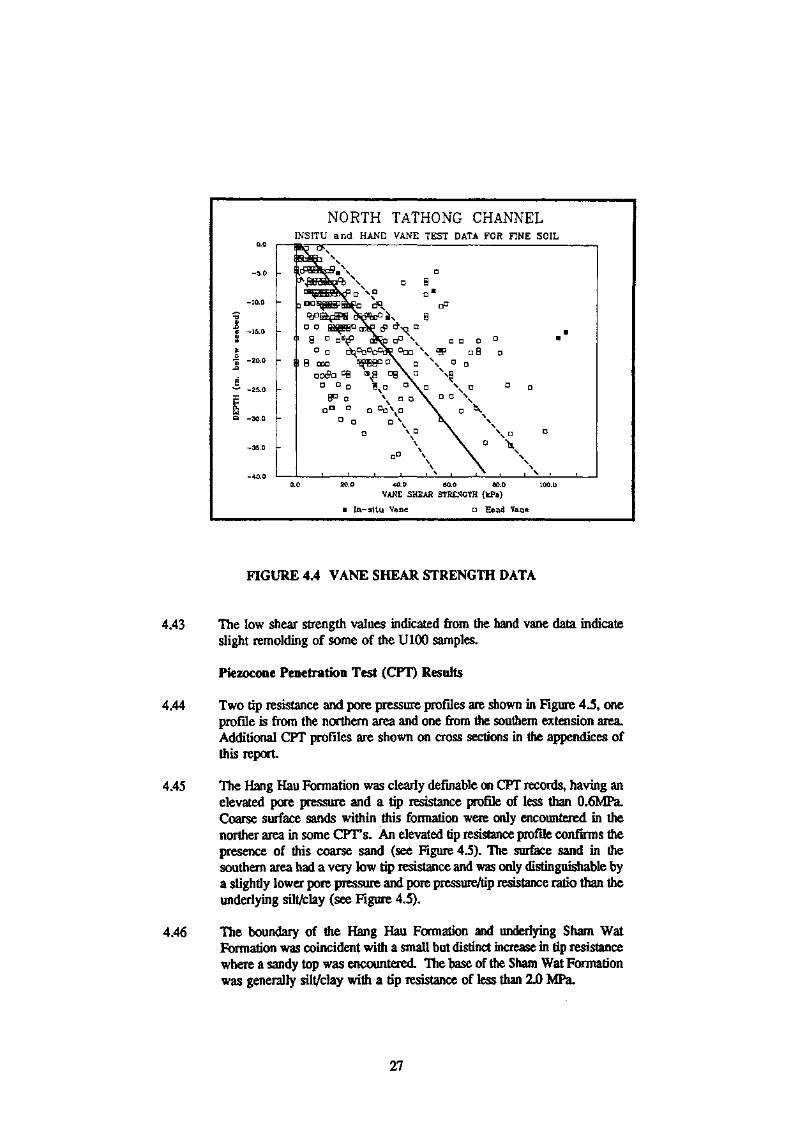
4.42 Figure 4.4 below shows a plot of all vane tests carried out in North TathongChannel. Hand vane tests were conducted on site in U10Q samples using aPilcon Hand Vane Tester. In situ vanes were conducted by redrilling thehole to the target depth and then advancing a Geonor 55/110 or 65/130 vaneinto the target unit
26
Q -30.0
NORTH TATHONG CHANNELINSITU and HAND VANE TEST DATA FOR FINE SOIL
20.0 40.0 60.0 ftO.O
VANE SHEAR STRENGTH (kPa)
• In- situ V&n« a Hand Vane
FIGURE 4.4 VANE SHEAR STRENGTH DATA
4.43 The low shear strength values indicated from the hand vane data indicateslight remolding of some of the U100 samples.
Pkzocone Penetration Test (CPT) Results
4.44 Two tip resistance and pore pressure profiles are shown in Figure 4 J, oneprofile is from the northern area and one from the southern extension aieaAdditional CPT profiles are shown on cross sections in the appendices ofthis report
4.45 The Hang Hau Formation was clearly definable on CPT records, having anelevated pore pressure and a tip resistance profile of less than 0.6MPa.Coarse surface sands within this formation were only encountered in thenorther area in some CPTs. An elevated tip resistance profile confirms thepresence of this coarse sand (see Figure 4.5). The surface sand in thesouthern area had a very low tip resistance and was only distinguishable bya slightly lower pore pressure and pore pressure/tip resistance ratio than theunderlying silt/clay (see Figure 4.5),
4.46 The boundary of the Hang Hau Formation and underlying Sham WatFormation was coincident with a small but distinct increase in tip resistancewhere a sandy top was encountered The base of the Sham Wat Formationwas generally silt/clay with a tip resistance of less than 2.0 MPa.
27
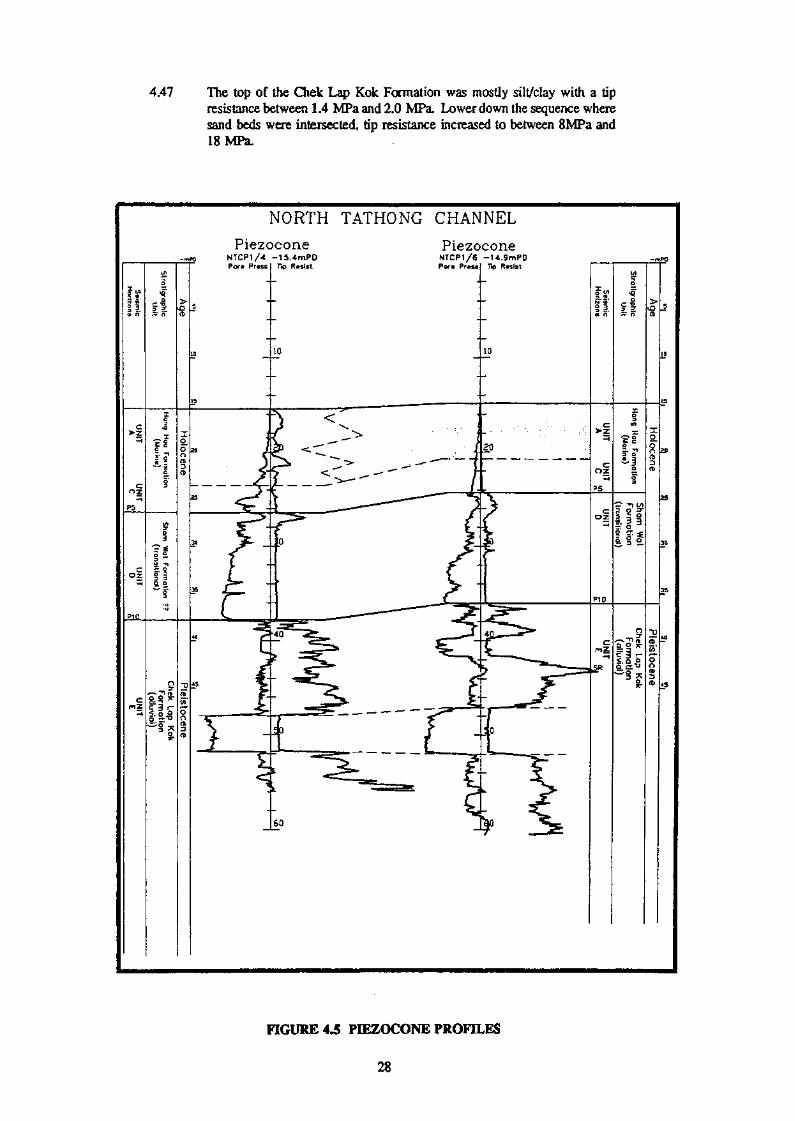
4.47 The top of the Chek Lap Kok Formation was mostly silt/clay with a tipresistance between 1.4 MPa and 2.0 MPa. Lower down the sequence wheresand beds were intersected, tip resistance increased to between 8MPa and18 MPa.
NORTH TATHONG CHANNEL
PiezoconeNTCP1/4 -IS.-imPD
PiezoconeNTCP1/6 -14..9rr»PDP<x« Pr»tsj Tip Resist
FIGURE 4.5 PIEZOCONE PROFILES
28
Laboratory Testing
4.48 All samples recovered from significant sand units were sent for laboratorytesting as well as a representative group of silt/clay samples. In most casesa U100 sample was used for testing with the equivalent bulk sampleperiodically used as a check.
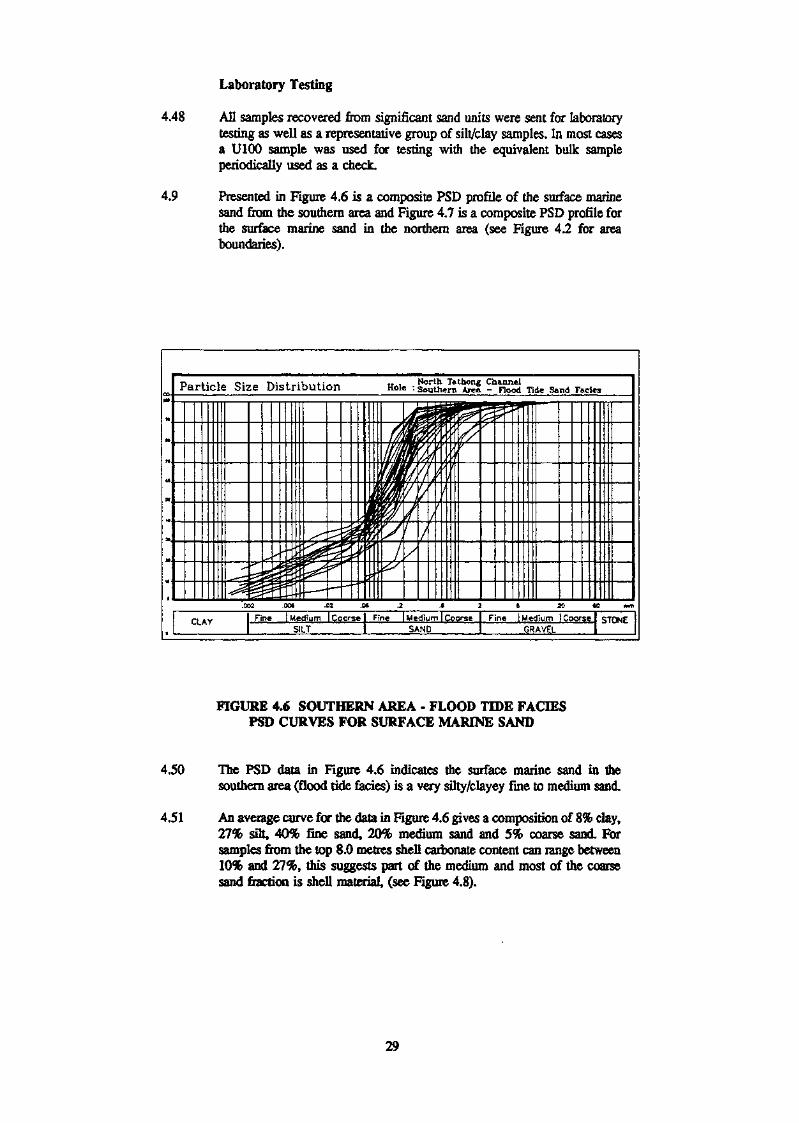
4.9 Presented in Figure 4.6 is a composite PSD profile of the surface marinesand from the southern area and Figure 4.7 is a composite PSD profile forthe surface marine sand in the northern area (see Figure 4.2 for areaboundaries).
Particle Size Distribution Hole :££8L£t5SSouthern Area - Flood. Tide Sand Faciea
CLAY Fine JMediurn I Coorse | Fine I Medium | CoorseSILT SAND
Fine I Medium I Coorse I STONEGRAVEL
FIGURE 4,6 SOUTHERN AREA - FLOOD TIDE FACIESPSD CURVES FOR SURFACE MARINE SAND
4.50 The PSD data in Figure 4.6 indicates the surface marine sand in thesouthern area (flood tide fades) is a very silty/clayey fine to medium sand
4.51 An average curve for the data in Figure 4.6 gives a composition of 8% clay,27% silt, 40% fine sand, 20% medium sand and 5% coarse sand Forsamples from the top 8.0 metres shell carbonate content can range between10% and 27%, this suggests part of the medium and most of the coarsesand fraction is shell material, (see Figure 4.8).
29
North T&thonf ChannelHole : Northern Area - Ebb Tide Sand FadesParticle Size Distribution
Fine I Medium j Coorse I Fine | Medium | Coorse Fine I Medium (Coarse
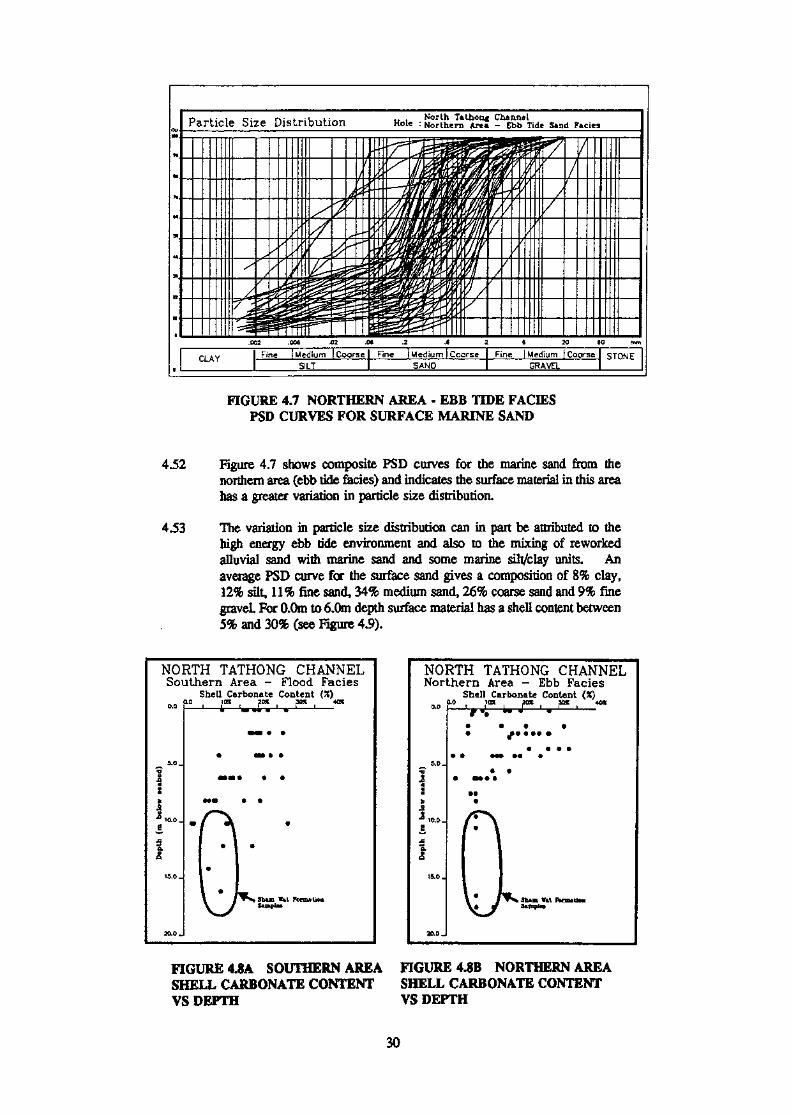
FIGURE 4.7 NORTHERN AREA - EBB TIDE FACIESPSD CURVES FOR SURFACE MARINE SAND
452 Figure 4.7 shows composite PSD curves for the marine sand from thenorthern area (ebb tide facies) and indicates the surface material in this areahas a greater variation in particle size distribution,
4.53 The variation in particle size distribution can in part be attributed to thehigh energy ebb tide environment and also to the mixing of reworkedalluvial sand with marine sand and some marine silt/clay units. Anaverage PSD curve for the surface sand gives a composition of 8% clay,12% silt, 11% fine sand, 34% medium sand, 26% coarse sand and 9% finegraveL For 0.0m to 6,0m depth surface material has a shell content between5% and 30% (see Figure 4.9).
NORTH TATHONG CHANNELSouthern Area - Flood Facies
Shell Carbonate Content (%)0.0
^ 5-0-•o2I>
T0.0_
£
|
15.0 _
20.0.
XO 10X 20% 30X 40%
•MB • *
• *» • •
«*«» • *
••* • *__s~*\
• ^
• •
•
*. TX Shun V«t Fonnatioa\ / S»Diptea
NORTH TATHONG CHANNELNorthern Area - Ebb Facies
Shell Carbonate Content (%)0.0
5.0 _
I
:»
JS^ 10.0 _
s§
X
1"15.0 _
20.0.
J.O 10* 20% 30% 40%L-jl-qr iMp—g '""» ' '
• • * •* f» • ** •
* * • »* • ••» •• •
• •* «M* *
••*
/T"X* •
• IK <fc _, T^k 3t*m Y*t Ibmwtion^ j f Sample,
FIGURE 4.8A SOUTHERN AREA FIGURE 4.8B NORTHERN AREASHELL CARBONATE CONTENT SHELL CARBONATE CONTENTVS DEPTH VS DEPTH
30
4.54 Figures 4.8a and 4.8b show a plot of shell carbonate content against depthbelow seabed for the two surface sand facies.
4.55 Most of the data is from the Hang Hau Formation and indicates the ebb tidefacies has a more pronounced decrease in shell content with depth. Thiscontrasts with a more uniform distribution with depth for the flood tidefacies. The low shell carbonate content of the Sham Wat Fonnation is alsooutlined.
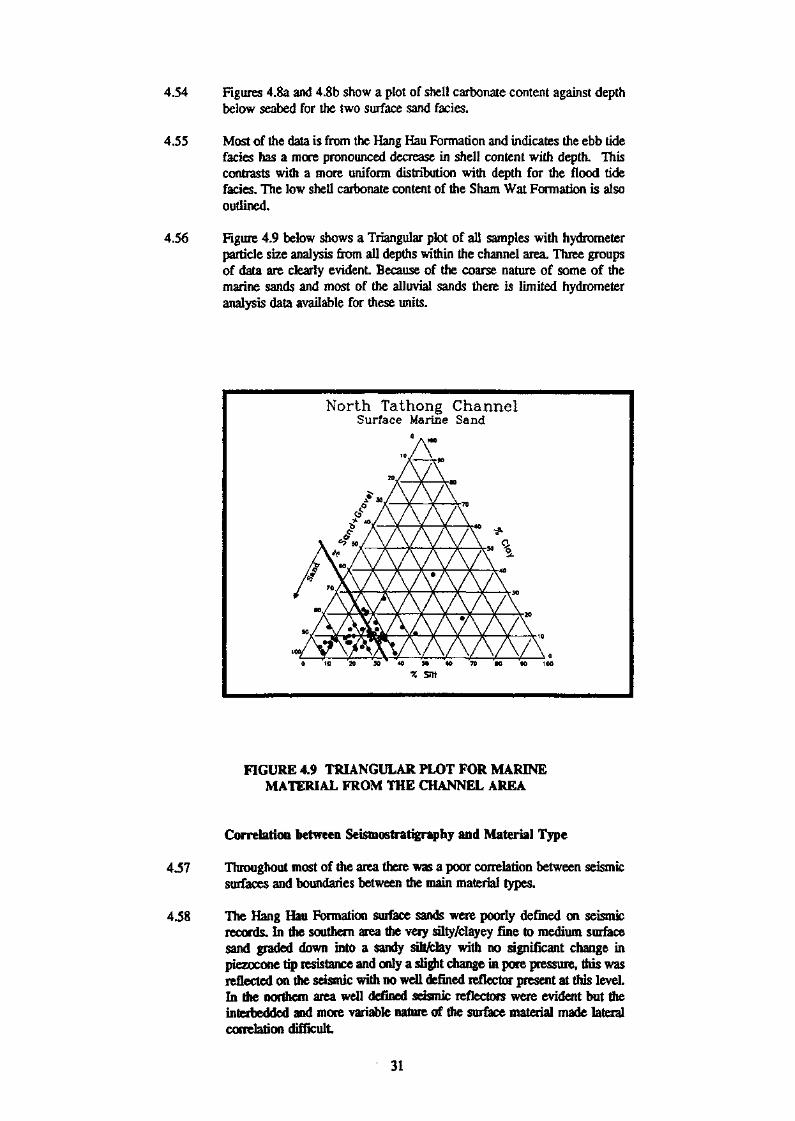
4.56 Figure 4.9 below shows a Triangular plot of all samples with hydrometerparticle size analysis from all depths within the channel area. Three groupsof data are clearly evident. Because of the coarse nature of some of themarine sands and most of the alluvial sands there is limited hydrometeranalysis data available for these units.
North Tathong ChannelSurface Marine Sand
0 10 20 5 0 4 0 SB 10 70 BO 40 100
% sm
FIGURE 4.9 TRIANGULAR PLOT FOR MARINEMATERIAL FROM THE CHANNEL AREA
Correlation between Seismostratigraphy and Material Type
4.57 Throughout most of the area there was a poor correlation between seismicsurfaces and boundaries between the main material types.
4.58 The Hang Hau Fonnation surface sands were poorly defined on seismicrecords. In the southern area the very silty/clayey fine to medium surfacesand graded down into a sandy silt/clay with no significant change inpiezocone tip resistance and only a slight change in pore pressure, this wasreflected on the seismic with no well defined reflector present at this level.In the northern area well defined seismic reflectors were evident but theinteibedded and more variable nature of the surface material made lateralcorrelation difficult
31
4.59 The top of the Sham Wat and Chek Lap Kok Formations were marked byerosion surfaces with moderate relief. The overlying material exhibiteddrape features over the uneven surface and for this reason these surfaceswere reasonably well defined on the seismic records.
4.60 Within the Chek Lap Kok Formation the sand beds were only moderatelywell defined. Laterally the thick sand sequences gave way to thick silt/claysequences without an appreciable change in reflector characteristic. Therewere however distinct piezocone tip resistance changes coincident withseismic reflectors which could be correlated for short distances.
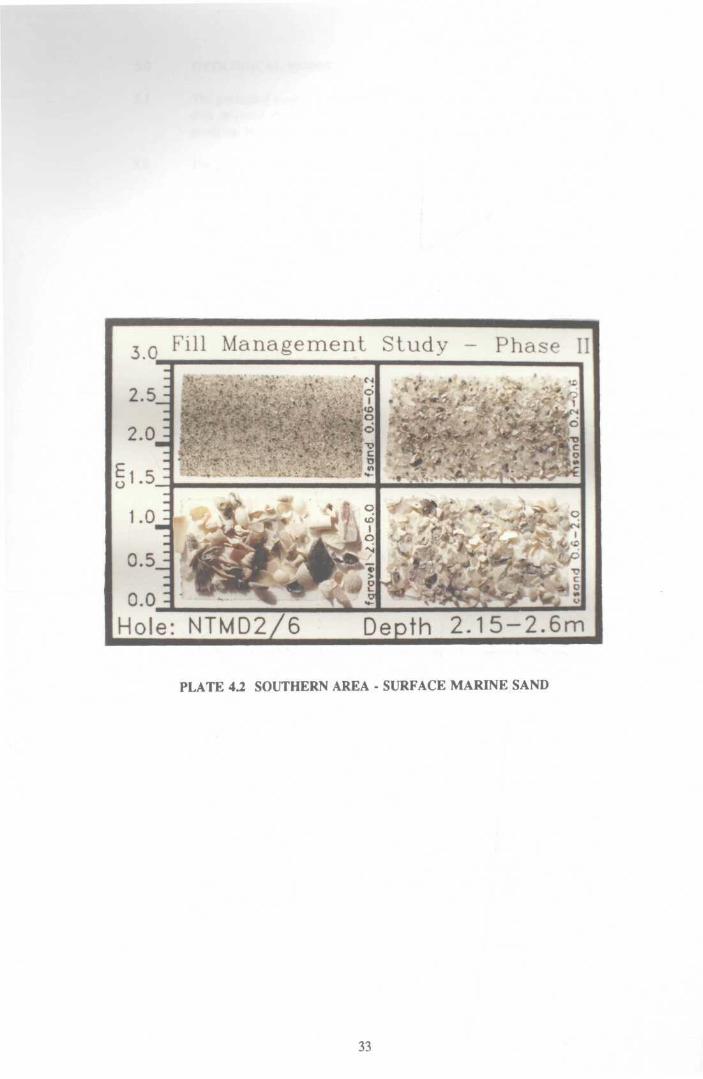
Photographic Presentation of Sand Samples
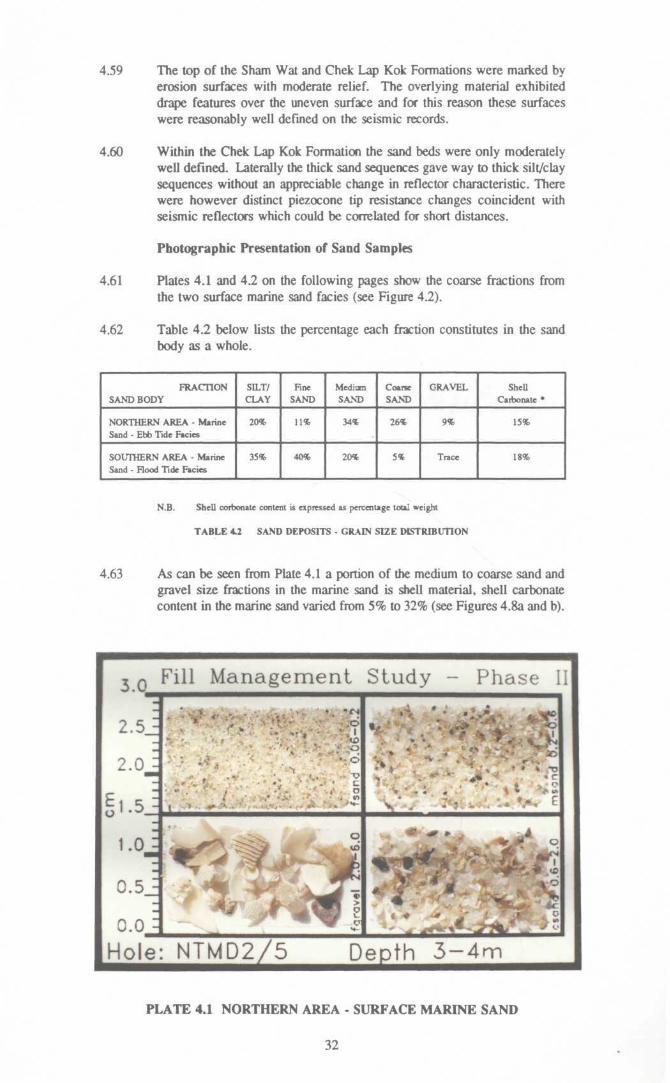
4.61 Plates 4.1 and 4.2 on the following pages show the coarse fractions fromthe two surface marine sand facies (see Figure 4.2).
4.62 Table 4.2 below lists the percentage each fraction constitutes in the sandbody as a whole.
FRACTIONSAND BODY
NORTHERN AREA - MarineSand - Ebb Tide Facies
SOUTHERN AREA - MarineSand - Flood Tide Facies
SILT/CLAY
20%
35%
FineSAND
11%
40%
MediumSAND
34%
20%
CoarseSAND
26%
5%
GRAVEL
9%
Trace
ShellCarbonate *
15%
18%
N.B. Shell corbonate content is expressed as percentage total weight
TABLE 42 SAND DEPOSITS • GRAIN SIZE DISTRIBUTION
4.63 As can be seen from Plate 4.1 a portion of the medium to coarse sand andgravel size fractions in the marine sand is shell material, shell carbonatecontent in the marine sand varied from 5% to 32% (see Figures 4.8a and b).
0 Fill Management Study Phase II
2.5
2.0 :
1.5 :
1.0.=
0.5J
0.0 =
"2n
• . .t » - > *'W >
*-v* "
Hole: NTMD2/5 Depth 3-4m
PLATE 4.1 NORTHERN AREA - SURFACE MARINE SAND
32
3.0 Fill Management Study Phase II
2.0 :
1.0J
0.5 :
O.OJ
Hole
S - - - 4
•*. *T*l cII•re
• ' * ' %**<
NTMD2/6 Depth 2.15-2.6m
PLATE 42 SOUTHERN AREA - SURFACE MARINE SAND
33
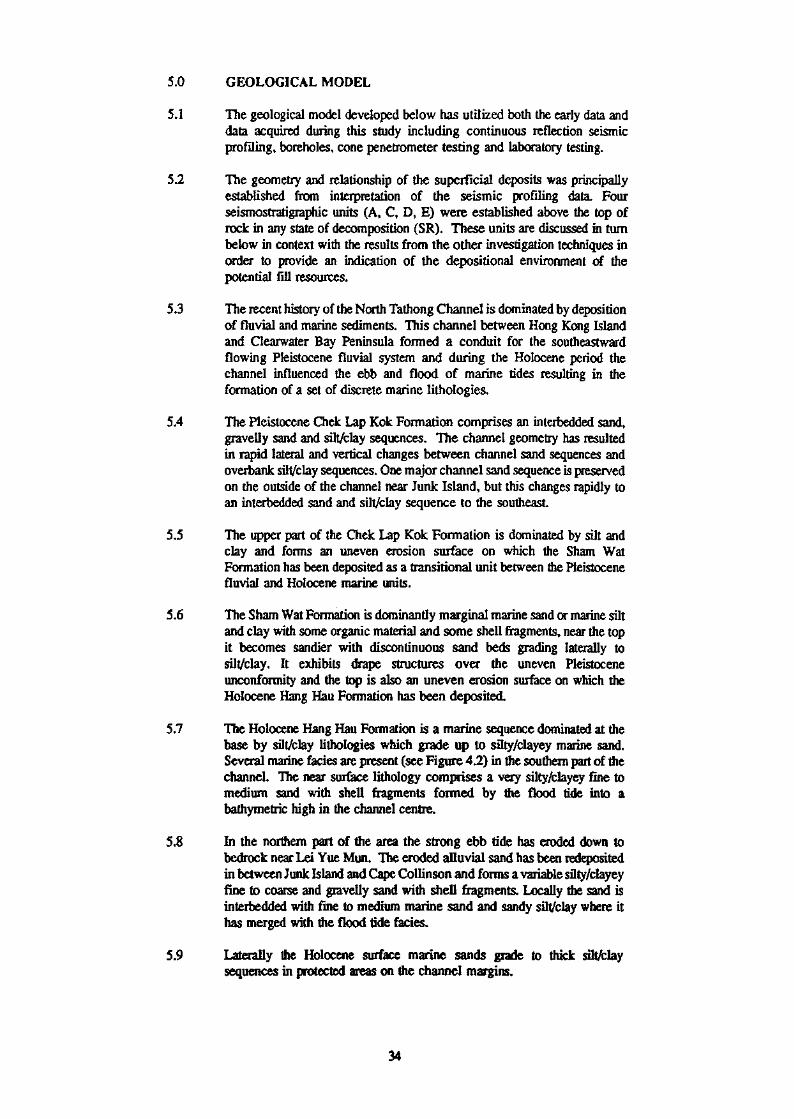
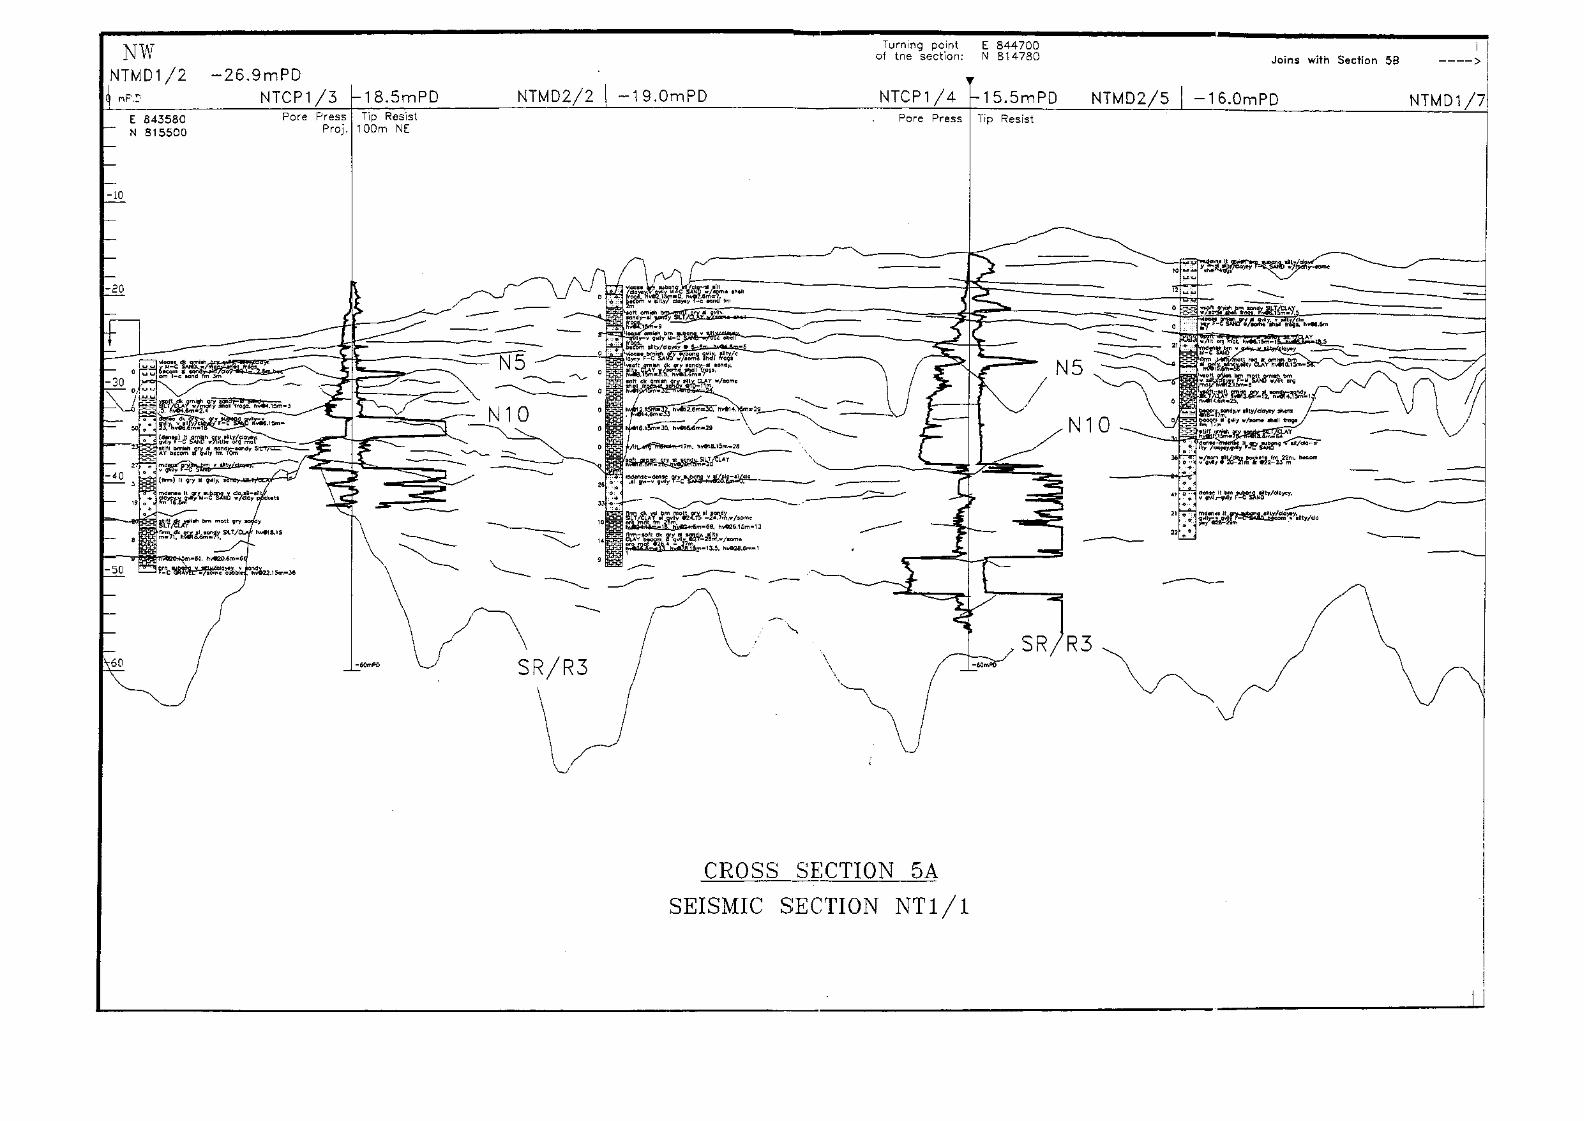
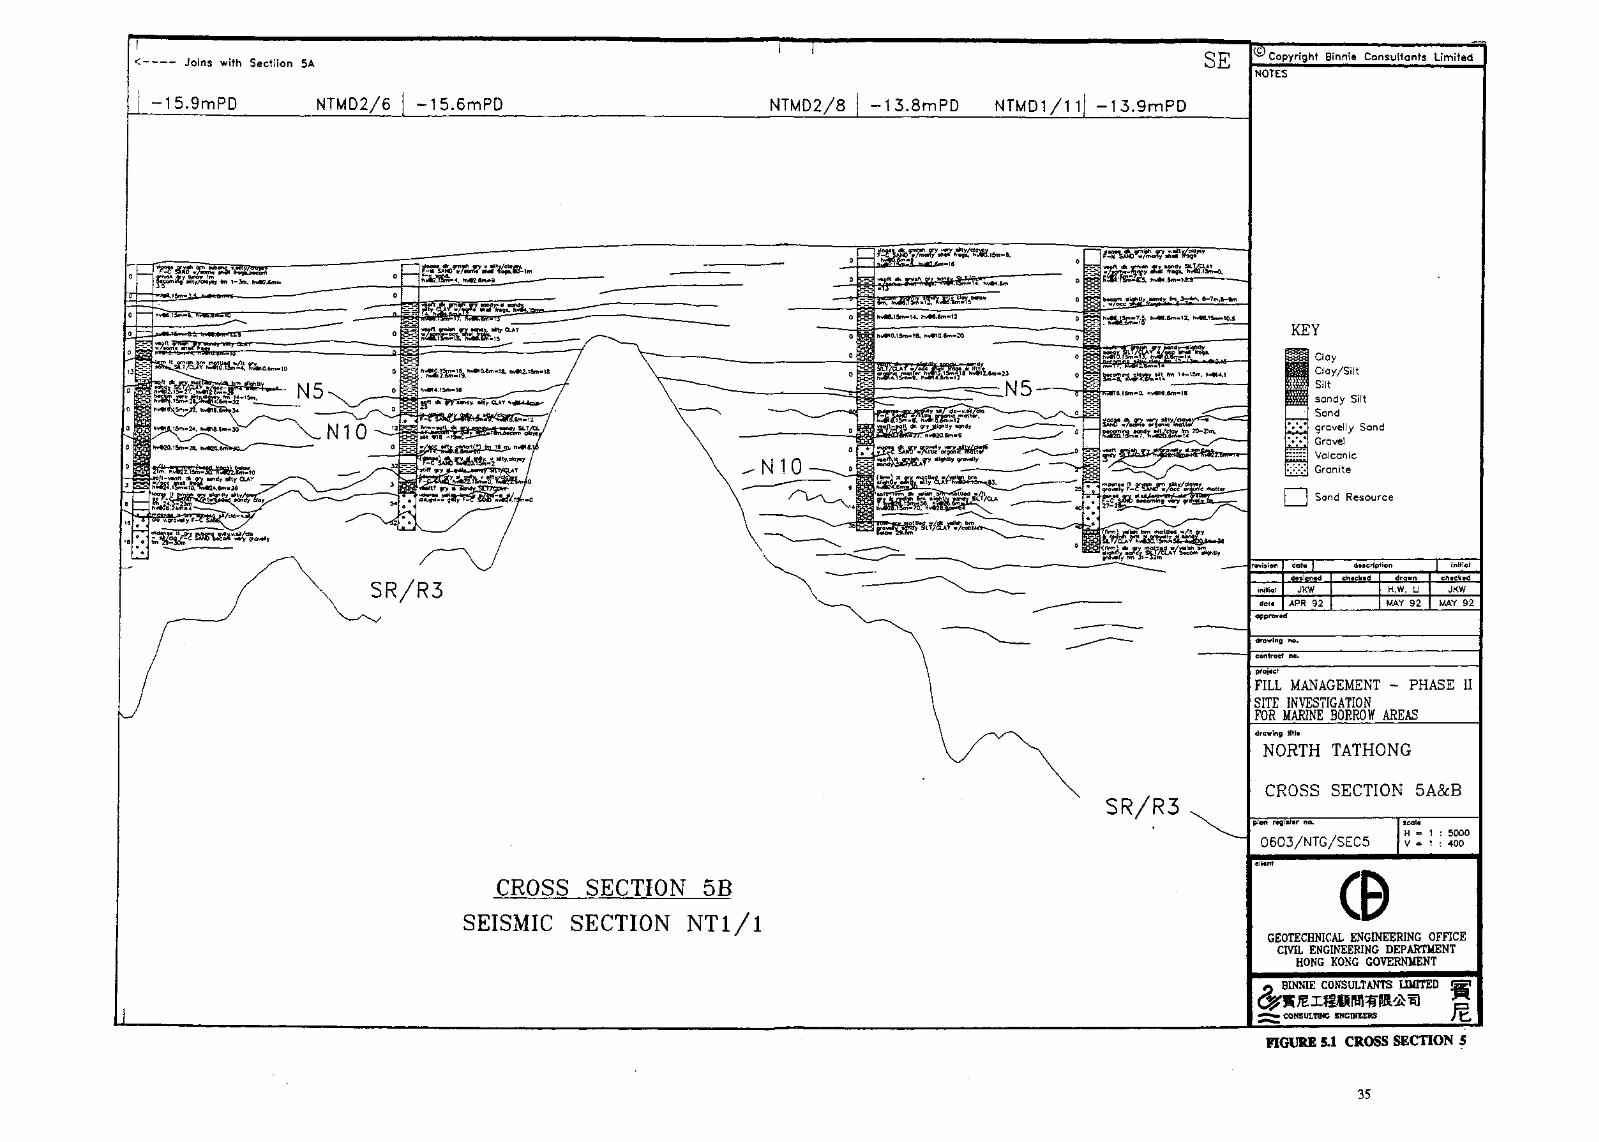
5.0 GEOLOGICAL MODEL
5.1 The geological model developed below has utilized both the early data anddata acquired during this study including continuous reflection seismicprofiling, boreholes, cone penetrometer testing and laboratory testing.
5.2 The geometry and relationship of the superficial deposits was principallyestablished from interpretation of the seismic profiling (fata. Fourseismostratigraphic units (A, C, D, E) were established above the top ofrock in any state of decomposition (SR). These units are discussed in turnbelow in context with the results from the other investigation techniques inorder to provide an indication of the depositional environment of thepotential fill resources.
5.3 The recent history of the North Tathong Channel is dominated by depositionof fluvial and marine sediments. This channel between Hong Kong Islandand Clearwater Bay Peninsula formed a conduit for the southeastwardflowing Pleistocene fluvial system and during the Holocene period thechannel influenced the ebb and flood of marine tides resulting in theformation of a set of discrete marine lithologies.
5.4 The Pleistocene Chek Lap Kok Formation comprises an interbedded sand,gravelly sand and silt/clay sequences. The channel geometry has resultedin rapid lateral and vertical changes between channel sand sequences andoverbank silt/clay sequences. One major channel sand sequence is preservedon the outside of the channel near Junk Island, but this changes rapidly toan interbedded sand and silt/clay sequence to the southeast.
5.5 The upper part of the Chek Lap Kok Formation is dominated by silt andclay and forms an uneven erosion surface on which the Sham WatFormation has been deposited as a transitional unit between the Pleistocenefluvial and Holocene marine units.
5.6 The Sham Wat Formation is dominantly marginal marine sand or marine siltand clay with some organic material and some shell fragments, near the topit becomes sandier with discontinuous sand beds grading laterally tosilt/clay. It exhibits drape structures over the uneven Pleistoceneunconformity and the top is also an uneven erosion surface on which theHolocene Hang Hau Formation has been deposited,
5.7 The Holocene Hang Hau Formation is a marine sequence dominated at thebase by silt/clay lithologies which grade up to silly/clayey marine sand.Several marine fades are present (see Figure 4.2) in the southern part of thechannel. The near surface lithology comprises a very silty/clayey fine tomedium sand with shell fragments formed by the flood tide into abathymetric high in the channel centre.
5.8 In the northern part of the area the strong ebb tide has eroded down tobedrock near Lei YueMun. The eroded alluvial sand has been redepositedin between Junk Island and Cape Collinson and forms a variable silty/clayeyfine to coarse and gravelly sand with shell fragments. Locally the sand isinterbedded with fine to medium marine sand and sandy sill/clay where ithas merged with the flood tide fades.
5.9 Laterally the Holocene surface marine sands grade to thick silt/claysequences in protected areas on the channel margins.
34
NWNTMD1/2
Turning pointof tne section:
E 844700N 814780
-26.9mPDJoins with Section 5B >
yflO%6m-68, hvO25,15rn-13firm-soft dk gry si sandy, silty .CLAY beocm_ 3 yqsHly^O27-28rr<.w/Some
hvO2B.6m-1
CROSS SECTION 5A
SEISMIC SECTION NTl/1
Copyright Binnie Consultants Limited< Joins with Sectiion 5A
-15.9mPD NTMD2/6 -15.6mPD NTMD2/8 NTMD1/1113.8mPD 13.9mPD
h qry «oody 9LT/CLAYy «h4ll frog*. hv««.i5m«»0.
DayClay/SiltSilt
Sandgravelly SandGravelVolcanicGranite
FILL MANAGEMENT - PHASE IISITE INVESTIGATIONFOR MARINE BORROW AREASdrawing title
NORTH TATHONG
CROSS SECTION 5A&BSR/R3
0603/NTG/SEC5
CROSS SECTION 5B
SEISMIC SECTION NTl/1GEOTECHNICAL ENGINEERING OFFICE
CIVIL ENGINEERING DEPARTMENTHONG KONG GOVERNMENT
BINNIE CONSULTANTS LIMITED
FIGURE 5.1 CROSS SECTION 5
35
6.0 SAND RESOURCE
6.1 The sand volumes presented in this section (see Table 6.1) are theDelineated Sand Resource within the defined dredge pit (see Section 1.8 fordefinition). The interpretation on which the Delineated Sand Resource isbased is presented on the maps and cross sections in Appendices I and ELThe interpretation shown on the cross sections is based on correlation ofborehole, piezocone penetration test (CPT) records and on geophysicalsections. The isopach maps and surface level plans are based on geophysicaldata, borehole and CPT data and on the cross sections.
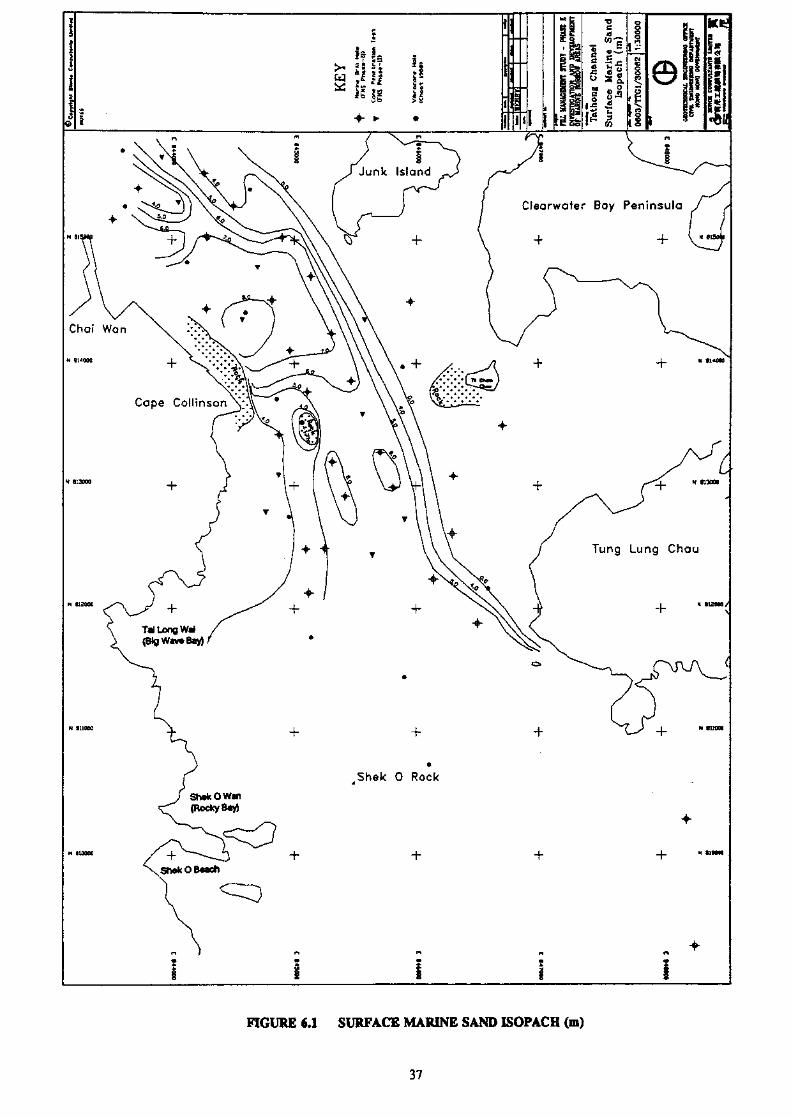
6.2 One main sand body has been identified, a Hang Hau Formation surfacemarine sand, which can be divided into two separate fades. The distributionof the two fades is presented in Figure 4.2, an isopach of the sand ispresented in Figure 6.1, the pit configuration on which the Delineated SandResource is based is presented in figures in Section 7.
Surface Sand - Flood Tide Packs
63 This sand forms the bathymetric high in the centre of the channel in thesouthern part of the area (see Figure 4.2). The sand is typically a very loosevery silty/clayey fine to medium sand with shell fragments and has auniform thickness of between 4.0 m and 6.0 metres. The base of the sandis gradational with a basal sandy silt/clay sequence.
6.4 The composite particle size distributions presented in Figure 4.6 indicatesthe sand ranges from silty/clayey to very silty/clayey fine to medium sandwith an average of 35% silt/clay. Some of the material grades to a silt/claywith 55% to 65% sand. The coarse sand and fine gravel fraction isdominated by shell fragments (see Figure 4.8a).
Surface Sand - Ebb Tide Fades
6.5 This sand is located in the northern part of the area (see Figure 4.2) and isa composite lithology formed from reworked alluvial sand, marine sand andmarine silt/clay. It reaches a maximum thickness of 6.0m to 8.0 metresbetween Junk Island and Cape Collinson. Laterally the sand merges with theflood tide sand fades over a relatively short distance with only a slightchange in seismic character. Some thin marine silt/clay interbeds are alsopresent.
6.6 The composite particle size distribution plot presented in Figure 4Jillustrates the more variable nature of this sand deposit The samples rangefrom slightly silty/clayey medium to coarse and gravelly sands representingreworked alluvial sand to a group of silty/clayey fine to coarse sand samplesrepresenting a combined reworked/marine sand and a small group of verysilty/clayey fine to medium sand samples representing the true marinesands. Also plotted are a small group of sandy silt/clay and slightly sandysilt/clay interbed samples mainly from the northern channel margin.
Delineated Sand Resources
6.7 In calculating the Delineated Sand Resources a level plan on the base of thesand isopached in Figure 6.1 was established and a preliminary pit designimposed on it The resulting pit model is presented in Figure 7.3. The sandvolume was calculated by subtracting this base of sand model from dieexisting seabed surface.
36
Clearwater Bay Peninsula
FIGURE 6.1 SURFACE MARINE SAND ISOPACH (m)
37
6.8 The division between the two sand facies for the purpose of the volumecalculation is taken as the boundary illustrated in Figure 4.2 and presentedon the pit configuration in Figure 7.3.
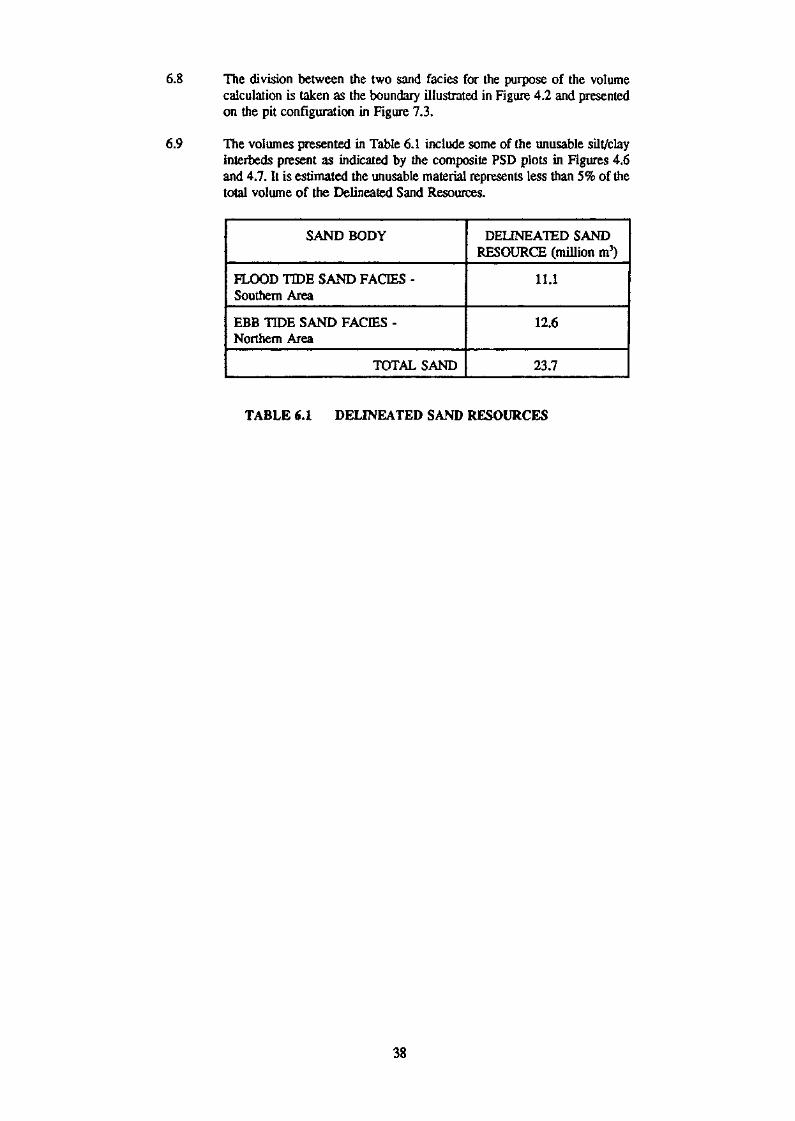
6.9 The volumes presented in Table 6.1 include some of the unusable silt/clayinterbeds present as indicated by the composite PSD plots in Figures 4.6and 4.7. It is estimated the unusable material represents less than 5% of thetotal volume of the Delineated Sand Resources.
SAND BODY
FLOOD TIDE SAND FACIES -Southern Area
EBB TIDE SAND FACIES -Northern Area
TOTAL SAND
DELINEATED SANDRESOURCE (million m3)
11.1
12.6
23.7
TABLE 6.1 DELINEATED SAND RESOURCES
38
7. DREDGING ASSESSMENT
Delineated Sand Resources
7.1 The Delineated Sand Resources comprise approximately 23.7 Mm3 ofsurface marine sands which extend over most of the width of the TathongChannel from a point just seawards of the Lei Yue Mun Gap southwardsto Tung Lung Chau. The Resources have been divided into a coarse butvariable ebb tide fades and a less variable, finer-grained flood tide fades.The ebb tide fades amounts to approximately 12.6 Mm3 whilst the floodtide fades amounts to 11.1 Mm3.
Site Characteristics Influencing the Choice of Plant
7.2 The borrow area is well protected and waves and swell are unlikely todisrupt dredging operations except during typhoons. Currents reach amaximum speed of about 0.75 m/sec during spring tides over most of thearea. Slightly faster currents prevail in the northern part of the area, nearLei Yue Mun. Such currents would not hinder dredging operations with theexception of grab dredgers which may experience difficulties of grab controlbut this is unlikely to be a serious problem.
7.3 Seabed levels in the area of the sand resources are typically in the range -14to -16 mPD except in the northwestern extremity of the area, towards LeiYue Mun where the seabed drops to around -30 mPD. Completeexploitation of the Delineated Sand Resource would entail dredging to amaximum level of -30 mPD, but most of the resource could be worked withplant having a maximum depth capability of about 25 or 26 metres. Suchdepths can be attained by several types of dredger. There are a largenumber of trailer dredgers which can work to 30 metres. Cutter suction anddustpan dredgers do not often have the capability of working to these depthsbut, depending on their design, can often be modified to do so.
7.4 An outfall pipeline extends across the area from the northeast near JunkIsland. If it were not removed, a substantial safety zone would have to beestablished around it which would sterilise a large volume of resource,effectively making the whole area northwest of the channel maiker buoy(TCS 4) unwoikable, A second outfall extends from Chai Wan, to the west,almost to the western margin of the delineated area.
7.5 The seismic records indicate occasional patches of dumped material butdumping seems not to have been extensive. The nature of the dumpedmaterial is not known. If it includes debris such as construction waste,scrap metal and other such materials, it could be a local hindrance todredging operations.
7.6 The southern part of the area lies within a Toul Area' where there arethought to be several old military cables and moorings. These might alsoprove to be a hindrance to dredging. There are no indications of any poweror communications cables in the area which are still in use. In areas wherethere is a significant amount of debris, grab dredgers would be the preferredoption for dredging.
7.7 Most of the area lies within the Tathong Channel Traffic Separation Scheme(TSS). Whilst the marine traffic in this area is considerably less than thatwhich uses the East Lamina Channel, it is still becoming increasingly busyfrom a maritime viewpoint and mobile trailer dredgers would be the optionmost preferred.
39
7.8 Most stationary and semi-stationary dredgers require anchors, or acombination of anchors and spuds, which could constitute a hazard to othermarine traffic. In general, grab dredgers require a reasonably small anchorspread as the digging forces are vertical and are resisted by the buoyancyof the dredger's pontoon. Grab dredgers have worked parts of this area inthe past and it should be possible to continue to use this method to workthose parts of the delineated pit that lie outside the TSS. Sequentialallocation of parts of the pit and temporary realignment of the TSS couldmake much more of this resource accessible to a stationary grab andsupporting barges using the Inshore Traffic Zone,
7.9 Largo: anchor spreads are required by cutter suction dredgers but the sidewinch wires lead from the lower part of the ladder and are unlikely toconstitute an obstruction to shipping except very close-to. Bucket dredgersand dustpan dredgers require very long headwires and also have stem andside wires. These would certainly constitute an obstruction to other marinetraffic,
Seabed Characteristics Influencing the Choice of Plant
7.10 The Delineated Sand Resource comprises loose and very loose marinesands. The ebb tide facies have a veiy variable grading (Figure 7.1) witha fines content ranging between 0 and about 40%, although some marginalsands have even higher fines contents (see Rgure 4.7). The average && ofthe ebb facies is about 400 microns and it contains between 2 and 40% fineand medium gravel which comprises predominantly shells and shellfragments.
7.11 The envelope of PSD curves for the flood facies excluding several coarsergrained samples is shown in Figure 72. The flood facies exhibits muchless variation and is finer, having an average d^ of about 120 microns.Exploitation of the sand would not require the removal of Overburden nor,it is thought, any intermediate layers of clay and silt
Particle Size Distribution Hole : northern Area - US* Tide Sand ftciestrt
M
***
*>*
**»
.- *"'"
- - = =
i , - — 5"
„,— -
^
**•
^•^
p--"
^ • =.002 .006 .02 M
CLAY Rne (Medium 1 Coorse
§yj_
>I
If
I*/,''^
\~~~~
/
^
Jf
****
**
'
\/
f, :
1
::
^ *
'
.2 .«
,."— *
/*
t\
1
/(
••>""
X
//
"""fff
x^
2 t
Fine 1 Medium 1 CoorseSAND
*S"^
20 «0
Fine {Medium j CoorseGRAVEL
mm
STONE
FIGURE 7.1 PARTICLE SIZE DISTRIBUTIONOF THE EBB FACIES SANDS
40
7.12 Sands such as these can be dredged by a variety of plant including trailerdredgers, grabs, cutter suction and dustpan dredgers and bucket dredgers.To some extent, the choice may be influenced by the nature of the Fillreceiving area and the methods being used to dredge and transport anyunsuitable materials which may have to be removed,
7.13 With grabs and bucket dredgers, the relatively high fines content of thedredged material may be a constraint, depending upon the engineeringrequirements for the Fill. Vary little fines are lost by these methods and theresulting silty Fill may not be acceptable in some cases. Rehandling basinsmay be required at the receiving site to improve the quality of the dredgedmaterial. Trailer dredgers and stationary or semi-stationary hydraulicdredgers such as dustpan and cutter suction dredgers loading into bargescould be used to improve the quality of the material by washing the finesout during loading.
FIGURE 73, PARTICLE SIZE DISTRIBUTIONOF THE FLOOD FACIES SANDS
Constraints to Transport Operations
7.14 The dredged sand can be transported by barge and hopper or by hydraulicpipeline transport There are no apparent constraints to barge and hoppertransport but there would clearly be some impact on marine traffic densityduring exploitation.
7.15 Hydraulic transport is severely limited by distance unless booster stationsare used. Hydraulic transport may be possible if the receiver site is closeto the borrow area, eg. Area 137 at Tseung Kwan 0. It would require theuse of floating pipeline which could hinder other marine traffic. Even if asubmerged pipeline were to be used for most of the route, it would still benecessary to deploy 200 to 300 metres of floating pipeline between thedredger and the submerged line. Temporary realignment or narrowing ofthe TSS would increase the proportion of the Sand Resource that could beworked by a cutter using hydraulic transport
41
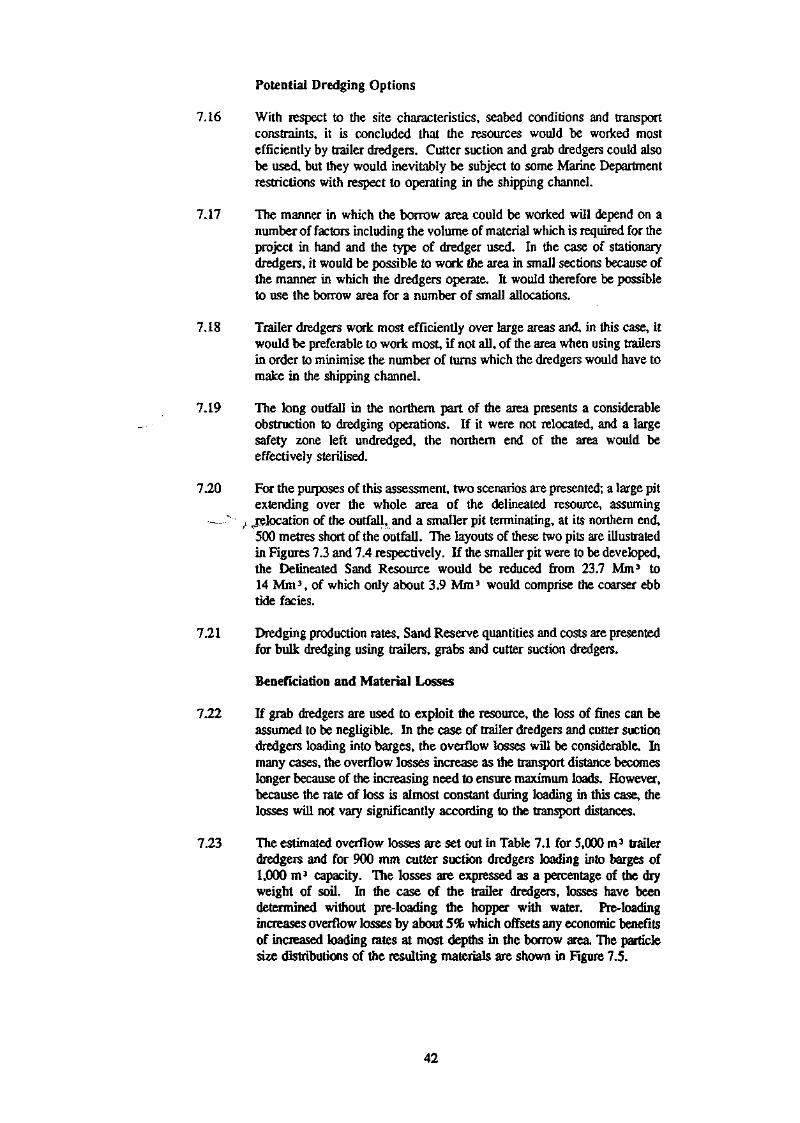
Potential Dredging Options
7.16 With respect to the site characteristics, seabed conditions and transportconstraints, it is concluded that the resources would be worked mostefficiently by trailer dredgers. Cutter suction and grab dredgers could alsobe used, but they would inevitably be subject to some Marine Departmentrestrictions with respect to operating in the shipping channel
7.17 The manner in which the borrow area could be worked will depend on anumber of factors including the volume of material which is required for theproject in hand and the type of dredger used. In the case of stationarydredgers, it would be possible to work the area in small sections because ofthe manner in which the dredgers operate. It would therefore be possibleto use the borrow area for a number of small allocations.
7.18 Trailer dredgers work most efficiently over large areas and, in this case, itwould be preferable to work most, if not all, of the area when using trailersin order to minimise the number of turns which the dredgers would have tomake in the shipping channel.
7.19 The long outfall in the northern part of the area presents a considerableobstruction to dredging operations. If it were not relocated, and a largesafety zone left undredged, the northern end of the area would beeffectively sterilised.
7.20 For the purposes of this assessment, two scenarios are presented; a large pitextending over the whole area of the delineated resource, assuming
- v j ^relocation of the outfall, and a smaller pit terminating, at its northern end,500 metres short of the outfall. The layouts of these two pits are illustratedin Figures 7.3 and 7.4 respectively. If the smaller pit were to be developed,the Delineated Sand Resource would be reduced from 23.7 Mm3 to14 Mm3, of which only about 3.9 Mm3 would comprise the coarser ebbtide fades.
7.21 Dredging production rates, Sand Reserve quantities and costs are presentedfor bulk dredging using trailers, grabs and cutter suction dredgers.
Beneficiation and Material Losses
7.22 If grab dredgers are used to exploit the resource, the loss of fines can beassumed to be negligible. In the case of trailer dredgers and cutter suctiondredgers loading into barges, the overflow losses will be considerable. Inmany cases, the overflow losses increase as the transport distance becomeslonger because of the increasing need to ensure maximum loads. However,because the rate of loss is almost constant during loading in this case, thelosses will not vary significantly according to the transport distances.
7.23 The estimated overflow losses are set out in Table 7.1 for 5,000 m3 trailerdredgers and for 900 mm cutter suction dredgers loading into barges of1,000 m3 capacity. The losses are expressed as a percentage of the dryweight of soil. In the case of the trailer dredgers, losses have beendetermined without pre-loading the hopper with water. Pre-loadingincreases overflow losses by about 5% which offsets any economic benefitsof increased loading rates at most depths in the borrow area. The particlesize distributions of the resulting materials are shown in Figure 7.5.
42
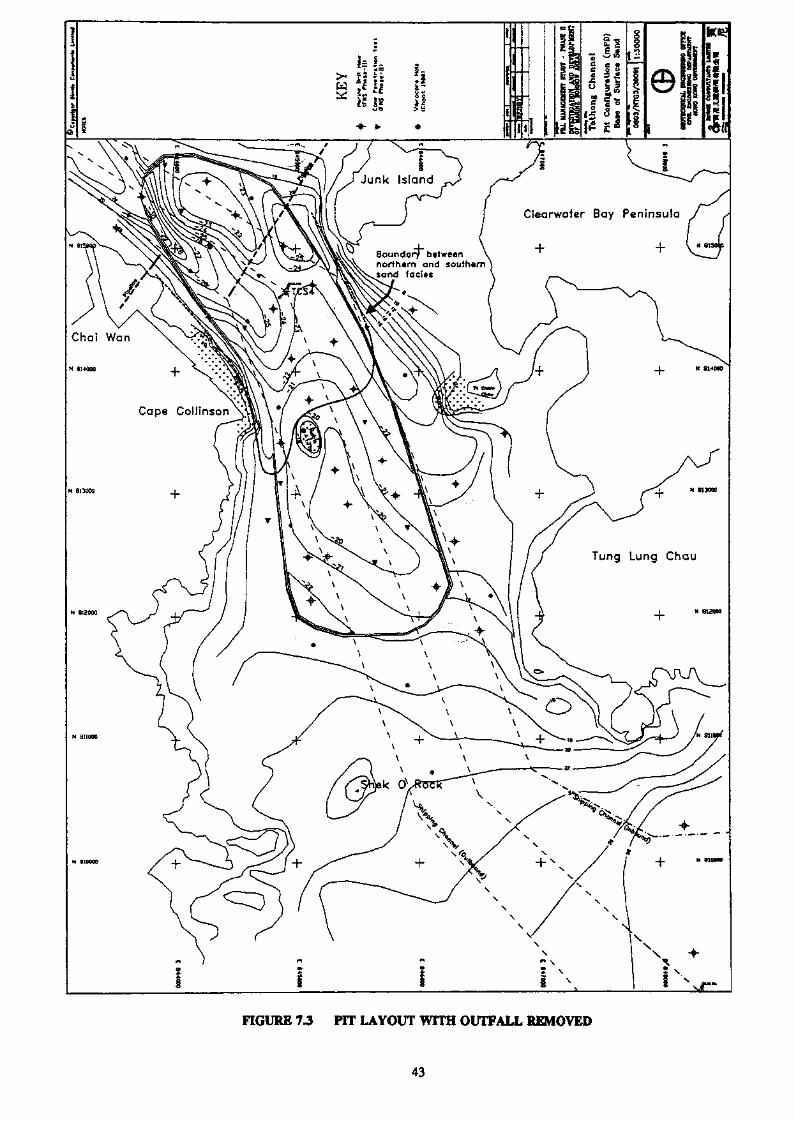
Clearwater Bay Peninsula
IBoundary betweennorthern and southernsand facias
FIGURE 7 J PIT LAYOUT WITH OUTFALL REMOVED
43
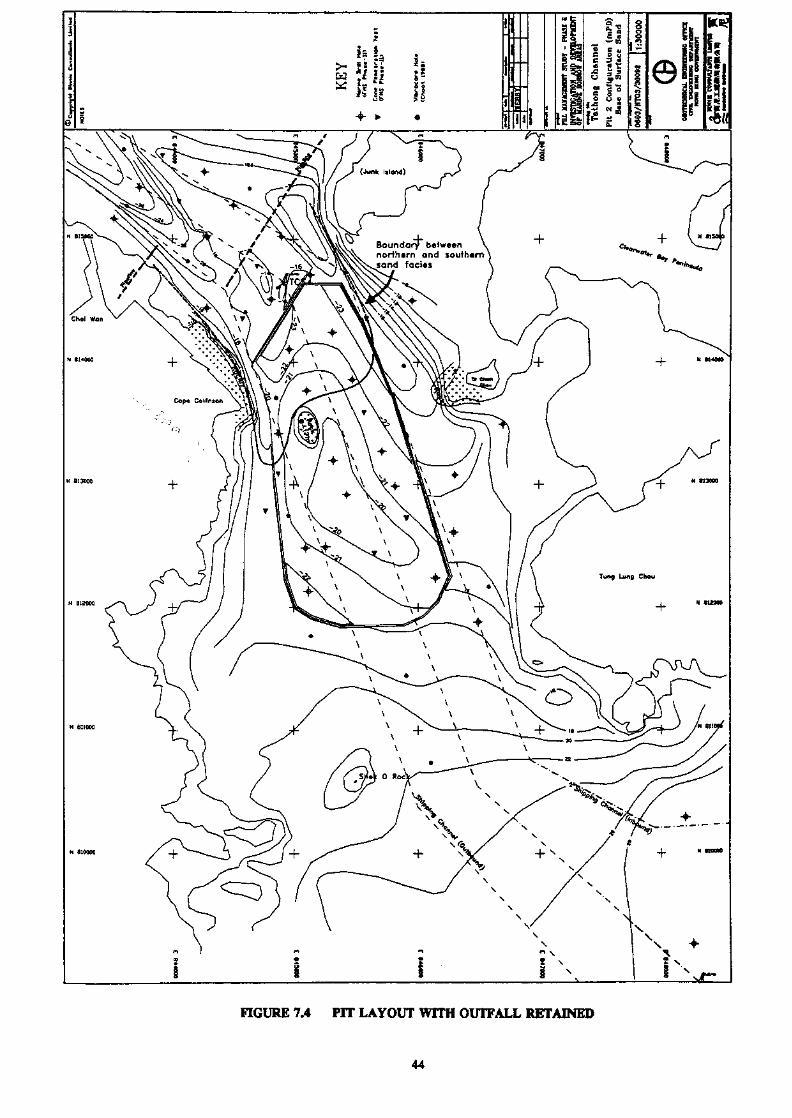
FIGURE 7.4 PIT LAYOUT WITH OUTFALL RETAINED
44
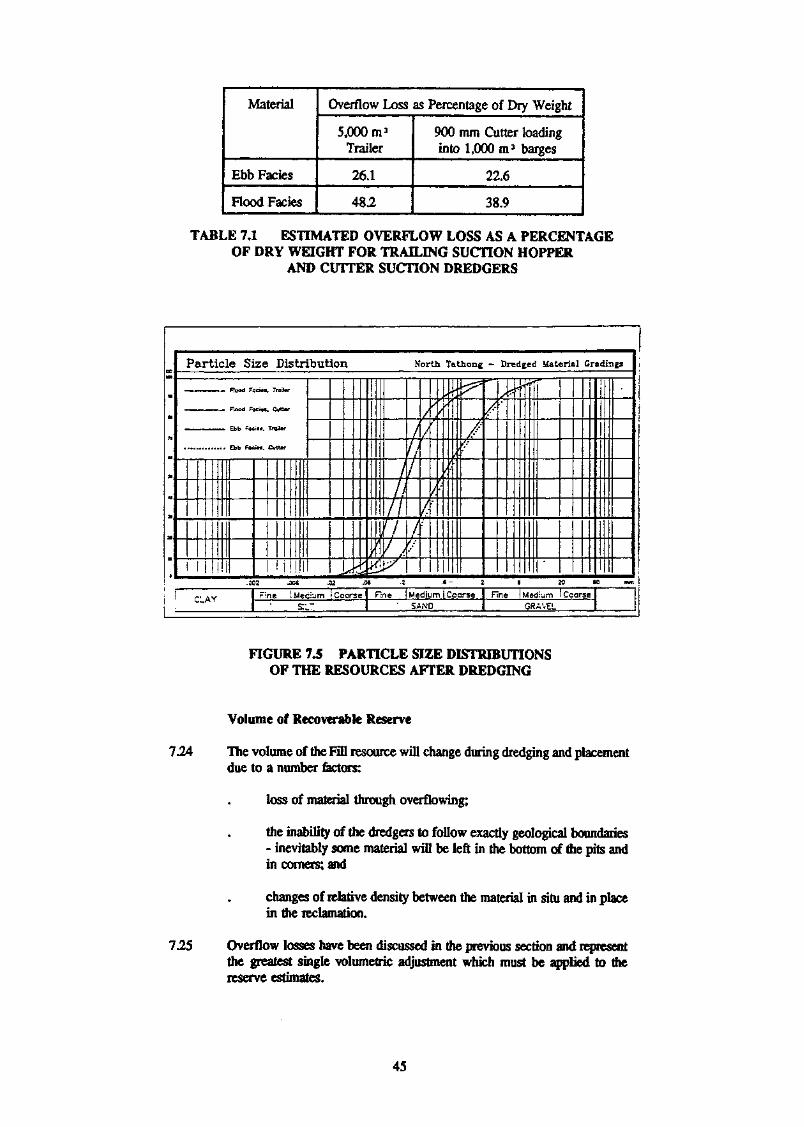
Material
Ebb Fades
Flood Facies
Overflow Loss as Percentage of Dry Weight
5,000m3
Trailer
26.1
482
900 mm Cutter loadinginto 1,000 m3 barges
22.6
38.9
TABLE 7.1 ESTIMATED OVERFLOW LOSS AS A PERCENTAGEOF DRY WEIGHT FOR TRAILING SUCTION HOPPER
AND CUTTER SUCTION DREDGERS
Particle Size Distribution North Tatfcong - Dredged Material Gradings
—_ ... _.., Flood F<M
*
ft
a
.a1 CLAY
3d«». Treflw
KI'M, Cutttr
i«*. Troil«r
j'w, Cutt«r
|
i i i i i ^*•-•p-2 .006 .02 .CM
F'ne !w«c:-jm i Coarse
^~ -
!
I
/
1/i
l\
1 I
V ,<XU^
l\1 :1
/.f :
//
I
'
X
^/
~)
\
//-
' .
/
^T" !
1
it .1 . 1 - 2 8 20 U
Hnc 1 Medium i Coarse' SAND
Fine 1 Medium 1 CoarseGRAVEL
mm
i
FIGURE 7S PARTICLE SIZE DISTRIBUTIONSOF THE RESOURCES AFTER DREDGING
Volume of Recoverable Reserve
7.24 The volume of the FiD resource will change during dredging and placementdue to a number factors:
loss of material through overflowing;
the inability of the dredgers to follow exactly geological boundaries- inevitably some material will be left in the bottom of the pits andin coiners; ant
changes of relative density between the material in situ and in placein the reclamation.
725 Overflow losses have been discussed in the previous section and representthe greatest single volumetric adjustment which must be applied to (hereserve estimates.
45
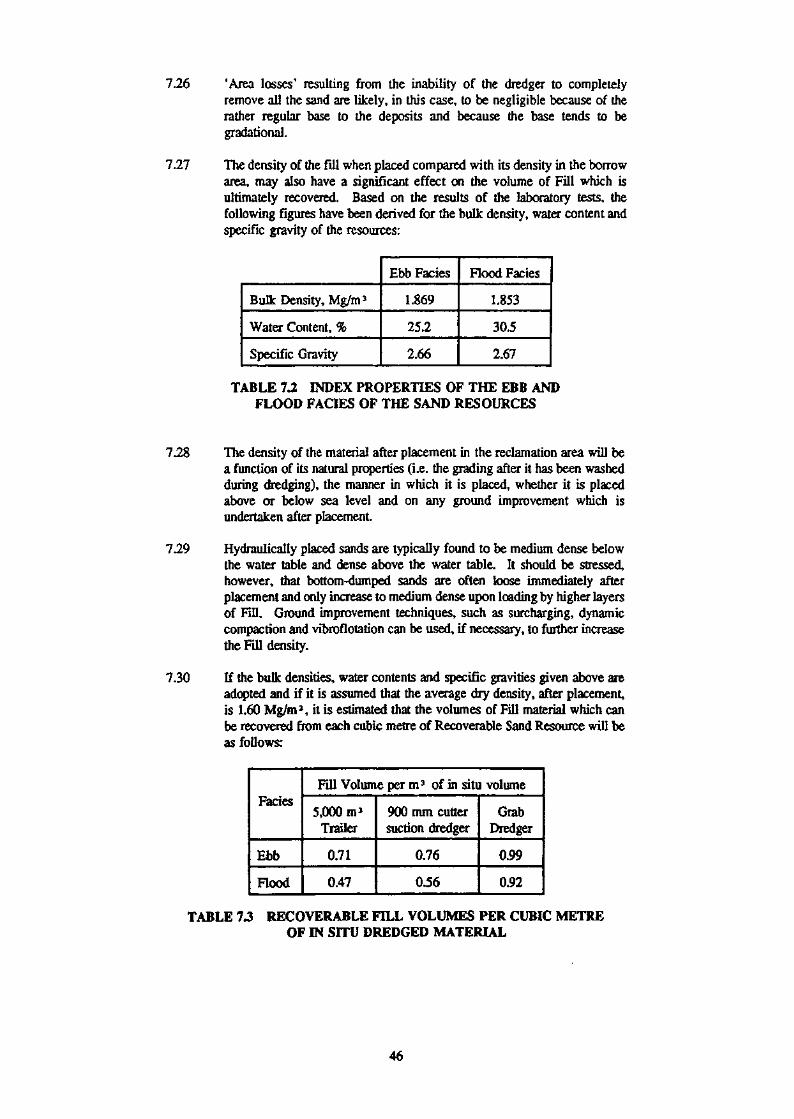
7.26 'Area losses' resulting from the inability of the dredger to completelyremove all the sand are likely, in this case, to be negligible because of therather regular base to the deposits and because the base tends to begradational.
7.27 The density of the fill when placed compared with its density in the borrowarea, may also have a significant effect on the volume of Fill which isultimately recovered. Based on the results of the laboratory tests, thefollowing figures have been derived for the bulk density, water content andspecific gravity of the resources:
Bulk Density, Mg/m}
Water Content, %
Specific Gravity
Ebb Facies
1.869
252
2.66
Rood Facies
1.853
30.5
2.67
TABLE 7 J INDEX PROPERTIES OF THE EBB ANDFLOOD FACIES OF THE SAND RESOURCES
7.28 The density of the material after placement in the reclamation area will bea function of its natural properties (i.e. the grading after it has been washedduring dredging), the manner in which it is placed, whether it is placedabove or below sea level and on any ground improvement which isundertaken after placement.
7.29 Hydraulically placed sands are typically found to be medium dense belowthe water table and dense above the water table. It should be stressed,however, that bottom-dumped sands are often loose immediately afterplacement and only increase to medium dense upon loading by higher layersof Fill. Ground improvement techniques, such as surcharging, dynamiccompaction and vibroflotation can be used, if necessary, to further increasethe Fill density.
7.30 If the bulk densities, water contents and specific gravities given above areadopted and if it is assumed that the average dry density, after placement,is L60 Mg/m3, it is estimated that the volumes of Fill material which canbe recovered from each cubic metre of Recoverable Sand Resource will beas follows:
Facies
Ebb
Flood
Fill Volume per m3 of in situ volume
5,000 m>Trailer
0.71
0.47
900 mm cuttersuction dredger
0.76
0.56
GrabDredger
0.99
0.92
TABLE 73 RECOVERABLE FILL VOLUMES PER CUBIC METREOF IN SITU DREDGED MATERIAL
46
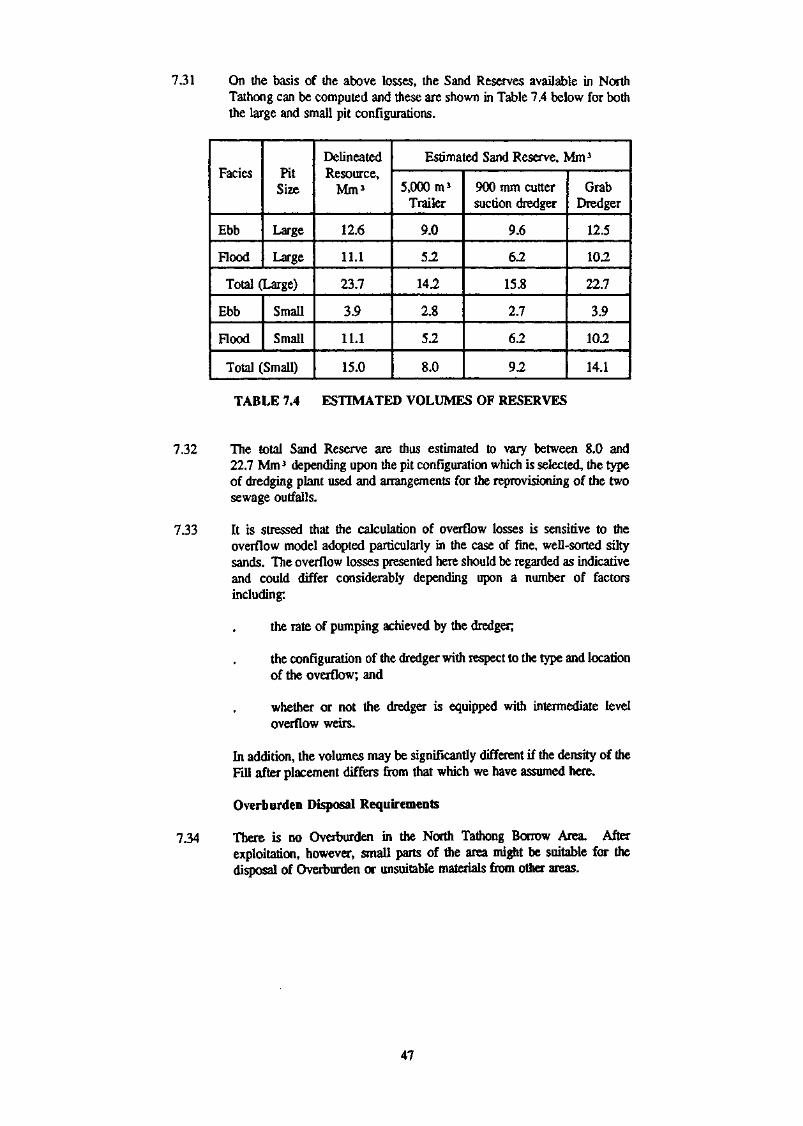
7.31 On the basis of the above losses, the Sand Reserves available in NorthTathong can be computed and these are shown in Table 7.4 below for boththe large and small pit configurations.
Fades
Ebb
Hood
PitSize
Large
Large
Total (Large)
Ebb
Hood
Small
Small
Total (Small)
DelineatedResource,
Mm3
12.6
11.1
23.7
3.9
11.1
15.0
Estimated Sand Reserve, Mm3
5,000m3
Trailer
9.0
52
142
2.8
5.2
8.0
900 mm cuttersuction dredger
9.6
62
15.8
2.7
6.2
9.2
GrabDredger
12.5
10.2
22.7
3.9
10.2
14.1
TABLE 7.4 ESTIMATED VOLUMES OF RESERVES
7.32 The total Sand Reserve are thus estimated to vary between 8.0 and22.7 Mm3 depending upon the pit configuration which is selected, the typeof dredging plant used and arrangements for the reprovisioning of the twosewage outfalls.
7.33 It is stressed that the calculation of overflow losses is sensitive to theoverflow model adopted particularly in the case of fine, well-sorted siltysands. The overflow losses presented here should be regarded as indicativeand could differ considerably depending upon a number of factorsincluding:
the rate of pumping achieved by the dredger,
the configuration of the dredger with respect to the type and locationof the overflow; and
whether or not the dredger is equipped with intermediate leveloverflow weirs.
In addition, the volumes may be significantly different if the density of theFill after placement differs from that which we have assumed here.
Overburden Disposal Requirements
734 There is no Oveiburden in the North Tathong Borrow Area. Afterexploitation, however, small parts of the area might be suitable for thedisposal of Overburden or unsuitable materials from other areas.
47
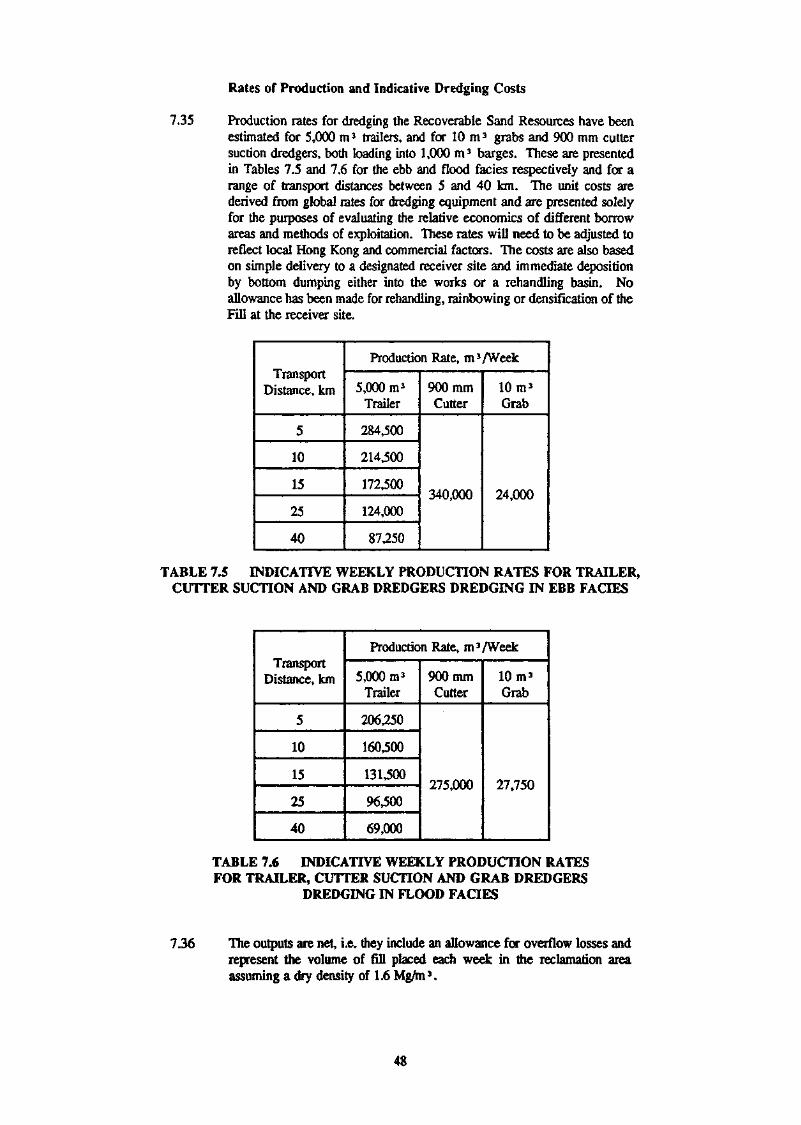
Rates of Production and Indicative Dredging Costs
735 Production rates for dredging the Recoverable Sand Resources have beenestimated for 5,000 m 3 trailers, and for 10 m3 grabs and 900 mm cuttersuction dredgers, both loading into 1,000 m3 barges. These are presentedin Tables 7.5 and 7.6 for the ebb and flood facies respectively and for arange of transport distances between 5 and 40 km. The unit costs arederived from global rates for dredging equipment and are presented solelyfor the purposes of evaluating the relative economics of different borrowareas and methods of exploitation. These rates will need to be adjusted toreflect local Hong Kong and commercial factors. The costs are also basedon simple delivery to a designated receiver site and immediate depositionby bottom dumping either into the works or a rehandling basin. Noallowance has been made for rehandling, rainbowing or densification of theFill at the receiver site.
TransportDistance, km
5
10
15
25
40
Production Rate, m3/Week
5,000 m j
Trailer
284,500
214400
172,500
124,000
87,250
900mmCutter
340,000
10m3
Grab
24,000
TABLE 7.5 INDICATIVE WEEKLY PRODUCTION RATES FOR TRAILER,CUTTER SUCTION AND GRAB DREDGERS DREDGING IN EBB FACIES
TransportDistance, km
5
10
15
25
40
Production Rate, m3/Week
5,000 m j
Trailer
206,250
160,500
131400
96400
69,000
900mmCutter
275,000
10 m»Grab
27,750
TABLE 7.6 INDICATIVE WEEKLY PRODUCTION RATESFOR TRAILER, CUTTER SUCTION AND GRAB DREDGERS
DREDGING IN FLOOD FACIES
736 The outputs are net, Le. they include an allowance for overflow losses andrepresent the volume of fill placed each week in the reclamation areaassuming a dry density of 1.6 Mg/m3.
48
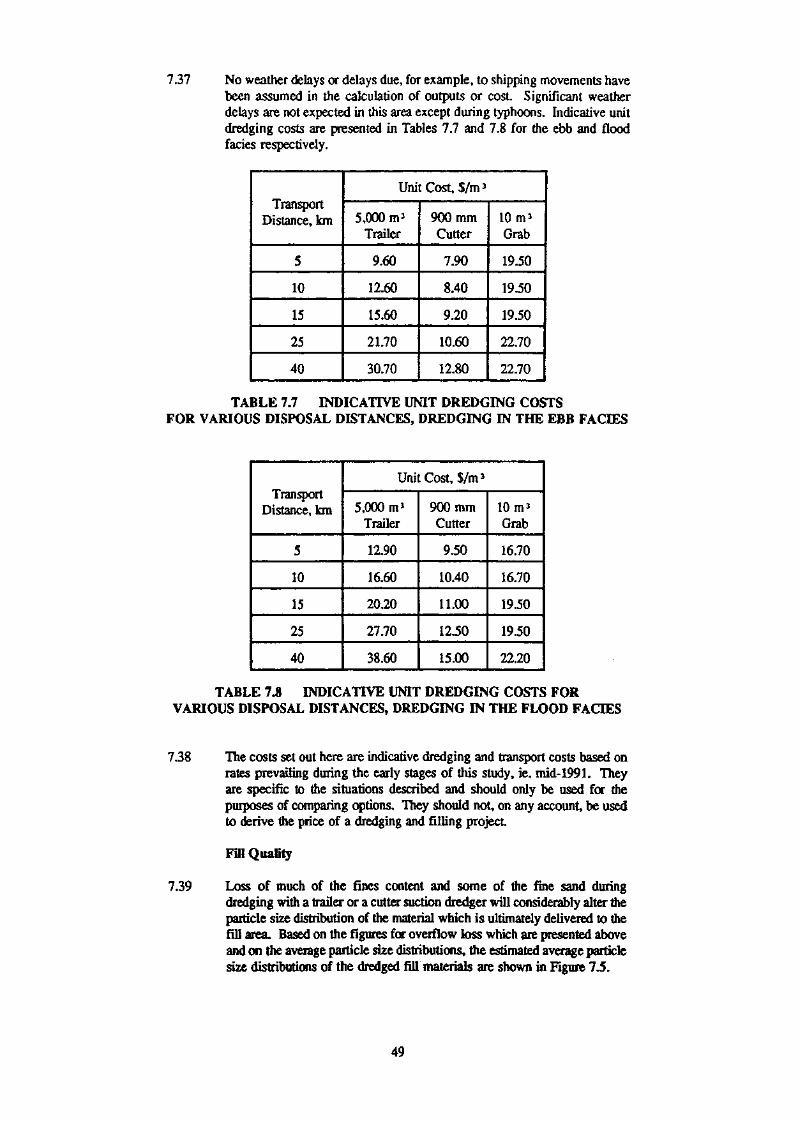
7.37 No weather delays or delays due, for example, to shipping movements havebeen assumed in the calculation of outputs or cost. Significant weatherdelays are not expected in this area except during typhoons. Indicative unitdredging costs are presented in Tables 7.7 and 7.8 for the ebb and floodfades respectively.
TransportDistance, km
5
10
15
25
40
Unit Cost, $/m3
5,000 m'Trailer
9.60
12.60
15.60
21.70
30.70
900mmCutter
7.90
8.40
9.20
10.60
12.80
10m3
Grab
19.50
19.50
19.50
22.70
22.70
TABLE 7.7 INDICATIVE UNIT DREDGING COSTSFOR VARIOUS DISPOSAL DISTANCES, DREDGING IN THE EBB FACBES
TransportDistance, km
5
10
15
25
40
Unit Cost, $/m3
5,000m3
Trailer
12.90
16.60
20.20
27.70
38.60
900mmCutter
9.50
10.40
11.00
12.50
15.00
10m3
Grab
16.70
16.70
19.50
19.50
22.20
TABLE 7J INDICATIVE UNIT DREDGING COSTS FORVARIOUS DISPOSAL DISTANCES, DREDGING IN THE FLOOD FACIES
7.38 The costs set out here are indicative dredging and transport costs based onrates prevailing during the early stages of this study, ie. mid-199L Theyare specific to the situations described and should only be used for thepurposes of comparing options. They should not, on any account, be usedto derive the price of a dredging and filling project
Fill Quality
7.39 Loss of much of the fines content and some of the fine sand duringdredging with a trailer or a cutter suction dredger will considerably alter theparticle size distribution of the material which is ultimately delivered to thefill area. Based on the figures for overflow toss which are presented aboveand on the average particle size distributions* the estimated average particlesize distributions of the dredged fill materials are shown in Figure 7.5.
49
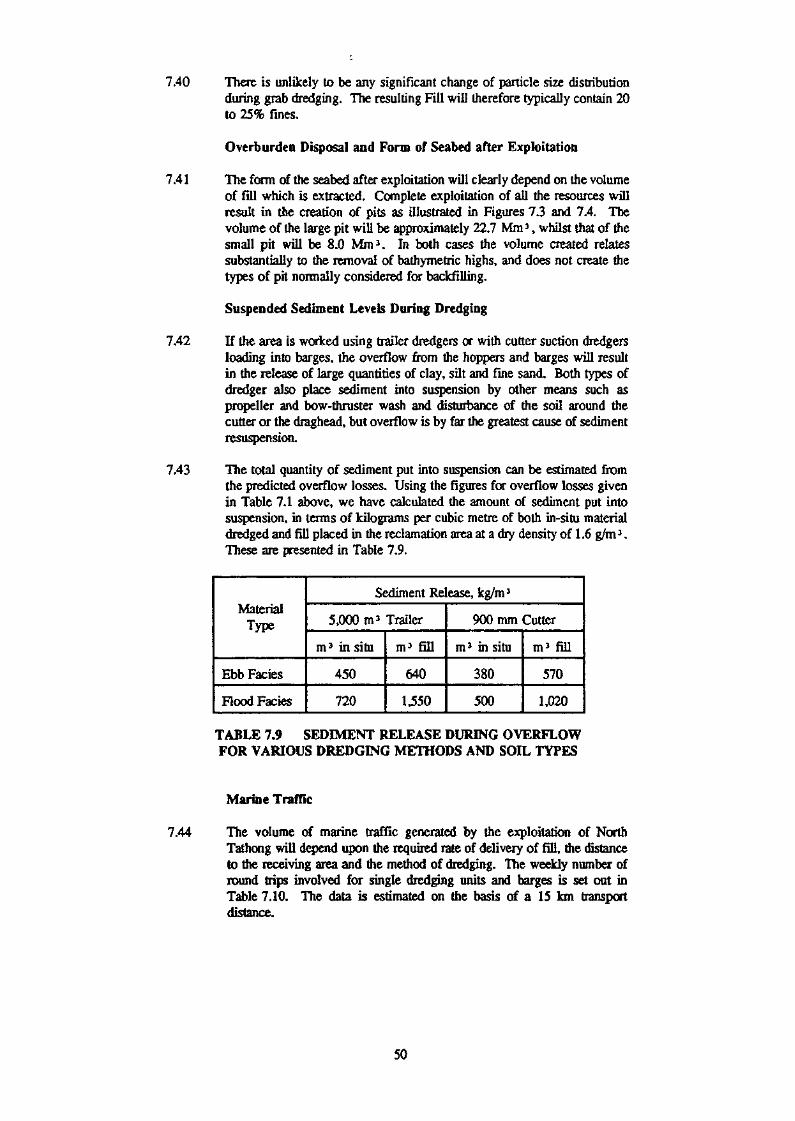
7.40 There is unlikely to be any significant change of particle size distributionduring grab dredging. The resulting Fill will therefore typically contain 20to 25% fines,
Overburden Disposal and Form of Seabed after Exploitation
7.41 The form of the seabed after exploitation will clearly depend on the volumeof fill which is extracted. Complete exploitation of all the resources willresult in the creation of pits as illustrated in Figures 7.3 and 7.4. Thevolume of the large pit will be approximately 22.7 Mm3, whilst that of thesmall pit will be 8.0 Mm3. In both cases the volume created relatessubstantially to the removal of bathymetric highs, and does not create thetypes of pit normally considered for backfilling.
Suspended Sediment Levels During Dredging
7.42 If the area is worked using trailer dredgers or with cutter suction dredgersloading into barges, the overflow from the hoppers and barges will resultin the release of large quantities of clay, silt and fine sand. Both types ofdredger also place sediment into suspension by other means such aspropeller and bow-thruster wash and disturbance of the soil around thecutter or the draghead, but overflow is by far the greatest cause of sedimentresuspension.
7.43 The total quantity of sediment put into suspension can be estimated fromthe predicted overflow losses. Using the figures for overflow losses givenin Table 7.1 above, we have calculated the amount of sediment put intosuspension, in terms of kilograms per cubic metre of both in-situ materialdredged and fill placed in the reclamation area at a dry density of 1.6 g/m3.These are presented in Table 7.9.
MaterialType
Ebb Fades
Flood Facies
Sediment Release, kg/m3
5,000m3 Trailer
m3 in situ
450
720
m 3 fill
640
1,550
900 mm Cutter
m3 in situ
380
500
m3 fill
570
1,020
TABLE 7.9 SEDIMENT RELEASE DURING OVERFLOWFOR VARIOUS DREDGING METHODS AND SOIL TYPES
Marine Traffic
7.44 The volume of marine traffic generated by the exploitation of NorthTathong will depend upon the required rate of delivery of fill, the distanceto the receiving area and the method of dredging. The weekly number ofround trips involved for single dredging units and barges is set out inTable 7.10. The data is estimated on the basis of a 15 km transportdistance.
50
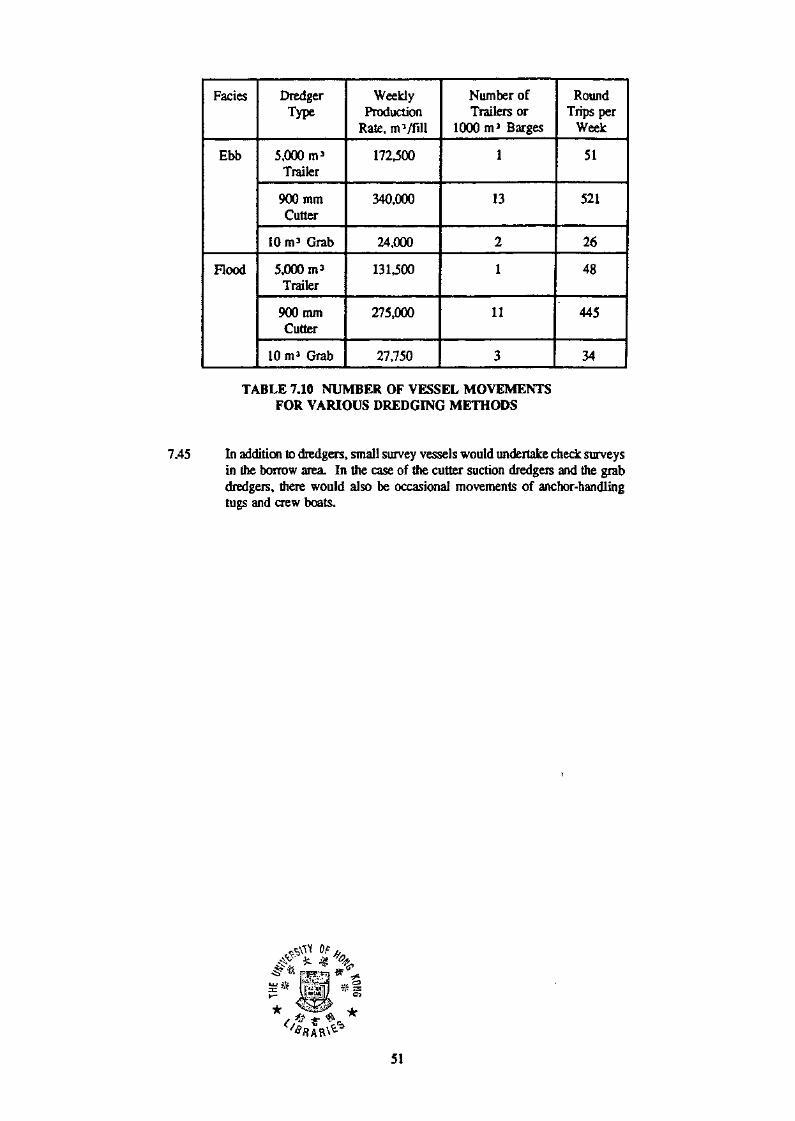
Fades
Ebb
Rood
DredgerType
5,000m3
Trailer
900mmCutter
10 m3 Grab
5,000m3
Trailer
900mmCutter
10m3 Grab
WeeklyProduction
Rate, m '/fill
172,500
340,000
24,000
131,500
275,000
27,750
Number ofTrailers or
1000m3 Barges
1
13
2
1
11
3
RoundTrips per
Week
51
521
26
48
445
34
TABLE 7.10 NUMBER OF VESSEL MOVEMENTSFOR VARIOUS DREDGING METHODS
7.45 In addition to dredgers, small survey vessels would undertake check surveysin the borrow area. In the case of the cutter suction dredgers and the grabdredgers, there would also be occasional movements of anchor-handlingtugs and crew boats.
51
8.0 MARITIME ASPECTS OF BORROW AREA DEVELOPMENT
General
8.1 Chapter 2 of this report presented the general maritime characteristics andconstraints of the North Tathong area as shown on the Admiralty ChartBA 1917. This section is limited to the maritime aspects of the particulardredging proposals and development of the marine borrow area.
Vessels Engaged in Dredging and Transportation
8.2 As discussed in Chapter 7, the choice for the type dredger for exploitionand transportation of the Sand Resource is dependent upon the size of theallocated borrow area and the rate of production required for that particularproject. An estimate of the possible increase in marine traffic resultingfrom deployment of different type of dredgers supplying a receiver site inmid harbour (15 km) is given in Table 7.10.
8.3 It can be seen that the use of either a trailing suction hopper dredger ora grab dredger will cause a slight increase in daily marine traffic (8-15 extratransits over the normal 100 transits)* Such an increase in marine traffic,when viewed in isolation is unlikely to have a significant impact on thenormal marine traffic in the area. However, the cumulative effect of severalprojects generating similar volumes of marine traffic using the TathongChannel may require more detailed planning. The Development Plans tobe prepared for proposal of firm allocation of the borrow area should assessthe maritime constraints on concurrent working of major projects whichmay affect the geometry and the timing of the allocations.
8.4 The barge traffic necessary for efficient operation of a cutter suctiondredger is considered to be unacceptable if barges have to transit the TrafficSeparation Scheme (TSS) to sail for the receiver site for a mid harbourproject. However, assuming that adequate provision has been made forsewage outfalls, it is considered that the portion of Sand Resources at thenorth side of the TSS between Junk Island and Lei Yue Mun could beexploited with a cutter suction dredger for a receiver site in Junk BayDevelopment, Floating or submerged pipelines could be used to deliver thesand. There is also possibility to temporarily re-align the TSS southwardsto maximise the volume of Sand Resource to be worked by this method.
Maintenance of Safe Navigation
8.5 The North Tathong Borrow Area is outside the Hong Kong harbour limitsbut lies on the TSS for vessels entering and departing the Port Dredgingvessels approaching or leaving the borrow area should cross or join theapproaches to the channels as laid down by the International Regulations forPreventing Collisions at Sea. Masters of dredgers should be fully qualifiedto pilot their own vessels within the Port of Hong Kong.
8.6 The maintenance of good communications and the issue of adequatenotification of dredging operations to all other vessels entering and usingthe Port is of paramount importance. Information is supplied to all Portusers and other vessels by the promulgation of Notices to Mariners, issuedby the Marine Department, supported if necessary by Radio NavigationalWarnings.
52
8.7 All dredging operations and transportation should be covered by a Noticeto Mariners which should include dates, areas and description of operation,along with any special instructions to vessels with regard to the safenavigation procedures that may be deemed appropriate by the MarineDepartment. There is a minimum two week lead time between the MarineDepartment being informed of the intended work and the appropriate noticebeing published.
8.8 Dredging operations taking place in the area will be under the surveillanceof the Vessel Traffic Centre (VTQ, but even so VTC should be keptinformed by VHP of the position of the dredgers and any support craftIdentified vessels closing on the dredging operation can be informed of theoperations taking place and be passed directions by the VTC, if necessary.
8.9 At the stage when the North Tathong borrow area has been assigned to aparticular project and the dredging and dumping options and programme areknown, it will be necessary to liaise with Marine Department to ensure thatthe proposals comply with local and international regulations, as well as anyconditions that may be imposed by the Hong Kong Marine Department
8.10 It is recommended that an overall management scheme be adopted to keeptrack of all dredging and dredging related activities and to keep all portusers fully informed as to the status of borrow pit development This wouldinclude position of deep pits, depth and seabed types within and adjacent tothese borrow areas. Pilots and masters of vessels should be kept fullyinformed of these developments, and the likely impact on safe passage oftheir vessels, including up to date information relevant to emergencyanchoring criteria.
Emergency Anchoring
8.11 Most of the proposed borrow area lies within the TSS. As required by theInternational Regulation for Preventing Collisions at Sea, anchoring withinand near the terminations of the TSS is to be avoided as far as possibleexcept for emergency. The removal of the bathymetric high at the south ofthe buoy TCS4, will create a platform at -20 to -23 mPD. This depth istypical of other parts of the TSS and should have no detrimented effect anemergency anchoring. North of TCS4 the pit represents an extension of thenaturally deepened channel in the TSS and should similarly have nodetrimental effect on emergency anchoring. Backfilling of the pit withOverburden material is not considerd necessary to restore the anchorholding characteristics of the seabed.
Navigational Mark
8.12 The lit buoy TCS4 marking the altering of course of the TSS at the northernend of Tathong Channel would need to be temporarily lifted and relaidwhen the sand beneath the buoy is exploited. Any change in the status ofthe buoy must be covered by a Notice to Mariners.
53
9.0 ENVIRONMENTAL ASPECTS OF BORROW AREADEVELOPMENT
General
9.1 An Environmental Review (ER) of the potential effects of dredging in andaround the North Tathong Channel was prepared in response toitem 4.3.2(b) of the Brief for Agreement No. CE 42/90. The ER waspresented in Februay 1991 and was based on a search and analysis of allrelevant existing data and practice. The ER comprised a project profile, areview of the potential effects of the perceived dredging activities, andrecommendations; k concluded that dredging had only limited potential fordetrimental effects. The ER was endorsed by Government
92 The impacts due to dredging as identified in the ER are summarized andpresented in the check-list or review matrix (see Figure 9.1). In generalimpacts were considered likely to be modest or minimal. Medium impactswere predicted in respect of the potential for the release of inert solids,disruption of marine traffic and noise arising from the dredging process.
Updated Review
9.3 The detailed field investigation in Sections 3 and 4 of this report and theSand Resources and dredging assessments in Sections 6 and 7 have provedpotential Sand Reserves for North Tathong to be considerably in excess ofthat envisaged at the outset of the study. In general the sand deposits haveproved to extend further south of the Target area comprising a coarse butvariable ebb tide facies and a less variable finer-grained flood tide facies ofthe surface marine sand. No Overburden is present but some thin silt/clayinterbeds are identified in the ebb facies.
9.4 An updated review is considered necessary as a result of the southwardsextension and increase in size of the borrow area and the nature of thematerials encountered. The findings of the updated review are presented inFigure 9.1. Particular aspects are discussed in the following sections.
Revised Impact Assessment
Release of Inert Solids
9.5 As discussed in Chapter 7, the most effective method of exploiting andtransporting the Sand Resources for major reclamation projects is by trailinghopper suction dredger. Stationary cutter suction dredger and grab dredgercould be used for working out small areas allocated to smaller projects.Losses of fine sediments to the water column by grab dredgers are usuallynegligible. Overflowing from trailer and cutter dredgers, which has theadditional benefit of improving the engineering properties of the dredgedmaterial, will be the major source of sediment release to the water column.
54
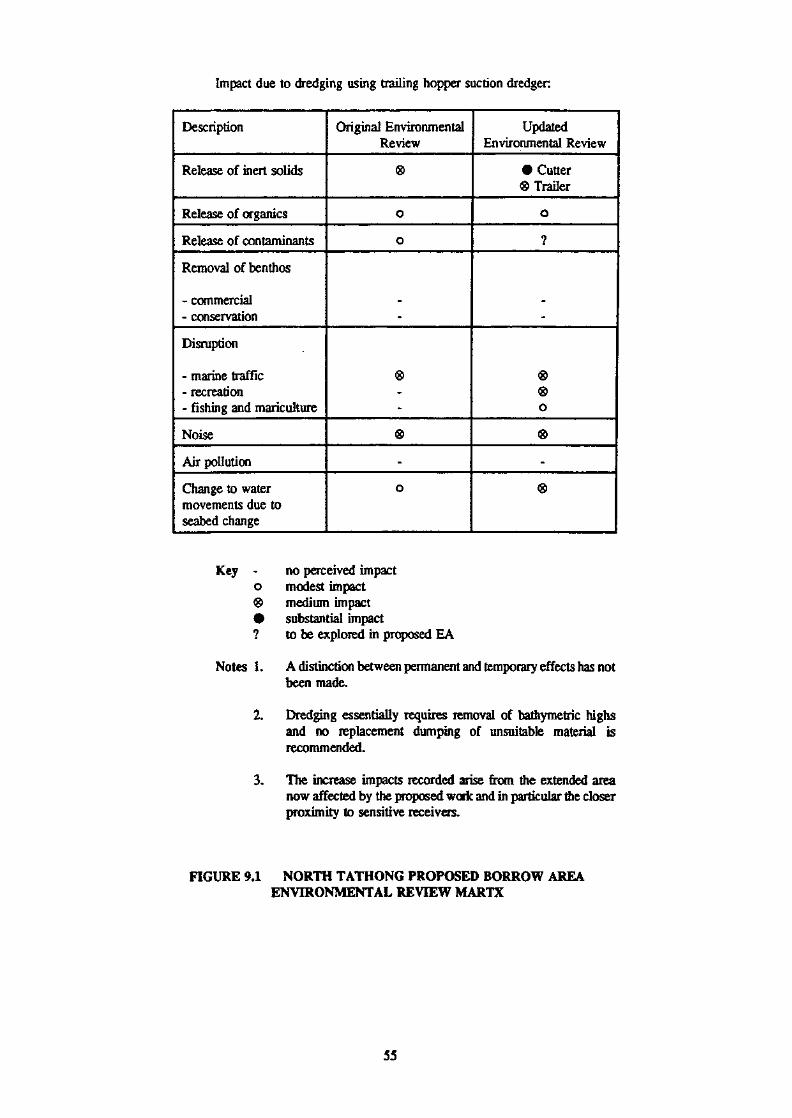
Impact due to dredging using trailing hopper suction dredger
Description
Release of inert solids
Release of organics
Release of contaminants
Removal of benthos
- commercial- conservation
Disruption
- marine traffic- recreation- fishing and mariculture
Noise
Air pollution
Change to watermovements due toseabed change
Original EnvironmentalReview
®
o
o
-
®
S>
-
o
UpdatedEnvironmental Review
• Cutter® Trailer
o
?
.
®®0
®
.
®
Key - no perceived impacto modest impact® medium impact• substantial impact? to be explored in proposed EA
Notes 1. A distinction between permanent and temporary effects has notbeen made.
2. Dredging essentially requires removal of bathymetric highsand no replacement dumping of unsuitable material isrecommended.
3. The increase impacts recorded arise from the extended areanow affected by the proposed work and in particular the closerproximity to sensitive receivers.
FIGURE 9.1 NORTH TATHONG PROPOSED BORROW AREAENVIRONMENTAL REVIEW MARTX
55
9.7 The enlarged borrow area covers approximately 4 sq.km of seabedextending between Chai Wan and Big Wave Bay (see Figure 2.2). Winningand overflowing of the marine sand deposits either by trailer or cuttersuction dredger will release large quantities of fine sediment into the watercolumn, much of which will descend rapidly to the sea floor in the form ofa density current The remaining and finest material stays in the watercolumn for a number of hours and is transported out of the area primarilyby tidal currents but also by wind driven surface currents. Examinaton ofthe WAHMO flow modelling results (Binnie & Partners et al, 1989)indicates that sediment plumes are likely to reach the Lei Yue Mun gap ona flood tide and can be expected to reach Big Wave Bay on some ebb tides,particularly during the winter months when the east and north-east windsprevail. Sediment plumes are much less likely to reach Shek 0 beach andare unlikely to reach Cape D'Aguilar, from this source.
9.8 The method of dredging and the nature of the material (whether derivedfrom the ebb or flood facies) are important in determining those volume ofmaterial likely to be released. Overflowing either by trailer or cutter islikely to release typically 26% and 48% respectively of the dry weight ofthe marine deposits in the ebb and flood facies. Grab dredgers are onlylikely to release very small quantities of sediment from either material.
9.9 The likely impact of releasing inert solids from the dredging of thesematerials is judged to be as follows:
a) (minimal) in the case of grab dredgers, losses are likely to be onlyseveral hundred tonnes per day for each establishment;
b) (modest to medium) for a single 5,000 m3 trailer dredger makingtypically seven trips per day from the ebb facies, where up to6,000 tonnes per day of fine sediment could be released;
c) (medium) for a single 5,000 m3 trailer dredger working the floodfacies, or a 900 mm cutter suction dredger working the ebb facieswhere typically 28,000 tonnes per day of fine sediment could bereleased; and
d) (substantial) for a 900 mm cutter working the flood facies wheretypically 40,000 tonnes per day of fine sediment could be released.
9.10 In case a), concurrent allocations of small areas using grab dredgers areallowed fcr but in cases b) and c) non-concurrent allocations within thewhole borrow area are assumed. Stationary cutter suction dredgers appearto have more significant impacts both environmentally and on maritimegrounds and thus cannot be recommended.
9.11 The analyses of heavy metal contents for seabed sediments undertaken inEPD's Contaminated Spoil Management Study (CSM Study) revealed thatthe level of contamination in outer Junk Bay and North Tathong area isgenerally low. Based on these results resuspension of seabed sedimentduring dredging is not likely to cause significant contamination of the watercolumn with heavy metals (see Figure 9.2 and Table 9.1).
56
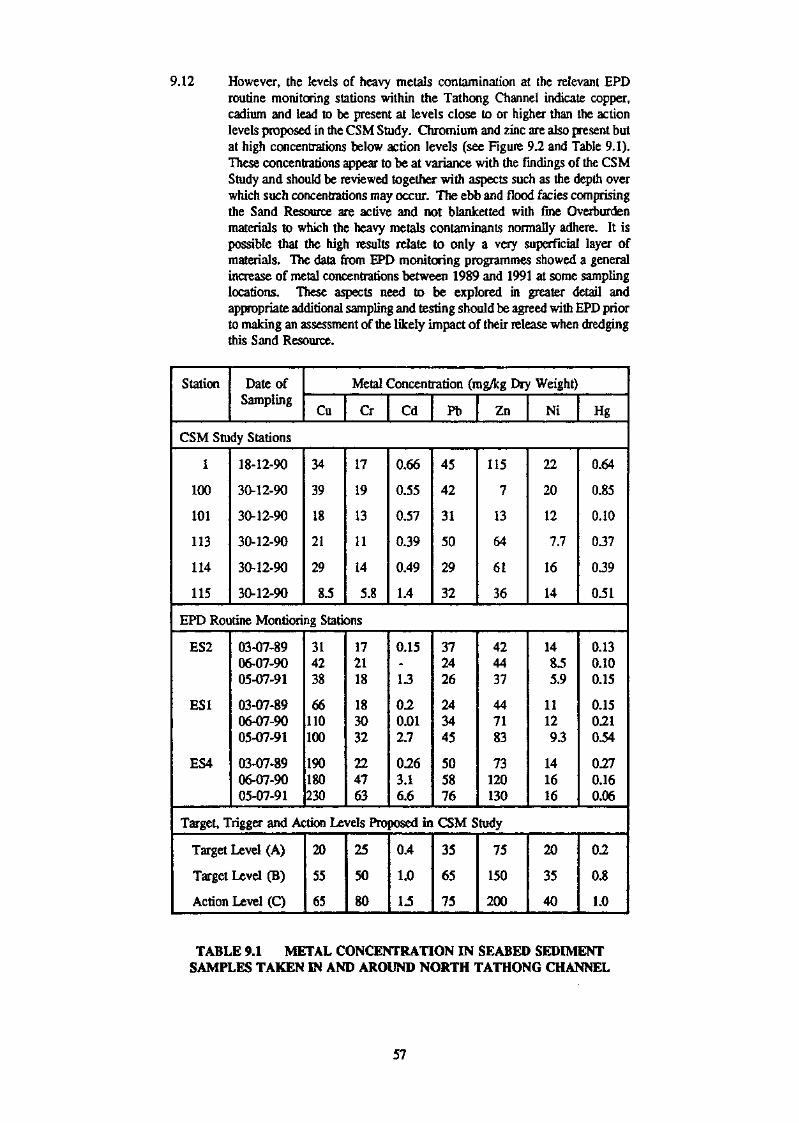
9.12 However, the levels of heavy metals contamination at the relevant EPDroutine monitoring stations within the Tathong Channel indicate copper,cadium and lead to be present at levels close to or higher than the actionlevels proposed in the CSM Study. Chromium and zinc are also present butat high concentrations below action levels (see Figure 9.2 and Table 9.1).These concentrations appear to be at variance with the findings of the CSMStudy and should be reviewed together with aspects such as the depth overwhich such concentrations may occur. The ebb and flood fades comprisingthe Sand Resource are active and not blanketted with fine Overburdenmaterials to which the heavy metals contaminants normally adhere. It ispossible that the high results relate to only a very superficial layer ofmaterials. The data from EPD monitoring programmes showed a generalincrease of metal concentrations between 1989 and 1991 at some samplinglocations. These aspects need to be explored in greater detail andappropriate additional sampling and testing should be agreed with EPD priorto making an assessment of the likely impact of their release when dredgingthis Sand Resource.
Station Date ofSampling
Metal Concentration (mg/kg Dry Weight)
Cu Cr Cd Pb Zn Ni Hg
CSM Study Stations
1
100
101
113
114
115
18-12-90
30-12-90
30-12-90
30-12-90
30-12-90
30-12-90
34
39
18
21
29
8.5
17
19
13
11
14
5.8
0.66
0.55
0.57
0.39
0.49
1.4
45
42
31
50
29
32
115
7
13
64
61
36
22
20
12
7.7
16
14
0.64
0.85
0.10
0.37
0.39
0.51
EPD Routine Montioring Stations
ES2
ESI
ES4
03-07-8906-07-9005-07-91
03-07-8906-07-9005-07-91
03-07-8906-07-9005-07-91
314238
66110100
190180230
172118
183032
224763
0.15
13
0.20.012.7
0263.16.6
372426
243445
505876
424437
447183
73120130
148.55.9
11129.3
141616
0.130.100.15
0.150.210.54
0.270.160.06
Target, Trigger and Action Levels Proposed in CSM Study
Target Level (A)
Target Level (B)
Action Level (C)
20
55
65
25
50
80
0.4
1.0
1.5
35
65
75
75
150
200
20
35
40
02
0.8
1.0
TABLE 9.1 METAL CONCENTRATION IN SEABED SEDIMENTSAMPLES TAKEN IN AND AROUND NORTH TATHONG CHANNEL
57
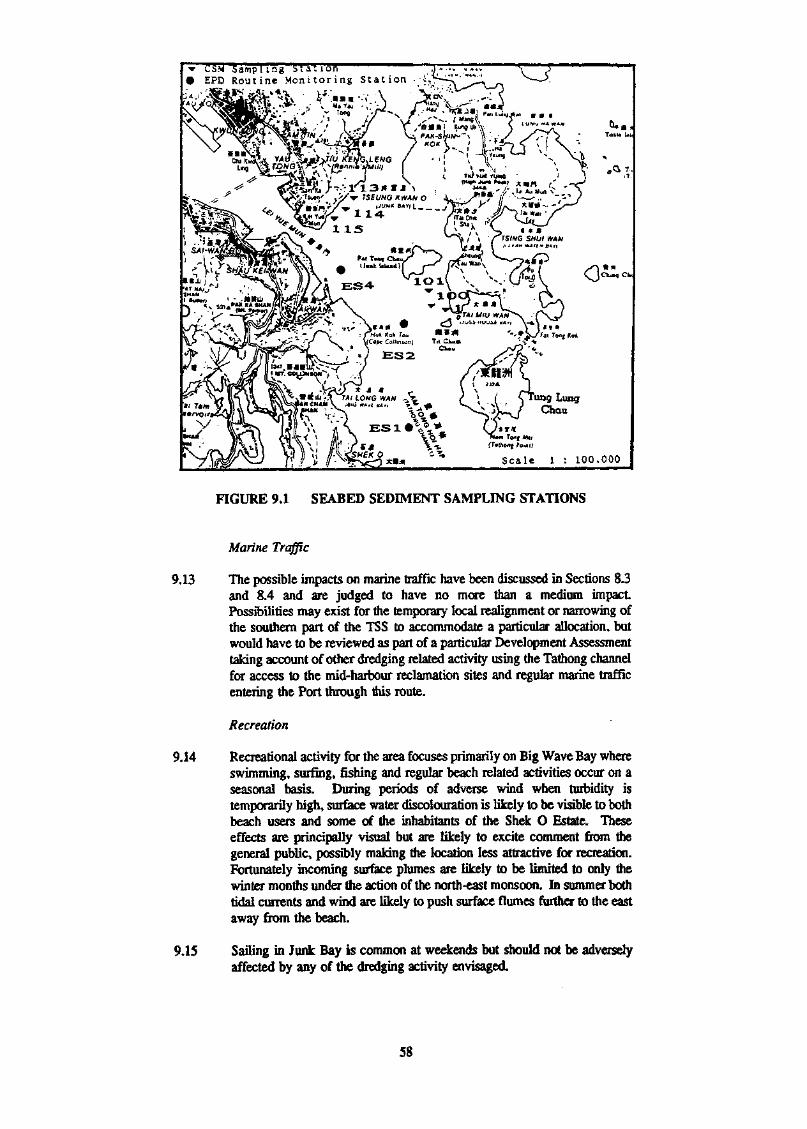
ung LungChau
FIGURE 9.1 SEABED SEDIMENT SAMPLING STATIONS
Marine Traffic
9.13 The possible impacts on marine traffic have been discussed in Sections 8.3and 8.4 and are judged to have no mere than a medium impactPossibilities may exist for the temporary local realignment or narrowing ofthe southern part of the TSS to accommodate a particular allocation, butwould have to be reviewed as part of a particular Development Assessmenttaking account of other dredging related activity using the Tathong channelfor access to the mid-harbour reclamation sites and regular marine trafficentering the Port through this route.
Recreation
9.14 Recreational activity for the area focuses primarily on Big Wave Bay whereswimming, surfing, fishing and regular beach related activities occur on aseasonal basis. During periods of adverse wind when turbidity istemporarily high, surface water discolouration is likely to be visible to bothbeach users and some of the inhabitants of the Shek O Estate* Theseeffects are principally visual but are likely to excite comment from diegeneral public, possibly making the location less attractive for recreation.Fortunately incoming surface plumes are likely to be limited to only thewinter months under the action of the north-east monsoon. In summer bothtidal currents and wind are likely to push surface flumes further to the eastaway from the beach.
9.15 Sailing in Junk Bay is common at weekends but should not be adverselyaffected by any of the dredging activity envisaged
58
Fishing and Mariculture
9.16 The mariculture zone at Tin Ha Wan was moved to north Tung Lung Chauas a result of the proposed reclamation work in the vicinity (SENTLandfill). Examination of the results of the WAHMO modelling (Binnie &Partners et al 1989) indicates that occasional increases of suspended solidsand in particular surface plumes can be expected of the new mariculturezone of Tung Lung Chau when an adverse combination of trailer dredgercycle, ebb tide current and winds from the south west occur. The arrivalof such plumes are likley to excite complaints from the operators of themariculture zone, no matter what the level of suspended solids. However,the proposed borrow area is not closer than 1.5 km to the zone andsuspended solids levels are not likely to reach the thresholds where thefitness of either fingerlings or adult fish occur. The Tung Lung Chaumariculture zone is not likely to be significantly affected by the proposeddredging operation.
9.17 The North Tathong Channel is not a popular fishing ground and hashistorically reported catches both low in weight and value. The onlyrecorded fish larvae collection sites in the area at Kennies Mill, have beenlost to the reclamation work in Junk Bay. The effect of dredging at NorthTathong on the fishing and mariculture is considered "modest11.
Noise
9.18 The edge strips of the borrow area, which lie outside the traffic separationscheme, are likely to be allocated to smaller projects employing grabdredgers. Noise from 24 hours dredging activity is likely to be audibleunder appropriate conditions at Siu Sai Wan and the Cape CollisionCorrectional Institution. Dwellings behind and to the south of Big WaveBay are sheltered proposed by the headland south of Tso Tui Wan. Trailerdredging activity within the delineated pit closest to Big Wave Bay istypically 1.5 to 2.0 km away from the nearest noise sensitive receiver andwhilst audible in appropriate weather conditions is not likely to contravenuecurrent noise legislation. The impact due to noise from the dredgingoperation remains to be "medium" as identified in the ER.
Hydrodynamics Wave Climate
9.19 The proposed dredge area amounts to the removal of highs and a generallowering erf the seabed rather than the generation of a regular deep pitSome distortion of the actual tidal flows is expected but the overall regimeshould not be unduly influenced. Big Wave Bay is already subject to theeffects of wave focussing around Shek O rock from waves originating fromthe southeast The lowering of the seabed to the east of Big Wave Baycould cause additional focussing of wave energy. The pit configurationshown has been prepared to maximise the Sand Resource but may haveparticular wave implications for Big Wave Bay* Further investigation of thepossible changes in wave regime at Big Wave Bay should also take acountof current deepening of the seabed between Tung Lung Chau and theexisting bathymetric high located between Shek O and Bokhara Rocks.Increased wave penetration and focussing of long period offshore generatedwaves and swell from the east and southeast is possible.
59
Utilities
9.20 The presence of the two submarine outfalls restricts the shape of borrow pitand small and large pits options are shown in Chapter 7 to take account ofeither relocating or retaining the pipes. The location of the pipelines havebeen determined from the record drawings. Modem electronic positioningsystems can be used to locate the dredging plant with an accuracy of 5 mhorizontally. It is considered that with the employment of these systemstogether with the knowledge of the accurate position of the pipelines, thepossibility of a dredger accidentally damaging the pipeline will be very low.Current studies and implementation of Strategic Sewage Disposal Schememay render both outfalls redundant in the late 1990s.
Proposed Environmental Assessment
9.21 An Environmental Assessment of the Tathong area (North and SouthTathong) comprising principally hydraulic and sediment studies wasproposed. The scope of the studies has still to be finalised with GEO andthe EA is expected to be carried out in late 1992.
9.22 The studies aim at defining the potential effects of dredging in the wholeof the Tathong area which include:
i) possible modification of the overall circulation pattern around HongKong Island;
ii) increase suspended sediment levels at nearby beaches and theproposed marine park at Cape D'Aguilan
iii) change in wave climate at nearby beaches and shoreline structures;and
iv) quantification of the potential for the release of contaminants in bedsediments into the water column during dredging.
The assessment will be targeted at establishing the significance of theseeffects so that any necessary operational mitigation measures can beformulated.
Environmental Controls
9.23 At this stage, no new special environmental control measures arerecommended in the exploitation of the North Tathong Borrow Area otherthan effective enforcement of operative environmental protection legislationpending the findings of the proposed EA. The legislation and theresponsible authority is listed below:
Director of Environmental Protection
i) Chapter 358 (Water Pollution Control Ordinance)
Western Buffer Water Control Zone (to be declared1992/1993)
The Dumping at Sea Act 1974 [Overseas Territory] Order(1975)
Chapter 400 (Noise Control Ordinance)
Noise of Construction Sites other than Percussive Piling
60

Director of Marine
i) The Merchant Shipping (Prevention and Control of Pollution)Ordinance 1990
Director of Agriculture and Fisheries
i) Chapter 171 (Fisheries Protection Ordinance)
ii) Chapter 353 (Marine Fish Culture Ordinance)
61
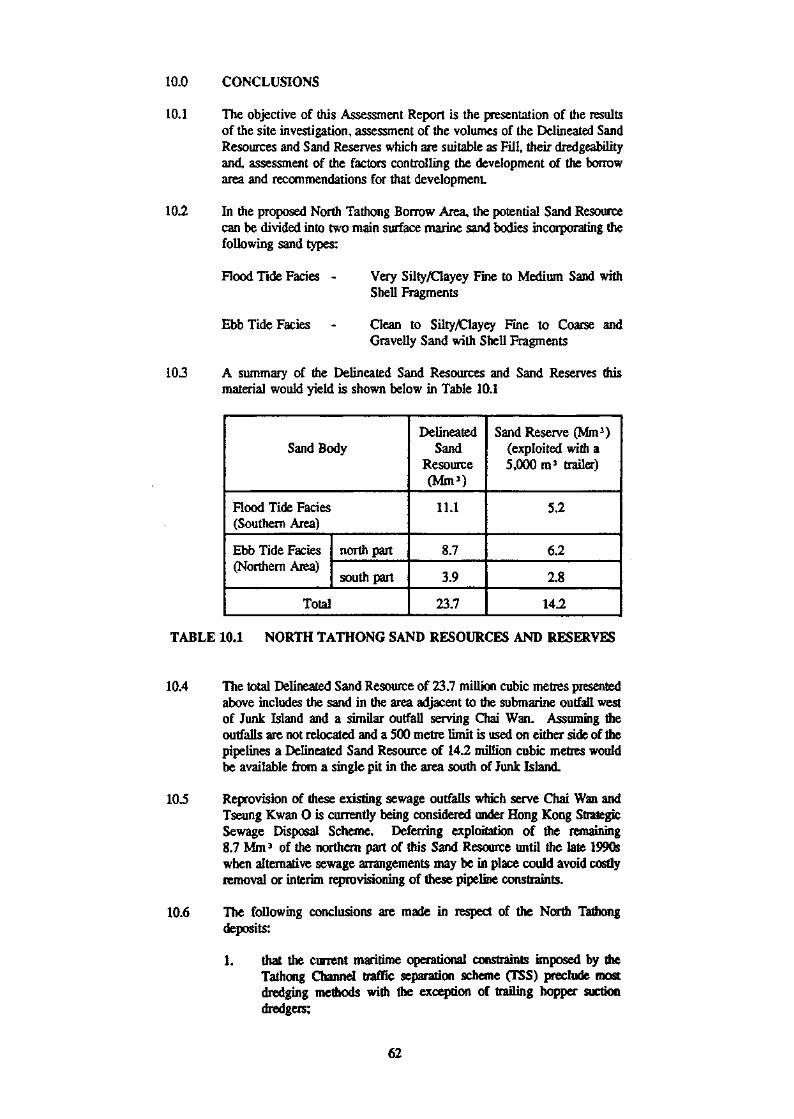
10.0
10.1
10.2
CONCLUSIONS
The objective of this Assessment Report is the presentation of the resultsof the site investigation, assessment of the volumes of the Delineated SandResources and Sand Reserves which are suitable as Fill, their dredgeabilityand, assessment of the factors controlling the development of the borrowarea and recommendations for that development
In the proposed North Tathong Borrow Area, the potential Sand Resourcecan be divided into two main surface marine sand bodies incorporating thefollowing sand types:
Flood Tide Fades -
Ebb Tide Fades
Very Silty/Clayey Fine to Medium Sand withShell Fragments
Clean to Silty/Clayey Fine to Coarse andGravelly Sand with Shell Fragments
10.3 A summary of the Delineated Sand Resources and Sand Reserves thismaterial would yield is shown below in Table 10.1
Sand Body
Flood Tide Facies(Southern Area)
Ebb Tide Facies(Northern Area)
north part
south part
Total
DelineatedSand
Resource(Mm3)
11.1
8.7
3.9
23.7
Sand Reserve (Mm3)(exploited with a5,000 m3 trailer)
5.2
6.2
2.8
142
TABLE 10.1 NORTH TATHONG SAND RESOURCES AND RESERVES
10.4 The total Delineated Sand Resource of 23.7 million cubic metres presentedabove includes the sand in the area adjacent to the submarine outfall westof Junk Island and a similar outfall serving Chai Wan. Assuming theoutfalls are not relocated and a 500 metre limit is used on either side of thepipelines a Delineated Sand Resource of 14.2 million cubic metres wouldbe available from a single pit in the area south of Junk Island.
10.5 Reprovision of these existing sewage outfalls which serve Chai Wan andTseung Kwan O is currently being considered under Hong Kong StrategicSewage Disposal Scheme. Deferring exploitation of the remaining8.7 Mm3 of the northern part of this Sand Resource until the late 1990swhen alternative sewage arrangements may be in place could avoid costlyremoval or interim reprovisioning of these pipeline constraints.
10.6 The following conclusions are made in respect of the North Tathongdeposits:
1. that the current maritime operational constraints imposed by theTathong Channel traffic separation scheme (TSS) preclude mostdredging methods with the exception of trailing hopper suctiondredgers;
62
2. fully mobile trailer dredgers operating in an irregular loop patterncommensurate with the rules of the TSS and the specificrequirements of Marine Department is the most feasible method forwinning this resource;
3. that the economics of the recovery by trailer dredger of the SandResources and material improvement will necessitate some hopperoverflowing. The overflow losses are predicted to be 26% the dryweight in the ebb facies and up to 48% in the flood fades;
4. that fully mobile trailer dredgers are probably the most economicmethod of exploiting these Sand Resources. A single 5,000 m*trailer dredger serving a 15 km distant receiver site can be expectedto yield up to 131,500 m* Fill per week when working the southernsand body. The northern sand body, the ebb facies, is likely to yieldup to 172,500 m3 per week, using the single trailer,
5. that dredging of the southern area by trailer dredger should beundertaken within a single pit or area up to 2.5 km long and lessthan 1 km wide, so as to maximise the initial area into which theoverflow products are distributed and thus lessen their impact
6. that the pit may be safely worked within the constraints of thesubmarine outfall, but that special measures may be needed to severand remove abandoned cables and other magnetic anomalies fromwithin the plan area of the pit;
7. consideration should be given to the negotiation with MarineDepartment of temporary staged realignments of the TSS so thatconcurrent allocations of parts of the proposed borrow area can bemade to smaller projects, using stationary dredging techniques. Tlieavailable sea space in the southern area is suited to the temporarynarrowing and realignment of the TSS so as to permit access to grabdredgers;
8. both areas of this Sand Resource are relatively sheltered and wellsuited for small scale exploitation by grab dredgers and dumb bargesusing competitive local resources;
9. that the use of grab rather than suction techniques in the southernarea (flood facies) will greatly increase the volume of the SandReserve and alleviate the environmental impacts. Care will need tobe taken to ensure that the non-beneficiated Fill is compatible withthe grading requirements of the designated receiver project;
10. the local bathymetry and hydrodynamic regime after exploitation ofthe total Sand Resource does not offer any potential for stablebackfilling. Dumping of Overburden materials is not recommended;
11. heavy metal contaminants are recorded in the Sand Resource butinformation on the actual depth and hence the possible impacts oftheir release cannot be quantified. Study of this aspect isrecommended in the Environmental Assessment for the Tathongarea;
12. economic and engineering considerations normally require theoverflowing of trailer hoppers during the recovery of these surfacemarine sands. The environmental impact of single trailer operationsdescribed in this report is judged to be "medium";
63
13. dredging overflow is likely to subject Big Wave Bay to occasionalinfluxes of high turbidity on the ebb tide during sustained periods ofeasterly wind. The effect would be principally visual but is likelyto attract public comment;
14. dredging of the southern area of North Tathong in conjunction withon going dredging immediately to the southwest of Tung Lung Chauis likely to lead to increased wave penetration together withadditional focussing of wave energy. Long period offshoregenerated waves and swell from the east and south-east may have agreater impact at Big Wave Bay. Study of this feature isrecommended in the Environmental Assessment proposed for theTathong area;
15. in the northern area substantial allocation will not be possible untilreprovisioning of sewage outfalls is complete. Trailer dredgers arebest suited at this site. Exploitation of the northern portion usinggrab dredgers and temporary realignments of the TSS is theoreticallypossible but would require a Development Plan and where possiblelocal concurrent allocations so that temporary changes to this moreconstricted end of the TSS can be kept to a minimum; and
16. the operation of the proposed borrow area is possible without theimposition of any additional constraints and regulations beyond thosealready provided by existing maritime and environmental legislation.However, when detailed Borrow Area Development Plans are drawnup, including constraints imposed by the designated receiver site,both EPD and MD should be consulted on the overall managementplan for the project
64
11.0 BIBLIOGRAPHY
11.1 BINNIE & PARTNERS (HONG KONG) et al (1989) : Hydraulic andWater Quality Studies in Victoria Harbour Final Report - Pan /,Mathematical Modelling, report prepared for Territory DevelopmentDepartment
112 BINNIE CONSULTANTS LIMITED et al (1990): Fill Management Study- Phase If Inception Report (December 1990), report prepared for CivilEngineering Services Department, Geotechnical Control Office
11.3 BINNIE CONSULTANTS LIMITED et al (1991): Fttl Management Study- Phase //, Environmental Reviews (February 1991), report prepared forCivil Engineering Services Department, Geotechnical Control Office
11.4 BLOKLAND, T. (1988): Determination of Dredging - Induced TurbidityTerra et Aqua. No. 38, December 1988
11.5 BRAY R N., (1979): Dredging A Handbook for Engineers, Edward Arnold
11.6 CHOOT, GJEJB. (1988): Marine Sources of Fill (Final Report). AdvisoryReport No. ADR 30/88, Civil Engineering Services Department,Geotechnical Control Office, report prepared for Territory DevelopmentDepartment, Urban Area Development Office
11.7 DEMAS (DREDGING, ENGINEERING AND MANAGEMENTSTUDIES) (1991) : Fill Management Study - Phase IIt Dredging studiesrelated to marine borrow areas (Final Report), report prepared for CivilEngineering Services Department, Geotechnical Control Office
11.8 ENVIRONMENTAL PROTECTION DEPARTMENT (1990) : MarineWater Quality of Hong Kong, Government Publisher 106p
11.9 ENVIRONMENTAL PROTECTION DEPARTMENT (1991) : MarineQuality of Hong Kong, Government Publisher 93p
11.10 ERL (ASIA) LIMITED and BINNIE CONSULTANTS LIMITED (1991):Deep Bay Guidelines for dredging, reclamation and drainage works (2ndDraft), report prepared for Civil Engineering Services Department,Geotechnical Control Office
11.11 GEOTECHNICAL CONTROL OFFICE (1987): Geogwde 2, Guide to SiteInvestigation 362 p
11.12 GEOTECHNICAL CONTROL OFFICE (1988) : Geoguide 3, Guide toRock and Soil Descriptions 189 p
11.13 HONG KONG GOVERNMENT (1991) : Environmental Guidelines forPlanning in Hong Kong, extract from the Hong Kong Planning Standardsand Guidelines revised and approved by Lands Development PolicyCommittee on 31st August 1990
11.14 HYDROGRAPHIC DEPARTMENT, UK (1975) : Tidal Stream AtlasNP217
11.15 HYDROGRAPHIC DEPARTMENT, UK (1978): China Sea Pilot Vol. 1(4th edition) (revised 1987 with Supplement No. 1 -1989). Hydrographerof the Navy 305p
65
11.16 HYDROGRAPHIC DEPARTMENT, UK (1988) : Admiralty Chart 19171
South China Seat South Eastern approaches to Hong Kong 1:25,000(corrected to N to M 2230, 1990)
11.17 HYDROGRAPHIC DEPARTMENT, UK (1989) : Admiralty Chart 937,Eastern Approaches to Hong Kong 1:75,000 (corrected to N to M 2203,1991)
11.18 INTERNATIONAL MARITIME ORGANIZATION (1990) : TheInternational Conference on the Revision of the International Regulationsfor Preventing Collisions at Sea, 1972
11.19 MARINE DEPARTMENT, HONG KONG (1990): Statistical Tables, Portof Hong Kong
11.20 MARINE DEPARTMENT, HONG KONG (1980) : Hong Kong Shippingand Port Control Laws, A Guide to The Shipping and Port ControlOrdinance and Subsidiary Legislation, 30p
11.21 MARINE DEPARTMENT, HONG KONG (1991) : The Hong KongShipmasters Guide* 30p
11.22 PALERMO, MR. and RANDALL R.E. (1990) : Practices and ProblemsAssociated with Economic Loading and Overflow of Dredge Hoppers andScows. Technical Report DRP-9Q-1, Department of Army, WJE.S.Vicksburg, October 1990
11.23 ROYAL OBSERVATORY HONG KONG (1991): Hong Kong tide tables1991
11.24 SHAW, R. and ARTHURTON, R.S. (1988): Palaeoenvironmentalinterpretation of offshore Quaternary sediments in Hong Kong. ThePalaeoenvironment of East Asia from the Mid-Tertiary, Centre of AsianStudies, University of Hong Kong, Occasional Papers and Monographs,No. 77, pp 138-150.
11.25 SHAW, R., ZHOU, K., GERVAIS, E. and ALLEN, L.O. (1986): Resultsof a palaeontological investigation of the Chek Lap Kok Borehole(B13/B13A), North Lantau. Geological Society of Hong Kong Newsletter,vol. 4, no. 2, pp 142.
11.26 SHAW, R. and WHITESIDE, P.G.D. (1987): Sources of sand and gravelin Hong Kong waters (Interim Report November 1987). Planning ReportNo. PR 4/87, Civil Engineering Services Department, Geotechnical ControlOffice
11.27 SHAW, R. (1990): Recent advances in Late Quaternary stratigraphicalinterpretation of Hong Kong's offshore area. Proceedings of the FirstInternational Conference on Asian Marine Geology, Shanghai, China OceanPress, Beijing, pp 225-239.
11.28 THORLEY, C.B.B., CHEUNG, P.C.T, SHAW, R., FORD, CR. andCHAPPELLE (1990) : SEAM AT Study (Interim Report June 1990).Advisory Report No. ADR 4/90, Civil Engineering Services Department,Geotechnical Control Office
66

11.29 WHITESIDE, P.G.D., GILBERT, ST., JAYASEKERA, B.B., andFRANKS, C.A.M. (1990) : Fill Management Study - Phase I Report(August 1990), Natural Resources Report No, NR 1/90, Civil EngineeringServices Department, Geotechnical Control Office
1130 WHTTCSIDE, P.G.D., and WRAGGE-MORLEY N. ed (1988) : MarineSand and Gravel Resources of Hong Kong, Proceedings of Seminar onMarine Sources of Sand, Geological Society of Hong Kong, University ofHong Kong, 221p
11.31 ZHAO, H. (1983): Hydrological characteristics of Zhujiang (Pearl River)Delta (Abstract in English), Tropical Oceanhgy; Vol. 2 No. 2
67

HKC 627.73 F48Fill management study - phaseII investigation anddevelopment of marine borrowareas : North Tathong areafinal RSRPssme.n1-
Date Due