theoretical analysis of the effect of traction parameters ... · pdf filetheoretical analysis...
TRANSCRIPT
TEKA. COMMISSION OF MOTORIZATION AND ENERGETICS IN AGRICULTURE – 2016, Vol. 16, No. 1, 5–12
Theoretical Analysis of the Effect of Traction Parameters on Electric Vehicle Energy Consumption and Driving Range
Wawrzyniec Gołębiewski
Department of Automotive Engineering, West Pomeranian University of Technology in Szczecin 17 Piastów Ave., 70-310 Szczecin, Poland, tel.+48 91 449 40 45, e-mail: [email protected]
Received January 09.2016; accepted January 19.2016
Summary. The paper presents a theoretical analysis of the effect of electric car performance characteristics on vehicle energy consumption and driving range. The test object was a Nissan Leaf electric vehicle. The characteristic curves of basic and ad-ditional resistance to motion (sum of rolling resistance and air resistance and inertia resistance or grade resistance, respectively) were applied to the model characteristic curve of electric motor torque of the tested vehicle.
Based on that, the graphs describing the relationships between vehicle energy consumption and vehicle speed were made (for specific values of car acceleration / acclivity grade) as well as the relations between vehicle driving range and its traction properties.
It was concluded that the use of performance characteristics significantly increased the vehicle’s energy consumption and decreased the available vehicle’s driving range.Key words: energy consumption, traction parameters, electric vehicle’s driving range.
INTRODUCTION
Regulation of the European Parliament and of the Coun-cil No. 443/2009 of 23 April 2009 assumes reduction in average fuel consumption for a fleet of new passenger car and light-duty vehicles of a given manufacturer to the value of 3.7 dm3/100 km after 2020 [12], while this parameter is strictly associated with carbon dioxide emission, the level of which is expected to be minimised to the value of 95 g/km after 2020.
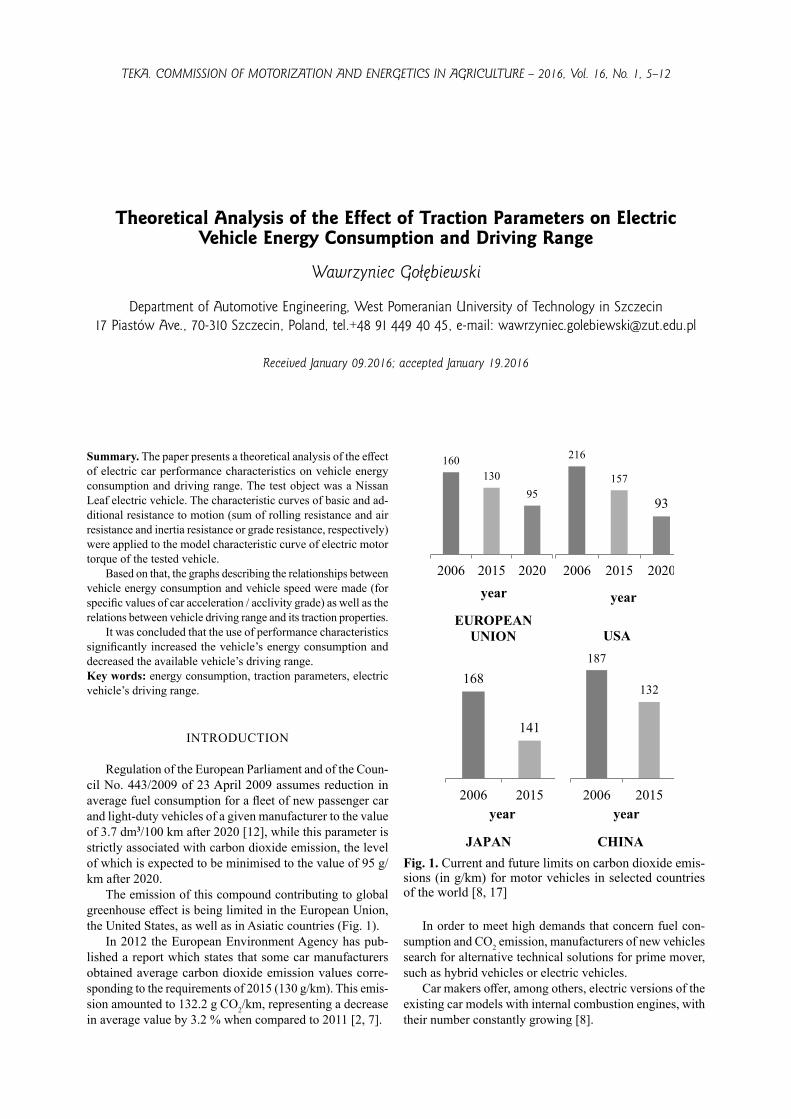
The emission of this compound contributing to global greenhouse effect is being limited in the European Union, the United States, as well as in Asiatic countries (Fig. 1).
In 2012 the European Environment Agency has pub-lished a report which states that some car manufacturers obtained average carbon dioxide emission values corre-sponding to the requirements of 2015 (130 g/km). This emis-sion amounted to 132.2 g CO2/km, representing a decrease in average value by 3.2 % when compared to 2011 [2, 7].
Fig. 1. Current and future limits on carbon dioxide emis-sions (in g/km) for motor vehicles in selected countries of the world [8, 17]
In order to meet high demands that concern fuel con-sumption and CO2 emission, manufacturers of new vehicles search for alternative technical solutions for prime mover, such as hybrid vehicles or electric vehicles.
Car makers offer, among others, electric versions of the existing car models with internal combustion engines, with their number constantly growing [8].
TEKA. COMMISSION OF MOTORIZATION AND ENERGETICS IN AGRICULTURE – 2016, Vol. 16
Theoretical analysis of the effect of traction parameters on electric vehicle energy consumption and driving range
Wawrzyniec Gołębiewski
Department of Automotive Engineering, West Pomeranian University of Technology in Szczecin
17 Piastów Ave., 70-310 Szczecin, Poland, tel.+48 91 449 40 45, e-mail: [email protected]
Summary: The paper presents an theoretical analysis of the effect of electric car performance characteristics on vehicle energy consumption and driving range. The test object was a Nissan Leaf electric vehicle. The characteristic curves of basic and additional resistance to motion (sum of rolling resistance and air resistance and inertia resistance or grade resistance, respectively) were applied to the model characteristic curve of electric motor torque of the vehicle being tested. Based on that, the graphs describing the relationships between vehicle energy consumption and vehicle speed were made (for specific values of car acceleration / acclivity grade) as well as the relations between vehicle driving range and its traction properties. It was concluded that the use of performance characteristics significantly increased vehicle energy consumption and decreased available vehicle driving range.
Key words: energy consumption, traction parameters, electric vehicle driving range
INTRODUCTION Regulation of the European Parliament and of the Council No. 443/2009 of 23 April 2009 assumes reduction in average fuel consumption for a fleet of new passenger car and light-duty vehicles of a given manufacturer to the value of 3.7 dm3/100 km after 2020 [12], while this parameter is strictly associated with carbon dioxide emission, the level of which is expected to be minimised to the value of 95 g/km after 2020. The emission of this compound contributing to global greenhouse effect is being limited in the European Union, the United States, as well as in Asiatic countries (Fig. 1). European Environment Agency has published in 2012 a report which states that some car manufacturers obtained average carbon dioxide emission values corresponding to the requirements of 2015 (130 g/km). This emission amounted to 132.2 g CO2/km, representing a decrease in
average value by 3.2 % when compared to 2011 [2, 7].
Fig. 1. Current and future limits on carbon dioxide emissions (in g/km) for motor vehicles in selected countries of the world [8, 17] In order to meet high demands that concern fuel consumption and CO2 emission, manufacturers of new vehicles search for alternative technical solutions for prime mover, such as hybrid vehicles or electric vehicles. Carmakers offer, among others, electric versions of the existing car models with internal combustion engines, with their number constantly growing [8]. At the end of 2012, there were 180000 electric vehicles being used on roads, with their biggest global sale being recorded in Japan (28%) and the United States (26%). Further countries with demand for vehicles
160 130
95
2006 2015 2020year
EUROPEAN UNION
216
157
93
2006 2015 2020
year
USA
168
141
2006 2015year
JAPAN
187
132
2006 2015year
CHINA

6 WAWRZYNIEC GOŁĘBIEWSKI
At the end of 2012, there were 180000 electric vehicles being used on roads, with their biggest global sale being re-corded in Japan (28%) and the United States (26%). Further countries with demand for vehicles of that type were China (16%), France (11%), Norway (7%), Germany (2%), Great Britain (2%), and some other ones (9%) [3, 7].
The greenhouse gas emission and energy balance shows that electric vehicles, however, contribute to signifi cant car-bon dioxide emission because electric energy comes largely from coal-fi red power stations [1, 15].
Due to the trend towards greater participation of renew-able energy sources, contributing less to climate warming, in the overall energy balance, the sales of electric vehicles is expected to gradually rise (and their production togeth-er with it, too). This is a direct result of the depletion of conventional energy sources (forecasts show a vision of the exhaustion of fuels of that type in 2050), being used as sources of power in vehicles equipped with internal com-bustion engines [5].
An important issue related to electric vehicles is their driving range which depends on the type of batteries being installed on them.
The source of energy in electric vehicles is electrochem-ical batteries of energy, among which the following can be distinguished: lead-acid and alkaline batteries (nickel-cad-mium, nickel metal hydride or lithium batteries).
An important parameter of alkaline batteries is mass energy density, with its values being in the range of approx-imately 30-45 Wh/kg to approximately 160-250 Wh/kg for Li-Ion battery cells [7].
A disadvantage of this type of battery solutions is its high weight, being necessary to obtain such electric capacity so that the driving range of electric vehicle is suffi cient [7].
The law capacity of traction battery signifi cantly limits the driving range of electric vehicle. The so called economy mode driving, with a considerable speed limit, allows this distance to be increased but it is still shorter than that being reached by cars with internal combustion engines. Table 1 shows the technical data for some electric cars [6] (Tab. 1).
An aspect being directly related to the driving range of electric vehicle is battery state of charge s.
The available battery electric capacity range is 40-80 % of its state of charge (SOC).
A typical example of 50% SOC value is a Chevrolet Volt vehicle, for which the lower state of charge amounts to 30%, while the upper one is 80% (Fig. 2).
This means that in a battery with 16 kWh electric capac-ity only fi fty percent of this energy can be eff ectively used, i.e. 8 kWh. Knowledge of the SOC values is important for vehicle driving range [7].
Ta b l e 1 . Selected technical parameters of electric vehicles [6]
Vehicle m[kg]
Pd
[kW]B/ E
[kWh]Vmax
[km/h]r
[km]Tesla Roadster 1200 215 Li-Ion
/53 200 390
Honda Fit EV 1475 92 Li-Ion
/20 145 210
Nissan Leaf 1525 80 Li-Ion
/24 144 160
Mitsubishi i-Miev 1100 49 Li-Ion
/16 130 150
VW Golf Blue-e-motion
1545 85 Li-Ion /26.5 135 150
Renault Florence Z.E.
1543 70 Li-Ion /22 135 160
Coda EV 1450 100 LFP /31 130 200
Fiat 500 e 1355 83 Li-Ion /24 160 140
where: m – weight, Pd – electric motor power, B – batteries, E – battery energy, Vmax – maximum speed, r – driving range, Li-Ion – lithium-ion batteries, LFP – lithium ferrophosphate batteries.Type of drive applied:Tesla – three-phase, four-pole induction motor, Honda – synchronous AC electric motor, Nissan – rotor excitation winding synchronous electric motor, Mitsubishi – permanent magnet synchronous electric motor, VW – permanent mag-net synchronous electric motor, Renault – rotor excitation winding synchronous electric motor, Coda – three-phase induction motor, Fiat – electric motor.
The value of vehicle driving range depends on that of en-ergy being used during the car motion under diff erent road and traffi c conditions. The testing of the value of this parameter for a vehicle weighing 1549 kg, powered with lithium-ion accu-mulators, with the driving range of 160 km has corresponded to the measured value being equal to 15 kWh/100 km [3].
Fig. 2. The change window of battery state of charge (SOC) [7, 9]
The specifi c energy consumption of electric car has been also subject to experiments and has been presented on the basis of the following relationship [3, 14]:
dEC = , (1)
where: E – energy intake value [kWh, Wh],d – distance covered by an electric vehicle during the testing
[km].
THEORETICAL ANALYSIS OF THE EFFECT OF TRACTION PARAMETERS ON THE ELECTRIC VEHICLE ENERGY CONSUMPTION AND DRIVING RANGE
with the driving range of 160 km has corresponded to the measured value being equal to 15 kWh/100 km [3].
Fig. 2. The change window of battery state of charge (SOC) [7, 9]
The specific energy consumption of electric car has been also subject to experiments and has been presented on the basis of the following relationship [3, 14]:
dEC (1)
where: E – energy intake value [kWh, Wh], d – distance covered by an electric vehicle during the testing [km].
The results of this parameter measurement for an electric vehicle weighing 1360 kg and being characterised by the coefficient of air resistance cx = 0.5, based on the tests being applicable in the North America, i.e. urban cycle tests – UDDS (Urban Dynamometer Driving Schedule), extra-urban cycle tests – HWFEDS (Highway Fuel Economy Driving Schedule), also known as HWFET (Highway Fuel Economy Test), and US 06 (Supplemental Federal Test Procedure, SFTP), have corresponded the following values: 137 Wh/km, 165 Wh/km, 249 Wh/km, respectively [1, 19]. The specific energy consumption of a Zilent Courant electric vehicle has been on a similar level, the value of which is between 155 Wh/km and 223 Wh/km [1]. The car motion properties, on which the value of vehicle energy consumption and its driving range depend, are represented by car traction parameters.
STUDY OBJECTIVE
The objective of this study was to determine the driving range and fuel consumption of an electric vehicle in
relation to the traction properties being obtained by it.
TEST METHODS
Using the test object, simulation characteristic curves of vehicle energy consumption versus vehicle speed for vehicle acceleration / gradeability were determined. The relationships of vehicle driving range as a function of vehicle speed for vehicle acceleration / gradeability were also established. For simulation tests, the following condition of vehicle motion were assumed: – wheel rolling resistance coefficient ft = 0.012, – passenger and cargo weight – 250 kg, – air density P = 1.168 kg/m3, – outside pressure p = 100 kPa, – outside temperature T = 250C (298 K). The use of the technical data of the vehicle (tab.2) and defined traffic conditions allowed to determine the power of motion resistance on the wheels of the vehicle. For acceleration it was calculated power to overcome the sum of the motion resistance, which consisted of rolling resistance, drag resistance and inertia resistance – relation (2) and (3).
Pk=(Ft+Fp+Fb) v (2)
)3(,)2
( 2 vamvAcgmfP pxP
ptk
where: Pk – power on wheels [W], Ft – rolling resistance [N], Fp – drag resistance [N], Fb – inertia resistance [N], v – vehicle speed [m/s], ft – coefficient of rolling resistance, mp – vehicle and cargo weight [kg], g – acceleration of gravity [m/s2], P – air density [kg/m3], cx – aerodynamic drag coefficient, A – frontal area of vehicle [m2], a – vehicle acceleration [m/s2], – coefficient of rotating masses.
It was taken into account the efficiency of the drive system and the variable efficiency of the electric motor, because these parameters had affect on power consumption from the battery, and on the time that the vehicle would be able to move at a given speed and the specified acceleration – equation (4), (5), (6).
80%
30%
SOC change
window
SOCmin = 30%
SOCmax = 80%
100%
THEORETICAL ANALYSIS OF THE EFFECT OF TRACTION PARAMETERS 7
The results of this parameter measurement for an elec-tric vehicle weighing 1360 kg and being characterised by the coeffi cient of air resistance cx = 0.5, based on the tests being applicable in the North America, i.e. urban cycle tests – UDDS (Urban Dynamometer Driving Schedule), extra-urban cycle tests – HWFEDS (Highway Fuel Econ-omy Driving Schedule), also known as HWFET (Highway Fuel Economy Test), and US 06 (Supplemental Federal Test Procedure, SFTP), have corresponded the following values: 137 Wh/km, 165 Wh/km, 249 Wh/km, respectively [1, 19].
The specifi c energy consumption of a Zilent Courant electric vehicle has been on a similar level, the value of which is between 155 Wh/km and 223 Wh/km [1].
The car motion properties, on which the value of vehi-cle energy consumption and its driving range depend, are represented by car traction parameters.
STUDY OBJECTIVE
The objective of this study was to determine the driving range and fuel consumption of an electric vehicle in relation to the traction properties being obtained by it.
TEST METHODS
Using the test object, simulation characteristic curves of vehicle energy consumption versus vehicle speed for vehicle acceleration / gradeability were determined.
The relationships of vehicle driving range as a function of vehicle speed for vehicle acceleration / gradeability were also established.
For simulation tests, the following condition of vehicle motion were assumed:– wheel rolling resistance coeffi cient ft = 0.012,– passenger and cargo weight – 250 kg,– air density rP = 1.168 kg/m3,– outside pressure p = 100 kPa,– outside temperature T = 250C (298 K).
The use of the technical data of the vehicle (tab.2) and defi ned traffi c conditions allowed to determine the power of motion resistance on the wheels of the vehicle.
For acceleration it was calculated power to overcome the sum of the motion resistance, which consisted of rolling resist-ance, drag resistance and inertia resistance – relation (2) and (3):
Pk=(Ft+Fp+Fb) v, (2)
,)2
( 2 vamvAcgmfP pxP
ptk ⋅⋅⋅+⋅⋅⋅+⋅⋅= δρ (3)
where:Pk – power on wheels [W], Ft – rolling resistance [N], Fp – drag resistance [N], Fb – inertia resistance [N], v – vehicle speed [m/s], ft – coeffi cient of rolling resistance, mp – vehicle and cargo weight [kg], g – acceleration of gravity [m/s2], rP – air density [kg/m3], cx – aerodynamic drag coeffi cient, A – frontal area of vehicle [m2], a – vehicle acceleration [m/s2], δ – coeffi cient of rotating masses.
The effi ciency of the drive system and the variable effi -ciency of the electric motor were taken into account, because these parameters had an eff ect on power consumption from the battery, and on the time that the vehicle would be able to move at a given speed and the specifi ed acceleration – equation (4), (5), (6):
WAWRZYNIEC GOŁĘBIEWSKI
4,)
2( 2
UN
pxP
ptd
vamvAcgmfP
5,)
2( 2
UN
SEpxP
pt
ak
vamvAcgmfP
)6(,ak
ak
PQt
(5)
where: Pd – power of engine [W],UN – efficiency of powertrain, Pak – battery power consumption [W], SE – efficiency of electric motor, t – time [h], Qak – battery energy [Wh]
On the basis of that it was calculated driving range of the vehicle in certain traffic conditions equation (7). r = v t , (7) where: r – driving range [km], v – vehicle speed [km/h].
In a similar manner it was determined driving range of vehicle that overcome the hill. In the equations (2), (3), (4), (5) inertia resistance have been converted into grade resistance according to equation (8). Fw= mp p g=mp (h/l) g , (8) where: Fw – grade resistance [N], mp – vehicle and cargo weight [kg], p – acclivity gradient [%], g – acceleration of gravity [m/s2], h- vertical height of road [m], l – horizontal lenght of road = 100 m.
TEST OBJECT
The test object was a Nissan Leaf electric car, being classified to the compact car segment, i.e. class C. The technical data of this vehicle are presented in Table 2. The characteristic curve of electric motor of a Nissan Leaf vehicle being declared by vehicle manufacturer (Fig. 3) presents the field of motor torque supply in relation to its rotational speed. The torque reaches the maximum value amounting to 254 Nm in the range of rotational speed 0-3000 rpm, and next its value decreases together with an increase in speed and reaches the minimum value at the rotational speed of 10500 rpm. This graph also presents the fields of the overall efficiency of electric motor which changes in the range of 85-95% and depends on the load value (motor torque) and that of rotational speed.
Tab. 2. Technical parameters of a Nissan Leaf vehicle [16, 17, 18, 19, 20]
Vehicle data Value Unit Maximum engine
power Pd 109/80 [KM/kW]
rotational speed range for maximum
power nP
3000-10000 [rpm]
maximum engine torque Ttq
254 [Nm]
rotational speed range for maximum
torque nTtq
0-3000 [rpm]
type of battery applied Lithium-ion
battery energy E 24 [kWh] battery effective
energy Ee 21.3 [kWh]
type of drive locked front-wheel
power transmission no clutch, helical gear fixed gear, 7.9377:1
vehicle weight m 1550 [kg] height H 1.549 [m] width B 1.770 [m]
aerodynamic drag coefficient cd
0.28 -
tyre size 205/55R16
Fig. 3. The characteristic curve of electric motor parameters for a Nissan Leaf vehicle [20] The electric motor is characterised by the highest efficiency (amounting to 95%) in the range of average rotational speeds (from approximately 4000 rpm to approximately 7500 rpm) and in the range of average loads (from approximately 50 Nm to approximately 150 Nm).
(4)
WAWRZYNIEC GOŁĘBIEWSKI
4,)
2( 2
UN
pxP
ptd
vamvAcgmfP
5,)
2( 2
UN
SEpxP
pt
ak
vamvAcgmfP
)6(,ak
ak
PQt
(5)
where: Pd – power of engine [W],UN – efficiency of powertrain, Pak – battery power consumption [W], SE – efficiency of electric motor, t – time [h], Qak – battery energy [Wh]
On the basis of that it was calculated driving range of the vehicle in certain traffic conditions equation (7). r = v t , (7) where: r – driving range [km], v – vehicle speed [km/h].
In a similar manner it was determined driving range of vehicle that overcome the hill. In the equations (2), (3), (4), (5) inertia resistance have been converted into grade resistance according to equation (8). Fw= mp p g=mp (h/l) g , (8) where: Fw – grade resistance [N], mp – vehicle and cargo weight [kg], p – acclivity gradient [%], g – acceleration of gravity [m/s2], h- vertical height of road [m], l – horizontal lenght of road = 100 m.
TEST OBJECT
The test object was a Nissan Leaf electric car, being classified to the compact car segment, i.e. class C. The technical data of this vehicle are presented in Table 2. The characteristic curve of electric motor of a Nissan Leaf vehicle being declared by vehicle manufacturer (Fig. 3) presents the field of motor torque supply in relation to its rotational speed. The torque reaches the maximum value amounting to 254 Nm in the range of rotational speed 0-3000 rpm, and next its value decreases together with an increase in speed and reaches the minimum value at the rotational speed of 10500 rpm. This graph also presents the fields of the overall efficiency of electric motor which changes in the range of 85-95% and depends on the load value (motor torque) and that of rotational speed.
Tab. 2. Technical parameters of a Nissan Leaf vehicle [16, 17, 18, 19, 20]
Vehicle data Value Unit Maximum engine
power Pd 109/80 [KM/kW]
rotational speed range for maximum
power nP
3000-10000 [rpm]
maximum engine torque Ttq
254 [Nm]
rotational speed range for maximum
torque nTtq
0-3000 [rpm]
type of battery applied Lithium-ion
battery energy E 24 [kWh] battery effective
energy Ee 21.3 [kWh]
type of drive locked front-wheel
power transmission no clutch, helical gear fixed gear, 7.9377:1
vehicle weight m 1550 [kg] height H 1.549 [m] width B 1.770 [m]
aerodynamic drag coefficient cd
0.28 -
tyre size 205/55R16
Fig. 3. The characteristic curve of electric motor parameters for a Nissan Leaf vehicle [20] The electric motor is characterised by the highest efficiency (amounting to 95%) in the range of average rotational speeds (from approximately 4000 rpm to approximately 7500 rpm) and in the range of average loads (from approximately 50 Nm to approximately 150 Nm).
(5)
WAWRZYNIEC GOŁĘBIEWSKI
4,)
2( 2
UN
pxP
ptd
vamvAcgmfP
5,)
2( 2
UN
SEpxP
pt
ak
vamvAcgmfP
)6(,ak
ak
PQt
(5)
where: Pd – power of engine [W],UN – efficiency of powertrain, Pak – battery power consumption [W], SE – efficiency of electric motor, t – time [h], Qak – battery energy [Wh]
On the basis of that it was calculated driving range of the vehicle in certain traffic conditions equation (7). r = v t , (7) where: r – driving range [km], v – vehicle speed [km/h].
In a similar manner it was determined driving range of vehicle that overcome the hill. In the equations (2), (3), (4), (5) inertia resistance have been converted into grade resistance according to equation (8). Fw= mp p g=mp (h/l) g , (8) where: Fw – grade resistance [N], mp – vehicle and cargo weight [kg], p – acclivity gradient [%], g – acceleration of gravity [m/s2], h- vertical height of road [m], l – horizontal lenght of road = 100 m.
TEST OBJECT
The test object was a Nissan Leaf electric car, being classified to the compact car segment, i.e. class C. The technical data of this vehicle are presented in Table 2. The characteristic curve of electric motor of a Nissan Leaf vehicle being declared by vehicle manufacturer (Fig. 3) presents the field of motor torque supply in relation to its rotational speed. The torque reaches the maximum value amounting to 254 Nm in the range of rotational speed 0-3000 rpm, and next its value decreases together with an increase in speed and reaches the minimum value at the rotational speed of 10500 rpm. This graph also presents the fields of the overall efficiency of electric motor which changes in the range of 85-95% and depends on the load value (motor torque) and that of rotational speed.
Tab. 2. Technical parameters of a Nissan Leaf vehicle [16, 17, 18, 19, 20]
Vehicle data Value Unit Maximum engine
power Pd 109/80 [KM/kW]
rotational speed range for maximum
power nP
3000-10000 [rpm]
maximum engine torque Ttq
254 [Nm]
rotational speed range for maximum
torque nTtq
0-3000 [rpm]
type of battery applied Lithium-ion
battery energy E 24 [kWh] battery effective
energy Ee 21.3 [kWh]
type of drive locked front-wheel
power transmission no clutch, helical gear fixed gear, 7.9377:1
vehicle weight m 1550 [kg] height H 1.549 [m] width B 1.770 [m]
aerodynamic drag coefficient cd
0.28 -
tyre size 205/55R16
Fig. 3. The characteristic curve of electric motor parameters for a Nissan Leaf vehicle [20] The electric motor is characterised by the highest efficiency (amounting to 95%) in the range of average rotational speeds (from approximately 4000 rpm to approximately 7500 rpm) and in the range of average loads (from approximately 50 Nm to approximately 150 Nm).
(6)
where:Pd – power of engine [W], hUN – effi ciency of powertrain, Pak – battery power consumption [W], hSE – effi ciency of electric motor, t – time [h], Qak – battery energy [Wh].
On the basis of that the driving range of the vehicle in certain traffi c conditions was calculated with the equation (7).
r = v t, (7)
where:r – driving range [km], v – vehicle speed [km/h].
In a similar manner the driving range of the vehicle overcoming the hill was determined In the equations (2), (3), (4), (5) inertia resistance were converted into grade resistance according to equation (8):
Fw= mp p g=mp (h/l) g, (8)
where:Fw – grade resistance [N], mp – vehicle and cargo weight [kg], p – acclivity gradient [%], g – acceleration of gravity [m/s2], h- vertical height of road [m], l – horizontal lenght of road = 100 m.
TEST OBJECT
The test object was a Nissan Leaf electric car, classifi ed to the compact car segment, i.e. class C.
The technical data of this vehicle are presented in Table 2.The characteristic curve of electric motor of a Nissan
Leaf vehicle declared by the vehicle manufacturer (Fig. 3) presents the fi eld of motor torque supply in relation to its rotational speed.
The torque reaches the maximum value amounting to 254 Nm in the range of rotational speed 0-3000 rpm, and next its value decreases together with an increase in speed and reach-es the minimum value at the rotational speed of 10500 rpm.
This graph also presents the fi elds of the overall effi cien-cy of electric motor which changes in the range of 85-95%

8 WAWRZYNIEC GOŁĘBIEWSKI
and depends on the load value (motor torque) and that of rotational speed.
Ta b l e 2 . Technical parameters of a Nissan Leaf vehicle [16, 17, 18, 19, 20]
Vehicle data Value UnitMaximum engine power Pd 109/80 [KM/kW]rotational speed range for maximum power nP
3000-10000 [rpm]
maximum engine torque Ttq 254 [Nm]rotational speed range for maximum torque nTtq
0-3000 [rpm]
type of battery applied Lithium-ionbattery energy E 24 [kWh]battery effective energy Ee 21.3 [kWh]type of drive locked front-wheel
power transmission no clutch, helical gearfixed gear, 7.9377:1
vehicle weight m 1550 [kg]height H 1.549 [m]width B 1.770 [m]aerodynamic drag coefficient cd 0.28 -tyre size 205/55R16
Fig. 3. The characteristic curve of electric motor parameters for a Nissan Leaf vehicle [20]
The electric motor is characterised by the highest effi-ciency (amounting to 95%) in the range of average rotational speeds (from approximately 4000 rpm to approximately 7500 rpm) and in the range of average loads (from approx-imately 50 Nm to approximately 150 Nm).
The torque value, amounting to 150 Nm, is not reached for each motor rotational speed due to a constant motor power hyperbole limiting the field of torque supply.
RESULTS
Based on torque characteristic curve declared by the manufacturer and vehicle technical and operational charac-
teristics, the characteristic curve of electric motor torque was determined with the curves of inertia resistance (responsible for vehicle acceleration vales) being applied to it (Fig. 4).
Fig. 4. The characteristic curve of motor torque with inertia resistance curves: a – vehicle acceleration [m/s2]
The graph (figure 4) shows the line of maximum mo-tor torque (solid line with square tags), the value of which changed in the range of vehicle speed. The lowest curve is a line representing the basic resistance to motion (sum of rolling resistance and air resistance – Ft+Fp). The curves lo-cated above characterise the use of motor torque in relation to vehicle speed, for specific acceleration values (0.5, 1, 1.5, 2, and 2.5 m/s2). The greater the value of acceleration, the higher located the curve of air resistance on this characteristic curve.
Using the characteristic curve on Figure 4, the graph presenting the relationship of vehicle energy consumption and its driving range in relation to its speed for different acceleration values was made (fig.5).
Fig. 5. The characteristic curve of vehicle energy consumption (overcoming inertia resistance): Ft+Fp – sum of rolling resistance and air resistance, a – vehicle acceleration [m/s2]
THEORETICAL ANALYSIS OF THE EFFECT OF TRACTION PARAMETERS 9
Based on the characteristic curves on Figures 5 and 6, it should be noted that the use of available acceleration value significantly increases vehicle energy consumption and de-creases vehicle driving range. For example, vehicle energy consumption for a car motion with the speed of 50 km/h and the acceleration value being equal to 0.5 m/s2 induces more than five times higher energy consumption (resulting in more than five times smaller vehicle driving range) in relation to the predetermined vehicle motion with that speed.
For the speed of 90 km/h and acceleration value of 0.5 m/s2, vehicle energy consumption is almost four times higher (four times smaller vehicle driving range) when compared to the predetermined motion.
Maximum vehicle energy consumption (for the accel-eration being equal to 2 m/s2) ranges from 212.5 kWh/100 km (for the speed value of 10 km/h) to 197.8 kWh/100 km (for the speed value of 40 km/h).
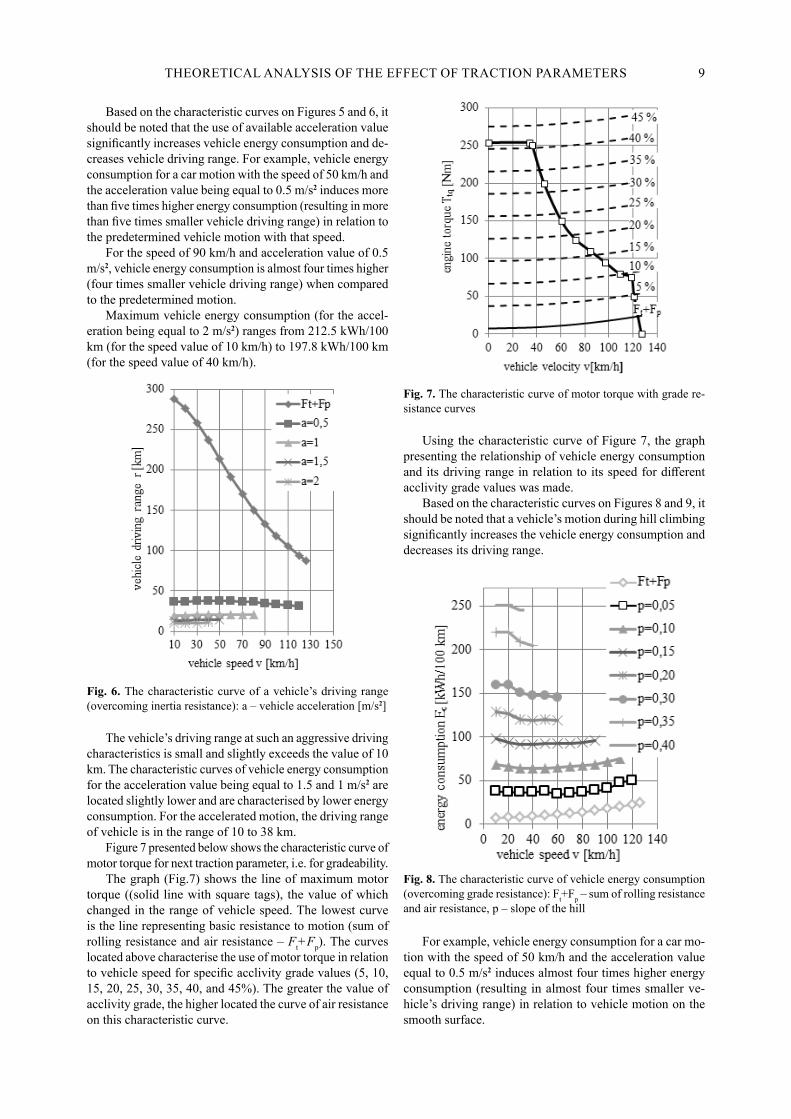
Fig. 6. The characteristic curve of a vehicle’s driving range (overcoming inertia resistance): a – vehicle acceleration [m/s2]
The vehicle’s driving range at such an aggressive driving characteristics is small and slightly exceeds the value of 10 km. The characteristic curves of vehicle energy consumption for the acceleration value being equal to 1.5 and 1 m/s2 are located slightly lower and are characterised by lower energy consumption. For the accelerated motion, the driving range of vehicle is in the range of 10 to 38 km.
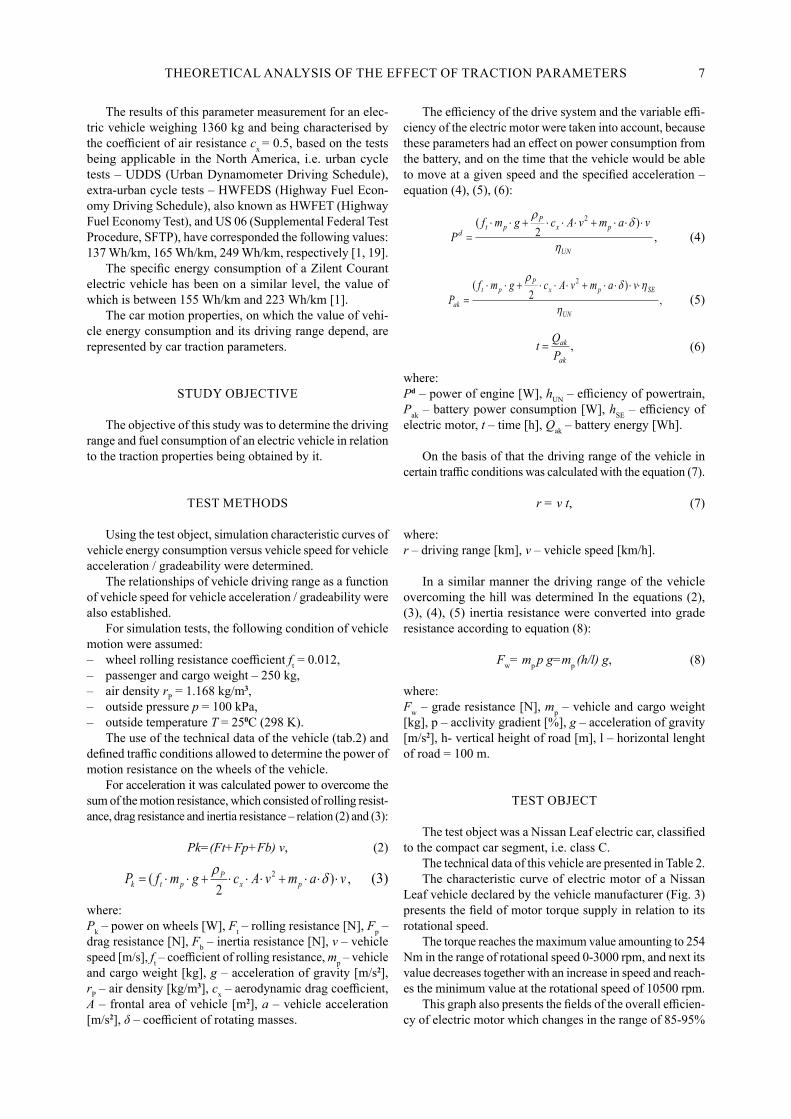
Figure 7 presented below shows the characteristic curve of motor torque for next traction parameter, i.e. for gradeability.
The graph (Fig.7) shows the line of maximum motor torque ((solid line with square tags), the value of which changed in the range of vehicle speed. The lowest curve is the line representing basic resistance to motion (sum of rolling resistance and air resistance – Ft+Fp). The curves located above characterise the use of motor torque in relation to vehicle speed for specific acclivity grade values (5, 10, 15, 20, 25, 30, 35, 40, and 45%). The greater the value of acclivity grade, the higher located the curve of air resistance on this characteristic curve.
Fig. 7. The characteristic curve of motor torque with grade re-sistance curves
Using the characteristic curve of Figure 7, the graph presenting the relationship of vehicle energy consumption and its driving range in relation to its speed for different acclivity grade values was made.
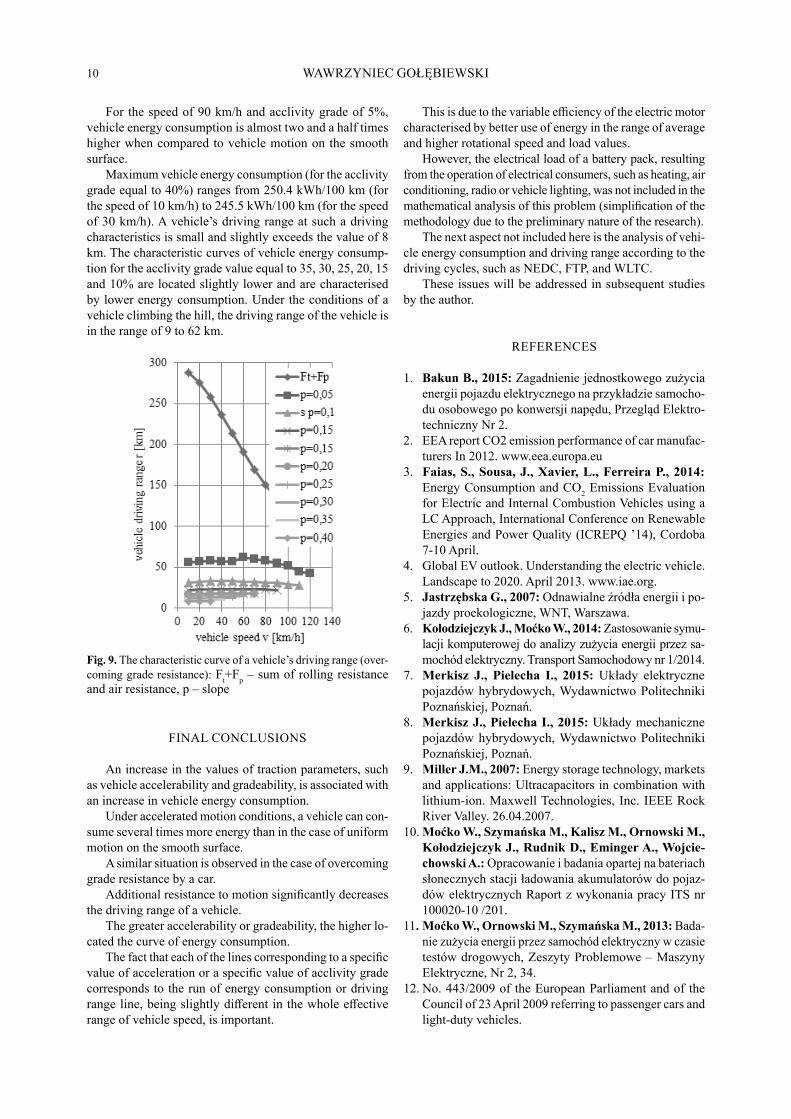
Based on the characteristic curves on Figures 8 and 9, it should be noted that a vehicle’s motion during hill climbing significantly increases the vehicle energy consumption and decreases its driving range.
Fig. 8. The characteristic curve of vehicle energy consumption (overcoming grade resistance): Ft+Fp – sum of rolling resistance and air resistance, p – slope of the hill
For example, vehicle energy consumption for a car mo-tion with the speed of 50 km/h and the acceleration value equal to 0.5 m/s2 induces almost four times higher energy consumption (resulting in almost four times smaller ve-hicle’s driving range) in relation to vehicle motion on the smooth surface.
10 WAWRZYNIEC GOŁĘBIEWSKI
For the speed of 90 km/h and acclivity grade of 5%, vehicle energy consumption is almost two and a half times higher when compared to vehicle motion on the smooth surface.
Maximum vehicle energy consumption (for the acclivity grade equal to 40%) ranges from 250.4 kWh/100 km (for the speed of 10 km/h) to 245.5 kWh/100 km (for the speed of 30 km/h). A vehicle’s driving range at such a driving characteristics is small and slightly exceeds the value of 8 km. The characteristic curves of vehicle energy consump-tion for the acclivity grade value equal to 35, 30, 25, 20, 15 and 10% are located slightly lower and are characterised by lower energy consumption. Under the conditions of a vehicle climbing the hill, the driving range of the vehicle is in the range of 9 to 62 km.
Fig. 9. The characteristic curve of a vehicle’s driving range (over-coming grade resistance): Ft+Fp – sum of rolling resistance and air resistance, p – slope
FINAL CONCLUSIONS
An increase in the values of traction parameters, such as vehicle accelerability and gradeability, is associated with an increase in vehicle energy consumption.
Under accelerated motion conditions, a vehicle can con-sume several times more energy than in the case of uniform motion on the smooth surface.
A similar situation is observed in the case of overcoming grade resistance by a car.
Additional resistance to motion significantly decreases the driving range of a vehicle.
The greater accelerability or gradeability, the higher lo-cated the curve of energy consumption.
The fact that each of the lines corresponding to a specific value of acceleration or a specific value of acclivity grade corresponds to the run of energy consumption or driving range line, being slightly different in the whole effective range of vehicle speed, is important.
This is due to the variable efficiency of the electric motor characterised by better use of energy in the range of average and higher rotational speed and load values.
However, the electrical load of a battery pack, resulting from the operation of electrical consumers, such as heating, air conditioning, radio or vehicle lighting, was not included in the mathematical analysis of this problem (simplification of the methodology due to the preliminary nature of the research).
The next aspect not included here is the analysis of vehi-cle energy consumption and driving range according to the driving cycles, such as NEDC, FTP, and WLTC.
These issues will be addressed in subsequent studies by the author.
REFERENCES
1. Bakun B., 2015: Zagadnienie jednostkowego zużycia energii pojazdu elektrycznego na przykładzie samocho-du osobowego po konwersji napędu, Przegląd Elektro-techniczny Nr 2.
2. EEA report CO2 emission performance of car manufac-turers In 2012. www.eea.europa.eu
3. Faias, S., Sousa, J., Xavier, L., Ferreira P., 2014: Energy Consumption and CO2 Emissions Evaluation for Electric and Internal Combustion Vehicles using a LC Approach, International Conference on Renewable Energies and Power Quality (ICREPQ ’14), Cordoba 7-10 April.
4. Global EV outlook. Understanding the electric vehicle. Landscape to 2020. April 2013. www.iae.org.
5. Jastrzębska G., 2007: Odnawialne źródła energii i po-jazdy proekologiczne, WNT, Warszawa.
6. Kołodziejczyk J., Moćko W., 2014: Zastosowanie symu-lacji komputerowej do analizy zużycia energii przez sa-mochód elektryczny. Transport Samochodowy nr 1/2014.
7. Merkisz J., Pielecha I., 2015: Układy elektryczne pojazdów hybrydowych, Wydawnictwo Politechniki Poznańskiej, Poznań.
8. Merkisz J., Pielecha I., 2015: Układy mechaniczne pojazdów hybrydowych, Wydawnictwo Politechniki Poznańskiej, Poznań.
9. Miller J.M., 2007: Energy storage technology, markets and applications: Ultracapacitors in combination with lithium-ion. Maxwell Technologies, Inc. IEEE Rock River Valley. 26.04.2007.
10. Moćko W., Szymańska M., Kalisz M., Ornowski M., Kołodziejczyk J., Rudnik D., Eminger A., Wojcie-chowski A.: Opracowanie i badania opartej na bateriach słonecznych stacji ładowania akumulatorów do pojaz-dów elektrycznych Raport z wykonania pracy ITS nr 100020-10 /201.
11. Moćko W., Ornowski M., Szymańska M., 2013: Bada-nie zużycia energii przez samochód elektryczny w czasie testów drogowych, Zeszyty Problemowe – Maszyny Elektryczne, Nr 2, 34.
12. No. 443/2009 of the European Parliament and of the Council of 23 April 2009 referring to passenger cars and light-duty vehicles.

THEORETICAL ANALYSIS OF THE EFFECT OF TRACTION PARAMETERS 11
13. Pistoia G. 2010: Electric and hybrid vehicles. Power sources, models, sustainability, infrastructure and the market. Elsevier.
14. PN-EN 1986-1:2001: Pojazdy drogowe o napędzie elek-trycznym – Pomiar sprawności energetycznej, 7, 15, 9, 11, 13.
15. Popczyk J. 2011: Bilans energetyczno-emisyjny samo-chodów elektrycznych. Ecomanager, Numer 11,1
16. Williams T., 2013: Real World Test: 2013 Nissan LEAF Range vs 2012 Nissan LEAF Range (w/Video)”. Inside EVs. Retrieved 2015-04-23.
17. Valentine – Urbschat M., Bernhart W.: Powertrain 2020 – the future drives electric. Roland Berger Strategy Con-sultants. Powertrain 2020, 2009. www.roland-berger.com
18. Voelcker J., 2013: “2013 Nissan Leaf: Longer Range, Faster Charging, Leather Seats, And More: All The Up-grades”. Green Car Reports. Retrieved 2013-02-10.
19. Young K., Wang C., Wang L., Strunz K., 2013: Elec-tric Vehicle Integration into Modern Power Networks, 2013, 19.
20. “The new car: features and specifications”. USA: Nissan. Retrieved 2011-12-13.
ANALIZA TEORETYCZNA WPŁYWU PARAMETRÓW TRAKCYJNYCH NA ZUŻYCIE ENERGII I ZASIĘG
POJAZDU ELEKTRYCZNEGO
Streszczenie. W artykule przedstawiono teoretyczną analizę wpływu właściwości użytkowych samochodu na zużycie ener-gii i zasięg pojazdu. Obiektem badan był pojazd elektryczny Nissan Leaf. Na wzorcową charakterystykę momentu obroto-wego silnika elektrycznego badanego samochodu naniesiono krzywe podstawowych (sumę oporów toczenia i powietrza) i dodatkowych (opory bezwładności lub opory wzniesienia) oporów ruchu.
Na jej podstawie wykonano wykresy opisujące zależności pomiędzy zużyciem energii a prędkością pojazdu (dla określo-nych wartości przyspieszenia samochodu/pochylenia wznie-sienia) oraz relacje pomiędzy przebiegiem pojazdu a jego właściwościami trakcyjnymi.
Wywnioskowano, że wykorzystanie właściwości użytko-wych potrafi zwiększyć zużycie energii nawet kilkukrotnie, a zatem zmniejsza się dostępny zasięg pojazdu.Słowa kluczowe: zużycie energii, parametry trakcyjne, zasięg pojazdu elektrycznego.