title intraplate seismicity in northern central europe is induced by
TRANSCRIPT

Title Intraplate seismicity in northern Central Europe is induced bythe last glaciation
Author(s) Brandes, C; Steffen, H; Steffen, R; Wu, PPC
Citation Geology, 2015, v. 43 n. 7, p. 611-614
Issued Date 2015
URL http://hdl.handle.net/10722/215294
Rights This work is licensed under a Creative Commons Attribution-NonCommercial-NoDerivatives 4.0 International License.

Publisher: GSA Journal: GEOL: Geology DOI:10.1130/G36710.1
Page 1 of 16
Intraplate seismicity in northern Central Europe is induced 1
by the last glaciation 2
Christian Brandes1, Holger Steffen2, Rebekka Steffen3, and Patrick Wu4 3
1Institut für Geologie, Leibniz Universität Hannover, Callinstraße, 30167 Hannover, Germany 4
2Lantmäteriet, Informationsförsörjning Geodesi Referenssystem, Lantmäterivägen 2c, 80102 5
Gävle, Sweden 6
3Department of Geosciences, Uppsala University, Villavägen 16, 75236 Uppsala, Sweden 7
4Department of Earth Sciences, The University of Hong Kong, Pokfulam Road, Hong Kong 8
ABSTRACT 9
There is growing evidence that climate-induced melting of large ice sheets has been able 10
to trigger fault reactivation and earthquakes around the migrating ice limit. Even today, the stress 11
due to Glacial Isostatic Adjustment (GIA) can continue to induce seismicity within the once 12
glaciated region. Northern Central Europe (NCE) lies outside the former ice margin and is 13
regarded as a low seismicity area. However, several historic earthquakes with intensities of up to 14
VII occurred in this region during the last 1,200 years. Here we show with numerical simulations 15
that the seismicity can potentially be explained by the decay of the Scandinavian ice sheet (SIS) 16
after the Weichselian glaciation. Combination of historic earthquake epicenters with fault maps 17
relates historic seismicity to major reverse faults of Late Cretaceous age. Mesozoic normal faults 18
remained inactive in historic times. We suggest that many faults in NCE are active during 19
postglacial times. This is a novelty that sheds new light on the distribution of postglacial faulting 20
and seismicity. In addition, we present the first consistent model that can explain both the 21
occurrence of deglaciation seismicity and the historic earthquakes in NCE. 22

Publisher: GSA Journal: GEOL: Geology DOI:10.1130/G36710.1
Page 2 of 16
INTRODUCTION 23
Continental intraplate tectonics can cause large intraplate earthquakes even in low strain 24
rate areas (Johnston, 1989). Also the intervals between the seismic events are commonly long 25
(Gangopadhyay and Talwani, 2003). Key to the occurrence of large intraplate earthquakes are 26
pre-existing zones of crustal weakness (Sykes, 1978) and a trigger mechanism such as changes in 27
the stress state due to erosion (Calais et al., 2010), fluid pressure variations (Costain et al., 1987) 28
or deglaciation (Wu & Hasegawa, 1996; Wu et al., 1999; Sauber and Molnia, 2004, Hampel & 29
Hetzel, 2006; Hampel et al., 2009). 30
Paleoseismological studies show that large-magnitude (>6 Mw) intraplate earthquakes 31
occurred around ~13 ka - 9 ka in Scandinavia (Mörner, 2011), implying a connection to 32
deglaciation of the SIS (Wu et al., 1999). For NCE, there is also evidence for post-glacial 33
seismicity (Brandes et al., 2012; Brandes & Winsemann, 2013), although the seismic activity 34
there is supposed to be low (Leydecker and Kopera, 1999) and some instrumentally recorded 35
earthquakes of the last decades are thought to have resulted from hydrocarbon recovery (Dahm et 36
al., 2007). There is also evidence for historic earthquakes with intensities of up to VII 37
(Leydecker, 2011). A strong damaging earthquake (intensity VI-VII, MSK-64 scale) took place 38
in 1612 at the Osning thrust in Germany (Vogt and Grünthal, 1994) followed by an event in 1767 39
with an intensity of V-VI (Grünthal and Bosse, 1997). This raises the question: Is seismicity in 40
NCE during post-glacial times related to unloading of the SIS? 41
NUMERICAL MODELLING 42
Northern Central Europe is characterized by several major faults that belong to the 43
Central European basin system (CEBS) (Fig. 1). This Permian rift basin experienced extension 44
throughout the Mesozoic (Scheck-Wenderoth and Lamarche, 2005) and contraction in the Late 45

Publisher: GSA Journal: GEOL: Geology DOI:10.1130/G36710.1
Page 3 of 16
Cretaceous (Kley and Voigt, 2008), resulting in a distinct fault pattern with major WNW-ESE 46
trending reverse faults: the Thuringian Forest Fault, the Osning Thrust, the Aller Valley Fault, 47
the Haldensleben Fault, and the Gardelegen Fault. All faults were active during the Late 48
Cretaceous (Kley and Voigt, 2008), e.g., apatite fission track data imply uplift in the Lower 49
Saxony Basin north of the Osning Thrust between 89 and 72 Ma with erosion of as much as 7 50
km (Senglaub et al., 2005). At the Harz boundary fault, 2.5 km of Late Cretaceous syn-tectonic 51
sediments were deposited in the footwall of the thrust (Voigt et al., 2006). 52
With commonly used three-dimensional finite element models that describe the process 53
of GIA together with those of Coulomb Failure Stress (CFS) calculations (see Data Repository 54
for more material on the CFS, a summary of the models used, input parameters for software 55
Coulomb 3.3 and further results), we tested the reactivation potential of these faults due to ice 56
unloading after the Weichselian glaciation in Scandinavia (Wu et al., 1999; Mörner, 2011). For 57
all major epicenters along the faults in Figure 1 which showed activity in postglacial times, we 58
calculated the change in CFS (δCFS). The δCFSE due to a possible earthquake is computed using 59
Coulomb 3.3 (Stein, 2003) and this change is applied to the GIA-induced δCFSGIA as shown in 60
Figures 2 and 3. 61
δCFS (Supplementary Fig. S1) represents the minimum stress required to reach faulting. 62
A negative δCFS value (e.g. Figure 2) indicates that the fault is stable, while a positive value 63
means that GIA stress is potentially available to induce faulting or cause fault instability or 64
failure unless released temporarily by an earthquake. Thus, δCFS = 0, i.e., the zero line in Figure 65
2, is an indication of the onset of fault motion. We also show how a potential GIA induced 66
earthquake at a certain fault affects the δCFS once it reaches the zero line if intraplate slip values 67
are known (for the Osning Thrust) or assumed. 68

Publisher: GSA Journal: GEOL: Geology DOI:10.1130/G36710.1
Page 4 of 16
At the major reverse faults the zero line is crossed mainly between 16 ka and 10 ka (Fig. 69
2), suggesting that these postglacial faults are activated by SIS deglaciation. 70
DISCUSSION AND CONCLUSIONS 71
The recognition of postglacial faults outside the former glaciated area is a novelty for 72
NCE, sheds new light on the distribution of postglacial faults in general and provides the 73
possibility to explain the seismicity pattern in NCE. 74
To verify the models we combined a historic earthquake catalogue that envelops the time 75
period from A.D. 800 to 2008 (Leydecker, 2011), with the fault map of NCE (Kley and Voigt, 76
2008) (Fig. 1). Only historical earthquakes with tectonic origin are used while earthquakes due to 77
human impact (e.g. mining) are excluded. Notable are the1977 Soltau event with an oblique 78
thrust mechanism and the nearby 2004 Rotenburg event with a normal fault focal mechanism. 79
They are marked to be of tectonic origin in Leydecker’s (2011) catalogue, but are thought to be 80
triggered by gas production (Dahm et al., 2007). 81
Except for the cluster of the Bohemian earthquake swarm in the southeast, the historic 82
seismicity is concentrated along major WNW-ESE trending reverse faults. The 1770 earthquake 83
with an intensity of VI (Leydecker, 2011) was probably related to the Rheeder Moor reverse 84
fault (Fig. 1). Earthquake activity increases gradually towards the Fennoscandian Shield 85
(delineated by the Sorgenfrei-Tornquist zone and other faults (Gregersen & Voss, 2014)). 86
None of the major Mesozoic normal faults in northern Germany, not even the large 87
normal faults of the Glückstadt graben (Fig. 1), show significant historic seismicity, revealing a 88
gap in tectonic activity between the Late Cretaceous contractional phase and historic seismicity. 89
Apatite fission track cooling ages point to only one uplift phase in the Late Cretaceous (Senglaub 90
et al., 2005) that corresponds to the shortening of the CEBS (Kley and Voigt, 2008). The 91
Publisher: GSA Journal: GEOL: Geology DOI:10.1130/G36710.1
Page 5 of 16
subsequent Cenozoic period was characterized by tectonic quiescence (Kley et al. 2008). This 92
raises the questions: Why is there historic seismicity, and why does it have this distinct relation 93
to the Late Cretaceous reverse faults? 94
GIA-induced stress changes due to the growth and decay of the SIS during the 95
Pleistocene may provide the solution. As shown in Figure 1, historic seismicity is concentrated 96
along the WNW-ESE trending Late Cretaceous reverse faults, which are almost parallel to the 97
southern ice margin (Fig. 1). Such faults have a high reactivation potential because the maximum 98
horizontal components of the ice sheet-induced stress are in line with the palaeostress field 99
(Stewart et al., 2000). Faults with large angles to the paleo-ice margin, e.g., the Glückstadt 100
Graben faults, have a lower reactivation potential. In addition, the δCFS in a normal fault regime 101
had mostly negative values in historic times for NCE, which minimized the possibility of seismic 102
activity and would explain the lack of historic seismicity along Mesozoic normal faults. 103
Numerical simulations (Fig. 2) show that all WNW-ESE trending reverse faults became unstable 104
between 16 – 10 ka. Seismic events are confirmed at the Osning Thrust where OSL ages of syn-105
tectonic growth strata and soft-sediment point to earthquakes with a magnitude of at least 5.5 106
between 15.9 ± 1.6 to13.1 ± 1.5 ka. (Brandes et al., 2012; Brandes and Winsemann, 2013). 107
The elastic rebound theory (Reid, 1910) implies that the deglaciation seismicity caused a 108
stress release along the faults. To cause new earthquakes, new stress can be accumulated by the 109
ongoing Alpine collision and the Atlantic ridge-push (Reicherter et al. 2005). The maximum 110
horizontal stress in the central part of northern Germany is NNE-SSW directed and rotates into a 111
NNW-SSE direction toward the west (Marotta et al., 2002; Reicherter et al. 2005) (Fig. 1). Many 112
reverse faults in northern Germany strike almost perpendicular to the recent maximum horizontal 113
stress direction. In general, strain rates are low (Marotta et al., 2002) as well as the slip rates 114
Publisher: GSA Journal: GEOL: Geology DOI:10.1130/G36710.1
Page 6 of 16
along the faults (Kaiser, 2005). Historic seismicity along the faults might be possible because 115
GIA-induced stress perturbation overcame the friction along the faults. 116
As intracontinental faults have long aftershock sequences (Stein and Liu, 2009), we 117
speculate that the historic seismicity in NCE is an aftermath, a kind of aftershock sequence, of 118
the GIA seismicity. This is supported by Figure 2: All graphs show a change from negative to 119
positive values during deglaciation. An earthquake occurred when δCFS first becomes zero and 120
the released stress caused a jump to more negative (stable) values. For the Osning Thrust, 121
seismic events between 15.9 ± 1.6 to 13.1 ± 1.5 ka (Brandes & Winsemann, 2013) have fault 122
slips of 1.0 – 1.5 m (Wells and Coppersmith, 1994). To constrain the aftermaths, 3 slip values 123
between 1.0 and 1.5 m are used in panel A and B to compare with the case where no slip 124
occurred. Panel A & B show that after the first event, the zero line is crossed again if the slip is 125
less than 1.5 m. The likelihood of another event in the last 10 ka is highlighted in Figure 3 with a 126
gray shaded range of ~0.3 MPa in the last 8,000 years. The best model in panel A (blue line) that 127
gives good agreement to observations at the Osning Thrust, points to an activity 1,000 years ago. 128
Based on the models and their uncertainty tested in this study, the 1612 and 1767 events are 129
likely related to the Weichselian deglaciation. 130
Figures similar to Figure 3 for the other areas cannot be provided yet as fault slips cannot 131
be derived. Nonetheless, using 3 typical values of fault slips between 0.5 and 1.5 m, Figure 2 132
shows that events along the Sorgenfrei-Tornquist zone (STZ) and in Magdeburg Börde appear to 133
have a strong relation to GIA, while the 1751 event in the Thuringian Forest is potentially 134
influenced by GIA. 135
However, the geological evidence for a post-glacial reactivation of the faults is very 136
limited. So far only data from the Osning Thrust (Brandes et al., 2012) and the STZ (Pedersen & 137
Publisher: GSA Journal: GEOL: Geology DOI:10.1130/G36710.1
Page 7 of 16
Gravesen, 2010) provide hints. Finding further evidence is a future challenge for Quaternary 138
geologists. 139
Wiprut and Zoback (2000) showed that some faults in northern Europe are critically 140
stressed and may only require small stress changes to (re-)activate. Our modeling shows that 141
fault movements are possible if the GIA-induced stress has not been fully released yet. This can 142
explain the deglaciation seismicity, the historic earthquakes in NCE. The results can be 143
transferred to similar areas in North America and Russia. The wide spread occurrence of 144
postglacial faulting makes it indispensable to re-analyze the intraplate tectonics in NCE and also 145
beyond. Just recently a magnitude 4.7 earthquake happened in an area of very low activity in 146
western central Sweden (Earthquake-Report.com, 2014), so, understanding the driving 147
mechanisms for this type of seismicity is an important step toward a profound hazard risk 148
evaluation. 149
ACKNOWLEDGMENTS 150
We would like to thank D. Tanner and J. Winsemann for discussion and F. Wrobel 151
and M. Meisel for help with figure preparation. P.W. is supported by Hong Kong RGC-GRF 152
grant 17305314. Some figures are drawn with the GMT software. Three reviewers are 153
gratefully acknowledged for their constructive comments. 154
REFERENCES CITED 155
Brandes, C., and Winsemann, J., 2013, Soft sediment deformation structures in NW Germany 156
caused by Late Pleistocene seismicity: International Journal of Earth Sciences, v. 102, 157
p. 2255–2274, doi:10.1007/s00531-013-0914-4. 158
Brandes, C., Winsemann, J., Roskosch, J., Meinsen, J., Tanner, D.C., Frechen, M., Steffen, H., 159
and Wu, P., 2012, Activity of the Osning thrust during the late Weichselian: Ice-sheet and 160

Publisher: GSA Journal: GEOL: Geology DOI:10.1130/G36710.1
Page 8 of 16
lithosphere interactions: Quaternary Science Reviews, v. 38, p. 49–62, 161
doi:10.1016/j.quascirev.2012.01.021. 162
Calais, E., Freed, A.M., Van Arsdale, R., and Stein, S., 2010, Triggering of New Madrid 163
seismicity by late-Pleistocene erosion: Nature, v. 466, p. 608–611, doi:10.1038/nature09258. 164
Costain, J.K., Bollinger, G.A., and Speer, J.A., 1987, Hydroseismicity – A hypothesis for the 165
role of water in the generation of intraplate tectonics: Geology, v. 15, p. 618–621, 166
doi:10.1130/0091-7613(1987)15<618:HHFTRO>2.0.CO;2. 167
Dahm, T., Krüger, F., Stammler, K., Klinge, K., Kind, R., Wylegalla, K., and Grasso, J.-R., 168
2007, The 2004 Mw 4.4 Rotenburg, Northern Germany, earthquake and its possible 169
relationship with gas recovery: Bulletin of the Seismological Society of America, v. 97, 170
p. 691–704, doi:10.1785/0120050149. 171
Earthquake-Report.com, 2014, Moderate shallow earthquake in Sweden: http://earthquake-172
report.com/2014/09/15/moderate-earthquake-sweden-on-september-15-2014/ (accessed 173
April 2015). 174
Gangopadhyay, A., and Talwani, P., 2003, Symptomatic features of intraplate earthquakes: 175
Seismological Research Letters, v. 74, p. 863–883, doi:10.1785/gssrl.74.6.863. 176
Gregersen, S., and Voss, P.H., 2014, Review of some significant claimed irregularities in 177
Scandinavian postglacial uplift on timescales of tens to thousands of years - earthquakes in 178
Denmark: Solid Earth, v. 5, p. 109-119, doi:10.5194/se-5-109-2014. 179
Gregersen, S., Glendrup, M., Larsen, T.B., Voss, P., and Rasmussen, H.P., 2005, Seismology: 180
Neotectonics and structure of the Baltic Shield: Geological Survey of Denmark and 181
Greenland Bulletin, v. 7, p. 25–28. 182
Publisher: GSA Journal: GEOL: Geology DOI:10.1130/G36710.1
Page 9 of 16
Grünthal, G., and Bosse, C., 1997, Seismic hazard assessment for low-seismicity areas – case 183
study: Northern Germany: Natural Hazards, v. 14, p. 127–139, doi:10.1007/BF00128261. 184
Hampel, A., and Hetzel, R., 2006, Response of normal faults to glacial-interglacial fluctuations 185
of ice and water masses on Earth's surface: Journal of Geophysical Research, v. 111, 186
B06406, doi:10.1029/2005JB004124. 187
Hampel, A., Hetzel, R., Maniatis, G., and Karow, T., 2009, Three-dimensional numerical 188
modeling of slip rate variations on normal and thrust fault arrays during ice cap growth and 189
melting: Journal of Geophysical Research, v. 114, B08406, doi:10.1029/2008JB006113. 190
Hibbitt, D., Karlsson, B., and Sorensen, P., 2012, Getting Started With ABAQUS—Version 191
(6.12): Providence, Rhode Island, USA, Dassault Systèmes Simulia Corporation. 192
Johnston, A.C., 1989, The seismicity of ‘stable continental interiors’, in Gregersen, S., and 193
Basham, P.W., eds., Earthquakes at North Atlantic Passive Margins: Neotectonics and 194
Postglacial Rebound, NATO Science Series C, Mathematical and Physical Sciences: 195
Dordrecht, Netherlands, Springer, v. 266, p. 581–599. 196
Kaiser, A., 2005, Neotectonic modelling of the North German Basin and adjacent areas – a tool 197
to understand postglacial landscape evolution?: Zeitschrift der Deutschen Gesellschaft für 198
Geowissenschaften, v. 156, p. 357–366, doi:10.1127/1860-1804/2005/0156-0357. 199
Kley, J., and Voigt, T., 2008, Late Cretaceous intraplate thrusting in central Europe: Effect of 200
Africa-Iberia-Europe convergence, not Alpine collision: Geology, v. 36, p. 839–842, 201
doi:10.1130/G24930A.1. 202
Kley, J., et al., 2008, Strain and stress, in Littke, R., Bayer, U., Gajewski, D., Nelskamp, S., eds., 203
Dynamics of complex intracontinental basins. The Central European Basin System: Berlin 204
Heidelberg, Germany, Springer, p. 97–124. 205

Publisher: GSA Journal: GEOL: Geology DOI:10.1130/G36710.1
Page 10 of 16
Leydecker, G., 2011, Erdbebenkatalog für die Bundesrepublik Deutschland mit Randgebieten für 206
die Jahre 800 bis 2008 (Earthquake catalog fort he Federal Republic of Germany and 207
adjacent areas fort he years 800 to 2008): Geologisches Jahrbuch Reihe E, v.59, 198 p. 208
Leydecker, G., and Kopera, J.R., 1999, Seismological hazard assessment for a site in Northern 209
Germany, an area of low seismicity: Engineering Geology, v. 52, p. 293–304, 210
doi:10.1016/S0013-7952(99)00012-5. 211
Marotta, A.M., Bayer, U., Thybo, H., and Scheck, M., 2002, Origin of regional stress in the 212
North German basin: Results from numerical modelling: Tectonophysics, v. 360, p. 245–213
264, doi:10.1016/S0040-1951(02)00358-X. 214
Mörner, N.-A., 2011, Paleoseismology: The application of multiple parameters in four case 215
studies in Sweden: Quaternary International, v. 242, p. 65–75, 216
doi:10.1016/j.quaint.2011.03.054. 217
Pedersen, S.A.S., and Gravesen, P., 2010, Low and intermediate level radioactive waste from 218
Riso, Denmark. Location studies for potential disposal areas. Report no. 3. Geological 219
setting and tectonic framework, Rapport 2010/124: Copenhagen, Geological Survey of 220
Denmark and Greenland, 51 pp. 221
Reicherter, K., Kaiser, A., and Stackebrandt, W., 2005, The post-glacial landscape evolution of 222
the North German Basin: Morphology, neotectonics and crustal deformation: International 223
Journal of Earth Sciences, v. 94, p. 1083–1093, doi:10.1007/s00531-005-0007-0. 224
Reid, H.F., 1910, The Mechanics of the Earthquake, The California Earthquake of April 18, 225
1906. Report of the State Investigation Commission, v. 2: Washington, D.C., Carnegie 226
Institution of Washington, 192 pp. 227
Publisher: GSA Journal: GEOL: Geology DOI:10.1130/G36710.1
Page 11 of 16
Sauber, J.M., and Molnia, B.F., 2004, Glacier ice mass fluctuations and fault instability in 228
tectonically active southern Alaska: Global and Planetary Change, v. 42, p. 279–293. 229
Scheck-Wenderoth, M., and Lamarche, J., 2005, Crustal memory and basin evolution in the 230
Central European Basin System - new insights from a 3D structural model: Tectonophysics, 231
v. 397, p. 143–165, doi:10.1016/j.tecto.2004.10.007. 232
Senglaub, Y., Brix, M.R., Adriasola, A.C., and Littke, R., 2005, New information on the thermal 233
history of the southwestern Lower Saxony Basin, northern Germany, based on fission track 234
analysis: International Journal of Earth Sciences, v. 94, p. 876–896, doi:10.1007/s00531-235
005-0008-z. 236
Stein, R.S., 2003, Earthquake conversations: Scientific American, v. 288, no. 1, p. 72–79, 237
doi:10.1038/scientificamerican0103-72. 238
Stein, S., and Liu, M., 2009, Long aftershock sequences within continents and implications for 239
earthquake hazard assessment: Nature, v. 462, p. 87–89, doi:10.1038/nature08502. 240
Stewart, I.S., Sauber, J., and Rose, J., 2000, Glacio-seismotectonics: Ice sheets, crustal 241
deformation and seismicity: Quaternary Science Reviews, v. 19, p. 1367–1389, 242
doi:10.1016/S0277-3791(00)00094-9. 243
Sykes, L.R., 1978, Intraplate seismicity, reactivation of preexisting zones of weakness, alkaline 244
magmatism, and other tectonism postdating continental fragmentation: Reviews of 245
Geophysics and Space Physics, v. 16, p. 621–688, doi:10.1029/RG016i004p00621. 246
Vogt, J., and Grünthal, G., 1994, Die Erdbebenfolge vom Herbst 1612 im Raum Bielefeld: 247
Geowissenschaften, v. 12, p. 236–240. 248
Voigt, T., Wiese, F., von Eynatten, H., Franzke, H.-J., and Gaupp, R., 2006, Facies evolution of 249
syntectonic Upper cretaceous deposits in the Subhercynian Cretaceous Basin and adjoining 250
Publisher: GSA Journal: GEOL: Geology DOI:10.1130/G36710.1
Page 12 of 16
areas (Germany): Zeitschrift der Deutschen Gesellschaft für Geowissenschaften, v. 157, 251
p. 203–243, doi:10.1127/1860-1804/2006/0157-0203. 252
Wells, D.L., and Coppersmith, K.J., 1994, New Empirical Relationships among Magnitude, 253
Rupture Length, Rupture Width, Rupture Area, and Surface Displacement: Bulletin of the 254
Seismological Society of America, v. 84, no. 4, p. 974–1002. 255
Wiprut, D., and Zoback, M.D., 2000, Fault reactivation and fluid flow along a previously 256
dormant normal fault in the northern North Sea: Geology, v. 28, p. 595–598, 257
doi:10.1130/0091-7613(2000)28<595:FRAFFA>2.0.CO;2. 258
Wu, P., and Hasegawa, H.S., 1996, Induced stresses and fault potential in eastern Canada due to 259
a disc load: a preliminary analysis: Geophysical Journal International, v. 125, 415-430, doi: 260
10.1111/j.1365-246X.1996.tb00008.x. 261
Wu, P., Johnston, P., and Lambeck, K., 1999, Postglacial rebound and fault instability in 262
Fennoscandia: Geophysical Journal International, v. 139, p. 657–670, doi:10.1046/j.1365-263
246x.1999.00963.x. 264
265
FIGURE CAPTIONS 266
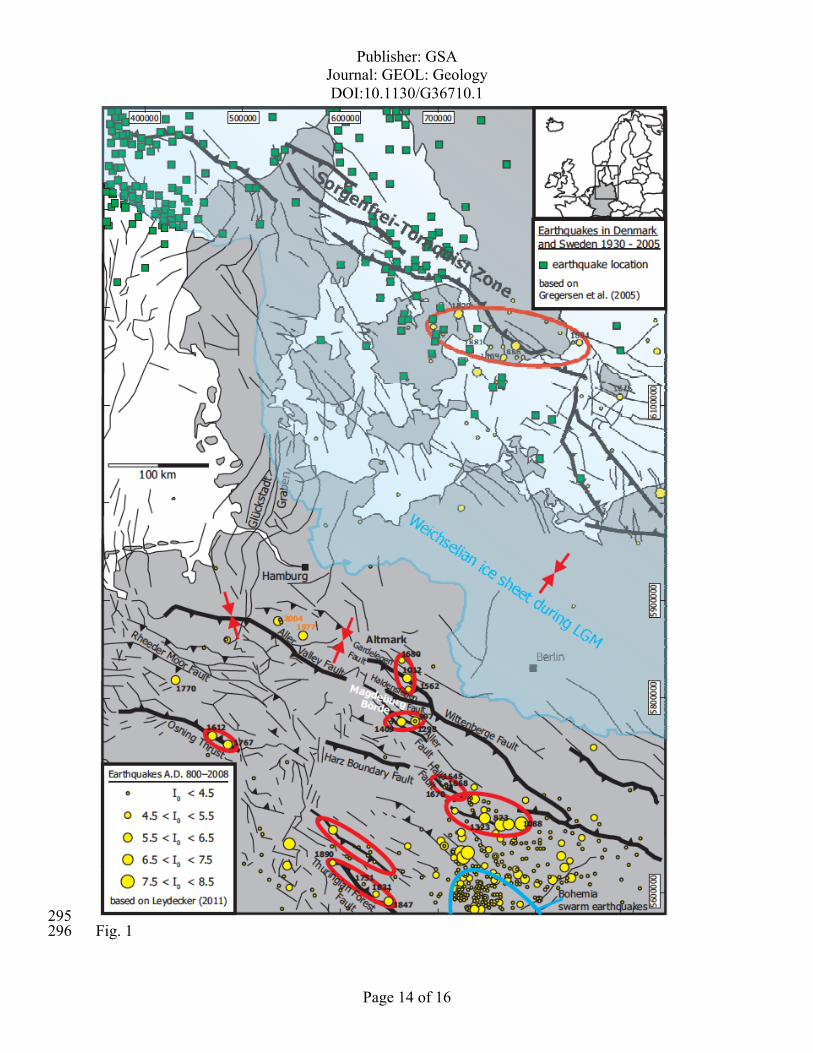
Figure 1. Faults of northern Central Europe and epicenters of historic earthquakes. Bold 267
lines are major Late Cretaceous reverse faults. Yellow dots are historic earthquakes from 800 to 268
2008; some are labeled with event year. Green squares are earthquakes from 1930 to 2005. Map 269
based on Kley and Voigt (2008) earthquake locations from Gregersen et al. (2005) and 270
Leydecker (2011). Red arrows indicate the recent stress field orientation based on Marotta et al. 271
(2002) and Reicherter et al. (2005). Red ellipses indicate potential earthquake clusters. Blue line 272
delineates swarm earthquakes in Bohemia. LGM – Last Glacial Maximum. 273

Publisher: GSA Journal: GEOL: Geology DOI:10.1130/G36710.1
Page 13 of 16
Figure 2. Change in Coulomb Failure Stress (δCFS) for major reverse faults in northern 274
Central Europe and southern Sweden induced by the Weichselian glaciation in the last 23 275
ka and the effect of the first fault slip (when zero line is reached for the first time). Fault 276
names are preceded by year(s) (in A.D.) of historical event(s). Three different rheological models 277
(U1L1_V1, U3L3_V1, U3L3_V3) are used for calculation, see data repository for more 278
information. Numbers in legend indicate fault slips in m derived for the Osning Thrust based on 279
the inferred magnitude of the Late Glacial seismicity. Numbers in parentheses are typical 280
intraplate fault slips in m from Wells and Coppersmith (1994). Graphs without earthquake 281
influence (“none”) are exemplarily shown for A and B only. More locations are shown in the 282
Data Repository Fig. DR8 (see footnote 1). 283
Figure 3. Models that can explain both the geological fault slip and historical earthquakes 284
at the Osning Thrust (Central Europe) simultaneously. Solid lines show best–fitting model 285
estimates (for rheological models U1L1_V1 and U3L3_V3): (A) For the A.D. 1612 event, fault 286
slip of 0.98 m indicates activity at 3 and 1 ka (blue line). (B) For the A.D. 1767 event, fault slip 287
of 1.03 m indicates activity at 5 and 3 ka BP (red line); fault slip of 0.93 m indicates activity 288
between 7 and 6 ka BP (blue line). Shaded area is range of predicted change in Coulomb failure 289
stress (δCFS) by our models after the first earthquake. 290
1GSA Data Repository item 2015xxx, xxxxxxxx, is available online at 291
www.geosociety.org/pubs/ft2015.htm, or on request from [email protected] or Documents 292
Secretary, GSA, P.O. Box 9140, Boulder, CO 80301, USA. 293
294
Publisher: GSA Journal: GEOL: Geology DOI:10.1130/G36710.1
Page 14 of 16
295 Fig. 1 296

Publisher: GSA Journal: GEOL: Geology DOI:10.1130/G36710.1
Page 15 of 16
297 Figure 2 298

Publisher: GSA Journal: GEOL: Geology DOI:10.1130/G36710.1
Page 16 of 16
299 Figure 3 300