understanding the effects of groundwater pumping … · understanding the effects of groundwater...
TRANSCRIPT

Understanding the Effects of
Groundwater Pumping on
Streamflow Depletion through
USGS Capture Maps
U.S. Geological Survey Cooperative Water
Program Stakeholder Webinar
November 20, 2013

Presentation Outline
Streamflow Depletion by Wells: What is it?
What factors affect the rates, locations, and
timing of depletion?
Capture Maps: What are they? Why are they
needed?
Elkhorn and Loup River Basins, Nebraska,
and History of Water Management
Capture Maps for the Elkhorn and Loup River
Basins and how they are used for water
management by the Lower Loup Natural
Resources District

Streamflow Depletion by Wells
Reduces streamflow
Changes the mix of sources of water to streams
Consequent changes in water quality/temperature
Impacts aquatic and riparian biota

http://pubs.usgs.gov/circ/1376/
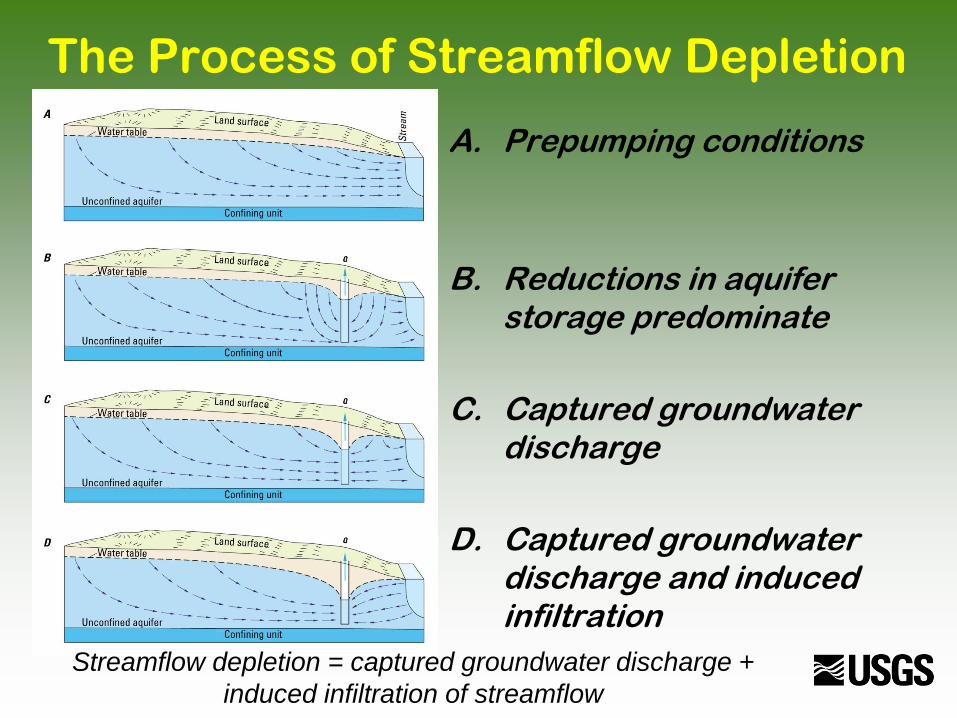
A. Prepumping conditions
B. Reductions in aquifer storage predominate
C. Captured groundwater discharge
D. Captured groundwater discharge and induced infiltration
The Process of Streamflow Depletion
Streamflow depletion = captured groundwater discharge +
induced infiltration of streamflow

Timing of Streamflow Depletion

Factors that Affect the Timing, Rates,
and Locations of Streamflow Depletion
Geology and Hydraulic Properties of Aquifer
Aquifer Dimensions (size)
Geometry of the stream network
Well location (Vertical and Horizontal
Distance from Streams)
Pumping rates and pumping schedules
The timing of streamflow depletion varies
substantially among aquifer systems, and
even within aquifer systems.

Hunt River Basin, Rhode Island
Streamflow depletion is the primary source
of water to the wells in days to months.
Streamflow depletion, as
fraction of pumping rate
Time, in
days 0 1 mi

Upper San Pedro Basin, Arizona
Streamflow depletion, as
fraction of pumping rate
Time, in
years
Streamflow depletion is the primary source
of water to the wells in years to decades.
0 10 mi

Pumping Can Affect Other Hydrologic Features:
Springs, Wetlands, Coastal Discharge,
Evapotranspiration

Presentation Outline
Streamflow Depletion by Wells: What is it?
What factors affect the rates, locations, and
timing of depletion?
Capture Maps: What are they? Why are they
needed?
Elkhorn and Loup River Basins, Nebraska,
and History of Water Management
Capture Maps for the Elkhorn and Loup River
Basins and how they are used for water
management by the Lower Loup Natural
Resources District

A New Tool: Capture Maps
Constructed using
groundwater models
Give a sense of timing of
capture by one well as a
function of well location
Applications: Arizona,
Michigan, Nebraska,
Oregon

Why Map Capture?
To help water managers and other interested
parties understand relation between pumping
location and the timing of streamflow
depletion or other capture
To help with specific regulations relating to
groundwater pumping

Computed capture by pumping in layer 4 for 10 yrs

Computed capture by pumping in layer 4 for 50 yrs

Artificial recharge into uppermost layer for 10 yrs

Artificial recharge into uppermost layer for 50 yrs

Presentation Outline
Streamflow Depletion by Wells: What is it?
What factors affect the rates, locations, and
timing of depletion?
Capture Maps: What are they? Why are they
needed?
Elkhorn and Loup River Basins, Nebraska,
and History of Water Management
Capture Maps for the Elkhorn and Loup River
Basins and how they are used for water
management by the Lower Loup Natural
Resources District
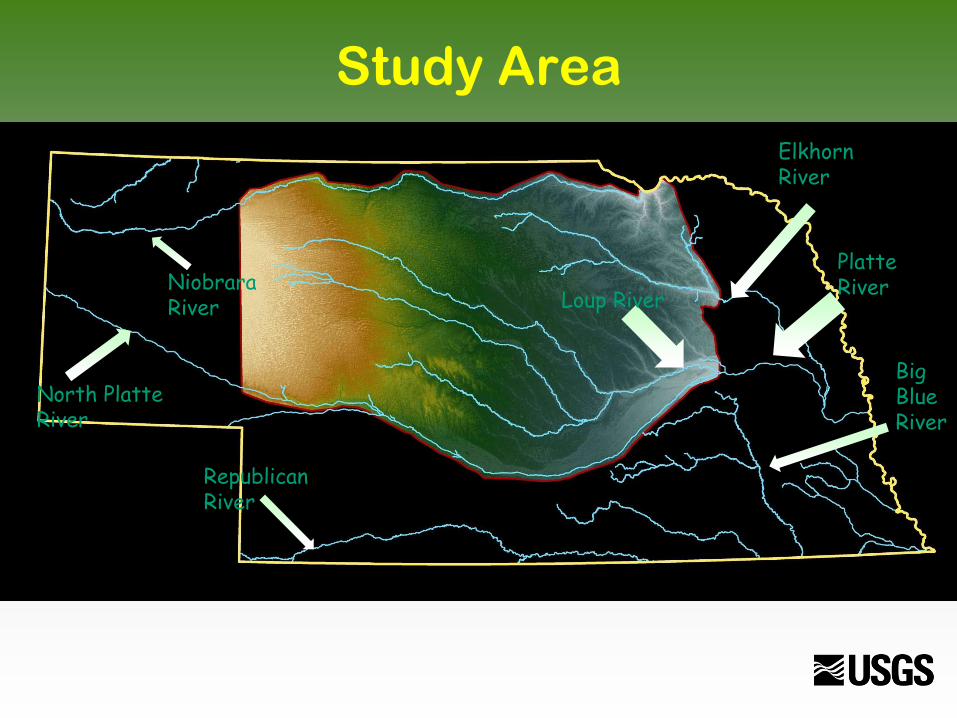
Study Area
Elkhorn River
Platte River
Republican River
North Platte River
Niobrara River
Big Blue River
Loup River

A common
conception
of
Nebraska…

But it’s different in the Sand Hills…

With baseflow-dominated streams,

… and inter-dunal lakes

Sand Hills Characteristics
Largely undeveloped, other than pasture and
rangeland
High infiltration rates = high rates of recharge,
low runoff
Predominantly base flow streams
– Groundwater discharge is the major source
of stream flow (up to 90% of stream flow)
Highly inter-connected surface-water
and groundwater!

Geology

Background – Nebraska Water
Management and Law
Surface-water Rights
– Prior appropriations, administered at the
State level
Groundwater Rights
– Correlative Rights, administered by 23
Natural Resources Districts
Under this system, no recognized connection
between surface-water and groundwater

Legislative Bill (LB) 962, 2004
First recognition of connection between
surface-water and groundwater resources
Legal recognition of connection directly led to
increased need for stream depletion capture
maps, many completed through cooperative
studies
ELM is a cooperative study with the USGS
and several state and regional agencies

Elkhorn-Loup Model (ELM)
Reports 2005-2012

Presentation Outline
Streamflow Depletion by Wells: What is it?
What factors affect the rates, locations, and
timing of depletion?
Capture Maps: What are they? Why are they
needed?
Elkhorn and Loup River Basins, Nebraska,
and History of Water Management
Capture Maps for the Elkhorn and Loup River
Basins and how they are used for water
management by the Lower Loup Natural
Resources District

Elkhorn-Loup
Model (ELM)
Construction
and Capture
Maps

Model Construction and Calibration
Wells
ET Hydraulic Conductivity
Recharge

From Model to Capture Maps
Run a baseline simulation for a 50-year period (2006 to
2055)
Make 22,000 additional simulations for the 50-year
period, each time simulating pumping from a single,
hypothetical well location
For each run, compute the volumetric fractions of
pumped water from the well derived from groundwater
storage, base flow, and evapotranspiration (ET)
Create capture maps of groundwater storage, base flow,
and ET for all pumping well locations
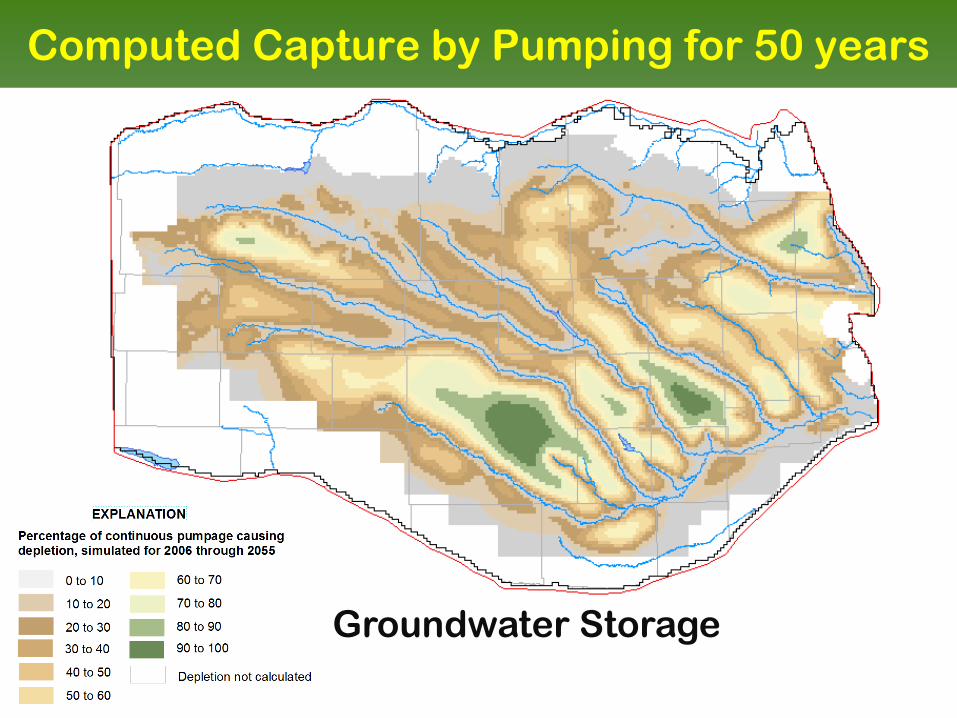
Computed Capture by Pumping for 50 years
Groundwater Storage

Computed Capture by Pumping for 50 years
Stream Base Flow
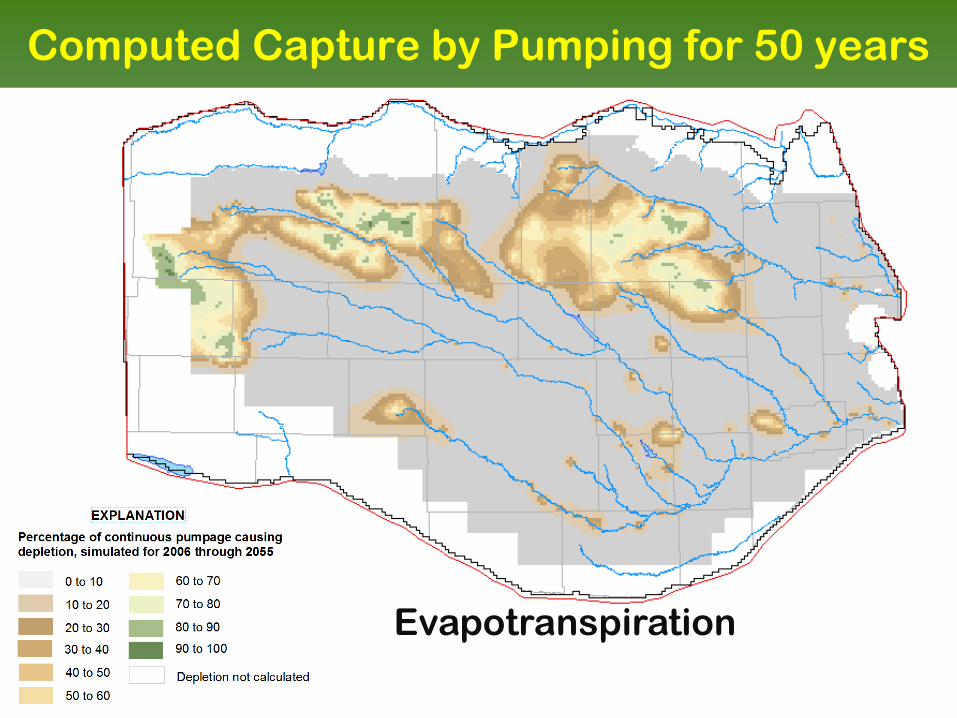
Computed Capture by Pumping for 50 years
Evapotranspiration


Overview of Lower Loup NRD’s
Management using ELM capture maps: (1) Irrigated Acre Transfer Rule
(2) Irrigation Right Banking Program
(3) New Acre Allocation
(4) Variance Committee & Conclusion

Background on Irrigation
Management
Lower Loup NRD (LLNRD) management
implemented:
– Well Moratorium January 1st, 2007
– Acre Moratorium January 1st, 2008
Required landowners to certify
all irrigated acres
LLNRD creates GIS shapefile of each
certification
Currently:
– 1.2 million acres certified

‘Stream-Depletion Factor (SDF)’map =
Stream Base Flow + ET maps
+
Stream Base Flow
State of Nebraska (Department of NR)
– Used in determination of water appropriation
Accounts for all potential “sinks” to stream flow
Evapotranspiration

Resulting SDF Map (Phase 2, ELM results)
Each section is assigned an SDF as a percent (%) depletion. Results from the COHYST study were also included in the final number.

(1) Irrigated Acre Transfer
LLNRD acknowledges the need for changes in
farming operations
New use (depletion) should not impact different
watershed nor cause increase depletion to a
stream
Downstream
transfers only

Watershed-USGS Hydrologic Units
•USGS HUC’s plus 2 mile buffer
•Overlap can transfer to either basin

Transfer Rules Continued
Transfers shall be based on stream-depletion factors
(with no net increase in irrigated acres):
Transfers to a lower stream-depletion factor result in
1:1 acre exchange and addition to bank
Transfers to a higher stream-depletion factor result in
decreased acres transferred. Example:
• 55 Acres requested @ 90% SDF
• Requires 100 Acres transferred from 50% SDF
• This offsets the increased impact to stream

Total Transfers Processed
YEAR
TRANSFERS
Processed
(#)
ACRES
TRANSFERRED
TO
ACRES
TRANSFERRED
FROM (removed)
2010 30 1,790 1,920
2011 77 4,990 5,180
2012 174 9,640 9,600
2013 225 7,530 7,860
To Date 2014 14 630 640
TOTALS 520 24,580 25,200

(2) Irrigated Acre Banking Program
Acres that are removed
from the initial certification
and are not re-used as
offset are declared
“Banked” by the NRD
SDF provides a weighted
value for these acres should
they be applied elsewhere
Transfers to a lower stream
depletion factor result in 1:1
acre exchange and addition
to bank

(3) New Acre Allocation
Nebraska LB483 allowed an additional 10,000 irrigated
acres over 4 years per NRD
Encompasses Areas that were erroneously declared “Fully
Appropriated” by Nebraska State Department of Natural
Resources
Most of ELM Area
– Phase I

Number of acres applied for and map designating location of new irrigated acres
In four years, LLNRD processed 1,786 apps
Each Application is subject to LLNRD approved Ranking Criteria

SDF utilized in all new allocations, modifications,
and transfers of any irrigation acre rights in LLNRD
SDF is referenced/requested prior to any decision
for a variance to LLNRD rules and regulations
Realtors, insurance agencies, attorneys, county
assessors, and landowners all acquire SDF prior to
any work with irrigated acres
(4) Constituents, Committees &
Conclusion
The presentation with audio is posted at:
http://water.usgs.gov/coop/
Speakers and Contacts for More Information:
Paul Barlow, Hydrologist, USGS, Office of Groundwater, Northborough, MA (508) 490-5070
Stanley Leake, Research Hydrologist, USGS, Arizona Water Science Center, Tucson, AZ
(520) 670-6671 x259
Steven Peterson, Lead Hydrologist, USGS Nebraska Water Science Center, Lincoln, NE
(402) 328-4151
Jennifer Stanton, Hydrologist, USGS Nebraska Water Science Center, Lincoln, NE
(402) 261-0458
Tylr Naprstek, Water Modeling Coordinator, Lower Loup Natural Resources District,
Ord, Nebraska (308) 728-3221
serving water needs