ups case study - ieee · leggc usss sacy ups systems • legacy ups systems were originally...
TRANSCRIPT

UPS CASE UPS CASE STUDYSTUDYSERVER INCOMPATIBILITYINCOMPATIBILITY
PRESENTED AT IEEE / MCPQG MEETINGNOVEMBER 28, 2012
BY MIKE PUCKETT, PE,
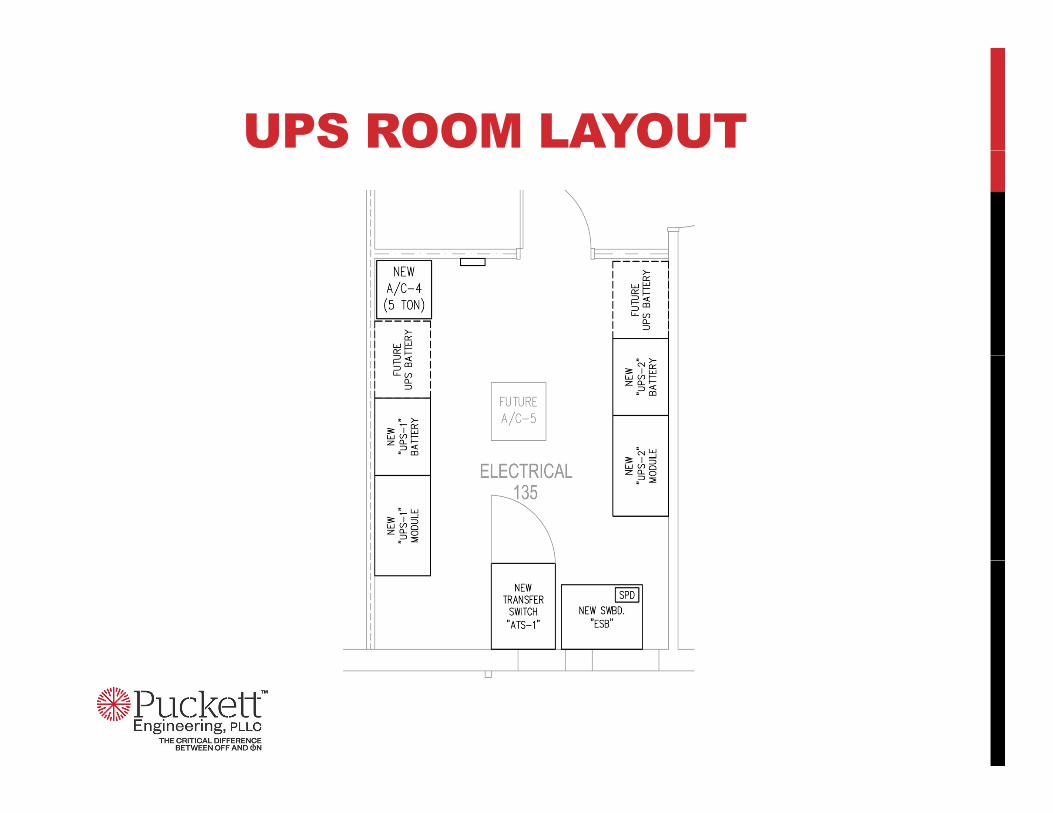
UPS ROOM LAYOUT
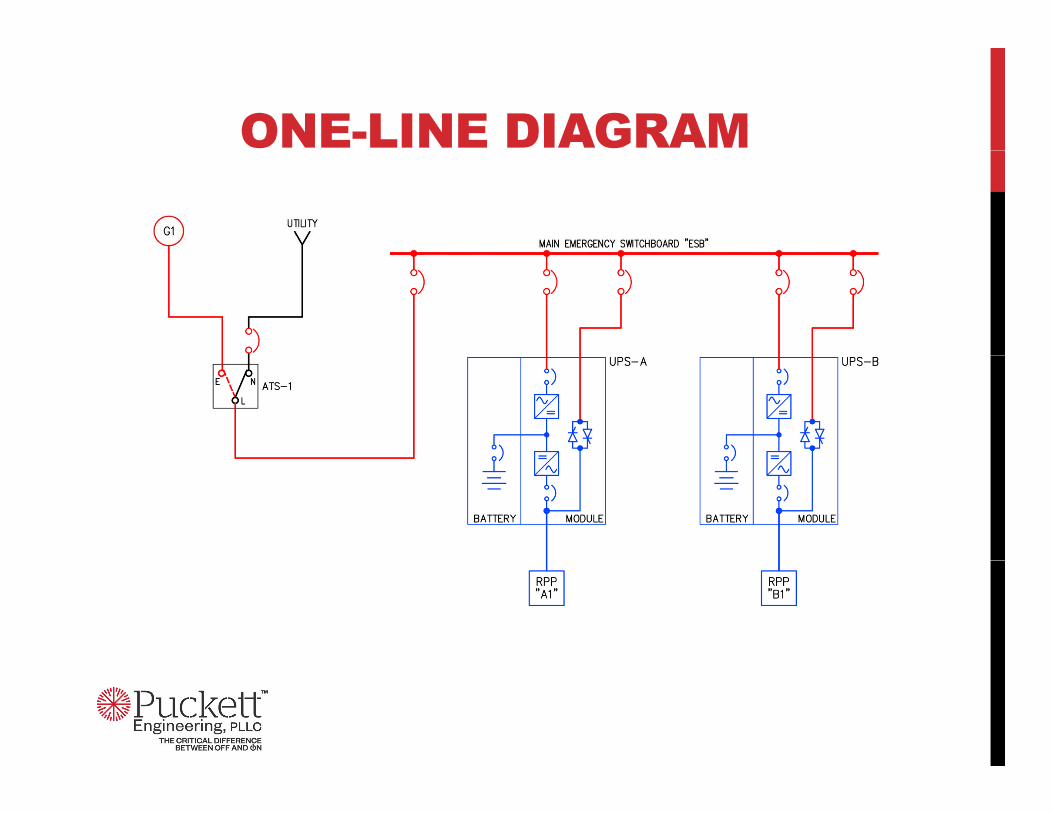
ONE-LINE DIAGRAM
LOADS
Initial Load on UPS S stems as abo t• Initial Load on UPS Systems was about 13% eachI iti l M i H t G i i th UPS• Initial Maximum Heat Gain in the UPS Room about 90% of the A/C rating based on each UPS being 25% loadedon each UPS being 25% loaded
A/C PERFORMANCE
A/C nit set point as 68 and space• A/C unit set-point was 68 and space temperature was running about 77Wh l d• When compressor cycled, space temperature climbed to low 80’s during the compressor’s 3 minute time delaycompressor s 3 minute time delay
INVESTIGATION
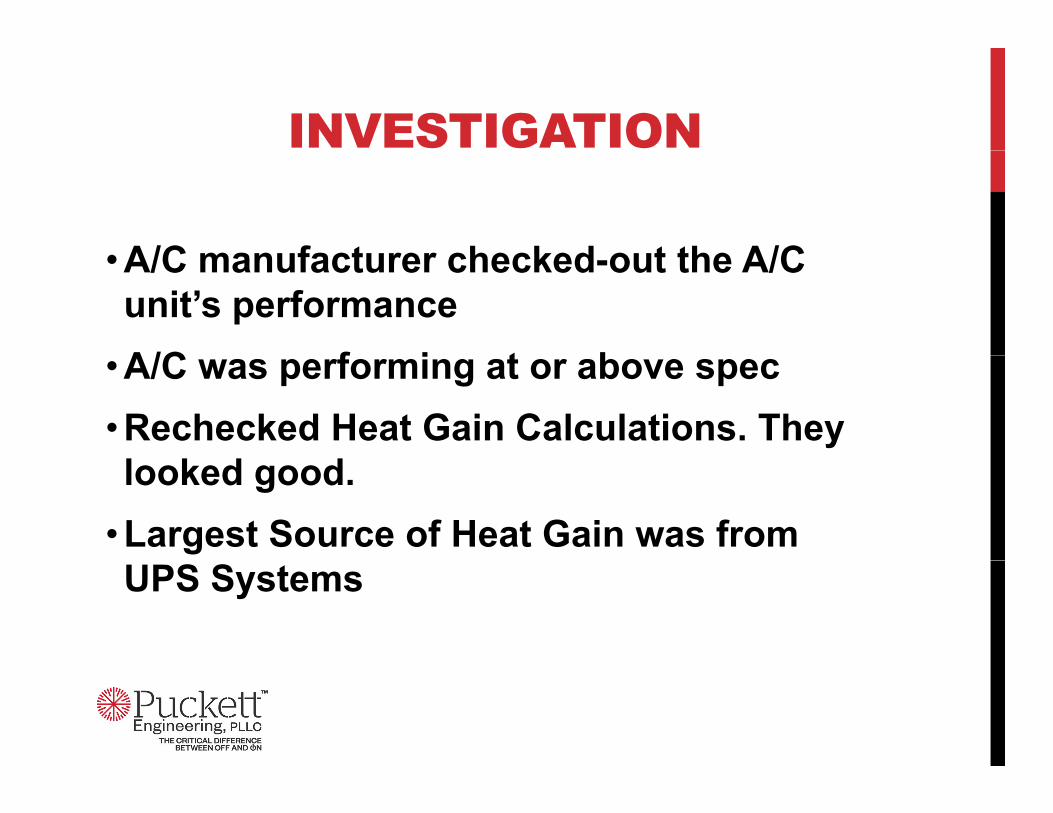
A/C man fact rer checked o t the A/C• A/C manufacturer checked-out the A/C unit’s performance A/C f i t b• A/C was performing at or above spec
• Rechecked Heat Gain Calculations. They looked good.
• Largest Source of Heat Gain was from UPS Systems

INVESTIGATION• Researched UPS Heat Loss• Efficiency = Pin/Pout• Heat Loss = Pin – Pout = Pout/Eff - Pout• UPS Heat Losses Include:
• No-Load Losses: Transformer & Inductor o oad osses a s o e & ductocore loss, capacitors, fans, controls
• Load Proportional Losses: Switching• Load I²R Losses: Transformer & Inductor coil loss, Conductors, Conduction
INVESTIGATION
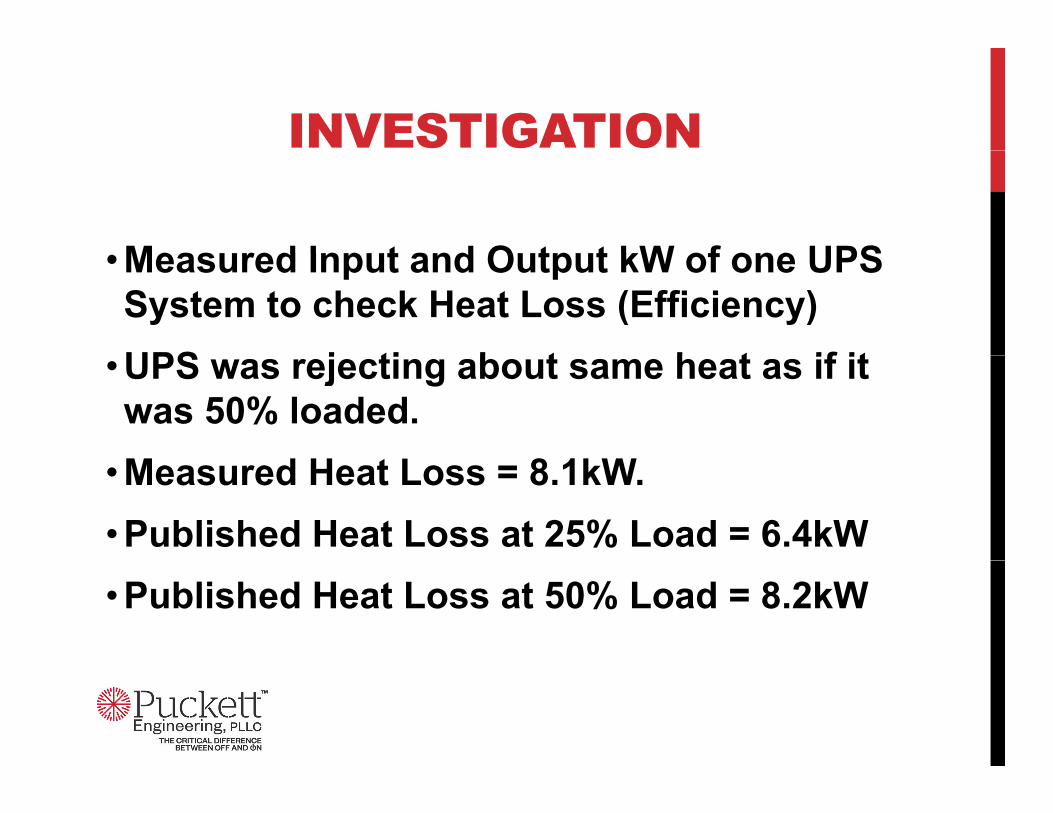
Meas red Inp t and O tp t kW of one UPS• Measured Input and Output kW of one UPS System to check Heat Loss (Efficiency)UPS j ti b t h t if it• UPS was rejecting about same heat as if it was 50% loaded.
• Measured Heat Loss = 8.1kW.• Published Heat Loss at 25% Load = 6.4kW• Published Heat Loss at 50% Load = 8.2kW

INVESTIGATION
UPS Man fact rer decided to perform• UPS Manufacturer decided to perform their own testingM d I t d O t t kWh d DC• Measured Input and Output kWh and DC Link simultaneously for ~15 minutes.
ff f• Difference of above divided by Time = Heat Loss
• Did this for normal 13% load and with all load on one UPS (22%)
UPS HEAT LOSS MEASUREMENTS
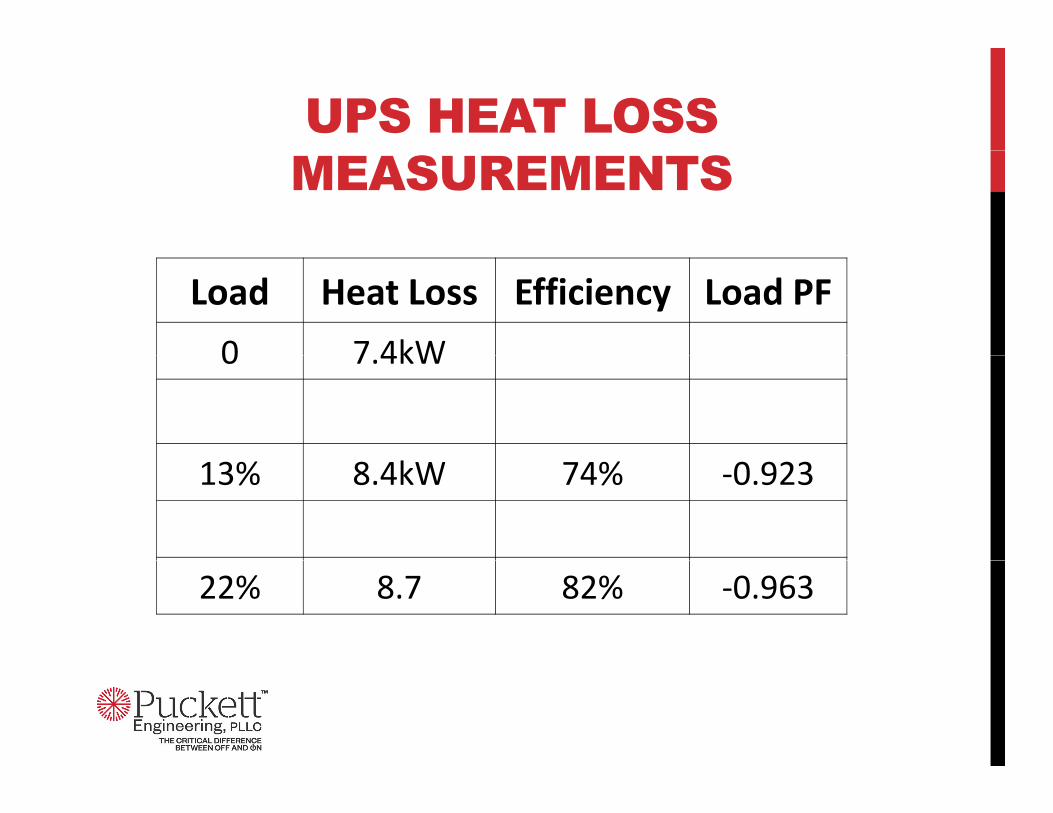
Load Heat Loss Efficiency Load PF
0 7 4kW0 7.4kW
13% 8.4kW 74% ‐0.923
22% 8.7 82% ‐0.963
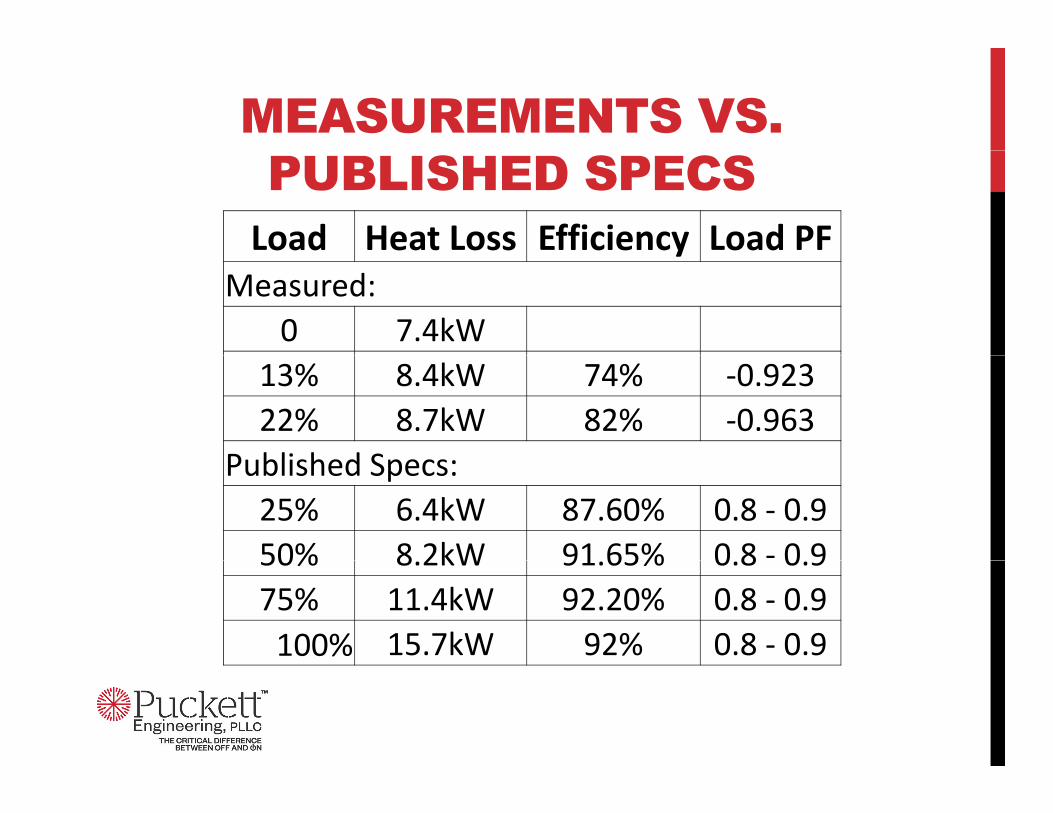
MEASUREMENTS VS. PUBLISHED SPECSLoad Heat Loss Efficiency Load PFy
Measured:0 7.4kW
13% 8.4kW 74% ‐0.92322% 8.7kW 82% ‐0.963
P bli h d SPublished Specs:25% 6.4kW 87.60% 0.8 ‐ 0.950% 8 2kW 91 65% 0 8 ‐ 0 950% 8.2kW 91.65% 0.8 0.975% 11.4kW 92.20% 0.8 ‐ 0.9100% 15.7kW 92% 0.8 ‐ 0.9
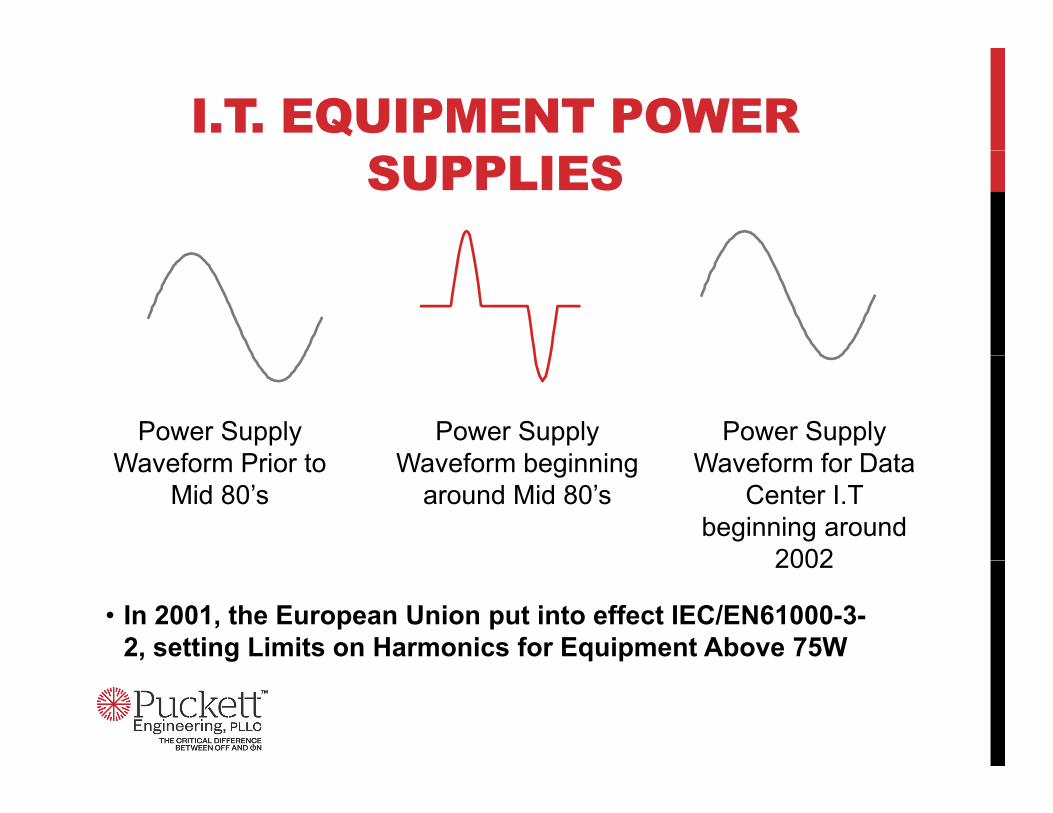
I.T. EQUIPMENT POWER SUPPLIES
Power Supply Wa eform Prior to
Power Supply Wa eform beginning
Power Supply Wa eform for DataWaveform Prior to
Mid 80’sWaveform beginning
around Mid 80’sWaveform for Data
Center I.T beginning around
2002
• In 2001, the European Union put into effect IEC/EN61000-3-2, setting Limits on Harmonics for Equipment Above 75W
2002

SWITCH-MODE POWER SUPPLY (SMPS)
Total PF~0.7
• SMPS prior to the European mandate and those currently not in compliance.
• It seems most non-Data Center equipment in U.S. does not comply with the European mandate and thus uses this SMPScomply with the European mandate and thus uses this SMPS
SWITCH-MODE POWER SUPPLY (SMPS)
P F t C t d (PFC) SMPS ft th 2001
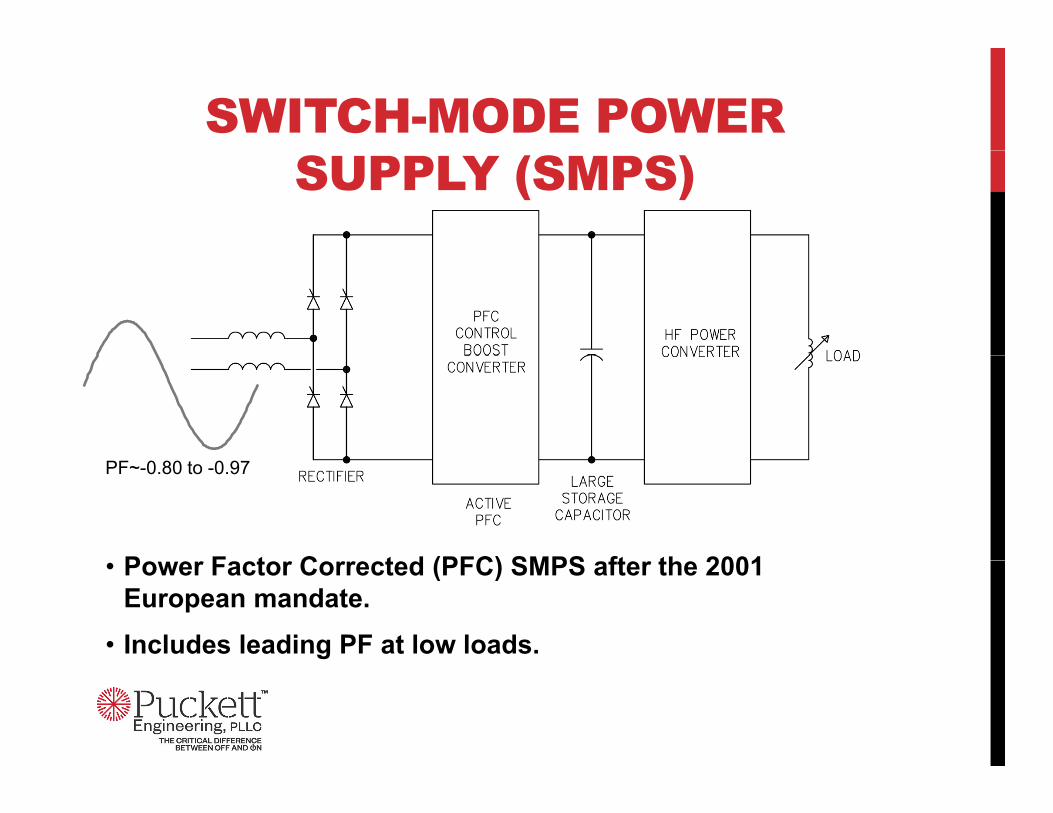
PF~-0.80 to -0.97
• Power Factor Corrected (PFC) SMPS after the 2001 European mandate.
• Includes leading PF at low loads.
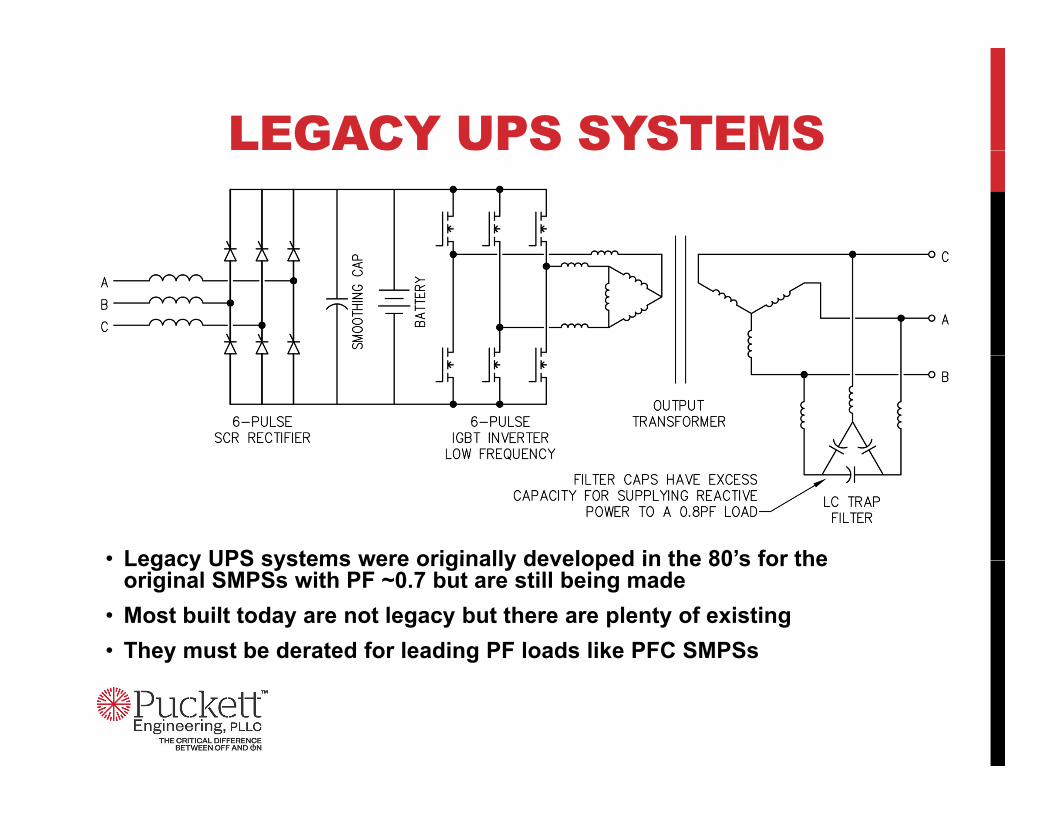
LEGACY UPS SYSTEMSG C U S S S S
• Legacy UPS systems were originally developed in the 80’s for the• Legacy UPS systems were originally developed in the 80 s for the original SMPSs with PF ~0.7 but are still being made
• Most built today are not legacy but there are plenty of existing• They must be derated for leading PF loads like PFC SMPSs
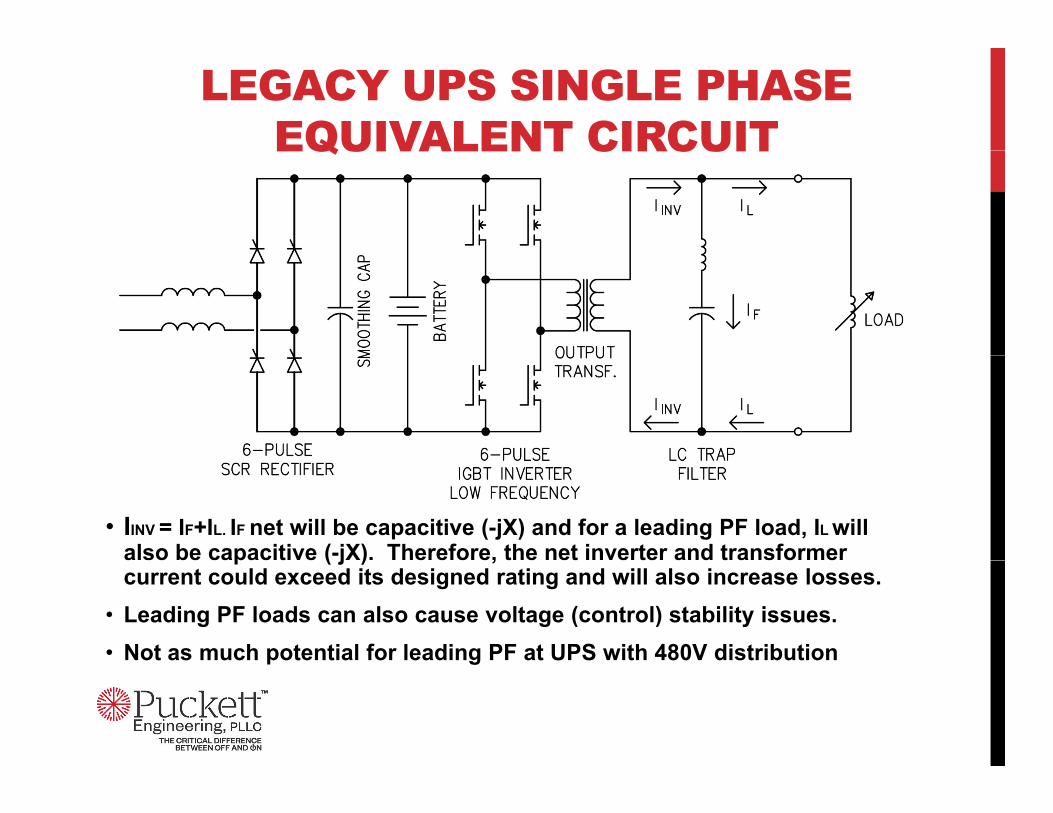
LEGACY UPS SINGLE PHASE EQUIVALENT CIRCUITEQUIVALENT CIRCUIT
• IINV = IF+IL. IF net will be capacitive (-jX) and for a leading PF load, IL will also be capacitive (-jX). Therefore, the net inverter and transformer p ( j ) ,current could exceed its designed rating and will also increase losses.
• Leading PF loads can also cause voltage (control) stability issues.• Not as much potential for leading PF at UPS with 480V distributionp g

CONCLUSIONS• Know what you are specifying and getting• Know what you are specifying and getting.
K h t th l d• Know what the loads are.
• Get the most accurate heat loss data you can from the manufacturer
LIGHTNING LIGHTNING CASE CASE STUDYSTUDY
S / C QG GPRESENTED AT IEEE / MCPQG MEETINGNOVEMBER 28, 2012
BY MIKE PUCKETT, PE
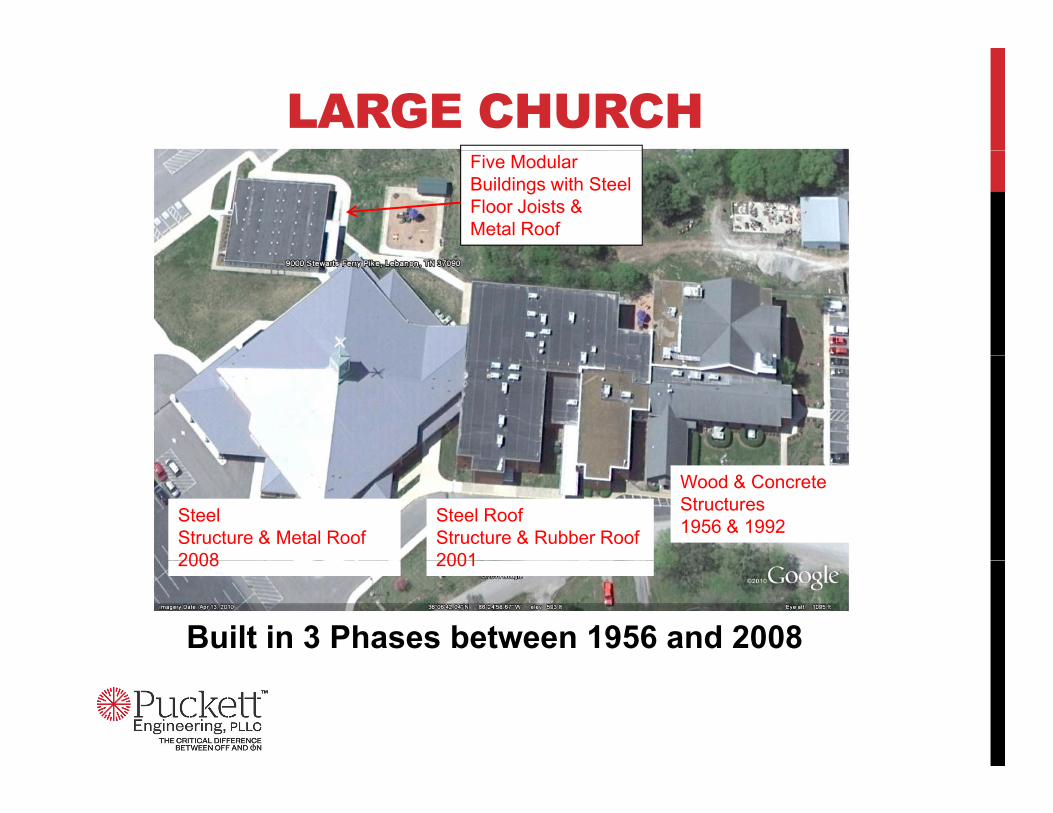
LARGE CHURCHFive Modular Buildings with Steel Floor Joists & Metal Roof
Wood & ConcreteStructures1956 & 1992Steel Roof
Structure & Rubber Roof 2001
SteelStructure & Metal Roof2008
Built in 3 Phases between 1956 and 2008
20012008
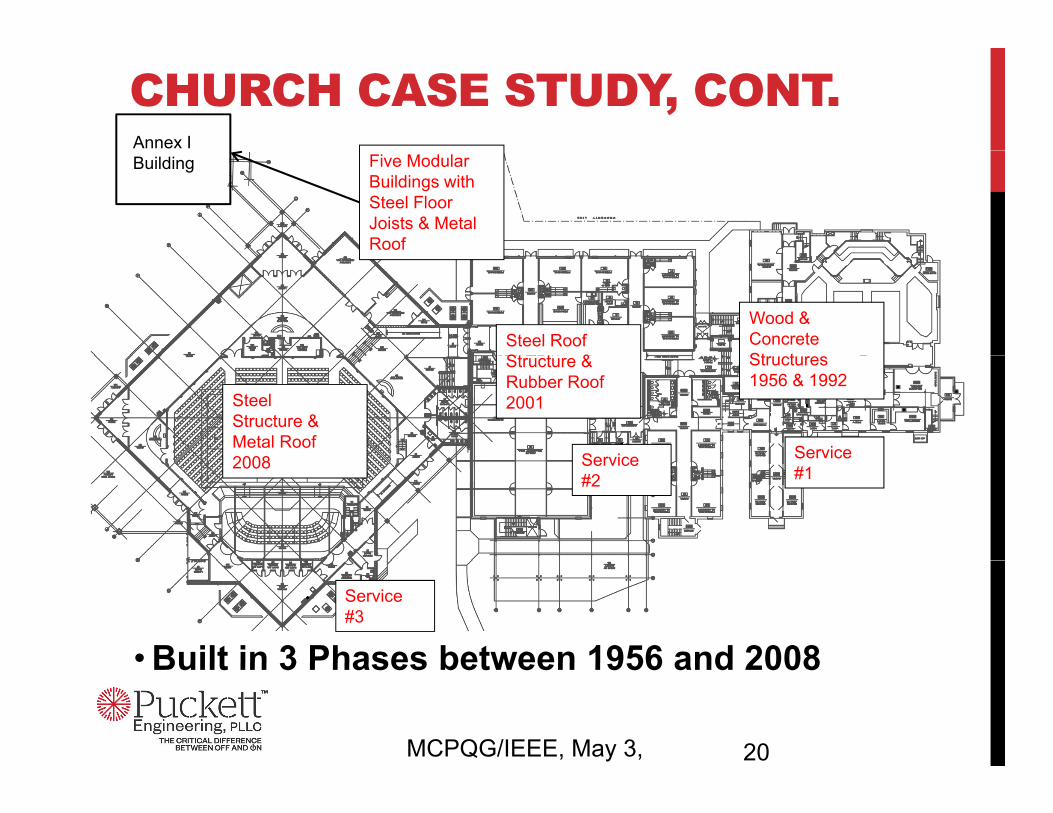
CHURCH CASE STUDY, CONT.Annex I
Five Modular Buildings with Steel Floor Joists & Metal Roof
Building
Wood & ConcreteSt t
Steel RoofSt t & Structures
1956 & 1992Structure & Rubber Roof2001Steel
Structure & Metal Roof2008 Service Service2008 Service
#2Service #1
• Built in 3 Phases between 1956 and 2008
Service #3
20
Built in 3 Phases between 1956 and 2008
MCPQG/IEEE, May 3,

CHURCH CASE STUDY, CONT.
Newest 2008 Sanctuary Addition
21MCPQG/IEEE, May 3,
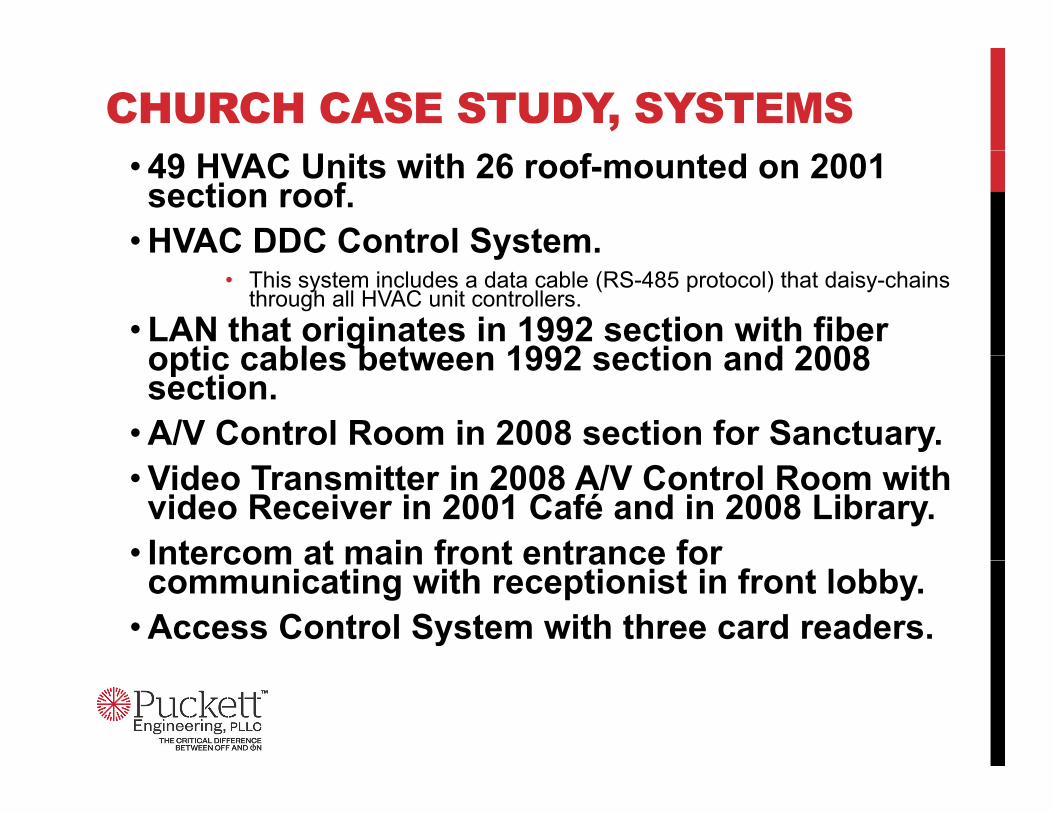
CHURCH CASE STUDY, SYSTEMS• 49 HVAC Units with 26 roof-mounted on 2001 section roof.
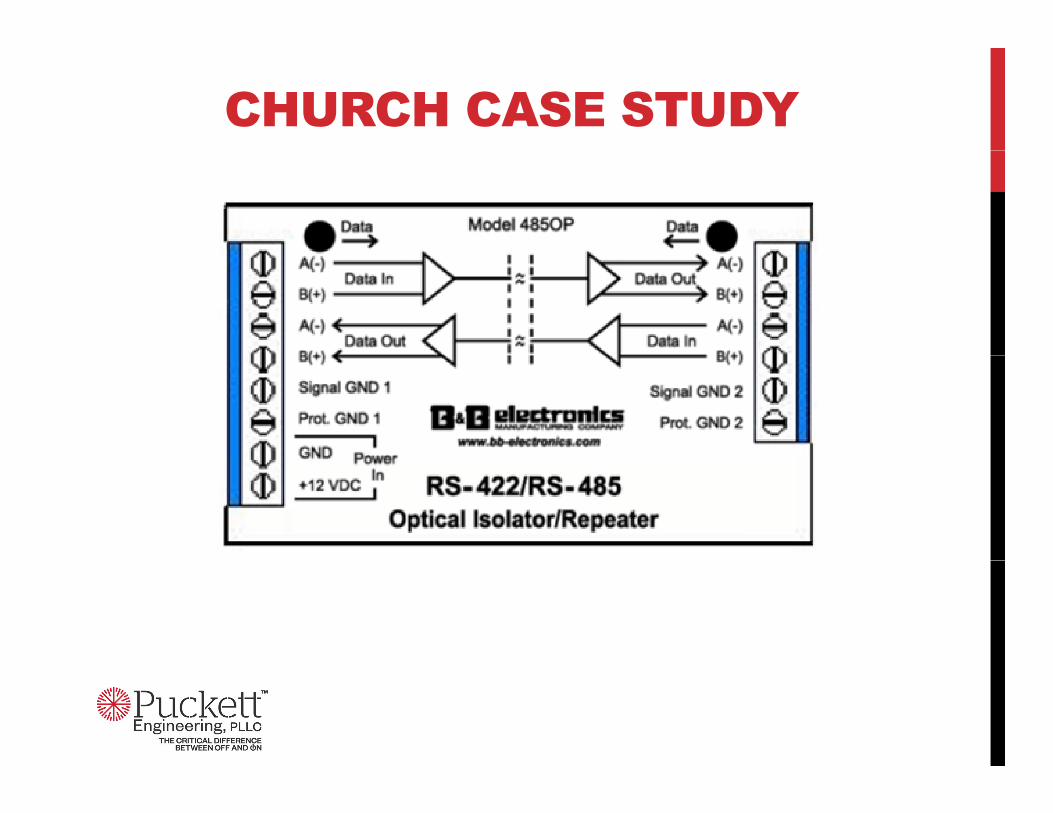
• HVAC DDC Control System.C C Co t o Syste• This system includes a data cable (RS-485 protocol) that daisy-chains
through all HVAC unit controllers.• LAN that originates in 1992 section with fiber optic cables between 1992 section and 2008optic cables between 1992 section and 2008 section.
• A/V Control Room in 2008 section for Sanctuary.• Video Transmitter in 2008 A/V Control Room with video Receiver in 2001 Café and in 2008 Library.
• Intercom at main front entrance forIntercom at main front entrance for communicating with receptionist in front lobby.
• Access Control System with three card readers.

CHURCH CASE STUDY
SITE SURVEY AND ANALYSIS

CHURCH CASE STUDY• HVAC DDC Control System.
• This was the main damage that occurred repeatedly. • It occurred occasionally before the 2008 section but
escalated after the 2008 section.• This system includes a data cable (RS-485 protocol)
that daisy chains through all HVAC unit controllersthat daisy-chains through all HVAC unit controllers.
• Video Transmitter in 2008 A/V Control Room and video Receiver in 2001 Café. The café receiver had been damaged 2 to 3 times prior to 2010.
• Intercom and Card reader at main front entrance.
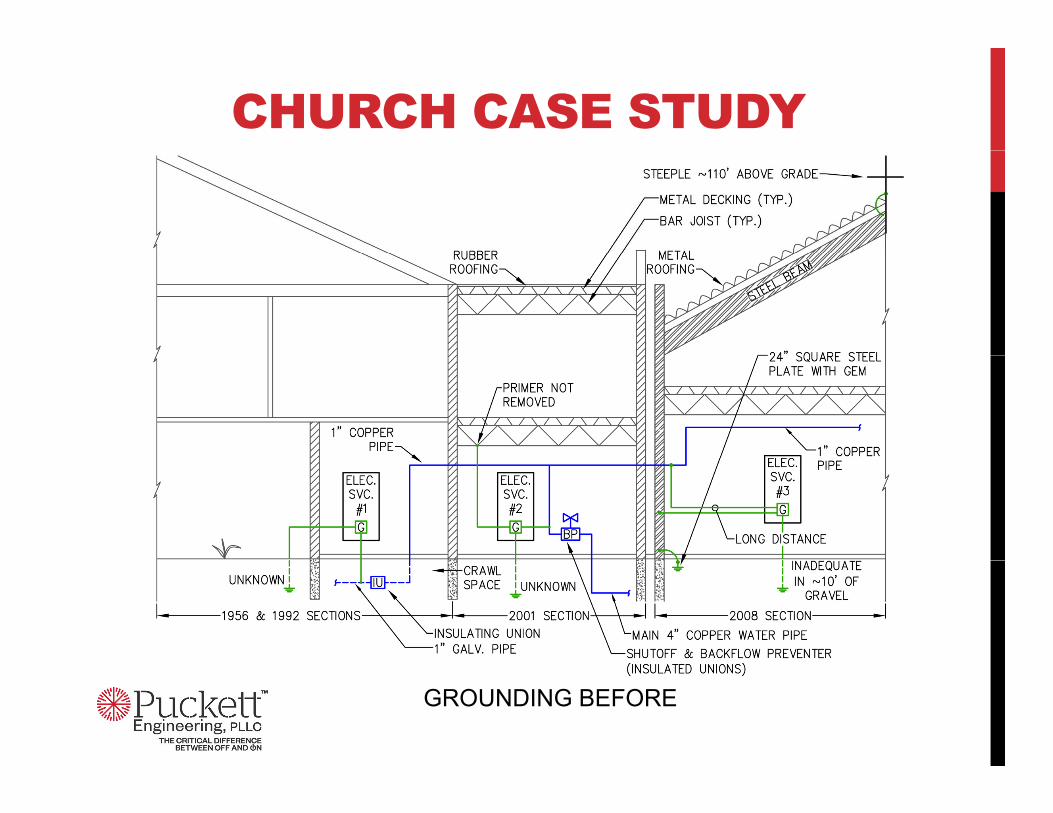
CHURCH CASE STUDY
GROUNDING BEFORE

CHURCH CASE STUDY
GROUNDING AFTER
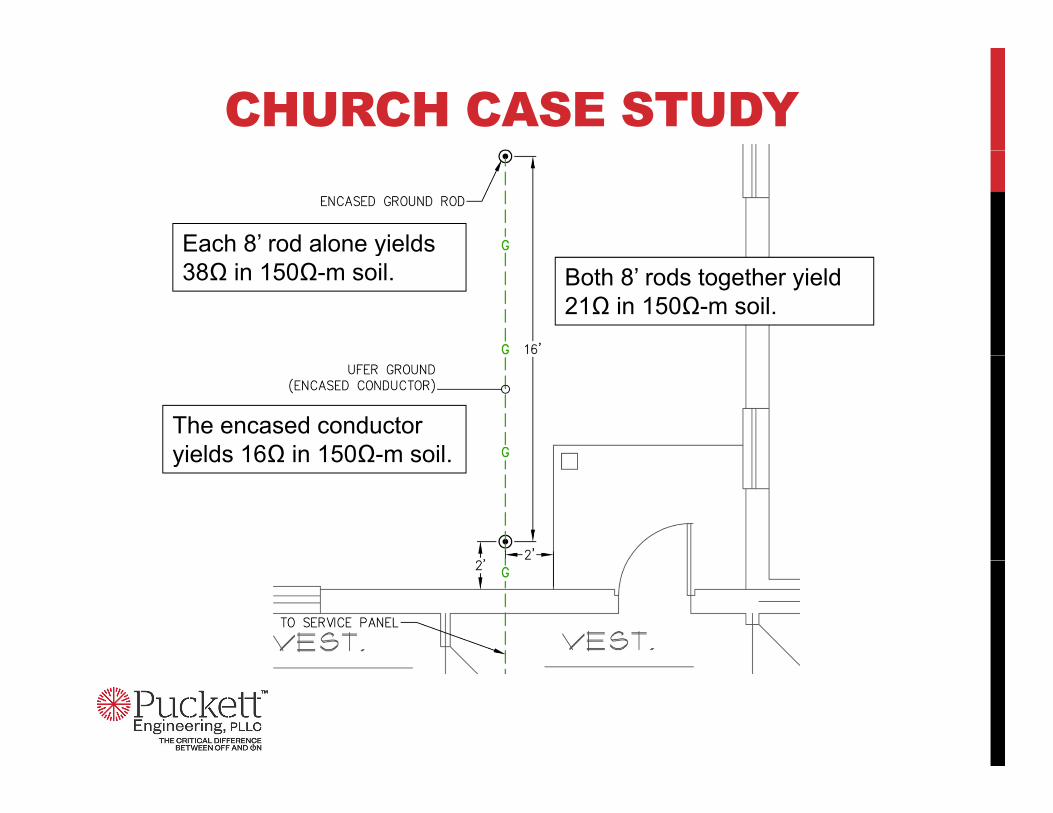
CHURCH CASE STUDY
Each 8’ rod alone yields Both 8’ rods together yield 21Ω in 150Ω-m soil.
y38Ω in 150Ω-m soil.
The encased conductor yields 16Ω in 150Ω-m soilyields 16Ω in 150Ω m soil.
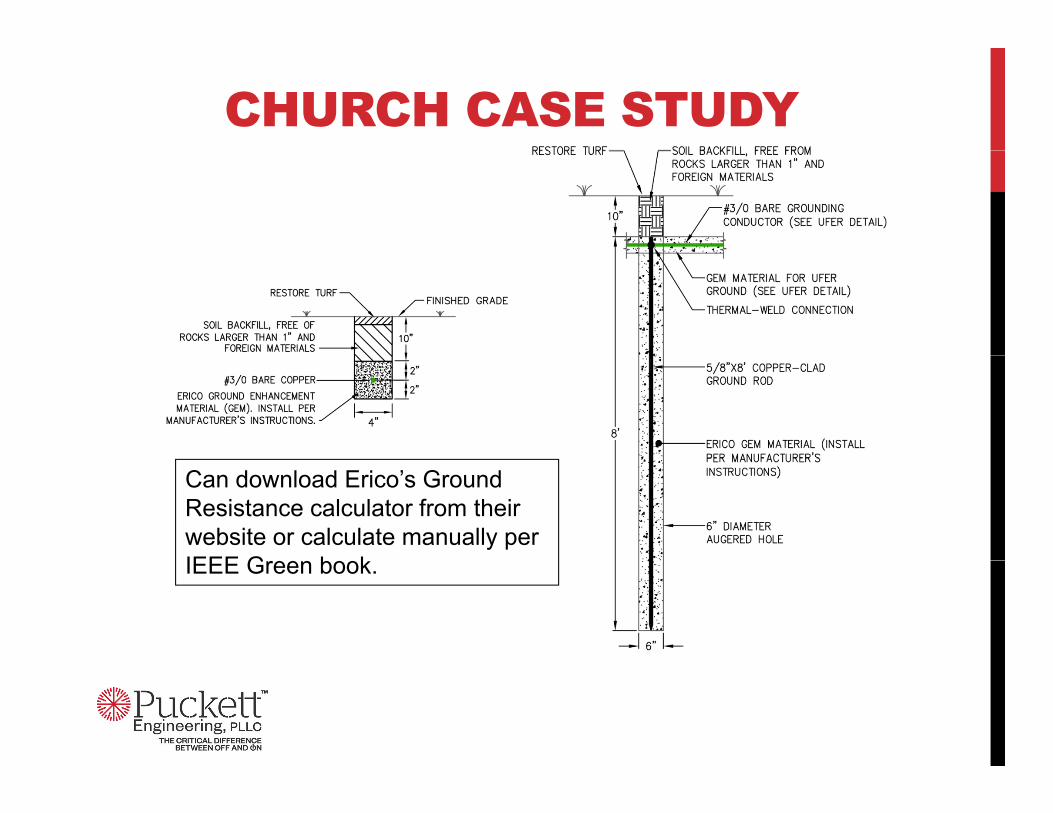
CHURCH CASE STUDY
Can download Erico’s Ground Resistance calculator from their website or calculate manually per IEEE G b kIEEE Green book.

CHURCH CASE STUDY

CHURCH CASE STUDY
CHURCH CASE STUDY

CHURCH CASE STUDY

CHURCH CASE STUDY
CHURCH CASE STUDY
CHURCH CASE STUDY• SPD for all Electrical Services• SPD for all Electrical Services.• SPD for all sub-panels that supply rooftop
equipment.q p• Bonded the same sub-panels to the building
steel.• Monitoring system for SPDs to send alarms via
the LAN.• Improved installation of ac supply SPDs for fire• Improved installation of ac supply SPDs for fire
alarm control panels and for low-voltage SPD for fire alarm outdoor circuit to PIV.
• Installed outdoor exposed DDC data cables in steel conduit.
• Intercom and Card reader at main front entrance• Intercom and Card reader at main front entrance.
CHURCH CASE STUDY•As of December 2010, bonding of steel and water pipes were g p pcompleted.
•2/24/11 thunderstorm, no damage.
•2/28/11 thunderstorm, three DDC controllers failed. Several had to be reset.
•3/23/11 and 4/4/11, Thunderstorms, no damage.
•Earth Grounding work completed 4/4/11.
•Optical Isolators installed 4/5/11.
•Most other work completed by 4/22/11.
•In summer of 2011, a severe storm damaged a circuit board and contactor in rooftop HVAC unit. •No issues with any thunderstorms since summer 2011 event.y
EFFECVTIVE LIGHTNING PROTECTIONPROTECTION
L k t THE BIG PICTURE•Look at THE BIG PICTURE.
•Consider all Systems and Equipment•Consider all Systems and Equipment Involved.
•For Personal Safety, Respect Lightning