westward region limnology and kodiak island …limnology laboratory (crl) for analysis. in 2000, the...
TRANSCRIPT

1
Regional Operational Plan CF.4K.2013.01
Westward Region Limnology and Kodiak Island Laboratory Analysis Operational Plan
by
Darin C. Ruhl
September 2013
Alaska Department of Fish and Game Divisions of Sport Fish and Commercial Fisheries

Symbols and Abbreviations
The following symbols and abbreviations, and others approved for the Système International d'Unités (SI), are used without definition in the following reports by the Divisions of Sport Fish and of Commercial Fisheries: Fishery Manuscripts, Fishery Data Series Reports, Fishery Management Reports, and Special Publications. All others, including deviations from definitions listed below, are noted in the text at first mention, as well as in the titles or footnotes of tables, and in figure or figure captions. Weights and measures (metric) centimeter cm deciliter dL gram g hectare ha kilogram kg kilometer km liter L meter m milliliter mL millimeter mm Weights and measures (English) cubic feet per second ft3/s foot ft gallon gal inch in mile mi nautical mile nmi ounce oz pound lb quart qt yard yd Time and temperature day d degrees Celsius °C degrees Fahrenheit °F degrees kelvin K hour h minute min second s Physics and chemistry all atomic symbols alternating current AC ampere A calorie cal direct current DC hertz Hz horsepower hp hydrogen ion activity pH (negative log of) parts per million ppm parts per thousand ppt, ‰ volts V watts W
General Alaska Administrative Code AAC all commonly accepted abbreviations e.g., Mr., Mrs.,
AM, PM, etc. all commonly accepted professional titles e.g., Dr., Ph.D., R.N., etc. at @ compass directions:
east E north N south S west W
copyright corporate suffixes:
Company Co. Corporation Corp. Incorporated Inc. Limited Ltd.
District of Columbia D.C. et alii (and others) et al. et cetera (and so forth) etc. exempli gratia (for example) e.g. Federal Information Code FIC id est (that is) i.e. latitude or longitude lat. or long. monetary symbols (U.S.) $, ¢ months (tables and figures): first three letters Jan,...,Dec registered trademark trademark United States (adjective) U.S. United States of America (noun) USA U.S.C. United States
Code U.S. state use two-letter
abbreviations (e.g., AK, WA)
Mathematics, statistics all standard mathematical
signs, symbols and
abbreviations alternate hypothesis HA base of natural logarithm e
catch per unit effort CPUE coefficient of variation CV common test statistics (F, t, 2, etc.) confidence interval CI correlation coefficient (multiple) R correlation coefficient (simple) r covariance cov degree (angular ) ° degrees of freedom df expected value E
greater than > greater than or equal to harvest per unit effort HPUE less than < less than or equal to logarithm (natural) ln logarithm (base 10) log logarithm (specify base) log2, etc. minute (angular) ' not significant NS null hypothesis HO percent % probability P probability of a type I error (rejection of the null hypothesis when true) probability of a type II error (acceptance of the null hypothesis when false) second (angular) " standard deviation SD standard error SE variance population Var sample var

REGIONAL OPERATIONAL PLAN CF.4K.2013.01
WESTWARD REGION LIMNOLOGY AND KODIAK ISLAND LABORATORY ANALYSIS OPERATIONAL PLAN
by
Darin C. Ruhl
Alaska Department of Fish and Game, Division of Commercial Fisheries, Kodiak
Alaska Department of Fish and Game Division of Commercial Fisheries
351 Research Court, Kodiak, Alaska, 99615
September 2013

25
The Regional Operational Plan Series was established in 2012 to archive and provide public access to operational plans for fisheries projects of the Divisions of Commercial Fisheries and Sport Fish, as per joint-divisional Operational Planning Policy. Documents in this series are planning documents that may contain raw data, preliminary data analyses and results, and describe operational aspects of fisheries projects that may not actually be implemented. All documents in this series are subject to a technical review process and receive varying degrees of regional, divisional, and biometric approval, but do not generally receive editorial review. Results from the implementation of the operational plan described in this series may be subsequently finalized and published in a different department reporting series or in the formal literature. Please contact the author if you have any questions regarding the information provided in this plan. Regional Operational Plans are available on the Internet at: http://www.adfg.alaska.gov/sf/publications/
Darin C. Ruhl,
Alaska Department of Fish and Game, Division of Commercial Fisheries
351 Research Court, Kodiak, AK 99615, USA
This document should be cited as:
Ruhl, D. C. 2013. Westward Region limnology and Kodiak Island laboratory analysis operational plan. Alaska
Department of Fish and Game, Division of Commercial Fisheries. Regional Operational Plan
CF.4K.2013.01, Kodiak.
The Alaska Department of Fish and Game (ADF&G) administers all programs and activities free from discrimination based on race, color, national origin, age, sex, religion, marital status, pregnancy, parenthood, or disability. The department administers all programs and activities in compliance with Title VI of the Civil Rights Act of 1964, Section 504 of the Rehabilitation Act of 1973, Title II of the Americans with Disabilities Act (ADA) of 1990, the Age Discrimination Act of 1975, and Title IX of the Education Amendments of 1972.
If you believe you have been discriminated against in any program, activity, or facility please write: ADF&G ADA Coordinator, P.O. Box 115526, Juneau, AK 99811-5526
U.S. Fish and Wildlife Service, 4401 N. Fairfax Drive, MS 2042, Arlington, VA 22203 Office of Equal Opportunity, U.S. Department of the Interior, 1849 C Street NW MS 5230, Washington DC 20240
The department’s ADA Coordinator can be reached via phone at the following numbers: (VOICE) 907-465-6077, (Statewide Telecommunication Device for the Deaf) 1-800-478-3648,
(Juneau TDD) 907-465-3646, or (FAX) 907-465-6078 For information on alternative formats and questions on this publication, please contact:
ADF&G, Division of Sport Fish, Research and Technical Services, 333 Raspberry Rd, Anchorage AK 99518 (907) 267-2375

i

ii

iii
TABLE OF CONTENTS Page
LIST OF TABLES......................................................................................................................................................... v
LIST OF FIGURES ....................................................................................................................................................... v
LIST OF APPENDICES ............................................................................................................................................... v
ABSTRACT .................................................................................................................................................................. 1
INTRODUCTION ......................................................................................................................................................... 1
GOALS .......................................................................................................................................................................... 2
OBJECTIVES ................................................................................................................................................................ 2
TASKS .......................................................................................................................................................................... 2
LIMNOLOGICAL SAMPLING PROCEDURES ........................................................................................................ 3
Prior to Departure .......................................................................................................................................................... 3
Lake Station Set-Up ....................................................................................................................................................... 3
Water Sampling ............................................................................................................................................................. 4
Zooplankton Sampling .................................................................................................................................................. 4
Light Attenuation Measurements................................................................................................................................... 5
Temperature and Dissolved Oxygen Measurements ..................................................................................................... 5
pH Measurement........................................................................................................................................................... 6
Secchi Disk Measurement ............................................................................................................................................. 6
METER MAINTENANCE AND STORAGE............................................................................................................... 7
Maintenance and Storage of Licor Li-250A Meter and UWQ Sensor ...................................................................... 7 Maintenance and Storage of PrODO Meter .............................................................................................................. 7 Maintenance and Storage of YSI pH 60 Meter ......................................................................................................... 7
GENERAL LABORATORY PROCEDURES.............................................................................................................. 7
Safety Considerations .................................................................................................................................................... 7
Data Entry ...................................................................................................................................................................... 8
Shipping Phytoplankton Samples .................................................................................................................................. 8
DI Water Preparation ..................................................................................................................................................... 8
Cleaning Glassware and Plastics ................................................................................................................................... 9
Acid Washing ................................................................................................................................................................ 9
WATER SAMPLE PROCESSING PROCEDURES .................................................................................................. 10
Unfiltered Water Sample Collection............................................................................................................................ 10
Filtered Water Sample Procedures .............................................................................................................................. 11
Filtration Equipment Preparation ............................................................................................................................ 11 Particulates Collection ............................................................................................................................................ 11 Filtered frozen sample collection ............................................................................................................................ 12
Reagent Mixing ........................................................................................................................................................... 12
Reagent Disposal ......................................................................................................................................................... 13
Preparing Standards ..................................................................................................................................................... 13
Cuvette Usage .............................................................................................................................................................. 13
Spectronic Genesys 5 Spectrophotometer ................................................................................................................... 14
Maintenance of the Spectronic Genesys 5 Spectrophotometer ............................................................................... 15

iv
TABLE OF CONTENTS (Continued) Page
Quality Assurance And Quality Control ...................................................................................................................... 15
Formulating Linear Equations For Manual Experiments ............................................................................................ 16
MANUAL SAMPLE ANALYSIS PROCEDURES ................................................................................................... 17
Alkalinity ..................................................................................................................................................................... 18
Thawing water samples ............................................................................................................................................... 19
Experiment Glassware Order Sheet ............................................................................................................................. 19
Limnology Lab Data Sheet .......................................................................................................................................... 19
Standards Sheet ........................................................................................................................................................... 19
Nutrients Quality Check .............................................................................................................................................. 20
Color (Manual) ............................................................................................................................................................ 20
Total Ammonia (Manual) ............................................................................................................................................ 22
Nitrate and Nitrite (Manual) ........................................................................................................................................ 24
Testing Cadmium Column Reduction Efficiencies ....................................................................................... 25 Cleaning and Repacking the Cadmium Columns .......................................................................................... 26 Calculating Column Equations ...................................................................................................................... 26 Water Sample Processing Procedure ............................................................................................................. 27
Total Phosphorous and Total Filterable Phosphorous (Manual).................................................................................. 28
Filterable Reactive Phosphorous (Manual) .................................................................................................................. 30
Chlorophyll-a and Phaeophytin-a ............................................................................................................................... 32
Silicon (Manual) .......................................................................................................................................................... 34
AUTOMATED SAMPLE ANALYSIS PROCEDURES ............................................................................................ 36
Seal Analytical AA3 And XY-2 Sampler .................................................................................................................... 36
AA3 Advantages ..................................................................................................................................................... 36
Description of AA3 Components ................................................................................................................................ 36
Daily Start-Up Procedure ............................................................................................................................................ 37
Methodologies and Chemistry Applications ................................................................................................................ 38
Operating Considerations ....................................................................................................................................... 38
Daily Shutdown Procedure .......................................................................................................................................... 39
Maintenance and Replacement Procedures ................................................................................................................. 39
ZOOPLANKTON SAMPLE PROCESSING.............................................................................................................. 41
Equipment ............................................................................................................................................................... 41 Chemical Handling and Disposal............................................................................................................................ 41
Procedure ..................................................................................................................................................................... 41
Identification ................................................................................................................................................................ 42
Counting ...................................................................................................................................................................... 44
ACKNOWLEDGMENTS ........................................................................................................................................... 45
REFERENCES CITED ............................................................................................................................................... 46
FIGURES .................................................................................................................................................................... 47
APPENDIX A. SAMPLE PROCESSING PROCEDURES ........................................................................................ 61
APPENDIX B. SEAL ANALYTICAL CHEMISTRY APPLICATIONS .................................................................. 67

v
LIST OF TABLES
Table Page 1. Serial dilutions needed for color testing. ....................................................................................................... 21 2. Serial dilutions needed for TA testing. .......................................................................................................... 23 3. Serial dilutions needed for N+N testing. ....................................................................................................... 26 4. Serial dilutions needed for TP and TFP testing. ............................................................................................ 29 5. Serial dilutions needed for FRP testing. ........................................................................................................ 31 6. Serial dilutions needed for SI testing. ............................................................................................................ 35 7. Student’s t-statistic and sample sizes (n) used to determine the number (n) of zooplankter’s to be
measured to achieve a confidence level (CL) of 95%. .................................................................................. 43 8. Wet length to dry weight relationships for calculating zooplankton biomass. .............................................. 45
LIST OF FIGURES
Figure Page 1. Detailed lake survey form. ............................................................................................................................ 48 2. Reagent Mixing Log ...................................................................................................................................... 49 3. Chemical Disposal Log ................................................................................................................................. 50 4. Total ammonia reagent age versus nutrient concentration values. ................................................................ 51 5. A linear equation for total ammonia (TA) calculations. ................................................................................ 51 6. Experiment glassware order sheet. ................................................................................................................ 52 7. Limnology Lab Data Sheet ............................................................................................................................ 53 8. Standards Sheet ............................................................................................................................................. 54 9. Cadmium column used to reduce nitrate to nitrite in the manual analysis of nitrate + nitrite. ...................... 55 10. SEAL Analytical AutoAnalyzer 3 (AA3) components. ................................................................................ 56 11. Zooplankton Data Sheet ................................................................................................................................ 57 12. Common cladocerans and copepods. ............................................................................................................ 58 13. Copepod life history stages. .......................................................................................................................... 59
LIST OF APPENDICES Appendix Page A1. Field sampling equipment list. ...................................................................................................................... 62 A2. Kodiak Island Laboratory sample processing and contractor contact list for 2013. ...................................... 63 A3. Sample collection protocol and procedures for lake water processing. ......................................................... 64 A4. Sample water filtering equipment list. ........................................................................................................... 65 A5. Apparatus used to process samples by vacuum filtration to obtain particulates and filtrate: A) using one
filtrate flask and B) using a filtering manifold. ............................................................................................. 66 B1. Total Ammonia nutrient test using AA3. ...................................................................................................... 68 B2. Nitrate + Nitrite nutrient test using AA3. ...................................................................................................... 73 B3. Total Phosphate nutrient test using AA3. ...................................................................................................... 81 B4. Total Kjeldahl Nitrogen nutrient test using AA3. ......................................................................................... 85 B5. Silicate nutrient test using AA3. .................................................................................................................... 90

vi

1
ABSTRACT
The Lake Assessment Project for Kodiak and Afognak Islands was started in the mid-1980s as part of a comprehensive plan to examine and prioritize the region’s sockeye salmon Oncorhynchus nerka production potential. As part of the Kodiak Regional Comprehensive Salmon Plan, limnological and fishery investigations were initiated simultaneously to determine the appropriate enhancement or rehabilitation strategy for depressed sockeye salmon stocks or the stocking potential of barriered lakes without anadromous fish. The Alaska Department of Fish and Game Near Island Laboratory (NIL) was established in 2000 and has collected, processed, and analyzed limnological samples to meet these goals. In 2013, NIL was renamed the Kodiak Island Laboratory. This report provides the procedures used to process the limnological samples.
Key words: limnology, Kodiak Island, Afognak Island, water sample collection, zooplankton sample collection, laboratory analyses.
INTRODUCTION
The ADF&G began sampling Kodiak Island lakes for limnological data in the mid-1980s (Schrof et al. 2000). Over 30 Kodiak Island Archipelago lakes have been sampled for limnological data. The Kodiak Island Archipelago sampling project goals, objectives, and methods are published annually in an operational plan (Thomsen et al. 2013).
Prior to 2000, water and zooplankton samples were collected by the ADF&G staff in Kodiak, processed, and then shipped to the ADF&G, Division of Commercial Fisheries Central Region Limnology Laboratory (CRL) for analysis. In 2000, the ADF&G CRL staff discontinued providing contract laboratory services for the Kodiak area. To continue the limnology program in the Kodiak area, the Westward Region started a laboratory at the Near Island Research facility (Near Island Laboratory, NIL) for the collection, processing, and analyses of water samples. In 2013, the ADF&G NIL moved into a new building and was renamed the Kodiak Island Laboratory (KIL).
The KIL processes and analyzes water samples for the following nutrients and algal pigment concentrations: Total phosphorous (TP), total Kjeldahl nitrogen (TKN), total filterable phosphorous (TFP), filterable reactive phosphorous (FRP), total ammonia (TA), nitrate + nitrite (N+N), reactive silicon (SI), color, chlorophyll a, and phaeophytin a. In addition, water chemistry parameters, such as pH and alkalinity are analyzed. Turbidity, calcium, carbon, magnesium, and iron may also be assessed. Zooplankton samples are processed and analyzed for species abundance, biomass, and size.
The CRL and NIL analyzed water samples generally using the methods described in Koenings et al. (1987). Laboratory analysis at the KIL has continued to follow Koenings et al. (1987) methods in conjunction with Thomsen (2008); however, several procedures have been modified to reflect new techniques and laboratory equipment. Beginning in 2003, TKN analysis was contracted out to South Dakota University or the University of Georgia Feed and Conservation Water Laboratory. In 2003, the NIL restructured water sample processing procedures to increase production capacity. Prior processing procedures are described in ADF&G (2002). In 2012, KIL was equipped with a SEAL© AA3 AutoAnalyzer (AA3) to support the Lake Assessment Project’s increased sampling regime. In 2013, analyses of lake nutrients will be measured with the AA3.

2
GOALS
1. Assess the chemical, biological, and physical characteristics of lake ecosystems to help biologists assess rearing potential for juvenile sockeye salmon.
2. Provide sampling logistics and laboratory support for limnology data collection in the Kodiak area, Alaska Peninsula, and assist ADF&G programs in other regions with their sample processing needs if capacity allows.
OBJECTIVES
1. Estimate the seasonal mean water chemistry, nutrient, and chlorophyll-a concentration by unit volume.
2. Quantify and measure each species or genus of macrozooplankton from samples collected to estimate the seasonal mean density, biomass, and size of each of the species or genus.
3. Collect phytoplankton samples to be analyzed for algal abundance and species composition.
4. Collect light attenuation data to estimate the euphotic zone depth (EZD) for algal photosynthesis.
5. Determine the temperature and dissolved oxygen regimes.
TASKS
The following is a generalized list of KIL tasks.
At each established limnology station:
1. Collect lake water samples.
2. Collect zooplankton samples.
3. Collect phytoplankton samples.
4. Collect light attenuation depth profiles of photosynthetically active radiation (PAR).
5. Measure depth profiles of dissolved oxygen (mg/L) and temperature (oC).
6. Measure the water clarity with a Secchi disk.
7. Process and analyze the above mentioned water and zooplankton samples.
8. Process and analyze water and/or zooplankton samples from any additional subcontracts.
9. Process, package, and ship the above mentioned phytoplankton samples.
10. Enter and archive all data into established formats. All data collected by the ADF&G are available to the public upon specific request.
11. Adhere to the department's Standard Operating Procedures (SOP), with emphasis on laboratory, aircraft, and boating safety.
3
LIMNOLOGICAL SAMPLING PROCEDURES
Limnological sampling occurs once a month, May through October, and is generally scheduled for the middle of each month. A typical sampling event at a single station consists of collecting a 6 liter water sample, zooplankton sample, Secchi depth, light attenuation, dissolved oxygen, temperature, and pH measurements.
PRIOR TO DEPARTURE
1. Assemble all the required sample collection gear from the Field Sampling Equipment List (Appendix A1).
2. Consult the limnology sampling and processing schedule (Ruhl 2013) to verify which lakes, stations, and depths are to be sampled.
3. Obtain a clearly marked morphometric map showing global positioning system (GPS) station locations by latitude and longitude at the lake(s) being sampled. Maps are on file at the KIL.
4. Clean the 8 L plastic carboy’s needed for the sampling trip. The carboys are pre-labeled with the name of the lake, station, and depth on the lid.
5. Prepare the 125-mL polypropylene zooplankton bottles needed for the sampling trip.
a. Label the bottles with the name of the lake and station. The date and tow depth will be recorded at the time of sampling.
b. Add 12.5 mL buffered formalin (10% of volume) to each polypropylene bottle, replace the cap and seal the lid with electrical tape to prevent the contents from leaking out.
Buffered formalin – Add ~ 10 pellets of sodium hydroxide (NaOH) to one liter of concentrated formalin (37% formaldehyde) or until a pH of 7 to 8 is reached.
6. Prepare chlorophyll-a petri dishes, phytoplankton 100 mL, unfiltered 250 mL, and filtrate 500 mL poly bottles for sample storage by labeling them with the lakes to be sampled, date, station, and depths.
LAKE STATION SET-UP
1. Locate the appropriate lake station location using a GPS and lake map.
2. Set the lake station buoy. Typically, lake stations are left in place over winter. Winter ice tends to move the stations requiring them to be reset to the proper location. If a station is missing, set a new buoy system using the following procedures:
a. Fill three sand bags with gravel on the lake shore, preferably near the station.
b. Place the filled sand bags upon a 4’x4’ section of netting on the floats near the rear of the plane while on shore. Wrap the stacked sand bags with each corner of netting. Feed and weave the end of a full spool of ¼” polypropylene line through the netting. Secure the line to the pursed sand bags using secure knots.
c. Cleat the sand bags off with a shot of line, get back in the plane, and have the pilot slowly taxi to the general GPS buoy station location.

4
d. Upon nearing the buoy station, one person will insert a metal pipe through the spool of polypropylene line. Be aware of any possible hang ups and ensure both people are clear of the line prior to dropping bags to the lake bottom.
e. When the person holding each end of the metal pipe is ready, a second person will shove the pursed sandbags off edge of the plane float as close to the GPS buoy site as possible. Allow the sand bags to sink to the lake bottom.
f. Attach a 3 cork buoy system leaving ~10-15 feet of scope in the line to prevent dragging the buoy while moored during a sampling event and accommodate fluctuations in lake level.
WATER SAMPLING
1. Collect water samples at designated lake stations using a 4 L Van Dorn sampler.
a. Lower the Van Dorn sampler to the designated depth (1, 15, 30 or 50 m).
b. Release the weighted messenger down the rope to release the mechanism that triggers the closing of the Van Dorn sampler.
c. Pull the Van Dorn sampler to the surface. Rinse the pre-labeled carboy with a small portion of sample water and discard the rinse water. Rinsing removes any de-ionized water (DI) left in the carboy. Pour the remaining sample water into the carboy.
d. Repeat this procedure, if needed, (without rinsing) until the carboy contains a minimum of 6 liters of sample water. When finished, place the carboy in the airplane floats or a cooler to keep the sample cool and dark.
e. Record sampling depths, stations, and other appropriate comments on the Detailed Lake
Survey Form (DLS; Figure 1).
ZOOPLANKTON SAMPLING
1. Collect zooplankton samples at all lake stations using the vertical tow method, using a 0.2-m diameter, 153-micrometer mesh conical net.
a. Measure the station depth by lowering a weighted, metered line to the lake bottom. This step is unnecessary for stations with a depth greater than 51 m (refer to step b).
b. Lower the tow net into the lake at a steady rate (so that the plankton bucket stays below the opening of the net) until the bottom of the net is 1 meter from the lake bottom or to a maximum of 50 m.
c. Retrieve the net manually at a constant rate of approximately 0.5 m/sec., stopping only when the rim of the net is above the surface, slowly working the contents of the tow net towards the plankton bucket.
d. Rinse the net from the outside with DI water from a squirt bottle from the top down to the cod-end to wash the contents into the plankton bucket.
e. Remove the plankton bucket from the net and pour the contents into the appropriately labeled 125 mL polypropylene bottle containing 12.5 mL buffered formalin.

5
f. Rinse the plankton bucket screen with the squirt bottle containing filtered water and pour the contents into the polypropylene bottle. Repeat until the plankton bucket screen is clean and the zooplankton sample bottle is full, achieving a 10% preservative solution.
g. Record the tow depth on the DLS form.
h. Upon return from sampling, clean the net and bucket with tap water and allow to air dry.
LIGHT ATTENUATION MEASUREMENTS
1. Use Li-Cor© LI-250A light meter to measure light attenuation at all lake stations. The Li-Cor Underwater Quantum (UWQ) sensor KIL uses is capable of measuring both "up" and "down" measurements. Only "up" (sensor oriented towards the surface) measurements will be conducted and recorded.
2. A consistent amount of light is needed for the duration of the measurements to provide reliable data. Measurements need to be taken on the sunny side of the plane or boat to avoid shading the sensor and creating variable readings. If cloud cover varies intensely, light intensity readings will not decrease with depth as expected. When measurements fluctuate wildly, wait for the cloud cover to stabilize and start again.
3. Before entering the field for a sampling event, ensure the calibration coefficient matches the “in water” calibration coefficient attached to the UWQ sensor and the units are in u/mol. If they do not match, the calibration coefficient will have to be adjusted by pressing “CAL” on the meter and toggling to the correct value (always negative).
a. Record light readings (PAR) beginning just above the lake surface (incidence), then just below the surface to a depth of 5 m at 0.5 m intervals (i.e., 0.5, 1.0, 1.5, …., 5.0) and then take measurements every meter (6, 7, 8, etc.) thereafter until the light level is 1% of the surface reading or the bottom is reached.
b. Record the data on the DLS form (Figure 1).
c. Upon return from a sampling event, open the case and allow the meter to air dry.
TEMPERATURE AND DISSOLVED OXYGEN MEASUREMENTS
1. Measure water temperature (oC) and dissolved oxygen (DO; mg/L) levels at all lake stations with an YSI© Professional Optical Dissolved Oxygen (ProODO) meter.
a. Examine the sensor cap on the meter probe prior to use for condition and replace if necessary.
b. For both ease of use and accuracy, YSI recommends performing the following DO% water saturated air calibration prior to taking measurements:
Moisten the sponge in the gray cal/transport sleeve with a small amount of clean water. The sponge should be clean and only moistened. Make sure there are no water droplets on the ODO sensor cap and temperature sensor. Install the cal/transport sleeve on the probe. The ODO and temperature sensors should now be in a humid environment and not immersed in water.
Turn the instrument on and wait 5 minutes for the cal/transport sleeve to become fully saturated.

6
Press the Calibration hotkey on the keypad then highlight DO and press Enter.
Highlight DO%, then press Enter.
Verify the barometric pressure displayed is accurate. Once DO and temperature are stable (wait at least 30 seconds), highlight Accept Calibration and press Enter. The screen will indicate if the calibration has been accepted.
Measure the surface temperature with a handheld thermometer and compare to the meter temperature to ensure that the meter is working properly.
Calibration can last for months, but it is advised to calibrate the DO meter once a month during the sampling season.
c. To take readings, insert the probe into the lake. Move the probe side to side to release any air bubbles trapped on the probe and to provide a fresh sample to the sensing element. This movement is only necessary when first inserting the probe into a sample. Since the ProODO utilizes optical luminescent technology, continuous sample movement or stirring is not required.
d. Measure temperature and DO readings from the surface to a depth of 5 m at 0.5 m intervals (i.e., 0.5, 1.0, 1.5, …., 5.0) and then take measurements every meter (6, 7, 8, etc.) until 25 m is reached and then every 5 m until 50 m or the bottom is reached.
e. Record the data on the DLS form (Figure 1). The pilot of the airplane usually helps with the recording duties.
f. Upon return from a sampling event, open the case and allow meter to air dry.
PH MEASUREMENT
1. Measure and record 1 m pH levels at all lake stations with an YSI Model 60 Handheld pH meter.
a. The meter must be calibrated before making pH measurements.
Calibration may be performed at 1, 2, or 3-points. Perform a 1-point calibration (pH 7 or pH 6.86) only if a previous 2 or 3-point calibration has been performed recently.
In most cases, a 2-point pH calibration will be sufficient for accurate pH measurements (See YSI Model 60 Operations Manual filed at KIL).
b. Insert the probe 1 m into the lake, shake gently to remove any trapped air bubbles and wait for the readings to stabilize (~60 seconds).
c. Record the data on the DLS form (Figure 1).
SECCHI DISK MEASUREMENT
1. Measure and record the Secchi Disk (SD) depth at all lake stations as a measure of water clarity. SD depth should be measured on the shaded side of the boat or airplane. From an airplane, measure the SD from under the wing. Remove Polaroid glasses before measuring SD depth.
a. Lower the SD into the water on a metered line until it disappears from view; then pull upward until it reappears.

7
b. Record the depths of disappearance, reappearance, and average of the two readings on the DLS form (Figure 1).
METER MAINTENANCE AND STORAGE
Maintenance and Storage of Licor Li-250A Meter and UWQ Sensor The UWQ sensor will need to be calibrated once per year by Li-Cor. Refer to the calibration shipment instructions filed at KIL. The UWQ sensor must be stored with the red cap on to protect the white photometer at all times when not in use. Be careful not to pinch the meter cable in the carrying case when closing, this can make the sensor inoperable if compromised.
Maintenance and Storage of PrODO Meter The sensor cap will need to be replaced about once per year, but may last longer. Refer to the manual for instructions on replacing the sensor cap. The ODO Sensor must be stored in a moist environment. For short term storage, moisten the sponge in the cal/transport sleeve and slide the gray sleeve over the probe guard. For long term storage, i.e. 30+ days, in addition to the gray cal/transport sleeve soak the sponge in the red protective cap provided by the manufacturer and place the red cap over the probe tip. Check the sponge every 30 days to ensure it is moist. If the sensor dries out, refer to the manual for instructions on how to rehydrate the sensor cap. Be careful not to pinch the meter cable in the carrying case when closing, this can make the sensor inoperable if compromised.
Maintenance and Storage of YSI pH 60 Meter The pH sensor will need to be replaced about once per year, but may last longer. Refer to the manual for instructions on replacing the sensor cap. If repairs are necessary the pH meter can be sent to YSI for servicing. The pH sensor must be stored in a moist environment. For short term storage, moisten the sponge in the hole located on the side of the meter and slide the probe into place. For long term storage, i.e. 30+ days, insert probe into storage bottle filled with pH 4 fluid and cap tightly. Be careful not to pinch the meter cable in the carrying case when closing, this can make the sensor inoperable if compromised.
GENERAL LABORATORY PROCEDURES
SAFETY CONSIDERATIONS
Many chemicals used in the laboratory require special handling procedures. The laboratory has all the necessary safety equipment (i.e. hoods, eye wash stations, shower, fire extinguisher, eye protection, and personal protective clothing) to comply with safety regulations. Laboratory personnel need to recognize health and safety hazards.
1. Read the departments SOP on laboratory safety. The reference, Standard Methods for the Examination of Water and Wastewater, 20th Edition (1998) has a wealth of information on safety, chemical use, chemical and biological testing methods, and quality control. Relevant SOPs are on file at the lab.
2. Follow material safety data sheet (MSDS) procedures. MSDS sheets are on file at the laboratory for reference and describe special procedures required for the handling, storage, and use of specific chemicals. All chemicals must be stored according to the MSDS sheets.

8
3. Most chemicals require the use of a hood and gloves. Consult the MSDS for proper procedures prior to handling chemicals.
4. Limit most reagent use and chemical disposal to the hood (including cuvette waste). Refer to each Sample Analysis Procedures section for specifics. Always add acids or bases to water, never add water to acids.
DATA ENTRY
A new electronic database, the Kodiak Intranet Westward WIKI was established for Kodiak ADF&G in 2012 and allows multiple users to enter, edit, access, and query specific data. The WIKI will be used to enter all nutrient, physical, and zooplankton data in 2013. A data entry station is located between the wet and chemistry laboratories.
SHIPPING PHYTOPLANKTON SAMPLES
1. Contact the laboratory or recipient of samples prior to shipping to ensure they have the capacity for the samples and the samples can be analyzed within a specified time frame.
2. When shipping contract samples for phytoplankton analysis ensure samples are properly labeled with date sampled, lake sampled, station sampled, depth of sample, type of sample (phytoplankton), and preservative used.
3. Phytoplankton samples are analyzed by John Beaver of BSA Environmental Services, Inc. in Beachwood, Ohio (Appendix A2). Samples are to be shipped via FedEx Economy service.
4. Tape sample lids with electrical tape, account for all samples, and create a detailed list of the samples included. Package the samples upright in a durable cardboard box.
5. Insert a detailed sample list into a zip-loc bag. Place inside of the shipping package.
6. Pen arrows or use stickers pointing upwards to help handlers keep samples upright during transport.
7. Send phytoplankton sample shipments on a Monday or Tuesday to ensure safe arrival before the end of the week.
8. The recipient of each sample shipment should be notified electronically of expected arrival date and time the morning the samples are shipped. A copy of the sample list should be attached to this email as well as the shipper’s contact information.
DI WATER PREPARATION
The KIL has DI water available through faucets at the sinks and within the two ventilated hoods. This DI water is filtered above the Chemistry Lab (Rm 140) using a Millipore© Elix 35 - Capa II Clinical system. A Barnstead B-Pure© system with mixed organic bed filter cartridges and a meg-ohm meter is used after the Millipore system to ensure quality DI water at the point of collection. Tap water can be filtered, but this decreases the life of the B-Pure filter cartridges. The DI water is prepared with Pretreatment (VWR© catalog #26291-306) and Ultrapure (VWR catalog #26303-256) cartridges using the following methods:

9
1. Before preparing DI water to be used for any purposes in the laboratory, check the Millipore system meg-ohm and Total Oxidizable Carbon (TOC) values upstairs in the fan room on the Elix system. If the TOC is > 75 ppb or resistivity of water is < 5.0 meg-ohm do not collect water and troubleshoot the Elix system.
2. Turn the red water valve above the sink (near windows) to the left ~1/4 turn. This feeds purified water from the Millipore system to the Barnstead B-Pure system. Allow the B-Pure system to charge.
3. Place the hose in the sink and allow water to flow through the system at a slow rate. Be aware of contaminating the end of the hose; do not allow it to contact any surfaces.
4. Plug in the tan extension cord of the meg-ohm meter on the B-Pure system. The B-Pure system is able to create 18.2 meg-ohm DI water (Type II).
5. For experiments, >18.0 meg-ohm DI water is desired and to be used within the same day it is prepared.
6. For general rinsing and cleaning, as long as values remain above 14.0 meg-ohm, the water can be collected and used.
7. If the readings fall below and remain under 14.0 meg-ohm the filter cartridges need to be replaced. See the product manual for filter cartridge replacement procedures.
8. Turn the water valve off and unplug the meg-ohm meter power cord when finished.
9. Thoroughly clean, acid wash, and rinse the DI water carboy and the filter holding canisters once per month, before a large batch of experiments, or each time filter cartridges are replaced.
CLEANING GLASSWARE AND PLASTICS
1. Wash laboratory glassware and plastics with phosphate-free soap. The Labconco© dishwasher can be utilized for large amounts of glassware and plastics.
2. Glassware used for experiments or water sample poly bottles/carboys need to be properly cleansed of remnant contaminates following procedures in acid washing section below.
3. Never use containers that have previously contained formalin, ethanol, or Lugol’s acetate (e.g. zooplankton, smolt, or phytoplankton sample bottles) for water sample storage.
ACID WASHING
1. Use 10% Hydrochloric acid (HCl) to clean all glassware used in any automated or manual experiment and all poly bottles used for storing water samples. For manual experiments, these include Filterable Reactive Phosphorous (FRP), Total Phosphorous (TP), Total Ammonia (TA), Total Filterable Phosphorous (TFP), and Silicon (SI) testing as described below in Manual Sample Analysis Procedures.
10% HCl – Carefully add 100 mL concentrated HCl to 800 mL DI water, mix, cool, and dilute to 1 L with DI water.

10
2. Acid wash glassware before each use, keeping covered with appropriate caps at all times. Always acid wash all glassware/poly bottles in the fume hood wearing nitrile gloves, protective eyewear, and lab coat.
3. Remove caps and lids from 3 glassware items or 3 poly bottles. Pour 10-15 mL of 10% HCl into first container. Cap tightly and invert container ensuring all surfaces inside have been rinsed by HCl. Uncap and pour into second vessel, invert, and repeat the process for the third item.
4. Dispose of waste from last container into a labeled HCl waste container in the fume hood.
5. Rinse each item with DI water 3 times after acid washing, shake dry, cap, and store.
6. Do not acid wash filtration glassware (1 L graduated cylinders) used for chlorophyll-a
analysis. A small amount of weak acid (0.05 ml of 2 N HCL) is used to differentiate chlorophyll-a from phaeophytin-a. Clean chlorophyll-a glassware with phosphate free soap and rinse 3 times with DI water.
WATER SAMPLE PROCESSING PROCEDURES
Freezing water samples is required if they cannot be processed within 3 days after collection. Immediately refrigerate water sample carboys when received at the laboratory. The water sample processing procedures outlined below follow the flow chart in Appendix A3.
UNFILTERED WATER SAMPLE COLLECTION
Rinse and label a polypropylene bottle of appropriate type in steps 1, 2, and 3 with a small portion of sample water from each carboy to eliminate any DI water remaining in the sample bottles.
Fill the following sample collection bottles directly from the sample carboy:
1. Unfiltered Refrigerated sample (pH and Alkalinity): Pour approximately 500 mL of sample water into a 500 mL polypropylene bottle (fill to the top to avoid trapped air) and refrigerate.
2. Unfiltered Frozen sample (TP, TKN, SI): Pour approximately 200 mL of sample water into a 250 mL polypropylene bottle (leave space at the top to allow for expansion while freezing) and then freeze. Repeat with a second clean 250 mL bottle and label 1 of 2 and the other 2 of 2. Seal the bottle with electrical tape once frozen to prevent leakage if transportation of the sample is needed.
3. Unfiltered Phytoplankton sample: Measure exactly 100 mL of unfiltered water and place into an amber 125 mL polypropylene bottle. Add 2.0 mL Lugol’s acetate, mix gently, and store in the dark at room temperature. Seal the bottle with electrical tape to prevent leakage if transportation of the sample is needed.
Lugol’s acetate – Add 10 g of potassium iodide, 5 g of iodine, and 5 g of sodium acetate-trihydrate to 50 mL of DI water and dilute to 70 mL with DI water. Add 2.0 mL per 100 mL of sample.

11
FILTERED WATER SAMPLE PROCEDURES
Filtered water sample processing is grouped into two categories; collection of particulates and collection of filtered water. Particulate sample collection is further divided into collection of a filtrate pad used for chlorophyll-a analysis and for particulate C, N, or P analysis. Filtered water used for analysis is collected from the filtration flask used to collect the C, N, or P filtrate pad. Filtered water cannot be collected using the chlorophyll-a filtrate pad because magnesium carbonate is added as a preservative in the filtration process.
Filtration Equipment Preparation Refer to Appendix A4 for equipment needed to filter water samples in the laboratory. Refer to Appendix A5 when filtering water samples using two vacuum pumps and proceed as follows:
1. Wash the filtration equipment (i.e. filter towers, flasks) and graduated cylinders with phosphate-free soap, and then rinse with tap water three times and again three times with DI water prior to filtering water samples. Cover the graduated cylinders and filter towers with parafilm to keep out contaminates.
2. Chlorophyll-a samples are always processed using the same graduated cylinders and filtration towers.
3. Keep the vacuum pump oil reservoir filled to the red line with Pneumatic Lubricating Oil AD 220 or SAE 10 oil.
4. Attach a vacuum pump to a three position filtration manifold and attach three filtration flasks to each hose of the manifold. See apparatus A in Appendix A5. Apparatus A is used to collect one particulate filter pad (C, N, or P) and up to 1,000 mL of filtered water from each of three samples. Set pump suction at 15 psi.
5. Attach a vacuum pump to a waste collection carboy and attach a three place filtration manifold with three filtration towers to the carboy. See apparatus B in Appendix A5. Apparatus B is used to collect chlorophyll-a for each of three samples Set pump suction at 15 psi.
Particulates Collection a. With sterile forceps, place a sterile Whatman GF/F filter pad on each of the six filter
towers.
b. Draw 100 mL of DI water through all three filter pads of apparatus A (filtrate collection) and discard the rinse water.
c. Choose a water sample and rinse two clean graduated cylinders of the same number with approximately 200 mL of sample water, rinse cylinder, and discard. The two groups of three graduated cylinders, Apparatus A and Apparatus B, are numbered 1 through 3 and each should match for the same sample. (ie; number 1 for filtrate collection and number 1 for chlorophyll-a collection)
d. Fill the rinsed number “1” pair of graduated cylinders with 1,000 mL of sample water and place one in front of of apparatus A, position 1, and the other in front of apparatus B, position 1.

12
e. Repeat steps c and d for water samples two (use center position 2) and three (use right position 3). Position placement is important to keep track of samples.
f. For apparatus A, pour 100 mL sample water from the designated graduated cylinders into each of the three corresponding filter towers. Draw the water into the filtration flasks, rinse, and discard. This rinses the DI water from the filtration flasks.
g. Fill each of the six filtration towers with sample water from its corresponding graduated cylinder. Filter and add more sample water to each filtration tower until 950 mL is filtered from each of the samples (a total of 1000 mL filtered). For apparatus A (filtrate) filter the remaining 50 mL and continue to step “i”. For apparatus B (chlorophyll-a) proceed to step h.
h. When ~50 mL of the sample remains in the chlorophyll-a filtration towers add ~5 mL of the magnesium carbonate (MgCO3) solution to the filtration towers to preserve the sample. Wash all three filtration towers from apparatus B with DI water to ensure that all the particulates are collected on the filters. Do not wash the filtration towers from apparatus A with DI water because this would dilute the filtered water used for the filtered frozen sample.
Magnesium carbonate (MgCO3) – Add 1 g of magnesium carbonate-n-hydrate to 75 mL of DI water and dilute to 100 mL with DI. Magnesium carbonate settles quickly; shake well before use.
i. Remove the particulate nutrient filter pads with sanitary forceps from the filter towers and place in an appropriately labeled petri dish and store dark in the freezer.
j. Save the filtered water collected from apparatus A (2,000 mL filtration flask) for the 500 mL filtered frozen sample. Discard the filtered water collected from apparatus B (waste glass carboy).
Filtered frozen sample collection Filtered frozen sample bottle (Color, FRP, TFP, N+N, TA): Rinse the 500 mL polypropylene bottle with a small amount of filtrate water from the filtrate flask (from position 1, 2, or 3) and discard. Pour approximately 450 mL of the filtrate water into the polypropylene bottle and store in the freezer. Seal the bottle with electrical tape once frozen to prevent leakage if transportation of the sample is needed.
REAGENT MIXING
Maintain a Reagent Mixing Log (Figure 2) and keep it posted on the main fume hood in the Chemistry Laboratory, Room 140. Include the date, type, and volume of reagent mixed. This log is required by the city of Kodiak, state, and federal agencies in conjunction with a chemical disposal log (covered below). Mixed reagents degrade with time, changing the accuracy of the nutrient tests. Tracking the age of reagents helps to maintain quality laboratory data.
Sometimes the volume of a reagent to be prepared for a test will need to be adjusted when the number of samples to be run changes. When changing reagent volumes alter all added ingredients by the same proportion. For example, the standard protocol calls for an ending volume of 500 mL (i.e. the reagent is diluted into a 500 mL volumetric flask) for 70 samples and you are running 50% of the normal samples (35 samples), cut all added ingredients by 50% and

13
dilute the reagent into a 250 mL volumetric flask. The proportions listed in the nutrient test sections are appropriate for the current laboratory production level.
REAGENT DISPOSAL
Maintain a Chemical Disposal Log (Figure 3); laboratory procedures produce hazardous waste material. Logs are posted on all fume hoods. Include the date, type, and volume of all types of chemicals disposed of into the fume hood or sink drains. Each Sample Analysis Procedure section contains specifics on chemical handling and dumping. Consult MSDS sheets for specifics. The logs must be maintained to adhere to the city of Kodiak, state (ADF&G and DEC), and federal (OSHA and EPA) regulations.
PREPARING STANDARDS
Standards are used to produce serial dilutions (known concentrations) for processing water samples (Tables 1, 2, 3, 4, and 5). Each nutrient test includes a table giving specific serial dilutions to prepare. Accuracy, diligence, and cleanliness are extremely important in preparing sample standards. Type A glassware will be used when preparing any serial dilutions. Mix the standard in a volumetric flask of the correct capacity.
1. Use glass weighing funnels to reduce dry chemical spillage. Carefully transfer the weighing funnel contents into the appropriate volumetric flask and rinse the funnel into the volumetric flask with DI water or the appropriate dilution agent.
2. Choose a pipette with the appropriate capacity.
3. Serial dilutions need to be made on the same day a test is run.
CUVETTE USAGE
Cuvettes are small, clear, quartz sample containers, which are placed in the spectrophotometer to measure absorbance. Standard rectangular (10 mm light path) cuvettes are used in tests with high concentrations of nutrients and cylindrical long path (100 mm light path) cuvettes are used in tests with low concentrations of nutrients. Cuvettes are matched to each other and need careful handling to maintain accurate readings.
1. At the start of each season fill a set of cuvettes with DI water to compare absorbances at different wavelengths. Make sure the absorbances match perfectly. If they do not match, acid wash with 10% HCl and rinse with DI water three times.
2. Always wear nitrile gloves when handling cuvettes because finger prints can affect light absorbance. Special soft, lint-free VWR© cotton pads are needed to wipe the cuvettes clean.
3. Look at a bright light through the filled cuvette to check for anything left on the surface (e.g. water spots or fingerprints) that will affect the readings.
4. After recording readings, empty the cuvette contents into a chemical disposal container under the fume hood (cuvette contains hazardous materials). Wash the cuvette thoroughly with phosphate free soap; rinse with DI water, and acid wash. Do not brush or scrub the cuvettes because they will scratch.

14
SPECTRONIC GENESYS 5 SPECTROPHOTOMETER
The KIL uses a Spectronic© Genesys 5 spectrophotometer to measure absorbances during manual lake nutrient experiments. The spectrophotometer features an 8-position cell holder with automatic alignment, monochrome screen, split-beam optical system for stability and strength, and single-point measurements. The Spectronic Genesys 5 spectrophotometer is capable of measuring wavelengths from 200 to 1100 nanometers (nm).
The 8-position cell holder (10 mm quartz cuvettes) often needs to be changed out to a 4-position cell holder (100 mm cylindrical quartz cells) in between manual nutrient experiments. To change cell holders from 8-position to 4-position cell holders use the following methods:
1. Toggle the power switch to “on,” positioned on the left rear side of the spectrophotometer and allow the tungsten lamps to warm up.
2. Open the top hatch of spectrophotometer and carefully remove the 8-position cell holder and insert the 4-position cell holder, locking it in place.
3. Press “ACC,” press “2,” and change blank (B) position to “2.” This makes cell position 2 the blank position and where the DI blank sample will be placed during nutrient experiments.
4. Press “Assign Cell Positions” located below the LCD screen. Toggle the assigned cell positions to highlight each cell (B, 4, 6, and 8) making each assigned cell functioning.
5. Press “Exit” to save settings.
6. Insert 100 mm cylindrical cells into cell holder positions B, 2, 4, and 6. Manually align cells by pressing “Manual Align” located below the LCD screen. Open the hatch during this process to visualize proper alignment of cells. Toggle the arrow keys up and down to achieve the highest number of transmittance and centered alignment. Once alignment is achieved for each cell position press “Enter” to save settings.
7. Press “Exit” and begin nutrient absorbance measurements.
To change cell holders from 4-position to 8-position cell holders use the following methods:
1. Toggle the power switch to “on” positioned on the left rear side of the spectrophotometer and allow the tungsten lamps to warm up.
2. Open the top hatch of the spectrophotometer and carefully remove the 4-position cell holder and insert the 8-position cell holder, locking it in place.
3. Press “ACC,” press “2,” and change blank (B) position to “1.” This makes cell position 1 the blank position and where the DI blank sample will be placed during nutrient experiments.
4. Press “Assign Cell Positions” located below LCD screen. Toggle the assigned cell positions to highlight each cell (1 thru 8) making each assigned cell functioning.
5. Press “Exit” to save settings.
6. Insert the 10mm cuvette cells into cell holder positions 1 thru 8. Automatically align cells by pressing “Auto Align” located below LCD screen. Keep the spectrophotometer hatch closed.

15
7. Once the alignment task is completed each cell should show a “P” for pass. If an “F” appears on any of the cell positions adjust cell holder and try to auto align again. Press “Exit” to save settings and begin nutrient absorbance measurements.
Maintenance of the Spectronic Genesys 5 Spectrophotometer The Spectronic Genesys 5 spectrophotometer requires servicing and calibration every two years. Thermo Electron© North America LLC provides certified servicing and support. The standard servicing includes cleaning, maintenance, replacing the tungsten lamp, realignment, calibration, and performance testing. Decontamination declaration forms, shipping addresses, and related paperwork can be found in the KIL filing cabinet under the zooplankton microscope station. The original cardboard box used for shipping is located in the upstairs research bullpen at the ADF&G warehouse. Thermo Scientific will provide a certification of analysis and detailed list of services rendered at completion of standard servicing. This documentation will be filed at the KIL.
Basic maintenance and care of spectrophotometer during the period in between certified servicing includes:
Using the dust cover when not in use
Spraying compressed gas inside the hatch cover to reduce dust and debris accumulation
Cleaning any spilled solutions from spectrophotometer surfaces
QUALITY ASSURANCE AND QUALITY CONTROL
To ensure precise and accurate data, quality assurance (QA) and quality control (QC) measures must be taken every day. Ensuring quality assurance includes careful attention to cleanliness (e.g. glassware and cuvettes), exact measurements when preparing and adding reagents and standards, the use of standards with every nutrient batch, and recording reagent ages. To further decrease variability between sample runs the KIL uses many reagents only the day after they were made and DI water on the day it was made. To check overall accuracy use blind quality control nutrient standards and send duplicate water samples to independent laboratories. Maintain the KIL experiment log to track individual experiment details and observations.
Internal QA and QC Measures 1. General laboratory procedures will be followed to ensure the cleanliness of all glassware, the
exact preparation and addition of reagents or standards, and the use of serial dilutions with every nutrient batch.
2. Track reagent changes by plotting reagent age (days) against a standardized absorbance value (for example, Table 2, Figure 4). A linear equation with a concentration value outside of an r2 of 0.90 for the corresponding reagent age is unacceptable and will require the test to be redone (for example, Figure 4). Large Y intercepts are also unacceptable requiring the test to be redone. As reagents age, a given absorbance will give different values. Most tests show a decreasing exponential relationship. Absorbances for manual TP/TFP, however, show an increasing relationship.
a. Choose a standardized absorbance value and enter the value into column A. The standardized absorbance value chosen should reflect an average corrected absorbance value from the data.

16
b. Enter the actual linear formulas for the specific test into column B.
c. Enter the corresponding age (days) of the reagent for the linear formula into column C.
d. Enter the value calculated by substituting the standardized absorbance value into the linear equation in column D.
e. Plot the reagent days against the calculated value using a scatter plot (follow the procedures under the Formulating Linear Equations section) to get a linear equation and r2.
External QA and QC Measures 1. Use certificate of analysis nutrient samples: these nutrients come in a prepared ampule with
the reference value in a sealed envelope. The certificate of analysis provides an advisory range from the National Standards for Water Proficiency Testing Studies Criteria Document (1998) at the 95% confidence level.
2. Send duplicate water samples to ADF&G’s CRL program or University of Georgia for analysis. CRL participates in the U.S. Geological Survey’s analytical evaluation program for standard reference samples.
FORMULATING LINEAR EQUATIONS FOR MANUAL EXPERIMENTS
Serial dilutions (a range of concentrations of a standard) given in each test section are measured in the spectrophotometer at the given wavelength and plotted with their corresponding concentration to produce a linear equation. Water samples (unknown concentrations) are measured following the serial dilutions in the spectrophotometer and their corresponding value is entered into the linear equation provided by the serial dilutions to produce a concentration value. The linear equation and the coefficient of determination (r2) can be formulated by regressing the known serial dilution concentrations against averaged absorbances (spectrophotometer measurements), using the following procedures (for example; Table 2, Figure 5):
1. The standard linear equation is y = mx + b; where y = the calculated concentration, m = the slope of the line (rise over run), x = the spectrophotometer measurement (in nm), and b = the y intercept.
2. Enter the serial dilution volume (mL) into column 1 and the volume (mL) of DI water or appropriate dilution agent added into column 2 in an Excel spreadsheet (Table 1). These two columns added together constitute the total volume of the sample standard. Enter the known concentration value (units vary with test type) of the serial dilutions into column 3.
3. Enter the serial dilution absorbance (spectrophotometer measurement in nm) for the appropriate wave length into column 4.
4. Subtract the “blank” serial dilution (0.0 concentration; see Table 1) absorbance value from each of the serial dilution absorbances in column 4 and enter the result into column 5 (i.e. the value in the first row of column 4). This corrected absorbance subtracts the absorbance associated with the addition of reagents at a concentration of zero.
5. Plot the data using a scatter plot, setting the X values to equal the adjusted sample absorbances (column 5), and the Y values to equal the secondary standard concentrations (serial dilutions) in column 3.

17
6. Choose “add a trendline” to add the linear equation and r2 value to the graph. Caution: Do not force the values through zero. Forcing the line through zero changes the y intercept (b) and in most cases gives an unsatisfactory result.
7. Calculate sample nutrient concentrations (y in the formula, y = mx + b) by subtracting the same averaged blank absorbance from the averaged sample nutrient absorbances, and substituting these values into the regression formula (x in the formula, y = mx + b) calculated by the serial dilutions.
8. An Excel file called Experiment Formulas exists with each experiment’s historic regressions. Prior to each experiment, the file should be accessed and the previous experiments’ regressions and related formulas pasted into new cells and date of experiment noted.
MANUAL SAMPLE ANALYSIS PROCEDURES
The following manual sample methods are described below for pH, Alkalinity, Color, TA, N+N, TP/TFP, FRP, Chlorophyll-a, and SI.
pH Almost every chemical reaction is pH dependent, making it an important aspect of water quality. pH units are a measurement of the concentration of hydrogen ions (acidity) in a solution at a specific temperature and is an important attribute in determining alkalinity (Koenings et al. 1987).
Equipment The following equipment is required to measure pH: Oakton pHTestr30 handheld pH meter, 100 mL graduated cylinder, and 250 mL beakers.
Reagents Buffer solutions of pH 4, 7, and 10 used to calibrate the pH meter.
Procedure 1. Calibrate the pH meter according to the manufacturer’s instructions.
2. Pour 100 mL of the unfiltered refrigerated water sample into a 250 mL beaker.
3. The Oakton pHTestr30 handheld pH meter automatically corrects for temperature.
4. Remove the cap from the pH probe. Immerse the pH probe into the sample and stir briefly to clear the electrode fill solution from the probe. Record the measurement when equilibrium is reached. Stirring affects the pH so be sure to allow adequate time for the sample to stabilize.
5. Rinse the probe with DI water and gently blot dry with a Kimwipe.
6. Continue with the next sample.
7. When completed, store meter with tap water moistened sponge inside of cap to prevent sensor from drying out. Always keep sensor in water saturated environment when not in use or during long term storage.

18
ALKALINITY
A lake’s alkalinity determines its ability to resist changes in pH (Koenings et al. 1987). Many chemical reactions, such as photosynthesis, affect the pH and alkalinity (buffering capacity) and are important to the health of the lake. Alkalinity is principally due to the presence of carbonate and bicarbonate ions, which are converted to carbon dioxide at a pH of 4.5.
Equipment The following equipment is required to measure alkalinity:
Oakton pHTestr30 handheld pH meter
10 mL buret
buret stand
magnetic stirrer
large magnetic stir bar
volumetric flasks
pipette
100 mL graduated cylinder
250 mL beaker
The use of two pH meters, one for pH and one for alkalinity, decreases the time needed to make measurements.
Chemical Handling and Disposal Buffer solutions are mildly hazardous; wash hands after use and avoid extended contact. Concentrated sulfuric acid is very reactive and a health hazard. Prevent any skin contact and handle or dispose of only in the fume hood. The dilute 0.02 Normal (N) sulfuric acid is a mild irritant. Consult MSDS for specifics.
Reagents 1. 1 N sulfuric acid (H2SO4) – Add 27.8 mL of concentrated sulfuric acid to ~800 mL of DI
water and dilute to 1 L with DI water. Concentrated sulfuric acid is 36 Normal (N).
2. 0.02 N sulfuric acid – Dilute 10 mL of 1 N sulfuric acid to 500 mL with DI water.
3. Buffer solutions of pH 4, 7, and 10 to calibrate the pH meter.
Procedure 1. Calibrate the pH meter according to the manufacturer’s instructions (Oakton pHTestr30
handheld pH meter, 2011).
2. Measure 100 mL of the unfiltered refrigerated water sample into a 250 mL beaker. Place a stir bar into the 250 mL beaker and place the beaker on a magnetic stirrer. Place the pH meter probe into the beaker with the water sample.
3. Fill the 10 mL buret with 0.02 N sulfuric acid (titrant). Slowly add titrant to the water sample, stirring to mix the sample. Allow the sample to stabilize after additions, while

19
monitoring the pH. Add titrant until a pH of 4.5 is reached and record the volume (mL) of titrant used.
Calculations Total Alkalinity (mg L-1 as CaCO3) = B x N x 50000 V Where: B = mL of titrant added N = normality (molar concentration) of the titrant V = sample volume in mL
Or: If the above procedure is followed: Total Alkalinity = B x 10
THAWING WATER SAMPLES
Slowly thaw the water samples in a water bath at no more than 20oC or in the refrigerator before use. Overheating the sample can break chemical bonds. Always completely thaw the sample. If possible, analyze the total ammonia (TA) concentration first because it changes rapidly with repeated thawing and freezing.
EXPERIMENT GLASSWARE ORDER SHEET
For TA, N+N, FRP, TFP, TP, SI, and Color nutrient experiments an Experiment Glassware Order Sheet (Figure 6) will be prepared. The glassware order sheet lists the lake, date, station, and depth to be measured for a particular experiment and is used as a checklist while obtaining the desired samples from the freezer. For manual experiments, stoppered cylinders (SC) will be labeled with a number using a permanent marker referencing the Glassware Order Sheet and volumetric flasks (VF) are pre-numbered. Lake samples listed as 1 and 2 on the glassware order sheet will be transferred from the single prescribed sample bottle into each of the two SC or VF labeled 1 and 2. The Glassware Order Sheet is instrumental in tracking each duplicate sample and absorbance measured throughout an experiment.
LIMNOLOGY LAB DATA SHEET
For Chlorophyll-a nutrient experiments, pH, and alkalinity a Limnology Lab Data Sheet (Figure 7) for each sample to be tested will be prepared. The Limnology Lab Data Sheet lists the lake, date, station, depth, absorbance, date tested, tested by, and comments. For manual N+N experiments the cadmium column used (B or C) will be noted next to the absorbance measurement.
STANDARDS SHEET
For each manual nutrient experiment, except Chlorophyll a, a Standards Sheet (Figure 8) will be prepared. The Standards Sheet lists the date, type of experiment, reagent age, standards (mL), the concentration (ug/L), and absorbances measured. The Standards Sheet will be utilized to record serial dilution (standards of a known concentration) absorbances and the measurements will be used to create linear regressions to estimate perspective nutrient levels. In the comments section of the Standards Sheet the formula for the linear regression, the r2 value, and the blind test values will be recorded.

20
The Experiment Glassware Order Sheet, Limnology Lab Data Sheet, and Standards Sheet can be found in the V\\Kodiak Island Laboratory\Blank Data Sheets and Logs.
NUTRIENTS QUALITY CHECK
A blind nutrient check is used to evaluate the quality of the analytical data generated from the experiments run by the KIL. A blind nutrient check will be tested for each nutrient experiment, except Chlorophyll a, and results will be recorded on the Standards Sheet. Two blind samples will be prepared following the Ultra Scientific ULTRAcheckTM Instructions for Use which is included in the ULTRAcheck Nutrients Sample kit (Item: QCI-740). It is vital that directions are followed precisely, Type A glassware is used, and the highest quality of DI water is used for nutrient concentrate dilution preparation. A certificate is included in the nutrients sample kit showing the reference values and advisory ranges in a sealed envelope, to be opened after the analysis is completed. If the blind nutrient check for any experiment falls outside of the advisory range the reason could be one of the following:
Nutrient blind sample concentrate measurement is too high or too low (meniscus)
Transfer with pipette of concentrate to make working dilution not precise
Spectrophotometer DI blank is not >14 megohm water (preferably 18 megohm)
DI filter canisters need to be replaced and containers cleaned
Spectrophotometer cuvette holders are not aligned properly
Spectrophotometer DI blank is not zeroed before taking reading
Cuvette is smudged or dirty
Air bubbles exist in cuvette affecting absorbance measurement
Chemicals used for experiment are expired or contaminated
Reagent solutions are expired or contaminated If none of the above suggestions remedy the issue(s), the experiment must be delayed or stopped completely.
COLOR (MANUAL)
The presence of organic compounds and colloidal particles imparts color and restricts light penetration (Wetzel and Likens. 1991). Color is one factor in light penetration and affects the photic depth (1% of surface illumination).
Equipment The following equipment is required to measure color: Spectronic Genesys 5 spectrophotometer and 10 mm cuvettes.
Chemical Handling and Disposal The platinum cobalt standard is mildly hazardous. Wash hands after use and avoid extended contact. Consult MSDS for specifics.

21
Volume of color standard (mL) to be
added Volume of DI water (mL) to be
added Platinum Cobalt Unit (PT) concentration
Sample absorbance at 400 nm
0.00 4.00 0.0 0.0000.10 3.90 12.5 0.0190.20 3.80 25.0 0.0460.30 3.70 37.5 0.0640.50 3.50 62.5 0.1031.00 3.00 125.0 0.2102.00 2.00 250.0 0.4203.00 1.00 375.0 0.6153.50 0.50 437.0 0.7263.70 0.30 462.0 0.7693.80 0.20 475.0 0.7863.90 0.10 487.0 0.8034.00 0.00 500.0 0.826
Reagents 500 platinum cobalt unit standard.
Standards Prepare thirteen serial dilutions of the cobalt standard using the dilution standards summarized in Table 1.
Table 1.–Serial dilutions needed for color testing.
Procedure 1. Prepare an Experiment Glassware Order Sheet listing lake, date, station, and depth to be
measured for Color.
2. Obtain all water samples to be included in the experiment and begin thawing them out in a lukewarm water bath.
3. Measure the absorbance of the serial dilutions at 400 nm against a DI water blank in the spectrophotometer (Spectronic 1996) using 10 mm cuvettes. Record serial dilution absorbances on the Standards Sheet.
4. Plot the values in Excel, run a regression to calculate a linear formula and the r2, and record values on the Standards Sheet.
5. Transfer ~3 mL of well-mixed filtered frozen water into a 10 mm cuvette directly from the sample bottle.
6. Measure the absorbance of duplicate samples at 400 nm in the spectrophotometer against a DI water blank.
To increase accuracy, bring samples near room temperature to decrease air bubble formation on cuvettes during absorbance measurements.

22
Calculations 1. Formulate a linear equation by regressing the cobalt serial dilution concentrations against
their respective absorbances, and calculate the r2. Follow the procedures under the Formulating Linear Equations section.
2. Determine the water sample concentration by subtracting the average blank (0.000) serial dilution absorbance value from the average water sample absorbance value and insert the value into the regression formula provided by the serial dilutions.
TOTAL AMMONIA (MANUAL)
Lake nitrogen includes organic nitrogen, ammonium (NH4+), ammonia (NH3), nitrite (NO2
-), and nitrate (NO3
-; Koenings et al. 1987). Phytoplankton utilize inorganic nitrogen, but prefer ammonium and ammonia. The total ammonia test determines ammonium and ammonia concentration.
A maximum of 38 samples (76 duplicates), including standards and blinds, can be tested with the following reagent volumes and current glassware inventory. Double the reagent volumes if more than 90 samples total are to be tested.
Equipment The following equipment is required: Spectronic Genesys 5 Spectrophotometer, 50 mL stoppered cylinders, and 100 mm cuvettes.
Chemical Handling and Disposal The reagents used in this test present a health hazard. The phenol solution is very hazardous. Special handling and disposal is needed when using these reagent solutions. To prevent inhalation of hazardous fumes rinse cuvettes, stoppered cylinders, and reagent bottles in the fume hood. Consult MSDS for specifics.
Reagents 1. Phenol solution – Dissolve 25.0 g of phenol (C6H6O) into ~100 mL of reagent alcohol (ethyl;
C2H5OH), and dilute to 250 mL with reagent alcohol.
2. Ferrocyanide solution – Dissolve 1.55 g of potassium ferrocyanide-dihydrate (K4Fe(CN)63H2O) into ~200 mL of DI water, and dilute to 250 mL with DI water.
3. Hypochlorite solution – Dissolve 80 g of sodium citrate-dihydrate (C6H5Na3O72H2O) and 4 g of sodium hydroxide (NaOH) into ~300 mL of DI water. Add 100 mL of chlorine bleach (5% sodium hypochlorite), and dilute to 500 mL with DI water. Caution: most chlorine bleach is 6% sodium hypochlorite requiring only 83.3 mL. Label the date the sodium hypochlorite bottle was opened as a two-month shelf life is expected.
To decrease variability between sample runs the KIL only uses the phenol, ferrocyanide, and hypochlorite solutions on the day after they were prepared.
Standards 1. Primary nitrogen standard (0.2 mg mL-1 N) – Dissolve 0.3824 g of ammonium chloride
(NH4Cl) into ~400 mL of DI water, and dilute to 500 mL in a volumetric flask. The primary standard should be replaced after six months.

23
2. Secondary standard (0.5 g mL-1 N) – Dilute 1.25 mL of the primary standard to 400 mL with DI water, and dilute to 500 mL in a volumetric flask. The secondary standard should be replaced after three months.
3. Prepare serial dilutions of secondary nitrogen standard using the dilution standards summarized in Table 2.
Table 2.–Serial dilutions needed for TA testing.
Volume of secondary
nitrogen standard (mL) to be added
Volume of DI water (mL) to be
added
Ammonia concentration
(ug/mL)Sample absorbance
(x) at 640 nm Corrected absorbance
(x-blank)0.0 50.0 0.0 0.036 0.0000.1 49.9 1.0 0.053 0.0170.3 49.7 3.0 0.058 0.0220.5 49.5 5.0 0.066 0.0301.5 48.5 15.0 0.127 0.0913.0 47.0 30.0 0.225 0.1905.0 45.0 50.0 0.299 0.263
Note: Sample absorbance of 0.0 Ammonia concentration is the "blank"
Procedure Day 1 1. Prepare an Experiment Glassware Order Sheet and Standards Sheet for the TA nutrient
experiment.
2. Obtain all water samples to be included in the experiment and begin thawing them out in a lukewarm water bath.
3. Make all reagents listed above in the TA reagents section.
4. Label two acid washed 50 mL SC for each water sample, two acid washed SC for 0.0 and 5.0 serial dilutions (Table 2), and one acid washed SC for each of the five remaining serial dilutions listed in Table 2. Prepare serial dilutions and blind nutrient checks with each run when samples are processed.
5. For each water sample, label the SC according to the Experiment Glassware Order Sheet (1, 2, 3, 4…etc.).
6. Pour 50 mL of the filtered frozen water sample, serial dilution, or blind nutrients check into 50 mL SC. Process sample water, serial dilutions, and blind checks simultaneously.
7. Store all samples in refrigerator overnight.
Day 2 1. Add the three reagents in steps 2 through 4 to the SC in groups of three every 10 minutes to
stagger color development, allowing for proper processing time.
2. Add 2 mL of phenol solution and invert to mix.
3. Add 2 mL of ferrocyanide solution and invert to mix.

24
4. Add 5 mL of the hypochlorite solution, invert twice to mix, and invert again after 15 minutes.
5. Allow exactly 2 hours for full color development. Readings are time dependent. Measure the numbered duplicate water sample, serial dilution, and blind check absorbances against a DI water blank at 640 nm and record the measurements on the Glassware Order Sheet and Standards Sheet accordingly.
Calculations 1. Formulate a linear equation by regressing the nitrogen serial dilution concentrations against
their respective absorbencies minus the average blank (0.000) serial dilution absorbance, and calculate the r2. Follow the procedures under the Formulating Linear Equations section. Refer to Figure 5 for an example plot of the serial dilutions listed in Table 2.
2. Determine the water sample concentration by subtracting the average blank (0.000) serial dilution absorbance from the average water sample absorbance and insert the value into the regression formula provided by the serial dilutions.
NITRATE AND NITRITE (MANUAL)
Nitrite (NO2-) is oxidized to Nitrate (NO3
-) by nitrification and assimilated by phytoplankton during photosynthesis in oligotrophic systems (Koenings et al. 1987). Low oxygen concentrations in eutrophic systems can fuel denitrification (NO3
- NO2- NH3). This
method determines nitrate + nitrite concentrations by reducing nitrate to nitrite with cupric sulfate. Nitrite concentrations can be calculated by adding the reagents and not passing the water sample through the cadmium reduction columns, eliminating the reduction step.
Equipment The following equipment is required: Spectronic Genesys 5 Spectrophotometer, 80 mL cadmium reduction columns (Figure 9), 50 mL stoppered cylinders, and 100 mm cuvettes.
Chemical Handling and Disposal The buffer, cupric sulfate, and cadmium solutions are very hazardous to the health. Avoid inhaling cadmium dust. All of these solutions require special handling and disposal. The cadmium waste must be stored until it can be disposed by a certified waste disposal service. Consult MSDS for specifics.
Reagents 1. Buffer solution – Dissolve 100 g of ammonium chloride ((NH4)2CO3), 20 g of sodium
borate-10-hydrate (Na2B4O710H2O), 1 g of Na-EDTA (C10H14N2Na2O82H2O) in ~ 750 mL of DI water, and dilute to 1 L with DI water. Prepare fresh daily.
2. Sulfanilamide solution – Add 50 mL of concentrated hydrochloric acid (HCl) to ~150 mL of DI water and let cool. Dissolve 3 g of sulfanilamide (C6H8N2O2S), and dilute to 250 mL with DI water. Solution is stable over time, replace when low.
3. NNED solution – Dissolve 0.12 g of N-(1-naphthyl) ethylenediamine dihydrochloride (C12H14N22HCL) in ~50 mL of DI water, and dilute to 100 mL with DI water. Keep in a dark bottle and replace monthly or when a brown coloration develops.

25
4. Cupric sulfate solution – Dissolve 25 g of cupric-sulfate 5-hydrate (CuSO45H2O) in ~400 mL of DI water, and dilute to 500 mL with DI water.
5. 10% Hydrochloric acid – Slowly add 5 mL of concentrated hydrochloric acid (HCl) to ~ 40 mL of DI water, and dilute to 50 mL with DI water.
6. Cadmium – 40 to 60 mesh granules.
Standards 1. Primary nitrate standard (0.1 mg mL-1 N) – Dissolve 0.3610 g of potassium nitrate in ~ 400
mL of DI water, and dilute to 500 mL with DI water in a volumetric flask.
2. Secondary nitrate standard (1 g mL-1 N) – Dilute 2.5 mL of the primary standard to 150 mL DI water in a volumetric flask.
3. Primary nitrite standard (0.1 mg mL-1 N) – Dissolve 0.2463 g of sodium nitrite in ~ 400 mL of DI water, and dilute to 500 mL with DI water in a volumetric flask.
4. Secondary nitrite standard (1 g mL-1 N) – Dilute 1.0 mL of the primary standard to 100 mL with DI water in a volumetric flask.
Procedure Test the reduction efficiencies (RE) of each of the cadmium columns at the start of the season, at mid season, or after several months of not being used. If the RE is less than 95% or greater than 105%, clean and repack the cadmium columns as described below. If the cadmium columns are operating properly follow the Water Sample Processing Procedure section below.
Testing Cadmium Column Reduction Efficiencies
1. Check the RE of each column with the following procedure:
a. Prepare a 0.0 serial dilution (blank) by adding 5 mL of buffer solution to 50 mL of DI water in a SC and invert to mix.
b. Prepare four nitrate standards. Add 10 mL of the secondary nitrate standard to two SC and 5 ml of the secondary nitrate standard to two separate SC. Dilute each of the four SC to 50 mL with DI water, and add 5 mL of buffer to each SC. Invert to mix.
c. Prepare two nitrite standards. Add 10 mL of the secondary nitrite standard to one SC and add 5 mL to another SC, dilute to 50 mL with DI water, and add 5 mL of buffer. Invert to mix.
d. Pour the 10 mL nitrate/nitrite standards (200 g/mL) through each cadmium column using the Water Sample Processing Procedure section below in the following order; blank, nitrate, nitrite, and nitrate.
e. Calculate the reduction efficiency of the column at 200 g/mL as follows:
RE = (averaged absorbencies of nitrate standards) – blank
(absorbance of nitrite standard) – blank
f. Pour the 5 mL nitrate/nitrite standards (100 g/mL) through the cadmium column using the Water Sample Processing Procedure section below in the following order; blank, nitrate, nitrite, and nitrate.

26
g. Calculate the reduction efficiency of the column at 100 g/mL as follows:
RE = (averaged absorbencies of nitrate standards) – blank
(absorbance of nitrite standard) – blank
Cleaning and Repacking the Cadmium Columns
1. Clean and repack the cadmium columns with the following procedure:
a. Remove the cadmium granules by inverting the column into a 600 mL beaker and rinsing with DI water.
b. Add 50 mL of 10% HCl to the cadmium, swirl, and soak for ~ 30 minutes.
c. Rinse the cadmium with DI water, add ~30 mL of cupric sulfate solution, and soak for 15 minutes.
d. Pour off the cupric sulfate solution, rinse the cadmium with DI water, and add 30 mL of cupric sulfate solution. Soak until the cadmium is coated with copper; i.e., when the blue color disappears. Rinse the cadmium thoroughly with DI water.
e. After cleaning the columns thoroughly, close the outlet valve, and fill the column with DI water. Place a small wad of glass fiber wool into the reservoir and allow it to settle to the bottom of the column (Figure 9).
f. Using a DI wash bottle, rinse the cadmium into the column so that the granules do not bypass the glass wool and the column is not obstructed with air bubbles.
g. Re-check the RE.
Calculating Column Equations
1. Label two SC for each of the three remaining serial dilutions listed in Table 3 for each column. The other three serial dilutions were run as part of the RE.
2. Prepare serial dilutions of the nitrate standard using the dilution standards summarized in Table 3.
Table 3.–Serial dilutions needed for N+N testing.
Volume of secondary nitrate standard (mL) to
be added Volume of DI water
(mL) to be added
Nitrogen concentration
(ug/mL)
Sample absorbance (x) at
543 nm
Corrected absorbance (x-
blank)0.0 50.0 0 0.025 0.0000.1 49.9 2 0.073 0.0481.0 49.0 20 0.579 0.5542.5 47.5 50 1.109 1.0845.0 45.0 100 2.400 2.375
10.0 40.0 200 3.290 3.265Note: Sample absorbance of 0.0 Nitrate concentration is the "blank"
3. Prepare the three remaining nitrate standards by adding the appropriate volume of secondary nitrate, dilute each to 50 mL with DI water, and add 5 mL of buffer. Invert the SC to mix.
4. Pour the serial dilutions through the cadmium column using the Water Sample Processing
Procedure section below.

27
5. Formulate a linear equation for each column by regressing the nitrate serial dilution concentrations against their respective absorbances minus the average blank (0.000) serial dilution absorbance, and calculate the r2. Each column has a different regression formula and blank. Follow the procedures under the Formulating Linear Equations section.
Water Sample Processing Procedure
1. When checking the RE or calculating column equations start at step 3.
2. Prepare a Limnology Lab Data Sheet for each sample to be tested for N + N and a Standards Sheet for serial dilution and blind nutrient check samples.
3. Obtain all water samples to be included in the experiment and begin thawing them out in a lukewarm water bath. Approximately eight samples can be run through each column in a normal work day.
4. Make all reagents listed above in the N + N reagents section.
5. Label two 50 mL SC for each water sample with the lake, date, station, depth, and column (B or C) used with permanent marker on the SC base.
6. Pour 50 mL of the filtered frozen water sample into a 50 mL SC and add 5 mL of buffer solution. Invert the SC to mix.
7. Pour 50 mL of the nutrient blind check (1:1) into two 50 ml SC and add 5 mL of buffer solution to each. Invert to mix.
8. Pour ~20 mL of the buffered sample, serial dilution, or blind check into the column reservoir, allow the sample to drip through, and discard the effluent. Make sure the duplicate samples from each lake are run through the same columns. Blind checks need to be run through each working cadmium column.
9. Pour the remaining sample (~35 mL) into the column reservoir and collect 30 mL of the effluent in the original cylinder. Allow the remaining sample (~5 mL) to drip through, and discard.
10. Use a flush SC in between each duplicate water sample, standard, or blind nutrient check of 50 ml DI and 5 ml buffer. Amount of DI may need to be adjusted based on RE rates and testing.
11. Add 0.5 mL of sulfanilamide solution to the 30 mL sample collected from the cadmium column, and invert twice to mix. Allow 5 minutes for proper reaction time.
12. Add 0.5 mL of NNED solution and invert twice to mix. Allow 15 minutes for full color development. The color remains stable for hours.
13. Measure the sample absorbance, serial dilution, or blind nutrient check against a DI water blank at 543 nm. Record measurements on the Limnology Data Sheet and/or Standards Sheet.
Troubleshooting Notes:
For monthly maintenance, after extended periods without use, or when a stable zero cannot be achieved during RE trials, pass a concentrated buffer solution of 25 mL buffer and 75 mL DI water through the column. Recheck zeroes if passed during RE trials.

28
The volume of cadmium within a column greatly affects RE and flow rate. A height of less than 18.5 cm reduces flow rates and leaves residual sample in the column contaminating the next sample and reducing RE. If residual nitrate is suspected, pass a 50 mL buffered blank (50 mL DI water with 5 mL buffer added) through the columns between sample sets to compensate for residual nitrogen left in the column.
If the sample is tinted blue after passing through the column, clean the cadmium column.
Keep the reservoirs covered with parafilm at all times.
Calculations 1. Determine the water sample concentration by subtracting the average blank (0.000) serial
dilution absorbance from the average water sample absorbance and insert the value into the regression formula provided by the serial dilutions. Each column has a different regression formula and blank value. For nitrate concentrations greater than 100 g L-1 water samples
must be diluted.
Note: Generally, N + N samples to be diluted are Spridion, Chignik, and early season Uganik lakes samples. Split above mentioned samples in half, using 25 mL of sample water and dilute with DI water to 50 mL. Add 5 mL buffer and invert to mix. Scribe “1/2” on SC base and multiply nutrient level by 2 before entering into database.
TOTAL PHOSPHOROUS AND TOTAL FILTERABLE PHOSPHOROUS (MANUAL)
Phosphorous concentrations in aquatic systems are typically low and can limit production (Koenings et al. 1987). N:P ratios > 18:1 are favorable for algae growth. Concentrations average 9 g L-1 TP and 3 g L-1 TFP for Kodiak Lakes.
Equipment The following equipment is required: Genesys 5 Spectrophotometer, autoclave ( C, 15 psi), 50 mL volumetric flasks (VF), 50 mL SC, and 100 mm cuvettes. Quartz cuvettes are recommended.
Chemical Handling and Disposal The antimony tartrate solution, digestion reagent, and concentrated acids are very hazardous to the health. All of these solutions require special handling and disposal. Consult MSDS for specifics.
Reagents 1. Antimony-tartrate solution – Add 53.3 mL of concentrated sulfuric (H2SO4) acid to ~800 mL
of DI water and allow to cool at room temperature. Dissolve 0.748 g of antimony potassium tartrate trihydrate (C8H4K2O12Sb23H2O) in the sulfuric acid solution and dilute to 1 L with DI water. Filter the solution when a precipitate forms. Store refrigerated and replace every 45 days.
2. Molybdate solution – Dissolve 7.95 g of ammonium molybdate-4-hydrate ((NH4)Mo7O244H2O) in ~500 mL of DI water and dilute to 1 L with DI water. Store refrigerated in polybottle and replace every 45 days.

29
3. 3.6 N Sulfuric acid – Add 12.5 mL of sulfuric acid (H2SO4) to ~100 mL of DI water, cool, and dilute to 125 mL with DI water.
4. Digestion reagent – Add 50 mL of 3.6 N sulfuric acid (H2SO4) to ~400 mL of DI water and dissolve 30 g of potassium persulfate (K2S2O8), dilute to 500 mL with DI water. Avoid sediment when using this reagent.
5. Mixed reagent I (MRI) – Combine 125 mL of both the antimony-tartrate and molybdate solutions. Add 1 g of ascorbic acid (C6H8O6), dissolve, and dilute to 500 mL with DI water.
To decrease variability between sample runs the KIL only uses the digestion and mixed reagent I on the day after they were made.
Standards 1. Primary phosphorous standard (0.05 g mL-1 P) – Dissolve 0.1389 g of potassium phosphate-
dibasic (K2HPO4) in ~400 mL of DI water and dilute to 500 mL with DI water in a volumetric flask. The primary standard should be replaced after six months.
2. Secondary standard (0.5 g ml-1 P) – Dilute 1 mL of the primary phosphorus standard to 100 mL with DI water in a volumetric flask. The secondary standard should be replaced after three months.
3. Prepare serial dilutions of the secondary phosphorous standard using the dilution standards summarized in Table 4.
Table 4.–Serial dilutions needed for TP and TFP testing.
Volume of secondary phosphorous standard
(mL) to be added Volume of DI water (mL) to be added
Phosphorous concentration
(ug/mL)
Sample absorbance (x) at
882 nm
Corrected absorbance
(x-blank)0.00 25.0 0 0.032 0.0000.10 24.9 2 0.046 0.0140.20 24.8 4 0.056 0.0240.30 24.7 6 0.086 0.0540.50 24.5 10 0.086 0.0541.00 24.0 20 0.128 0.096
Note: Sample absorbance of 0.0 Phosphorus concentration is the "blank"
Procedure Day 1 1. Prepare an Experiment Glassware Order Sheet and Standards Sheet for the TP/TFP nutrient
experiment.
2. Obtain all water samples to be included in the experiment and begin thawing them out in a lukewarm water bath. Use unfiltered water for TP and filtered water for TFP.
3. Make all reagents listed above in the TP/TFP reagents section.
4. Follow the Experiment Glassware Order Sheet closely and use pre-numbered acid washed 50 mL VF for each water sample, two acid washed VF for 0.00 mL (DI water blanks) and 1.00 mL serial dilutions, and one acid washed VF for each of the 4 remaining serial dilutions listed in Table 4.

30
5. For preparation of serial dilutions, use Type A 25 mL graduated cylinders. Carefully pipette the volume of secondary phosphorous to be added for each serial dilution and add DI water to exactly 25 mL. Secure parafilm over cylinder, tightly press thumb over parafilm, and invert. Transfer serial dilution to numbered VF.
6. Pour 25 mL of the sample water into a 50 mL VF. Process water samples and measure serial dilutions simultaneously.
7. Prepare ~90, 1 x 1 inch aluminum foil squares for day two autoclave procedures and store prepared samples in the refrigerator overnight.
Day 2 1. Add 5 mL of digestion reagent and mix. Cover the VF with aluminum foil and let it digest in
the autoclave for 30 minutes. Follow the autoclave procedure below.
a. Leave the temperature setting on low and set the autoclave timer to 50 minutes to allow for the slow cooling cycle.
b. Fill the water reservoir with distilled water to the top edge of the hexagon shaped knob in the front center of the reservoir. Place sample VF on rectangular autoclave tray, insert into autoclave, and seal the circular door.
c. Turn on the power and the slow exhaust switches.
d. When the timer sounds, turn power off and slowly crack open the autoclave door using the black circular handle to allow steam to vent. Keep extremities clear of opening before venting and wear Atlas nitrile gloves when handling sample tray to prevent burns.
e. Open condensate valve and drain reservoir after each digestion cycle and refill with fresh distilled water.
2. Insert next batch of samples and restart autoclave process.
3. Cool the digested water samples to room temperature (~1 hour). Add 5 mL of MRI and mix. Add the reagent to the volumetric flasks in groups of three every ten minutes to stagger color development, allowing for proper processing time.
4. Allow exactly 20 minutes for full color development. Readings are time dependent. Measure the serial dilution and water sample absorbances against a DI water blank at 882 nm.
Calculations 1. Formulate a linear equation by regressing the phosphorous serial dilution concentrations
against their respective absorbances minus the average blank (0.000) serial dilution absorbance, and calculate the r2. Follow the procedures under the Formulating Linear
Equations section.
2. Determine the water sample concentration by subtracting the average blank (0.000) serial dilution absorbance from the average water sample absorbance and insert the value into the regression formula provided by the serial dilutions.
FILTERABLE REACTIVE PHOSPHOROUS (MANUAL)
Algae readily take up filterable reactive phosphorous, commonly called soluble inorganic orthophosphate (Koenings et al. 1987).

31
Equipment The following equipment is required: Spectronic Genesys Spectrophotometer, 50-mL stoppered cylinders, 100 mm cuvettes (quartz recommended).
Chemical Handling and Disposal The antimony tartrate solution and concentrated acids are very hazardous to the health. All of these solutions require special handling and disposal. Consult MSDS for specifics.
Reagents 1. Mixed reagent II (MRII) – Combine in order: 125 mL of molybdate solution, 50 mL of 3.6 N
sulfuric acid (H2SO4), and 125 mL of antimony-tartrate solution. Add 1.0 g of ascorbic acid (C6H8O6), allow the ascorbic acid to dissolve, and dilute to 500 mL with DI water.
To decrease variability between sample runs the KIL only uses the MR II on the day after it was made.
Standards 1. Prepare the primary and secondary phosphorous standards as described in the TP and TFP
methods. 2. Prepare serial dilutions of the secondary phosphorous standard using the dilution standards
summarized in Table 5. Table 5.–Serial dilutions needed for FRP testing.
Volume of secondary phosphorous standard (mL) to
be added Volume of DI water
(mL) to be addedPhosporous
concentration (ug/L)
Sample absorbance (x) at
882 nm
Corrected absorbance (x-
blank)0.00 25.0 0 0.0065 0.00000.05 25.0 1 0.0130 0.00650.10 24.9 2 0.0180 0.01150.20 24.8 4 0.0290 0.02250.30 24.7 6 0.0470 0.04050.50 24.5 10 0.0710 0.0645
Note: Sample absorbance of 0.0 Phosphorus concentration is the "blank" Procedure Day 1 1. Prepare an Experiment Glassware Order Sheet and a Standards Sheet for the FRP
experiment.
2. Obtain all filtered water samples to be included in the experiment and begin thawing them in a lukewarm water bath.
3. Prepare antimony-tartrate, molybdate, and 3.6 N sulfuric acid solutions (reagents 1 through 3) as described in the TP and TFP methods.
4. Label two acid washed 50 mL SC for each water sample, two acid washed SC for 0.0 mL (DI water blanks) and 0.50 mL serial dilutions, and one acid washed SC for each of the four

32
remaining serial dilutions listed in Table 5. Run serial dilutions each day samples are processed.
5. Pour 25 mL of filtered water sample or 25 mL of serial dilution into a labeled acid washed 50 mL SC. Prepare sample water and serial dilutions simultaneously.
6. Store prepared SC lake samples and serial dilutions in refrigerator overnight.
Day 2 1. Add the MRII reagent to groups of three SC’s every ten minutes to stagger color
development, allowing for proper processing time.
2. Add 5 mL of MRII, and invert to mix.
3. Allow exactly 20 minutes for full color development. Readings are time dependent. Measure the serial dilution and water sample absorbance against a DI water blank at 882 nm.
Calculations 1. Formulate a linear equation by regressing the phosphorous serial dilution concentrations
against their respective absorbances minus the average blank (0.000) serial dilution absorbance, and calculate the r2. Follow the procedures under the Formulating Linear
Equations section.
2. Determine the water sample concentration by subtracting the average blank (0.000) serial dilution absorbance from the average water sample absorbance and insert the value into the regression formula provided by the serial dilutions.
CHLOROPHYLL-a AND PHAEOPHYTIN-a
Primary production can be estimated by calculating the concentration of phytoplankton chlorophyll pigments in a volume of water (Edmonson 1959). Chlorophyll-a is the largest component of chlorophyll algal pigments. Degradation of chlorophyll results in increased presence of phaeophytin-a (Lind 1985).
Equipment The following equipment is required: Genesis 5 Spectrophotometer, grinding vessel (ceramic mortar and pestle), Clay-Adams Dynac centrifuge, 15 mL glass centrifuge tubes, Whatman GF/F filter pads, and 10 mm cuvettes (quartz recommended).
Chemical Handling and Disposal Sodium bicarbonate is mildly hazardous, requiring no special handling or disposal. Acetone use should be confined to the hood. Wash hands after use and avoid extended contact. Hydrochloric acid is very reactive and a health hazard, prevent contact and handle or dispose of only in the fume hood. Consult MSDS for specifics.
Reagents 1. 1 N Sodium bicarbonate – Dissolve 8.4 g of sodium bicarbonate (NaHCO3) into 100 mL DI
water.
2. 2 N Hydrochloric acid – Add 42 mL of concentrated hydrochloric acid (HCl) to ~200 mL of DI water and dilute to 250 mL with DI water.

33
3. 90% neutralized acetone – Add 1 mL of 1 N sodium bicarbonate to 900 mL of reagent-grade acetone (C3H6O) and dilute to 1 L with DI water and filter in the hood.
Procedure Day 1 1. Prepare a Limnology Lab Data Sheet for each sample to be tested for Chlorophyll-a.
2. Obtain all sample filter pads to be included in the experiment and keep them frozen until needed. Place a frozen filter pad into a freezer chilled mortar, and add 2 mL of 90% acetone.
Note: Keep the samples dark and as cold as possible throughout the procedure. Storing the spare mortar in the freezer in between samples helps keep the samples cold. Avoid washing glassware with 10% HCl.
3. Grind the filter pad into paste-like slurry without splashing or spilling any of the sample. Add 2 mL 90% acetone and regrind.
4. Scrape the slurry into a 15 mL centrifuge tube, rinse the mortar and pestle with ~4 mL of 90% acetone and add the contents to the centrifuge tube. Rinse the mortar and pestle again with 2 mL of 90% acetone, and add the contents to the centrifuge tube. The total volume of acetone added is 10 mL.
5. Cover the centrifuge tube with a cap, and refrigerate the samples for 2-3 hours to complete chlorophyll-a extraction. Samples should be stored in the refrigerator overnight to allow for increased production. Keep the centrifuge tubes covered and in darkness.
Day 2 1. Centrifuge the tubes for 40 minutes at 2,500 rpm (set DYNAC centrifuge at 95). Decant the
supernatant into a 25 mL graduated cylinder and dilute to 12 mL with 90% acetone.
2. Invert to mix, split equally (6 mL) into two centrifuge tubes (one tube cap unlabeled and one tube cap labeled “A” for acid).
3. Add 0.05 mL of 2 N HCl to the “A” tube. Invert to mix the acidified centrifuge tube.
4. Measure the absorbance of the unacidified fraction against a 90% acetone blank at 750 nm, 665 nm, 663 nm, 645 nm, and 630 nm.
5. Measure the absorbance of the acidified fraction against a 90% acetone blank at 750 nm, and 665 nm.
Calculations (Monochromatic method)
chlorophyll a (g L-1) = 26.7 (665o – 665a) x Vs L x V f
phaeophytin a (g L-1) = 26.7 (1.7 (665a )– 665o) x Vs
L x V f
(665o) = absorbance 665 nm – absorbance 750 nm (before acidification).
(665a) = absorbance 665 nm – absorbance 750 nm (after acidification).

34
Vs = total volume (mL) of sample extract (12 mL normally).
L = path length (cm) of cuvette.
Vf = volume (L) of lake water filtered
SILICON (MANUAL)
Silicon is a primary nutrient required by diatoms for the formation of frustules. Should reactive silicon levels become diminished, diatoms may be replaced by other algae.
This method measures reactive silicon, presumably the inorganic form available for algal uptake. Silicon reacts with ammonium molybdate to form a yellow-colored silicomolybdate complex which is reduced by sodium sulfite to produce an intense blue color.
Equipment The following equipment is required: Genesis 5 Spectrophotometer (810 nm), 15 mL disposable centrifuge tubes, and 10 mm cuvettes.
Chemical Handling and Disposal Hydrochloric acid and oxalic acid are very reactive and a health hazard, prevent contact and handle or dispose of only in the fume hood. Wash hands after use and avoid extended contact. Consult MSDS for specifics.
Reagents 1. Ammonium Molybdate – Dissolve 2.0 g of ammonium molybdate-4-hydrate in ~150 mL of
DI water. Add 6 mL of concentrated hydrochloric acid, and dilute to 250 ml with DI water. Store in a polyethylene bottle and discard when a precipitate forms. Double for >110 samples.
2. Metol-sulfite – Dissolve 2.4 g of sodium sulfite-anhydrous into 200 mL of DI water. Add 4 g of p-methylaminophenol sulfate (metol) and dissolve. Prepare fresh daily.
3. Oxalic acid – Dissolve 10 g of oxalic acid into ~80 mL of DI water, and dilute to 100 mL. Oxalic acid should be prepped first and left in hood overnight as it takes a full day to come into solution.
4. 1:1 sulfuric acid – Slowly pour 250 mL of concentrated sulfuric acid (H2SO4) into ~200 mL of DI water, cool, and dilute to 500 ml.
5. Reducing reagent – Combine 167 mL of metol-sulfite, 100 mL of oxalic acid, 100 mL of 1:1 sulfuric acid, and 133 mL of DI water.
Note: Running 150 samples (75 duplicates) is recommended. Metol-sulfite and oxalic acid reagents will have to be doubled in this case.
Standards 1. Primary standard (0.467 mg mL-1 Si) – Dissolve 0.782 g of sodium hexafluorosilicate
(Na2SiF6) into ~200 mL of DI water blank and dilute to 250 mL. Sodium hexafluorosilicate (Na2SiF6) is also referred to as sodium fluorosilicate.
2. Secondary standard (4.67 ug/mL-1) – Dilute 1 mL of the primary standard to 100 mL.

35
3. Prepare serial dilutions of the secondary phosphorous standard using the dilution standards summarized in Table 6.
Table 6.–Serial dilutions needed for SI testing.
ReactiveSecondary Total Siliconstandard volume Concentration Absorbance abs
(mL) (mL) (ug/L-1) (x) (x - blank)
0.0 5.0 0 .001, .001 0.0000.1 5.0 93 .044, .042 0.0421.0 5.0 934 .401, .415 0.4072.0 5.0 1,868 .796, .812 0.8033.0 5.0 2,802 1.164, 1.205 1.1844.0 5.0 3,736 1.573, 1.593 1.582
r2 = .9999 Si (ug/L-1) = -12.6923 + 2366.6386 (abs)
Procedure Day 1 1. Prepare a Glassware Order Sheet and Standards Sheet.
2. Obtain all water samples to be included in the experiment and begin thawing them in a lukewarm water bath.
3. Prepare all reagents and serial dilutions listed above except for metol-sulfite and reducing reagent.
4. Place 5 mL of unfiltered sample or standard into a 15 mL centrifuge tube. Store samples in refrigerator overnight.
Day 2 1. Prepare the Metol-sulfite and reducing reagents.
2. Stagger samples in groups of 6 every 15 minutes.
3. Add 2 mL of molybdate reagent, invert to mix, and allow 15 minutes for color (yellow) development.
4. Add 3 mL of reducing reagent, invert 3 times, and allow 2 hours for full color (blue) development.
5. Measure the absorbance of the water samples and serial dilutions at 810 nm against a DI water blank.

36
Calculations 1. Formulate a linear equation by regressing concentrations (Y-axis) against the averaged
absorbances minus the blank (X-axis) and calculate the coefficient of determination (r2).
2. Calculate sample concentration by subtracting the blank value from the sample absorbances, and substitute into the regression formula.
AUTOMATED SAMPLE ANALYSIS PROCEDURES
SEAL ANALYTICAL AA3 AND XY-2 SAMPLER
The Seal Analytical© AutoAnalyzer3 with XY sampler (AA3) is a modern wet-chemistry analyzer that is used in industrial laboratories for automation of complex chemical reactions. It uses the principle of air-segmented continuous flow-analysis (CFA) for fully automatic sample analysis. Samples are mixed with reagents in a continuously flowing stream. The individual sample segments are separated by air bubbles. The main components are the Sampler, Pump, Chemistry Module, and Digital Colorimeter. System control is provided by the SEAL Analytical AACE software. Due to its modular design the AA3 can be easily adapted to the specific requirements of the KIL (Figure 10). The KIL will use AA3 chemistry applications and methodologies to measure TA, N+N, TP, TKN, and SI in 2013 (Appendix B).
AA3 Advantages Fully automatic operation
Low detection limits
High accuracy and precision
Low reagent consumption
40-100 samples per hour, depending on the method
Fast wash-in, wash-out, and method changeover
Automatic dilution and re-analysis of off-scale samples using the optional dilution valves or syringe diluter
DESCRIPTION OF AA3 COMPONENTS
XY-2 Sampler The sampler is used to aspirate sample and standard solutions.
AA3 Pump The AA3 pump is a high precision peristaltic pump that pumps samples, reagents, and air through the complete AA3 system at defined flow rates through a series of flexible pump tubes. By a steady process of first squeezing and then relaxing pressure on the tubes, the fluids are drawn into the system and pushed forward through the components on the Chem Tray and the flowcell of the digital colorimeter.

37
AA3 Chemistry Module The Chemistry Module is the part of the analytical system where the actual chemical reaction takes place. Placed next to the pump, it contains all the components required for the reaction, e.g. mixing coils, heating bath, ion exchange column, etc. At the end of the reaction, the sample/reagent mixture is directed from the Chemistry Module to the Digital Colorimeter for colorimetric analysis. Two components for one chemical method are mounted on a so-called Chem Tray. Holding two Chem Trays, the Chemistry Module can be used to determine two parameters simultaneously.
AA3 High Resolution Digital Colorimeter The High Resolution Digital Colorimeter contains the detector module as well as the control electronics for all AA3 modules. It follows the Chemistry Module and receives the sample/reagent/air stream at the end of the chemical reaction.
PC with AACE Software The AACE software is SEAL Analytical’s dedicated continuous flow-software package. It controls the AA3 modules, programs and starts runs, displays run charts, reports results, etc. For use with the AA3 HR Digital Colorimeter, the AACE software version 6.02 or higher is required. The AA3 HR4 Digital Colorimeter is supported by AACE software version 6.07 or higher.
DAILY START-UP PROCEDURE
The following checks can be carried out as a daily start-up or diagnostic procedure in order to identify problems at the earliest possible stage. Make sure each step is OK before proceeding to the next one. The SEAL AA3 Operation Manual (SOM) and Customer Support Manual (CSM) is available in KIL.
1. Switch on all AA3 modules and pump DI water + wetting agent through the reagent lines.
Wetting agent is required to wet plastic tubing so that the bubbles are separated from the tubing surface by a thin film of liquid.
Add the same type and amount of wetting agent to the DI water as specified in the method documentation for the reagent with the highest flow rate. Typical wetting agents are Brij-35 and sodium dodecyl sulfate (SDS). Refer to specific nutrient test methodology for required wetting agent and recipes.
2. Check bubble patterns in all lines, especially the flowcell waste line.
Bubbles must completely fill the tubing. Their length should be approximately 1.5 times the inner diameter of the tubing
Bubbles must be the same size, same shape and same distance apart.
Bubble shape in all plastic tubing must be round at the front and back. If the bubble looks straight or square at the back, there is insufficient wetting agent, tubing is wrong type, or tubing is contaminated.
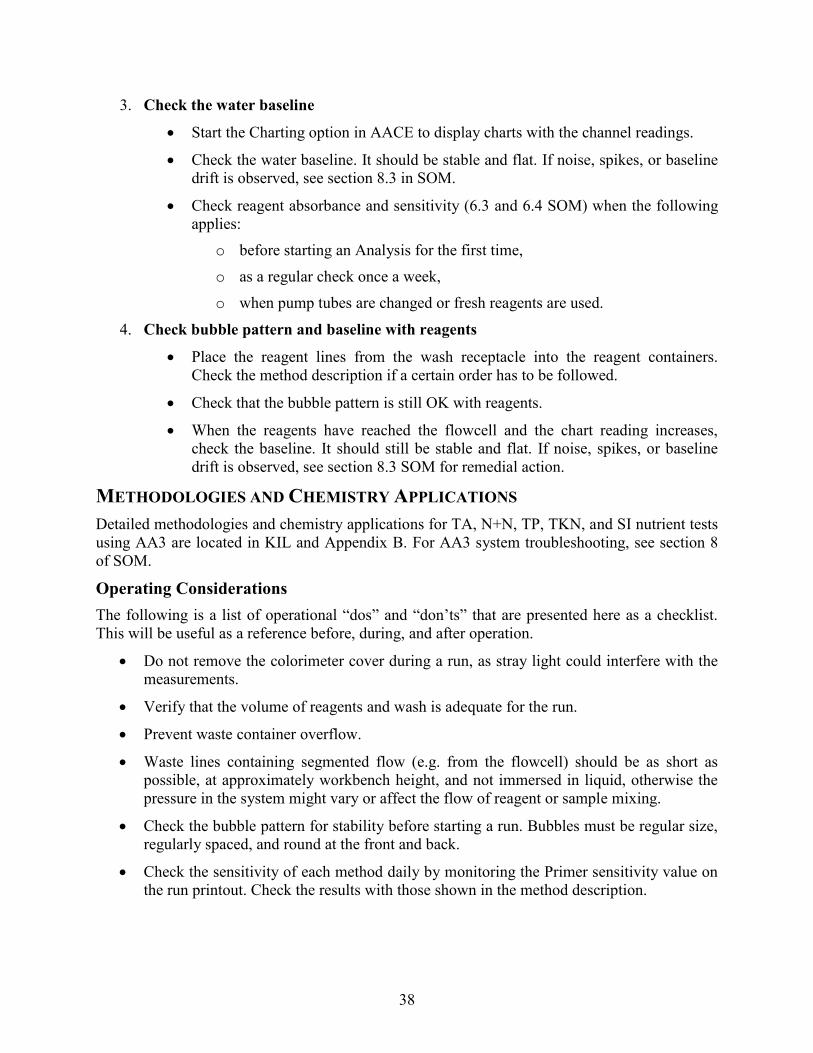
38
3. Check the water baseline
Start the Charting option in AACE to display charts with the channel readings.
Check the water baseline. It should be stable and flat. If noise, spikes, or baseline drift is observed, see section 8.3 in SOM.
Check reagent absorbance and sensitivity (6.3 and 6.4 SOM) when the following applies:
o before starting an Analysis for the first time,
o as a regular check once a week,
o when pump tubes are changed or fresh reagents are used.
4. Check bubble pattern and baseline with reagents
Place the reagent lines from the wash receptacle into the reagent containers. Check the method description if a certain order has to be followed.
Check that the bubble pattern is still OK with reagents.
When the reagents have reached the flowcell and the chart reading increases, check the baseline. It should still be stable and flat. If noise, spikes, or baseline drift is observed, see section 8.3 SOM for remedial action.
METHODOLOGIES AND CHEMISTRY APPLICATIONS
Detailed methodologies and chemistry applications for TA, N+N, TP, TKN, and SI nutrient tests using AA3 are located in KIL and Appendix B. For AA3 system troubleshooting, see section 8 of SOM.
Operating Considerations The following is a list of operational “dos” and “don’ts” that are presented here as a checklist. This will be useful as a reference before, during, and after operation.
Do not remove the colorimeter cover during a run, as stray light could interfere with the measurements.
Verify that the volume of reagents and wash is adequate for the run.
Prevent waste container overflow.
Waste lines containing segmented flow (e.g. from the flowcell) should be as short as possible, at approximately workbench height, and not immersed in liquid, otherwise the pressure in the system might vary or affect the flow of reagent or sample mixing.
Check the bubble pattern for stability before starting a run. Bubbles must be regular size, regularly spaced, and round at the front and back.
Check the sensitivity of each method daily by monitoring the Primer sensitivity value on the run printout. Check the results with those shown in the method description.

39
Check the reagent absorbance relative to water whenever a new lot of reagents is used or when the quality of the reagents being used is in question. Compare the result to the value given in the method description.
Replace pump tubes after 200 hours of operation, or less if necessary (e.g. when using strong reagents)
Do not read the reagent baseline for sensitivity with the pump at high speed, because the decreased residence time in the modules will result in incomplete chemical reaction and, hence, a possibly inaccurate absorbance.
Never run the pump at high speed while strong acid or alkali (above 2N) is in the pump tubes. In methods using strong reagents, rinse with water, using normal pump speed. When all strong reagents have left the pump tubes, you can turn on high-speed pumping. This eliminates the possibility of a connection coming loose and spurting a corrosive reagent.
DAILY SHUTDOWN PROCEDURE
At the end of the day, carry out the following shutdown procedure:
1. Place the reagent lines into the wash solution
Check the method description first for method-specific washes.
If the method does not specify a wash solution, use water and wetting agent (same as used for the reagents).
If special cleaning is required, use one of the following solutions. 1 N NaOH 40 g/L NaOH (for acid reagent lines)
1 N HCl 83 mL concentrated HCl/L
1:10 diluted hypochlorite
As a general rule, use alkaline wash for acid reagent lines and acid wash for alkaline reagent lines.
Check the method description first for method-specific washes. 2. Set the pump to fast speed and pump wash solution through the complete system for
approx. 10 minutes, or until the tubing is clean.
3. Afterwards, switch off the pump and remove the pump platen to release pressure from the pump tubes.
4. Place the platen upside down on the pump.
5. Switch off all AA3 modules.
MAINTENANCE AND REPLACEMENT PROCEDURES
The modules of the AA3 system must be regularly maintained to ensure proper operation. It is recommended that a maintenance report be kept, to give a record of routine servicing and system performance data, and to serve as a useful data sheet for SEAL Analytical service engineers or for telephone troubleshooting. Blank forms are provided in section 7, SOM.

40
To ensure proper and reliable operation, the AA3 Pump requires a few maintenance procedures to be carried out regularly:
Weekly maintenance (see section 3.5, SOM) 1. Once a week, or whenever reagents or pump tubes are changed, check reagent
absorbance and sensitivity (see sections 6.3 and 6.4, SOM).
2. Before each use, move the Pharmed tubing under the air valve so that a new section is compressed.
3. Check the pump tubes and replace them if they are worn or dirty.
200 hour maintenance (or earlier if pump tube life is shorter for certain methods) 1. Change the pump tubes (Acidflex tubes about every 50-100 hours, see also section
3.3.1, SOM). Note that new pump tubes must run for approx. 1 hour before stable readings are obtained.
2. When the tubes have been removed, take out the pump side rails and clean them with a tissue moistened with isopropanol or ethanol (see also section 3.5.2, SOM).
3. Clean the 8 pump rollers (not the chains) and the bottom of the pump platen thoroughly, using a clean, lint-free cloth or paper towel moistened with isopropanol or ethanol (see also section 3.5.1, SOM).
4. Lightly lubricate the bottom of the side rails with a thin film of Semi-Fluid Lubricant (p/n 590-0161-01).
5. Lubricate the two small oil pads situated above the chain rollers by adding 2 drops of all-purpose oil (p/n 538+9000-01) to each pad.
6. Lubricate the pump roller and chain bearings: Put 1 drop of all-purpose oil (p/n 538+9000-01) into the two oil holes between the chain rollers, near the oil pads. Then put 1 drop of the same oil on each end of each pump roller and chain interface. Rotate rollers and wipe off excess oil on the pump rollers and the bottom of the pump platen (see also section 3.5.4, SOM).
7. Replace the air valve tubing (see section 3.3.2, SOM) with Pharmed tubing (p/n 117+0539-07) which has a longer life than silicone tubing.
8. When starting the next run, check reagent absorbance and sensitivity (see sections 6.3-6.4,SOM)
Yearly maintenance 1. Replace the lamp in the photometer (see section 5.4.2, SOM).
2. Check the wavelength filter in the photometer to see if it looks dark around the edge and needs to be replaced (see section 5.4.1, SOM).
3. Check the small oil pads above the chain rollers in the pump and replace if worn.
4. Check the pump platen clearance (see section 3.5.5, SOM).
5. Replace all transmission tubing, connections and nipples as necessary.

41
For more information on maintenance intervals and procedures for the complete AA3 system, refer to the AA3 SOM.
ZOOPLANKTON SAMPLE PROCESSING
The zooplankton community is the primary forage base for juvenile sockeye salmon and therefore its characteristics are important in gauging rearing conditions and evaluating results of stocking or enrichment programs (Koenings et al. 1987). Salmon fry exert predation pressure that can structure the zooplankton community; although environmental conditions also play a role in community structure (Lind 1985).
Equipment The following equipment is required: microscope with ocular micrometer, Sedgwick-Rafter counting cell (S-R Cell), Zooplankton Data Sheet (Figure 11), 1 mL or Henson-Stemple pipet, small funnel, a square section of 153 micron mesh plankton net cut from an old sampling net large enough to fit in the funnel, magnetic stirrer, and 250 mL beaker.
Chemical Handling and Disposal Formalin is a health hazard. Always avoid contact or fumes and dispose of waste in the hood. Consult MSDS for specifics.
PROCEDURE
1. Place the square section of cut plankton net onto the funnel over a formalin waste container and empty the contents of the plankton sample bottle onto the net. Rinse the plankton sample bottle several times with DI or tap water and pour onto the net to remove all plankton from the bottle. Gently wash the zooplankton as close to the bottom of the funnel as possible.
2. Invert the net over a 250 mL beaker and rinse the contents into the beaker using a known volume of DI water.
3. Dilute the contents of the beaker to ~100 to 150 organisms per mL. Do a quick count in a S-R Cell if uncertain about the organism density in the beaker. Be sure to empty the S-R Cell contents back into the beaker and rinse all the zooplankters off the S-R Cell. Add more water if needed, recording the final volume on the Zooplankton Data Sheet.
4. Slowly mix the sample with a magnetic stirrer at a setting of 6 and draw out a random 1 mL sample. Mix sample only as long as needed because over-mixing will detach eggs or egg clusters from ovigerous zooplankters. Place the sample onto a clean S-R Cell with a cover slip.
5. Using the microscope, identify, measure, and count the zooplankters present on the S-R Cell at 10x power. Record species, size of each individual, and number of zooplankters on a Zooplankton Data Sheet (Figure 11). Count at least three of the 1 mL aliquot subsamples. Dispose of the counted aliquots. Returning the counted aliquots to the beaker would require rinsing of the S-R Cell to get all the zooplankters off the S-R Cell. Rinsing the S-R Cell into the beaker changes the dilution and lead to measuring the same individuals.

42
Note: Lines on the S-R counting cells are used to facilitate systematic counting. Counts from the three aliquots should be similar. Additional counts may be necessary to achieve consistency if the aliquots contain less than 100 to 150 zooplankters or if counts vary greatly. To store a sample, replace the water with 10% neutralized formalin.
IDENTIFICATION
Common cladocerans in Alaska lakes include Bosmina, Daphnia, Holopedium, Chydorinae, and Polyphemus (Figure 12). Common copepods (Copepoda) include Cyclops, Diaptomus, Epischura, and Harpacticus (Figure 12) and some common rotifers include Kellicottia, Asplanchna, Keratella, Conochilus, and Filinia.
To follow historical data collection classifications, the KIL keys common macrozooplankton to the following taxonomic levels (most organisms identified to genus are comprised entirely of one species):
Species: The cladocerans Holopedium and Daphnia are keyed to species.
Genus: The cladocerans Bosmina, Chydorinae, and Polyphemus are keyed to genus. The copepods Epischura, Cyclops, Diaptomus, and Harpacticus are keyed to genus.
Edmonson (1959) is used as reference for zooplankton identification. Pictures of the most common cladocerans and copepods are shown in Figure 12. These two groups of zooplankton are the key genera identified. Additional useful references for invertebrate identification include Sherman and Sherman (1976), Einsle (1996), and Smith (1977). For insect identification use McCafferty (1983).
Differentiation between cladocerans and copepods is fairly easy. Cladocerans are unsegmented and round in shape, with branching antennae. Copepods are segmented and elongate without branching antennae.
Identify cladocerans to species when possible. The gelatinous mass around Holopedium indicated in Figure 12, is rarely visible. Ovigerous (ovig) cladocerans are counted and measured separately. Ovigerous cladocerans store eggs in a brood pouch within the body which are visible as darker structures. There may be cladocerans that have hatched from the brood pouch, but are not identifiable yet. These immature cladocerans are counted, but not measured. Make certain all zooplankton readers are consistent with this identification.
Differentiation among copepods can be difficult. Egg bearing (ovigerous) copepods are counted and measured separately. Ovigerous cyclopoids have one egg sack on each side of their body, towards the tail end. Ovigerous calanoids have one egg sack centrally located towards the tail end. Early life stage copepods are called nauplii. Nauplii have not matured enough to allow for differentiation between species groups (Figure 13). Nauplii are counted, but not measured.
Miscellaneous species are counted but not measured. If new species are encountered, count them and inform the project biologist.
Measurements 1. The microscopes the KIL uses have been calibrated. If a new microscope is used, calibrate
the microscope with an ocular micrometer to determine if any conversions are necessary. For calibration the ocular micrometer is placed in the microscope instead of the slide and the lines on the ocular micrometer are matched with the microscope eye piece grids or lines.

43
2. Measure the distance from the top of the head to the end of the carapace for the first 15 individuals of each copepod or cladoceran species encountered. Rotate the microscope eye piece grid for proper orientation. If an individual zooplankter is not suitable for measurement (i.e. broken, distorted, or oriented to give an inaccurate measurement) measure the next individual encountered. Remember to separately measure ovigerous individuals. Immature cladocerans and nauplii do not need to be measured. Record lengths to the nearest 0.01 mm if possible.
3. Determination of sample number for adequate body size measurement, Table 7 was used as a template to give the number of measurements in WIKI.
Zooplankton sample size determination for body size
1. Enter organism, lake, and date.
2. Enter the first 15 measurements taken.
3. After measurements are saved into the WIKI a number will appear in the top left of the page. This will give you N, which is the number of organisms that should be measured from that sample if possible.
Table 7.–Student’s t-statistic and sample sizes (n) used to determine the number (n) of zooplankter’s to be measured to achieve a confidence level (CL) of 95%.
t-statistic t-statistic t-statisticn-1 (95% CL) n-1 (95% CL) n-1 (95% CL)
1 12.70 11 2.20 21 2.082 4.30 12 2.18 22 2.073 3.18 13 2.16 23 2.074 2.78 14 2.14 24 2.065 2.57 15 2.13 25 2.066 2.45 16 2.12 26 2.067 2.36 17 2.11 27 2.058 2.31 18 2.10 28 2.059 2.26 19 2.09 29 2.05
10 2.23 20 2.09 >or= 30 1.96
Taken from Koenings et al. (1987).
4. Measure additional zooplankters if needed to reach n, given by the student’s t-test. If insufficient measurements are attained after processing the three aliquots, a fourth slide should be sampled and counted.
Calculations in WIKI
a. The mean length (L) and standard deviation (SD) of the first 15 zooplankters of a species, and determines n by substituting into the formula:
n = [(1.96 x SD) / (0.10 x L)]2

44
b. The number (N) of zooplankters to be measured by using n-1 and the t-statistic at a confidence level of 95% (Table 7) and substituting t, SD, and L into the formula:
n = [(t x SD) / (0.10 x L)]2
n = number to be measured
5. Record the length measurements on the Zooplankton Data Sheet (Figure 11).
COUNTING
1. Systematically count how many organisms of each type or category are present on the S-R Cell. The entire S-R Cell should be counted for accurate and consistent results. Enter the counts on the Zooplankton Data Sheet (Figure 11). Count a minimum of three sample aliquots.
2. Follow the proceeding instructions to complete zooplankton counts:
a. Enter sample data (lake, station, net size, and date) into the appropriate cells of the WIKI Zoo Table and save.
b. Enter the sample depth of sample, dilution volume, and species into the appropriate cells by adding rows and save after each addition.
c. Enter the count results from each aliquot into the appropriate species row by highlighting the species and clicking on WIKI Zoo Count Table.
d. Enter the size results from each aliquot into the appropriate species row by highlighting the species and clicking on WIKI Zoo Size Table and save after all sizes have been entered. Be sure to use the appropriate size (e.g. a Bosmina of 0.31 mm). The remainder is automatically calculated.
e. Total in sample column: This is the mean multiplied by the dilution factor. f. #/m2: This is the total in sample divided by the area of the plankton net opening. Make
sure the area is correct for the plankton net used for that tow (0.2 m net =0.0314; 0.5 m net = 0.1963). Zooplankter per m2= # in entire sample Net area (m2)
g. #/m3: This is the total in sample divided by the product of the depth of tow and the area of the plankton net opening. Check and verify the net area/diameter.
Zooplankter per m3= # in entire sample
Depth (m) of tow x net area (m2)
Body size and biomass
Weighted mean length: The formula uses the mean body size of a taxa combined with how numerous that taxa was on the given sample date, and gives an adjusted mean length.
Biomass: This uses the total mean length and a wet length to dry weight relationship specific to each taxa (Table 8) to determine biomass.

45
Table 8.–Wet length to dry weight relationships for calculating zooplankton biomass.
Taxa Excel spreadsheet formulas for biomassusing wet length to dry weight relationship
Copepods
Ergasilis = (mean length^2.14*0.0036*mean density)
Epischura = (mean length^2.84*0.0045*mean density)
Diaptomus = (mean length^2.82*0.0043*mean density)
Heterocope = (mean length^2.88*0.0055*mean density)
Eurytemora = (mean length^1.61*0.0058* mean density)
Cyclops = (mean length^2.14*0.0036*mean density)
Harpaticus = (mean length^2.14*0.0036*mean density)
Cladocerans
Bosmina = (mean length^2.11*0.0102*mean density)
Daphnia l. = (mean length^2.17*0.0046*mean density)
Daphnia g. = (mean length^3.31*0.0025*mean density)
Daphnia r. = (mean length^2.35*0.0036*mean density)
Holopedium g. = (mean length^2.44*0.0114*mean density)
Chydorinae = (mean length^2.11*0.0102*mean density)
Polyphemus = (mean length^1.49*0.0009*mean density)
Note: Where,^ (claret) in excel spreadsheets is used for raising a number to a power. a Data supplied by Jim Edmundson, personal communication.
ACKNOWLEDGMENTS
Thanks are extended to Heather Finkle, Steve Thomsen, and Steve Schrof for review of this manuscript and Katherine Greer for her superior publication assistance. Thanks are also extended to the following funding sources: Kodiak Regional Aquiculture Association, the Fisheries Resource Monitoring Program (project 04-412), NSEDC, AKSSF, and the ADF&G regions I, II, IV, and V, Division of Commercial Fisheries. References to trade names do not imply endorsement by the Alaska Department of Fish and Game.

46
REFERENCES CITED
ADF&G. 2002. Salmon research operational plans for the Kodiak area, 2002. Kodiak Island lake assessment/limnology project laboratory analyses operational plan. Alaska Department of Fish and Game, Commercial Fisheries Division, Regional Information Report 4K02-36, Kodiak.
Edmondson, W. T. (ed.) 1959. Freshwater biology, second edition. John Wiley and Sons, Inc. USA.
Einsle, U. 1996. Guides to the identification of the microinvertebrates of the continental waters of the world volume 1: Copepoda: Cyclopoida: genera Cyclops, Magacyclops, Acanthocyclops. SPB Academic Pub., Amsterdam, Netherlands.
Honnold, S. G., and S. Schrof. 2004. Stock assessment and restoration of the Afognak Lake sockeye salmon run. Fisheries Resource Monitoring Program. U.S. Fish and Wildlife Service, Office of Subsistence Management, Fishery Information, Services Division, Final Project Report No. FIS 03-047, Anchorage.
Koenings, J. P., J. A. Edmundson, G. B. Kyle, and J. M. Edmundson. 1987. Limnology field and laboratory manual: methods for assessing aquatic production. Alaska Department of Fish and Game, FRED Division Report Series 71, Juneau.
Lind, O. T. 1985. Handbook of common methods in limnology. Kendall/Hunt publishing company. USA.
McCafferty, W. P. 1983. Aquatic entomology; the fishermen’s and ecologists illustrated guide to insects and their relatives. Jones and Bartlett publishers, Inc. USA.
National standards for water proficiency testing studies criteria document. December 1998. EPA. USA.
Ruhl, D. C. 2013. Westward Region lake sampling and Kodiak Island Limnology Laboratory processing schedule, 2013. [In] Salmon and herring research operational plans for the Kodiak Area, 2013. Alaska Department of Fish and Game, Regional Information Report 4K13-04, Kodiak.
Schrof, S. T., S.G. Honnold, C.J. Hicks and J.A. Wadle. 2000. A summary of salmon enhancement, rehabilitation, evaluation, and monitoring efforts conducted in the Kodiak management area through 1998. Alaska Department of Fish and Game, Division of Commercial Fisheries, Regional Information Report 4K00-57, Kodiak.
Sherman, I. W. and V. G. Sherman. 1976. The invertebrates: function and form a laboratory guide, second edition. Macmillan Publishing Co., Inc. USA.
Smith, D. L. 1977. A guide to marine coastal plankton and marine invertebrate larvae. Kendall/Hunt publishing company. USA.
Spectronic Genesys spectrophotometer manual. 1996. Spectronic Instruments, Inc. Rochester, New York.
Standard methods for the examination of water and wastewater, 20th Edition. 1998. American Water Works Association, Washington D.C.
Thomsen, S. E. 2008. Kodiak Island lake assessment/limnology project and laboratory analyses operational plan. Alaska Department of Fish and Game, Commercial Fisheries Division, Regional Information Report 4K08-4, Kodiak.
Thomsen, S. E. and R. Baer. 2011. Afognak Lake sockeye salmon smolt/adult project operational plan, 2011. [In] Salmon research operational plans for the Kodiak Area, 2011. Alaska Department of Fish and Game, Regional Information Report 4K11-06, Kodiak.
Thomsen, S. E., M. L. Moore, D. C. Ruhl, M. Loewen, J. Estrada, and M. Witteveen. 2013. Salmon and herring research operational plans for the Kodiak Area, 2013. Alaska Department of Fish and Game, Regional Information Report 4K13-04, Kodiak.
Wetzel, R. G. and G. E. Likens. 1991. Limnological analyses, second edition. Springer-Verlag New York Inc. New York.

47
FIGURES

48
Detailed Lake Survey Field Form - Division of Commercial Fisheries, Limnology Section
Lake Station Bottom depth (m)
Weather and lake surface conditions
Date Name (s) of sampling personnel Time
Physical Parameters Water samples:
Dissolved Solar Illuminance Samples were / were not collected (circle one)Depth Temperature Oxygen Depth (PAR - micromoles)
(m) (oC) (mg/l) (m) Sensor Up Depths of samples collected: Incidence IncidenceSurface Surface 1m 29m
0.5 0.5 5m 30m1.0 1.0 10m 35m1.5 1.5 15m 40m2.0 2.0 20m 45m 2.5 2.5 25m 50m3.0 3.03.5 3.54.0 4.0 Zooplankton:
4.5 4.55.0 5.0 Zooplankton tow depth: (m)6.0 6.07.0 7.08.0 8.09.0 9.0 Secchi disk:
10.0 10.011.0 11.0 Disappeared: (m)12.0 12.013.0 13.0 Reappeared: (m)14.0 14.015.0 15.0 Mean disk reading: (m)16.0 16.017.0 17.018.0 18.0 Comments:19.0 19.020.0 20.021.0 21.022.0 22.023.0 23.024.0 24.025.0 25.030.0 26.0 pH / Alkalinity35.0 27.040.0 28.045.0 29.050.0 30.0
Hand Held Temp. Water: Air:DO Meter:Light Meter:
Figure 1.–Detailed lake survey form.

49
Figure 2.–Reagent Mixing Log

50
Figure 3.–Chemical Disposal Log

51
Figure 4.–Total ammonia reagent age versus nutrient concentration values.
Figure 5.–A linear equation for total ammonia (TA) calculations.

52
Figure 6.–Experiment glassware order sheet.

53
Figure 7.–Limnology Lab Data Sheet

54
Standards Sheet
Type
Date Reagent Age
Standard
(mL)
Concentration
(ug/L) Absorbance Absorbance Absorbance Absorbance
Mean
Absorbance
0.00
0.05
0.10
0.20
0.30
0.50
1.00
1.50
2.00
2.50
3.00
4.00
5.00
7.50
10.00
15.00
20.00
Comments
Figure 8.–Standards Sheet

55
Figure 9.–Cadmium column used to reduce nitrate to nitrite in the manual analysis of nitrate + nitrite.

56
Figure 10.–SEAL Analytical AutoAnalyzer 3 (AA3) components.

57
Zooplankton data sheet
Lake: Sample date: Count#:
Station: Depth:
This sample was diluted in _______ ml water.
Organism Tally Total
Name: Name: Name: Name:
# size # size # size # size
1 1 1 1
2 2 2 2
3 3 3 3
4 4 4 4
5 5 5 5
6 6 6 6
7 7 7 7
8 8 8 8
9 9 9 9
10 10 10 10
11 11 11 11
12 12 12 12
13 13 13 13
14 14 14 14
15 15 15 15
16 16 16 16
17 17 17 17 Figure 11.–Zooplankton Data Sheet

58
Cylcops Ovigerous Cyclops Epischura
Diaptomus Ovigerous Daphnia L.
Ovigerous Bosmina Holopedium
Figure 12.–Common cladocerans and copepods.

59
(Wetzel and Likens 1991).
Figure 13.–Copepod life history stages.

60

61
APPENDIX A. SAMPLE PROCESSING PROCEDURES

62
Appendix A1.–Field sampling equipment list.
Equipment Task
4 L Van Dorn sampler Water samplingReel with 55 m of 1/4" Samson line marked in meters "Messenger (stainless steel) "Carboys "1 - 8 L carboy for each station and depth "
Plankton net with 200 mL dolphin bucket Zooplankton sampling20-cm x 153 um mesh tow net "Reel with 55 m of 1/4" poly line marked in meters "Cannonball weight to test for bottom "125 mL nalgene bottle (1 per station) "12.5 mL concentrated buffered formalin per bottle "
ProODO meter Temp./Dissolved Oxygen measurements50 m cable marked in meters "2 spare C batteries "
Li-Cor 250A Light meter Light Attenuation measurementsUnderwater Quantum sensor "50 m cable marked in meters "Spare 9V battery "
YSI 60 pH meter pH measurementsCable marked at 1 meter "4 spare AA batteries "
Secchi disk Water clarity measurements
Clip board Data entryRite 'n Rain DLS forms "
Sampling tool box w/hand held thermometer, General samplingDI water squirt bottle, knife, electrical tape, pencils "
Sandbags (3 per station), lake maps, hand held GPS, Station set up onlyrope, steel 2 ft. rod, ample 1/4" poly line, buoy, "and 100 m depth finder "

63 63
Appendix A2.–Kodiak Island Laboratory sample processing and contractor contact list for 2013.
Contact Processing/Analysis Institution Address Phone Number Uttam Saha Total Kjeldahl Nitrogen (TKN) University of Georgia, Feed & Environmental Water Lab 2300 College Station Rd. Athens, GA 30602
(605) 688-5466
Jake Mosely Total Kjeldahl Nitrogen (TKN) University of Georgia, Feed & Environmental Water Lab 2300 College Station Rd. Athens, GA 30602 (605) 688-5466
John Beaver Phytoplankton BSA Environmental Services Inc. 23400 Mercantile Rd., Suite 8 Beachwood, OH 44122 (216) 765-0582 Michael Agbeti Phytoplankton Bio-Limno Research and Consulting, Inc. 28 Stone Gate Dr. Halifax, Nova Scotia B3N 3J2 Canada (902) 425-8989 Kerry Parish Quality Control Testing Department of Fisheries & Oceans 4222 Columbia Valley Hwy Cultus Lake, B.C. V2R 5B6 (604) 824-4704 Kevin Keith Nome Water/Zooplankton Cont. Norton Sound Economic Development Corporation P.O. Box 358 Nome, AK 99762 (907) 443-2477 Charlie Lean Nome Water/Zooplankton Cont. Norton Sound Economic Development Corporation P.O. Box 358 Nome, AK 99762 (907) 443-2477 Andrew Piston SE Water/Zooplankton Contract Alaska Dept. of Fish & Game 2030 Sea Level Dr. #205 Ketchikan, AK 99901 (907) 225-9677 Malika Brunette SE Water/Zooplankton Contract Alaska Dept. of Fish & Game 2030 Sea Level Dr. #205 Ketchikan, AK 99901 (907) 225-9677 Steve Heinl SE Zooplankton Contract Alaska Dept. of Fish & Game 2030 Sea Level Dr. #205 Ketchikan, AK 99901 (907) 225-9677 Randall Bachman SE Zooplankton Contract Alaska Dept. of Fish & Game P.O. Box 330 Haines, AK 99827 (907) 766-2830 Tommy Sheridan SE Zooplankton Contract Alaska Dept. of Fish & Game 401 Railroad Ave. Cordova, AK 99574 (907) 424-3212 Amanda Wiese SE Zooplankton Contract Alaska Dept. of Fish & Game 401 Railroad Ave. Cordova, AK 99574 (907) 424-3212

64 64
Appendix A3.–Sample collection protocol and procedures for lake water processing.
EPILIMNETIC AND HYPOLIMNETIC ZONES
UNFILTERED (field) LAKE WATER UNFILTERED (lab)
Dissolved Oxygen
Temperature Filter at 15 psi
Light Attenuation pH
Alkalinity
PARTICULATES FILTRATE (500ml, refrigerated)
Particulate Total Ammonia
Chl a, N, P Nitrate + Nitrite Total Phosphorous
(filter one liter each Filterable Reactive P Total Kjeldahl Nitrogen
and store frozen) Total Filterable P Silicon
(450 ml, frozen) (450ml, frozen)

65
Appendix A4.–Sample water filtering equipment list.
Equipment Quantity / Size Task
Polypropylene bottlesper sample carboy: (2) 500 mL 1 for unfiltered refrigerate
1 for filtrate frozen(2) 250 mL Unfiltered frozen(1) Amber 200 mL Phytoplankton(1) 125 mL Zooplankton
Whatman GF/F filters/petri slidesper sample carboy: (2) 4.25-cm 1 for Chlorophyll a
1 for particulate (C, N, or P)
Graduated cylinders (6) 1 L Sample measurement
Filtering apparatus (6) filter tower(for 3 samples) (3) filtrate flask
(2) vacuum pump(2) vacuum hose(2) vacuum filter(1) waste water flask
Squirt bottle with DI water Rinsing filter apparatus
Phosphate free detergent Washing bottles, carboys, and glassware
DI water Rinsing bottles, carboys, and glassware
Sterile forceps Handling filter pads
Magnesium carbonate Chlorophyll a
Parafilm Covering filter apparatus

66
Appendix A5.–Apparatus used to process samples by vacuum filtration to obtain particulates and filtrate: A) using one filtrate flask and B) using a filtering manifold.
Figure adapted from Koenings et. al. (1987).

67
APPENDIX B. SEAL ANALYTICAL CHEMISTRY
APPLICATIONS

68
Appendix B1.–Total Ammonia nutrient test using AA3.
Ammonia in Water and Seawater Ranges: 0 - 3 to 0 - 27 mmol/L (0 - 42 to 0 - 380 mg/L as N) and 0- 25 to 0- 300 mmol/L (0-0.35 to 4.2 mg/L as N) Method No. G-171-96 Rev. 14 (Multitest MT19) Description This method uses the Berthelot reaction, in which a blue-green coloured complex is formed which is measured at 660 nm. A complexing agent is used to prevent the precipitation of calcium and magnesium hydroxides. Sodium nitroprusside is used to enhance the sensitivity. Alternative reagents are given for reaction with salicylate and phenate. Hardware 37°C heating bath (5.37 mL) Pump tubes: 6 + 2 air + sampler wash Multitest aluminium, ammonia, colour, copper, chloride, iron, manganese, nitrate, total N in persulphate digests, nitrogen (total Kjeldahl), phosphate, total phosphorus (Kjeldahl), silicate, sulphide and zinc. REGEANTS
Unless otherwise stated all chemicals should be of Analytical Reagent grade or equivalent (e.g. ACS grade, Analar, Pro Analysis). LIST OF RAW MATERIALS
safety classification
Ammonium sulfate, (NH4)2SO 4-- Brij-35, 30% solution -- Dichloroisocyanuric acid sodium salt dihydrate, C3Cl2N3NaO3.2H2O oxidizing, harmful or: Sodium hypochlorite solution, NaOCl (see Note 16) harmful Ethylenediamine tetra-acetic acid disodium, C10H14N2Na2O8.2H2O Hydrochloric acid 36-38%, HCl corrosive Sodium hydroxide, NaOH corrosive Sodium nitroprusside, Na2[Fe(CN)5NO] .2H2O toxic Sodium salicylate, C7H5NaO3 (for salycilate chemistry only) harmful Tri-Sodium citrate dihydrate, C6H5Na3O7.2H2O -- Sodium chloride, NaCl (for artificial seawater) -- Sodium hydrogen carbonate, NaHCO (for artificial seawater) --
Phenol, C6H5OH (for phenol chemistry only) toxic Low-nutrient seawater: See note 2
-continued-

69
Appendix B1.–Page 2 of 5.
REAGENT MAKEUP
Prepare reagents with distilled water or deionized water. Vacuum filter reagents through a filter with pore size 0.5 μm or less for best results. Be sure to avoid ammonia contamination: check the reagent absorbance before starting the analysis. System Wash Solution Use DI Water containing 2 mL/L Brij-35, 30% solution. Special Wash Solution Use a 1 N HCl solution ( about 83 mL /L conc. hydrochloric acid). This should be pumped through all reagent tubes once a week for 10 minutes. COMPLEXING REAGENT (see operating note 4, for salicylate and phenate chemistry) EDTA 30 g tri-Sodium citrate dihydrate 120 g Sodium nitroprusside 0.5 g DI water to 1000 mL Brij-35 3 mL Dissolve 30 g of EDTA, 120 g of tri-sodium citrate dihydrate and 0.5 g of sodium nitroprusside in about 800 mL of DI water. Dilute to 1000 mL with DI water. Add 3 mL of Brij-35. Store in an amber bottle. Prepare fresh every 2 weeks. PHENATE REAGENTS (see operating note 5)
Dichloro Isocyaunuric Acid (DCI) (only for phenate chemistry) Dichloroisocyanuric acid sodium salt dihydrate 1 g DI water to 100 mL Dissolve 1 g (see Note 13) of dichloroisocyanuric acid sodium salt dihydrate in about 80 mL of DI water. Dilute to 100 mL with DI water and mix thoroughly. Prepare fresh every day. Store in a glass bottle. See also Note 14.
Phenol (for phenate chemistry only) Phenol 50 g Sodium hydroxide 36 g DI water, to 1000 mL Dissolve 36 g of sodium hydroxide (see operating note 4) and 50 g of phenol in about 800 mL of DI water. Dilute to 1000 mL with DI water. Store in an amber bottle. Prepare fresh when the solution becomes brown.
-continued-

70
Appendix B1.–Page 3 of 5. STANDARDS (see operating note 2) Stock Standard, 100 mg/L as N Ammonium sulfate 0.4717 g DI water to 1000 mL Dissolve 0.4717 g of ammonium sulfate in about 600 mL of DI water. Dilute to 1000 mL with DI water and mix thoroughly. Prepare working standards as required. OPERATING NOTES
1. For seawater analysis use artificial seawater. For water and wastewater analysis use DI water as sampler wash solution. See also operating note 2. 2. Recommended procedures for best performance when analyzing low concentrations: Pure water may be double distilled (DD) water or deionized (DI) water. In the case of DDW, the analyst must be careful to avoid contamination with silicic acid from dissolution of glass. For accurate low-level work, all glassware used for making reagents should be rinsed with 10% hydrochloric acid followed by thorough rinsing with DI water two or more times. Store flasks “shaken dry” and capped. Regular cleaning of storage containers reduces variances in analytical results. Do not wash the glassware in a washer or with any kind of detergent.
Sample cups must be perfectly clean. For low-level work, fill sample cups with 10% hydrochloric acid and leave standing for at least 15 min. Then rinse the sample cups twice with DI water followed by two rinses with sample or standard solution.
Sample storage or transport containers may be made of any of several plastics. High density polyethylene or polypropylene bottles are very acceptable. Glass containers of any kind are not acceptable. Any glass contaminates the samples with silicic acid. Sample containers must be rinsed at least twice with sample before filling.
Skin contact must be avoided with anything which will touch the reagents and samples. Ammonia contamination of the air must be avoided (e.g. by smoking, farmyard, industrial smoke or vapour, other reagents).
The laboratory temperature should be reasonably stable, with no strong air currents around analyzer. Run the system with the manifold cover in place.
All chemicals should be of very high purity. Old and/or contaminated SDS will cause carryover, drift and noise. Final working standards are best prepared using natural artificial seawater of low nutrient content (see operating note 1 and 2).
The prepared reagents should be degassed by vacuum membrane filtration for best performance. Filter with a pore size of 0.5 μm or less should be used. The reagents, pure water and standards should be protected from atmospheric contamination.
Samples should be measured as soon as possible after sampling.
-continued-

71
Appendix B1.–Page 4 of 5. Rinse the manifold according to operating note 8. Rinse wash receptacle each day by pumping baseline reagents for 15 minutes before starting a run. Clean the wash receptacle once a month with hypochlorite solution. The volume between the air valve and the injection fitting should be minimal, using 0.015" polyethylene tubing cut as short as possible. The joints between glass parts must be perfect without gaps. A regular bubble pattern is necessary for low noise. If the bubble pattern is irregular, check that all plastic tubing is correctly wetted (bubble shape round at front and back. After replacing the pump tubes or parts of the manifold, pump 1M NaOH through all tubes for 15 minutes (also see operating note 15). 3. If running only in the lowest range, connect the colour reagent to the line for sample B and tie off the line for the colour reagent. The baseline noise, and thus the detection limit, can then be further reduced by diluting the reagents by a factor of 2 or even 5. The linearity of the used range must be checked. The high amount of EDTA in the complexing reagent is only necessary for seawater samples containing high concentrations of calcium and magnesium ions and when using the yel/yel sample pump tube. At lower calcium ( < 0.005 mol/L) and magnesium ( < 0.04 mol/L) concentrations, or when using the orn/grn sample pump tube, the EDTA concentration can be reduced to 15 g/L. 4. Final pH For optimum results the pH of the final reaction solution must lie within certain limits. Collect the solution from the flowcell waste line to check the pH. Final pH (with salicylate reagents) pH 12.8 - 13.1 Final pH (with phenate reagents) pH 11.5 - 11.9 If the final pH is too high, reduce the sodium hydroxide concentration . If the pH is too low, increase the sodium hydroxide concentration. 5. Ammonia is a common contaminant in the atmosphere and the general environment. Take extra precautions to avoid contamination of the reagents. Do not touch any surfaces which will be in contact with reagents or samples. Check the reagent absorbance each time fresh reagents are made: if it is too high, the detection limit will be increased. Rinse sample cups with sample before filling them. 6. Manifold cleaning procedure: Every day: use system wash solution (2 mL/L Brij-35, 30% solution) Once a week, or when a precipitate is visible in the coils, pump for 10 min. special wash solution (1 N HCl) through the system and the sample line, then 30 min. system wash solution 7. If dual-range operation is not needed, remove sample line B and tie off or remove the T-piece. 8. If dual-range operation is needed, pump DI water through the sample line which is not connected to the sample probe. 9. Wavelength Filter Phenol reagent 630 nm 10. If nitrate is not used on this multitest cartridge, remove the polyethylene tubing between the C3 and the A10 fitting and connect them directly using a sleeve made of 116-0536-16 tubing.
-continued-

72
Appendix B1.–Page 5 of 5. 11. Concentration of free chlorine reagent. The concentration of free chlorine in the reaction mixture is critical to correct sensitivity and linearity. As neither the source chemical nor the solution are stable, the concentration should be adjusted by experiment if the method becomes non-linear or the sensitivity is low. Baseline noise and drift will be optimized by using the lowest concentration which gives acceptable results. 12. If DIC is not readily available, sodium hypochlorite can be used as an alternative chlorine source. In most cases, diluting the stock solution 10:1 with water will produce an acceptable working reagent whose concentration should then be optimized by experiment. Reagent optimization should be repeated every few months or when a new bottle of chemical is opened. If using NaOCl, which is alkaline, check the pH after optimizing the concentration of the NaOCl. 13. Even flow and regular air/liquid distribution in the transmission tube from the debubbler after the first mixing coil to the pump is critical to correct method performance. Check for correct flow and that the tubing is wetted (the trailing edge of the bubbles must be rounded, not straight). If necessary, especially for new tubing, increase the concentration of surfactant to achieve correct wetting. 14. If the bubble pattern out of the heating bath becomes irregular, it may help to change the second air tubefrom blk/blk to orn/orn.

73
Appendix B2.–Nitrate + Nitrite nutrient test using AA3. Nitrate and Nitrite in Water and Seawater Total Nitrogen in Persulfate Digests Ranges: 0 - 2.9 to 0 – 46 mmol/L (0 - 40 to 0 - 650 mg/L as N) and 0 - 50 to 0 - 500 mmol/L (0 - 700 to 0 - 7000 mg/Las N) Method No. G-172-96 Rev. 15 (Multitest MT 19) Description This automated procedure for the determination of nitrate and nitrite uses the procedure whereby nitrate is reduced to nitrite by a copper-cadmium reductor column (1,2). The nitrite then reacts with sulfanilamide under acidic conditions to form a diazo compound. This compound then couples with N-1-naphthylethylene diamine dihydrochloride to form a purple azo dye. In most normal water and seawater samples the concentration of oxidising or reducing agents and interfering metal ions is well below the limits causing interferences. When present in sufficient concentration, metal ions may produce a positive error, i.e. divalent mercury and divalent copper may form coloured complex ions having adsorption bands in the region of the colour measurement (3). Significant amounts of sulfate, sulfide or organic material, especially oil, interfere with the performance of the copper-cadmium reductor column. Such samples should be pretreated before analysis. The method is also suitable for persulfate digested samples (see operating note 15) (4). The method is based on the nitrate determination in Standard Methods and in the DIN / ISO Standards for automatic nitrate measurements. Hardware 37°C heating bath (5.4 mL), Cd column Pump tubes: 6 + 2 air + sampler wash Multitest Aluminium, ammonia, colour, copper, chloride, iron, manganese, nitrate, total N in persulphate digests, nitrogen (total Kjeldahl), phosphate, total phosphorus (Kjeldahl), silicate, sulphide and zinc. Typical performance using aqueous standards and AA3 colorimeter: Test conditions: range: 0 - 21 mmol/L and 0 – 285 mmol/L with AA3 colorimeter (10 mm flowcell and lamp) Sample A Sample B 0 - 21 mmol/L 0 - 285 mmol/L Pump tube yel/yel orn/grn Sampling rate 60/hr 60/hr Sample: wash ratio 4:1 4:1 Sensitivity: Extinction at 21 - 0.44-0.48 mmol/L 285 - 0.53-0.57 mmol/L Reagent Absorbance 0.01-0.03 0.01-0.03
-continued-

74
Appendix B2.–Page 2 of 8. Coefficient of Variation (10 replicates at 50 %) 0.21 % Pooled Standard Deviation (25 randomized at 5 levels) 0.022 mmol/L Correlation Coefficient (5 points, linear) 0.999 Detection Limit (determined according to EPA procedure pt. 136, app. B) 0.015 mmol/L Detection Limit in lowest range 0.010 μMol/L (lowest range 0- 2.9 mmol/L) REAGENTS Unless otherwise specified all chemicals should be of analytical grade or equivalent. LIST OF RAW MATERIALS safety classification
Ammonium chloride, NH4Cl Ammonia solution, 25% NH3 harmful Brij-35, 30% solution -- Cadmium, coarse powder; particle size 0.3-0.8 mm toxic Hydrochloric acid, conc., HCl corrosive N-1-Naphthylethylenediamine dihydrochloride, C12H14N2.2 HCl Phosphoric acid, conc., H3PO4 corrosive Potassium nitrate, KNO3 oxidizing Sodium chloride, NaCl Sodium hydrogen carbonate, NaHCO3 Sodium nitrite, NaNO2 toxic Sulfanilamide, C6H8N2O2S REAGENT MAKE-UP DI Water refers to high quality distilled or deionized reagent water, Type I or Type II as defined in ASTM Standards. SYSTEM WASH SOLUTION Brij-35, 30% solution 6 mL DI water to 1000 mL Add 6 mL of Brij-35 to 1000 mL of DI water. AMMONIUM CHLORIDE REAGENT Ammonium chloride 10 g Ammonia solution, 25% pH adjustment DI water, to 1000 mL Brij-35, 30% solution 1 Ml Dissolve 10 g of ammonium chloride in about 900 mL of DI water and adjust the pH to 8.5 + 0.1 with ammonia solution (25%). Dilute to 1000 mL with DI water. Add 1 mL of Brij-35 per liter and mix thoroughly. Replace weekly. See operating note 10.
-continued-

75
Appendix B2.–Page 3 of 8. COLOUR REAGENT Sulfanilamide 10 g Phosphoric acid, conc. 100 mL N-1-Naphthylethylenediamine dihydrochloride 0.5 g DI water to 1000 mL To approximately 700 mL of DI water add 100 mL concentrated phosphoric acid and 10 g of sulfanilamide. Dissolve completely. Heat if necessary. Add 0.5 g of N-1-naphthylethylenediamine dihydrochloride and dissolve. Dilute to 1000 mL with DI water and mix thoroughly. The reagent should be colorless: if it is pink the phosphoric acid is probably impure. Store in a cold, dark place. Stability: one month. STOCK COPPER SULPHATE SOLUTION, 2% (Used to prepare cadmium column) Copper sulphate 2 g DI Water to 100 mL Dissolve 2 g of copper sulphate in about 60 mL of DI water. Dilute to 100 mL with DI water and mix thoroughly. Stability indefinitely. 6N HYDROCHLORIC ACID (for cadmium column preparation) Hydrochloric acid 495 mL DI Water to 1000 mL Cautiously, with swirling, slowly add 495 mL of hydrochloric acid to about 400 mL of DI water. Cool down to room temperature. Dilute to 1000 mL with DI water and mix thoroughly. Stability indefinitely. WATER + BRIJ-35
Brij-35, 22-30% solution 1 mL DI Water to 1000 mL Dilute 1 mL of Brij-35, 22-30% solution to 1000 mL with DI water and mix thoroughly. Stability indefinitely. STANDARDS (See operating note 2) STOCK STANDARD NITRATE, 100 mg N/L Potassium Nitrate 0.722 g DI Water to 1000 mL Dissolve 0.722 g of potassium nitrate in DI water. Dilute to 1000 mL and mix thoroughly. Store in a dark bottle. WORKING STANDARDS NITRATE Prepare working standards as required.
-continued-

76
Appendix B2.–Page 4 of 8. STOCK STANDARD NITRITE, 100 mg N/L Sodium Nitrite 0.493 g DI Water, to 1000 mL Dissolve 0.493 g of sodium nitrite in DI water. Dilute to 1000 mL and mix thoroughly. Store in a dark bottle. WORKING STANDARDS NITRITE Prepare working standards as required. OPERATING NOTES 1. For seawater analysis use a sampler wash solution containing sodium chloride and sodium hydrogen carbonate if the method will be run at 60 samples per hour. For water and wastewater analysis use only DI water. It is possible to use DI sampler wash solution for seawater analysis, but the sampling rate will need to be reduced because there will be a disturbance at the beginning and end of each peak. The peak window on the AACE Software is then programmed to ignore the disturbance. 2. For the most accurate results, the standard diluent should have the same matrix as the samples. Therefore, use artificial seawater or low-nutrient seawater for seawater analysis. To avoid errors from silicate content in the inorganic salts used for artificial seawater, we recommend using a zero calibration standard of low-nutrient seawater of known low concentration. 3. Recommended procedures for best performance when analyzing low concentrations: Pure water may be double distilled (DD) water or deionized (DI) water. In the case of DDW, the analyst must be careful to avoid contamination with silicic acid from dissolution of glass.
For accurate low-level work, all glassware used for making reagents should be rinsed with 10% hydrochloric acid followed by thorough rinsing with DI water two or more times. Store flasks “shaken dry” and capped. Regular cleaning of storage containers reduces variances in analytical results. Do not wash the glassware in a washer or with any kind of detergent.
Sample cups must be perfectly clean. For low-level work, fill sample cups with 10% hydrochloric acid and leave standing for at least 15 min. Then rinse the sample cups twice with DI water followed by two rinses with sample or standard solution.
Sample storage or transport containers may be made of any of several plastics. High density polyethylene or polypropylene bottles are very acceptable. Glass containers of any kind are not acceptable. Any glass contaminates the samples with silicic acid. Sample containers must be rinsed at least twice with sample before filling.
Skin contact must be avoided with anything which will touch the reagents and samples. Ammonia contamination of the air must be avoided (e.g. by smoking, farmyard, industrial smoke or vapour, other reagents).
The laboratory temperature should be reasonably stable, with no strong air currents around analyzer. Run the system with the manifold cover in place.
-continued-

77
Appendix B2.–Page 5 of 8. All chemicals should be of very high purity. Old and/or contaminated SDS will cause carryover, drift and noise. Final working standards are best prepared using natural artificial seawater of low nutrient content (see operating note 1 and 2).
The prepared reagents should be degassed by vacuum membrane filtration for best performance. Filter with a pore size of 0.5 μm or less should be used. The reagents, pure water and standards should be protected from atmospheric contamination.
Samples should be measured as soon as possible after sampling.
Rinse the manifold according to operating note 13. Rinse wash receptacle each day by pumping baseline reagents for 15 minutes before starting a run. Clean the wash receptacle once a month with hypochlorite solution.
The volume between the air valve and the injection fitting should be minimal, using 0.015" polyethylene tubing cut as short as possible. The joints between glass parts must be perfect without gaps.
If running only in the lowest range the baseline noise can be reduced by diluting the reagents by a factor of 2 or even 5. The linearity of the used range must be checked.
A regular bubble pattern is necessary for low noise. If the bubble pattern is irregular, check that all plastic tubing is correctly wetted (bubble shape round at front and back. After replacing the pump tubes or parts of the manifold, pump 1M NaOH through all tubes for 15 minutes. (see also operating note 15). 4. The nitrite concentration can be determined by eliminating the reductor column and standardizing with an appropriate nitrite solution. In order to determine the nitrate values, the nitrite alone must be subtracted from the total (nitrate and nitrite). Check the efficiency of the reductor column regularly by analysing equi-molar nitrate and nitrite standards. The reduction efficiency should be > 95%. See also operating note 5(k). 5. Reductor Column
a. Cadmium of a granulation of 0.3 to 0.8 mm should be used. See operating note 4(i). Danger: cadmium is toxic. Avoid skin contact or breathing the dust.
b. New or used cadmium particles are cleaned with 50 mL of 6N HCl for one minute. Decant the HCl and wash the cadmium with another 50 mL of 6N HCl for one minute. About 10 g of cadmium is needed for 1 column; however, for convenience a larger quantity can be prepared at once, either up to the end of step (g) or as complete packed columns filled with ammonium chloride solution and sealed.
c. Decant the HCl and wash the cadmium several times with distilled water. d. Decant the distilled water and add 50 mL of 2% copper sulfate pentahydrate per 20 g
cadmium. Wash the cadmium until no blue colour remains in solution. If using less cadmium, use proportionately less copper sulfate.
-continued-

78
Appendix B2.–Page 6 of 8. e. Rinse the cadmium several times with distilled water then decant.
f. Add another 50 mL (or suitable volume) of 2% copper sulfate pentahydrate and wash until
no blue colour remains in solution
g. Decant and wash thoroughly with DI water until the washings contain no more black colloidal copper. The cadmium granules should look silvery. If the cadmium is not washed completely, small particles of copper will escape and produce noise. IMPORTANT: from this point on, do not allow the cadmium to come into contact with air. Always keep it covered with water or NH4Cl reagent.
h. Close one end of the reductor column with glass wool. Fill the reductor column with ammonium chloride reagent and transfer the prepared cadmium particles to the column using a syringe. Be careful not to allow any air bubbles to be trapped in the column. Close the filling side with glass wool.
i. As an alternative to the glass Reductor Tube, if using Cd larger than 0.8 mm, use 12 - 18 cm of Tygon tubing 116-0536-18 (see operating note 5k). Fill the Tygon tubing with ammonium chloride reagent and transfer the prepared cadmium particles to the column using a Pasteur pipette or a small funnel or syringe. Be careful not to allow any air bubbles to be trapped in the column.
j. Prior to sample analysis, condition the column by pumping through the sample line a 100 mg/L (nitrate) standard for five minutes followed by 100 mg /L (nitrite) for ten minutes. When the 100 mg/L standard is washed out completely, pump the top standard through the column and continue until the response is stable (it could take about 30 minutes). This procedure stabilizes the performance of the column.
k. The required column dimensions can be adjusted by using different tubing, depending on
the cadmium grain size and porosity. The lowest dispersion is obtained when the column diameter is twice the size of the largest granule. The length may be adjusted to ensure complete reduction and an acceptable time between regeneration. Excessive length or dead volume will cause higher carryover.
l. When the reduction efficiency falls to an unacceptable level, empty the column and repack it with regenerated cadmium. Old cadmium can be kept and re-used. If cadmium is discarded, be sure to comply with local regulations for disposal of toxic metals.
6. Start-up procedure:
a. Check the level of all reagents to ensure an adequate supply. b. Place all lines in their containers and start the pump. c. When the ammonium chloride reagent has reached the end of the C3 fitting, connect the
reductor column by using the 4-way valve, being careful not to get any air bubbles into the column.
-continued-

79
Appendix B2.–Page 7 of 8. d. Allow the system to equilibrate.
7. Shut-down procedure:
a. Stop the pump and disconnect the reductor column by using the 4-way valve.
b . Start the pump, remove all reagent lines and place them in distilled water containing 1 mL/L
Brij-35.
c. After ten minutes stop the pump and remove the platen.
8. Reagent Background Colour
a. Pump distilled water containing 1 mL/L of Brij-35 through the system. NOTE: The cadmium column should not be connected at this time.
b. Follow the start-up procedure described in operating note 6. c. The reading of the reagents compared to distilled water should not be more than 0.04
absorbance (4%). If the absorbance is greater than six units, one or more of the reagents or the water used to make up the reagents is probably contaminated.
9. To extend the life of the column between regeneration use nitrogen instead of air for the segmenting bubbles. 10. Brij-35 Old or oxidised Brij-35 can cause poor peak shape and low recovery. Do not use ready-prepared 30% solution after the expiry date, and keep the bottle closed. 11. Additional performance data: Sample A - Sample B Lag time 6 min. - 7 min. Carryover 0.3% ---
a. If dual-range is not needed, remove sample line B and tie off or remove the T-piece.
b. Pump DI water through the sample line which is not connected to the sample probe.
c. Manifold cleaning procedure: Every day use system wash solution. Once a month, wash the
manifold, including the sample line, with diluted hypochlorite solution containing a little Brij, after disconnecting the Cd column. Then rinse completely with system wash solution.
-continued-
80
Appendix B2.–Page 8 of 8. d. For total N, prepare a digestion reagent according to the procedure of K. Grasshoff et. al. (Method
of Seawater Analysis, 2nd Edition, Verlag Chemie, 1983) as follows: 15g H3 BO3 , 25g K2S2O8, 7.5g NaOH diluted to 500 mL with water. Prepare the digestion reagent fresh weekly. To digest samples, add 5 mL reagent to 50 mL sample in a suitable PTFE pressure bottle. Heat at 115ºC for 2 hours. The pH of the digested samples should be about 8.
12. Even flow and regular air/liquid distribution in the transmission tube from the debubbler after the first mixing coil to the pump is critical to correct method performance. Check for correct flow and that the tubing is wetted (the trailing edge of the bubbles must be rounded, not straight). If necessary, especially for new tubing, increase the concentration of surfactant to achieve correct wetting. See also (17). 13. If the bubble pattern out of the heating bath becomes irregular the size of the second air injection pump tube may be increased from blk/blk to orn/orn.

81
Appendix B3.–Total Phosphate nutrient test using AA3.
Phosphate in Water Range: 0 – 50 to 0 - 500 mg/L as P Method-No. G-297-03 Rev. 3 (Multitest MT 19) Description Following the method of Murphy and Riley, this automated procedure for the determination of orthophosphate is based on the colorimetric method in which a blue color is formed by the reaction of orthophosphate, molybdate ion and antimony ion followed by reduction with ascorbic acid at an pH<1. The reduced blue phospho-molybdenum complex is colorimetrically read at 880 nm. Hardware 37°C heating bath (5.37 mL) Pump tubes: 6 + 2 air + sampler wash Multitest aluminium, ammonia, colour, copper, chloride, iron, manganese, nitrate, total N in persulphate digests, nitrogen (total Kjeldahl), phosphate, total phosphorus (Kjeldahl), silicate, sulphide and zinc. Performance data using aqueous standards and AA3 colorimeter: Test conditions: range: 0 - 50 mg/L as P and AA3 colorimeter with 10 mm flowcell Sampling rate 60/h Sample : wash ratio 3:1 Sensitivity: Extinction at 50 mg/L 0.016-0.020 Reagent absorbance 0.009-0.011 Coefficient of variation 0.4 % (10 replicates at 50%) Pooled standard deviation 0.18 mg/L (25 randomized at 5 levels) Correlation Coefficient 0.999 (linear, 5 points) Detection limit (determined according 0.29 μg/L to EPA procedure pt. 136, app. B) REAGENTS Unless otherwise stated all chemicals should be of Analytical Reagent grade or equivalent. LIST OF RAW MATERIALS safety classification
Acetone, C3H6O flammable Ammonium molybdate, (NH4)6Mo7O24.4H2O harmful Antimony potassium tartrate, K(SbO)C4H4O6.1/2H2O toxic Ascorbic acid, C6H8O6 -- Potassium dihydrogen phosphate, KH2PO4 -- Sodium dodecyl sulfate, SDS (ultra-pure grade required) harmful Sulfuric acid, H2SO4 corrosive
-continued-

82
Appendix B3.–Page 2 of 4. REAGENT MAKE UP Prepare reagents with double distilled water or deionized water. Vacuum filter reagents through filter with pore size 0.5 μm or less for best results. SYSTEM WASH SOLUTION Use DI Water containing 8 g/L SDS. SPECIAL WASH SOLUTION Use sodium hypochlorite solution diluted 1:5 with DI water. STOCK ANTIMONY POTASSIUM TARTRATE Antimony potassium tartrate 2.3 g DI water to 100 mL Dissolve 2.3 g of antimony potassium tartrate in about 80 mL of DI water. Dilute to 100 mL with DI water and mix thoroughly. Store in a refrigerator. The solution is stable for a month. AMMONIUM MOLYBDATE REAGENT Ammonium molybdate 3 g Sulfuric acid, conc. 32 mL Stock antimony potassium tartrate 11 mL DI water to 1000 mL Add carefully 32 mL of conc. sulfuric acid to about 500 mL of DI water and cool. Dissolve 3 g of ammonium molybdate and add 11 mL of stock antimony potassium tartrate. Dilute to 1000 mL with DI water and mix thoroughly. Store in a PE bottle. The solution is stable for a month. The solution must be colourless. The ammonium molybdate must be perfectly white, with no green tint. ASCORBIC ACID Ascorbic acid 2 g Acetone 10 mL Sodium dodecyl sulphate (SDS) 1.8 g DI water to 1000 mL Dissolve 2 g of ascorbic acid in about 600 mL of DI water. Add 10 mL of acetone and 1.8 g of sodium dodecyl sulphate. Dilute to 1000 mL with DI water and mix thoroughly. Store in a PE bottle in the refrigerator. The solution is stable for 1 week. Ultra-pure SDS is critical to good method performance. WATER + SDS Sodium dodecyl sulphate (SDS) 10 g DI water to 1000 mL Dissolve 10 g of sodium dodecyl sulphate in about 800 mL of DI water. Dilute to 1000 mL with DI water and mix thoroughly. Ultra-pure SDS is critical to good method performance.
-continued-

83
Appendix B3.–Page 3 of 4. STANDARDS STOCK STANDARD, 100 mg/L Potassium dihydrogen phosphate 0.4393 g DI water to 1000 mL Dry 1.5 g of potassium dihydrogen phosphate at 105 °C for 2 hours. Dissolve 0.4393 g of potassium dihydrogen phosphate in about 600 mL of DI water. Dilute to 1000 mL with DI water and mix thoroughly. Store in a plastic bottle. WORKING STANDARDS Prepare working standards as required. OPERATING NOTES 1. For low range work (0-50 mg/L as P), two pump tubes may be exchanged to achieve better sensitivity (0.025): - Sample : replace yel/yel (1.20) blu/blu (1.60) - Water 1: replace orn/orn (0.42) orn/grn (0.10) If the tubes are changed, the manifold is no longer suitable for ammonia or nitrate, which needs a higher reagent : sample ratio. 2. Recommended procedures for best performance when analyzing low concentrations:
Pure water may be double distilled (DD) water or deionized (DI) water. In the case of DDW, the analyst must be careful to avoid contamination with silicic acid from dissolution of glass.
For accurate low-level work, all glassware used for making reagents should be rinsed with 10% hydrochloric acid followed by thorough rinsing with DI water two or more times. Store flasks “shaken dry” and capped. Regular cleaning of storage containers reduces variances in analytical results. Do not wash the glassware in a washer or with any kind of detergent.
It is recommended to store all reagents and calibrants in PE bottles. Don't use any detergents for cleaning.
Sample cups must be perfectly clean. For low-level work, fill sample cups with 10% hydrochloric acid and leave standing for at least 15 min. Then rinse the sample cups twice with DI water followed by two rinses with sample or standard solution.
Sample storage or transport containers may be made of any of several plastics. High density polyethylene or polypropylene bottles are very acceptable. Glass containers of any kind are not acceptable. Any glass contaminates the samples with silicic acid. Sample containers must be rinsed at least twice with sample before filling.
Skin contact must be avoided with anything which will touch the reagents and samples. Ammonia contamination of the air must be avoided (e.g. by smoking, farmyard, industrial smoke or vapour, other reagents).
-continued-
84
Appendix B3.–Page 4 of 4.
The laboratory temperature should be reasonably stable, with no strong air currents around analyzer. Run the system with the manifold cover in place.
All chemicals should be of very high purity. Old and/or contaminated SDS will cause decrease of sensitivity, carryover, drift and noise. The prepared reagents should be degassed by vacuum membrane filtration for best performance. Filter with a pore size of 0.5 μm or less should be used. The reagents, pure water and standards should be protected from atmospheric contamination.
Samples should be measured as soon as possible after sampling.
Rinse the manifold according to operating note 3. Rinse wash receptacle each day by pumping baseline reagents for 15 minutes before starting a run. Clean the wash receptacle once a month with hypochlorite solution.
The volume between the air valve and the injection fitting should be minimal, using 0.015" polyethylene tubing cut as short as possible. The joints between glass parts must be perfect without gaps.
A regular bubble pattern is necessary for low noise. If the bubble pattern is irregular, check that all plastic tubing is correctly wetted (bubble shape round at front and back. After replacing the pump tubes or parts of the manifold, pump 1M NaOH through all tubes for 15 minutes.
Wait for a stable baseline. This may take some time. 3. Manifold cleaning procedure. Every day pump system wash solution (8 g/L SDS) through all reagent lines. Once a month pump for 20 min. special wash solution (hypochlorite) through the system and the sample line, then 30 min. system wash solution. 4. If the ortho-phosphate chemistry is to be used following a chemistry that uses Brij-35 as wetting agent (e.g. nitrite), wash thoroughly with 1 N H2SO4 for 10 minutes before pumping wash solution for 15 minutes and then connecting the reagents. 5. Additional performance data. Lag time 8 min. Carryover 0.5 %

85
Appendix B4.–Total Kjeldahl Nitrogen nutrient test using AA3.
Total Kjeldahl Nitrogen in Water and Seawater
(Kjeldahl Digests) Range : 0-50 μMol/L (see operating note 12) 0-160 μMol/L to 0-1200 μMol/L Method No. G-225-99 Rev. 7 (Multitest MT19) Description The determination of nitrogen is based on a colorimetric method in which an emerald-green compound is formed by the reaction of ammonia, salicylate, sodium nitroprusside and sodium hypochlorite in a buffered alkaline medium at a pH of 12.8 - 13.0. The ammonia-salicylate complex is measured at 660 nm. Hardware 37°C heating bath Pump tubes: 6 + 2 air + 1 sampler wash Multitest aluminium, ammonia, colour, copper, chloride, iron, manganese, nitrate, total N in persulphate digests, nitrogen (total Kjeldahl), phosphate, total phosphorus (Kjeldahl), silicate, sulphide and zinc. Typical performance data using non-digested standards containing 4% v/v H2SO4 and AA3 colorimeter Test conditions: range: 0 - 400 μMol/L. AA3 colorimeter with 10 mm flowcell. Sampling rate 50/hour Sample : Wash ratio 3:1 Sensitivity: Extinction at 400 μMol/L 0.20 - 0 28 Reagent absorbance < 0.04 Coefficient of variation (30 replicates at 50%) 0.8% Pooled standard deviation (50 randomized at 5 levels) 2 μMol/L Correlation coefficient (5 points, linear fit) 1.000 Detection limit (determined according to EPA procedure pt. 136, app.) 0.3 μMol/L REAGENTS Unless otherwise stated all chemicals should be of Analytical Reagent grade or equivalent. LIST OF RAW MATERIALS safety classification
Ammonium sulphate, (NH4)2SO4 -- Dichloroisocyanuric acid sodium salt dihydrate, C3Cl2N3NaO3.2H2O oxidizing, harmful Ethylenediamine tetra-acetic acid disodium salt dihydrate, C10H14N2Na2O8.2H2O -- Hydrochloric acid, 36-38%, HCl corrosive Isopropanol, C3H7OH highly flammable Potassium Sulfate, K2SO4 --
-continued-

86
Appendix B4.–Page 2 of 5. Sodium chloride, NaCl -- Sodium hydroxide, NaOH corrosive Sodium hydrogen carbonate, NaHCO3 -- Sodium hydrogen phosphate-12-hydrate, Na2HPO4.12H2O – Sodium hypochlorite, NaOCl corrosive Sodium nitroprusside, Na2[Fe(CN)5NO].2H2O toxic Sodium salicylate, C7H5NaO3 harmful Sulfuric Acid, concentrated, H2SO4 -- Tri-sodium citrate dihydrate, C6H5Na3O7.2H2O -- Sulfuric acid, 96-98%, H2SO4 corrosive Triton X-100 harmful REAGENT MAKE UP Prepare reagents with distilled water or deionized water. Vacuum filter reagents through a filter with pore size 0.5 μm or less for best results. SAMPLER WASH SOLUTION Sodium chloride (only for seawater) 35 g Sulfuric acid, 96-98% 40 mL DI water to 1000 mL Dissolve 35 g of sodium chloride in about 900 mL of DI water. Add 40 mL of sulfuric acid (96-98%). Dilute to one liter with DI water and mix thoroughly. (See operating note 1.) TRITON X-100, 50% SOLUTION V/V Triton X-100 50 mL Isopropanol 50 mL Combine 50 mL of Triton X-100 with 50 mL of isopropanol and mix thoroughly. BUFFER (see operating note 12) EDTA 18.41 g Sodium hydroxide : Range 0 - 160 to 0 - 1200 μMol/L 20 g,
0 - 50 μMol/L 30.5 g Sodium hydrogen phosphate-12-hydrate 40 g DI water to 1000 mL Triton X-100, 50% solution v/v 1 mL Dissolve 18.41g of EDTA and 20g (30.5g) of sodium hydroxide in about 800mL of DI water. Dissolve 40g of sodium hydrogen phosphate-12-hydrate and dilute to one liter with DI water. Add 1 mL of Triton X-100 (50% solution, v/v). Mix thoroughly. Stable for as long as the solution remains clear. (See operating note 5.)
-continued-

87
Appendix B4.–Page 3 of 5. SODIUM SALICYLATE Sodium salicylate 316 g Sodium nitroprusside 0.8 g DI water to 1000 mL Dissolve 316 g of sodium salicylate and 0.8 g of sodium nitroprusside in about 800 mL of DI water. Dilute to one liter and mix thoroughly. Store in an amber bottle. Stable for one week. DICHLOROISOCYANURATE Dichloroisocyanuric acid sodium salt dihydrate 4.5 g Triton X-100, 50% solution v/v 0.4 mL DI water to 1000 mL Dissolve 4.5 g of dichloroisocyanuric acid sodium salt dihydrate in about 800 mL of DI water. Add 0.4 mL of Triton X-100 (50% solution, v/v). Dilute to one liter with DI water and mix thoroughly. Stable for one week. (See operating note 7.) DIGESTION REAGENT Potassium Sulfate 134 g Sulfuric Acid, concentrated 134 mL Cupric Sulfate (Cooper (II) sulfate pentahydrate 11.4 g DI water dilute to 1 L Add 134 g potassium sulfate to about 700 mL deionized water in a 1 L volumetric flask. Carefully add 134 mL sulfuric acid, concentrated. Caution, the flask will become warm! Add 11.4 g cupric sulfate. Add water as needed and stir to dissolve. Cool, dilute to the mark with deionized water and invert to mix.
STANDARDS STOCK STANDARD A, 10 mMol/L Ammonium sulphate 0.660 g DI water to 1000 mL Dissolve 0.660 g of ammonium sulphate in about 600 mL of DI water. Dilute to one liter with DI water and mix thoroughly. STOCK STANDARD B, 1 mMol/L Stock standard A 10 mL DI water to 100 mL Dilute 10 mL of stock standard A in a 100 mL volumetric flask with DI water. WORKING STANDARDS Prepare working standards as required. See operating note 1 and 2.
-continued-

88
Appendix B4.–Page 4 of 5. PROCEDURES 1. Pipet 25.0 mL of sample, standard or blank in the pre-cleaned digestor tube. 2. Add 5 mL of digestion reagent and mix with a vortex mixer. 3. Add five Teflon boiling chips. Caution: An excess of Teflon chips may cause the sample to boil over. To avoid spatter and maximize digestion recovery, employ the fully-programmable SEAL Analytical BD-50 block controller to step through and achieve the three milestones of Kjeldahl digestion:
I. Program moderate temperatures, between 160C extending possibly to 220C, to boil-off water the samples in time-efficient manner, without spatter. Unless surplus water is boiled-off, the tube contents may spatter badly during the high-temperature cycle. Use the following example to program block controller:
(1) Step to [160C or 170C] (2) Hold [30 min to 40 min] (3) Ramp to [190C-200C-210C] at 2C per min. (4) Hold [30 min to 40 min]
II. Program the high temperature cycle to reach 380C. Maintain for 30 min (minimum) up to 50 min.
(5) Ramp to 380C at 5C per min (6) Hold 40 min. III. When the digestion is complete, lift the rack of digestion tubes above the block to cool. With 5-10 minutes, begin dispensing 25 mL ammonia-free water to each tube with immediate mixing using a vortex mixer. Dilute and mix each tube in progression, before the residue solidifies.
4. Excluding the salicylate line, place all reagent lines in their respective containers. 5. Flush the sampler wash receptacle with 25 mL of 4% sulfuric acid. 6. When reagents have been pumping for at least five minutes, place the salicylate line in its respective container and allow the system to equilibrate. If a precipitate forms after the addition of salicylate, the pH is too low. Immediately stop the pump and flush the coils with water using a syringe. Before restarting the system, check the concentration of the sulfuric acid solutions and/or the working buffer solutions. 7. After a stable baseline has been obtained, start the sampler and perform analysis.
OPERATING NOTES 1. For seawater analysis use sampler wash solution containing sodium chloride, sodium hydrogen carbonate and sulfuric acid. For water and wastewater analysis use only DI water with sulfuric acid. The acid concentration should be the same as in the samples. Because samples lose acid during digestion, we recommend to titrate a sample to determine the actual acidity. 2. The standard diluent must have the same matrix as the sampler wash solution. Therefore, use acidified artificial seawater for seawater analysis. Constant acidity between samples and standards is critical to correct performance. For most accurate results we recommend to digest the standards. 3. This method runs on multitest MT19 using the high range only. It cannot be run on the low range using the large sample pump tube due to insufficient acid neutralization capacity in the reagents.
-continued-

89
Appendix B4.–Page 5 of 5. 4. Low reagent absorbance is critical to the correct operation of this method. Check the reagent absorbance daily and if it is higher than specified, use purer reagents, take extra steps to guard against contamination or boil the buffer solution. 5. Check the pH of the final reaction mixture arriving at the flowcell with a digested sample pumping through the sample line. The pH should be 12.8 - 13.0. If the pH is higher than 13.0 the concentration of sodium hydrogen phosphate-12-hydrate must be increased. If the pH is lower than 12.8 the concentration of sodium hydroxide in the buffer solution must be increased. The method is designed for samples containing 4% v/v H2SO4. If samples with different acidity are measured, the buffer must be adjusted accordingly. 6. Place the salicylate reagent line in its container last and remove it first to avoid precipitation of reagent in the manifold when the acid sample wash solution is present. 7. The concentration of free chlorine is critical for optimum sensitivity and linearity. If necessary, adjust the concentration of free chlorine by varying the concentration of the dichloroisocyanuric acid sodium salt dihydrate. Finally recheck the pH. Hypochlorite solution may be used as an alternative chlorine source. However, it is unstable and the optimum concentration must be established regularly. As the solution is alkaline, pH adjustment may be required. 8. Use a Kel-F, PEEK or platinum sample probe. 9. Additional Performance Data Lag time 8 min Carryover < 0.4 % 10. Performance with AAII colorimeter and 15 mm flowcell Due to the difference in flowcell path length, some parameters will be different, as shown below. Sensitivity: Extinction at 400 μMol/L 0.32- 0.40 Reagent absorbance 0.02-0.05 11. Even flow and regular air/liquid distribution in the transmission tube from the debubbler after the first mixing coil to the pump is critical to correct method performance. Check for correct flow and that the tubing is wetted (the tailing edge of the bubbles must be rounded, not straight). If necessary, especially for new tubing, increase the concentration of surfactant to achieve correct wetting. 12. To use the range 0 - 50 μMol/L install a pump tubing blk/blk (0.32 mL/min) to aspirate the sample. The higher flow rate of the acidified sample causes a higher acidity in the flow stream and therefore the sodium hydroxide concentration of the buffer has to be increased to 30.5 g/L. Check the pH according to operating note 5.

90
Appendix B5.–Silicate nutrient test using AA3.
Hardware: 37°C heating bath (5.37 mL) Pump tubes: 6 + 2 air + 1 sampler wash Multitest: aluminium, ammonia, colour, copper, chloride, iron, manganese, nitrate, total N in persulphate digests, nitrogen (total Kjeldahl), phosphate, total phosphorus (Kjeldahl), silicate, sulphide and zinc.
Typical performance data using aqueous standards Test conditions: range: 0 - 41 mmol/L and 0 – 1000 mmol/L as SiO2, AA3 colorimeter (10 mm flowcell and lamp). Sample A Sample B 0 - 41 mmol/L 0 - 1000 mmol/L Sample tube yel/yel orn/grn Sampling rate 60/hour 60/hour Sample : wash ratio 4:1 4:1 Reagent absorbance 0.01 - 0.03 0.01 - 0.03 Sensitivity: Extinction 0.36 - 0.44 0.75 - 0.92 Coefficient of variation 0.5 % (10 replicates at 50%) Pooled standard deviation 0.051 μMol/L (25 randomized at 5 levels) Correlation coefficient 0.999 / 0.999 (5 points, linear) Detection limit (determined according 0.030 μMol/L to EPA procedure pt. 136, app. B) Detection limit (EPA pt. 136, app B) (lowest range 0 - 8 mmol/L) 0.016 μMol/L REAGENTS Unless otherwise stated all chemicals should be of Analytical Reagent grade or equivalent. LIST OF RAW MATERIALS safety classification
Ammonium molybdate, (NH4)6Mo7O24.4H2O harmful Ascorbic acid,, C6H8O6 -- Oxalic acid, H2C2O4 -- Sodium chloride, NaCl – Sodium dodecyl sulfate, SDS (sodium lauryl sulfate, SLS) harmful Sodium meta-silicate nonahydrate, Na2SiO3.9H2O -- Sulfuric acid, conc., H2SO4 corrosive Low-nutrient seawater: see operating note 2 REAGENT MAKE-UP The use of plastic lab-ware is recommended to avoid silica contamination from glass. DI water refers to high quality reagent water, Type 1 or Type II as defined in ASTM Standards SYNTHETIC SEAWATER (see operating notes 1 and 2) Sodium chloride 35 g Sodium hydrogen carbonate 0.2 g DI water to 1000 mL
-continued-

91
Appendix B5.–Page 2 of 4.
Dissolve 35 g of sodium chloride and 0.2 g of sodium hydrogen carbonate in about 800 mL of DI water. Dilute to 1000 mL with DI water and mix thoroughly. SYSTEM WASH SOLUTION Use DI water containing 2 g/L SDS. SPECIAL WASH SOLUTION Use a 5% sodium hypochlorite solution diluted 1:10 with DI water. AMMONIUM MOLYBDATE Ammonium molybdate 15 g Sulfuric acid 4.2 mL DI water to 1000 mL SDS 5 g Dissolve 15 g of ammonium molybdate in about 800 mL of DI water. Add 4.2 mL of sulfuric acid. Add 5 g of SDS and mix. Dilute to 1000 mL with DI water and mix thoroughly. The solution should be clear and free of precipitate upon standing. If a blue colour exists, discard the solution. Store in an amber polyethylene container. Stable for two weeks. OXALIC ACID Oxalic acid 95 g DI water to 1000 mL Dissolve 95 g of oxalic acid in about 800 mL of DI water, dilute to 1000 mL with DI water and mix thoroughly. Store in an amber polyethylene container. ASCORBIC ACID Ascorbic acid 50 g DI water to 1000 mL Dissolve 50 g of ascorbic acid in about 700 mL of DI water. Dilute to 1000 mL with DI water and mix thoroughly. Store in a polyethylene container. Stable for one week.
STANDARDS (see operating note 1 and 2)
STOCK STANDARD, 100 mg/L as SiO2 Sodium meta-silicate nonahydrate 0.473 g DI water to 1000 mL Dissolve 0.473 g of sodium meta-silicate nonahydrate in about 800 mL of DI water. Dilute to 1000 mL with DI water. Store this stock solution in a tightly stoppered plastic bottle. Alternatively, use a commercially available standard solution.
OPERATING NOTES
1. For seawater analysis use sampler wash solution containing sodium chloride and sodium hydrogen carbonate if the method will be run at 60 samples per hour. For water and wastewater analysis use only DI water. It is possible to use DI sampler wash solution for seawater analysis, but for AAII the sampling rate will need to be reduced because there will be a disturbance at the beginning and end of each peak. The effect of this on peak reading is eliminated with AACE software.
-continued-

92
Appendix B5.–Page 3 of 4. 2. For most accurate results, the standard diluent should have the same matrix as the samples. Therefore, use artificial seawater or low-nutrient seawater for seawater analysis. To avoid errors from silicate content in the inorganic salts used for artificial seawater, we recommend using a zero calibration standard of lownutrient seawater of known low concentration. This is obtainable from Ocean Scientific International, 3. Recommended procedures for best performance when analyzing low concentrations:
Pure water may be double distilled (DD) water or deionized (DI) water. In the case of DDW, the analyst must be careful to avoid contamination with silicic acid from dissolution of glass.
For accurate low-level work, all glassware used for making reagents should be rinsed with 10% hydrochloric acid followed by thorough rinsing with DI water two or more times. Store flasks “shaken dry” and capped. Regular cleaning of storage containers reduces variances in analytical results. Do not wash the glassware in a washer or with any kind of detergent.
Sample cups must be perfectly clean. For low-level work, fill sample cups with 10% hydrochloric acid and leave standing for at least 15 min. Then rinse the sample cups twice with DI water followed by two rinses with sample or standard solution.
Sample storage or transport containers may be made of any of several plastics. High density polyethylene or polypropylene bottles are very acceptable. Glass containers of any kind are not acceptable. Any glass contaminates the samples with silicic acid. Sample containers must be rinsed at least twice with sample before filling.
Skin contact must be avoided with anything which will touch the reagents and samples. Ammonia contamination of the air must be avoided (e.g. by smoking, farmyard, industrial smoke or vapour, other agents).
The laboratory temperature should be reasonably stable, with no strong air currents around analyzer. Run the system with the manifold cover in place.
All chemicals should be of very high purity. Old and/or contaminated SDS will cause carryover, drift and noise. Final working standards are best prepared using natural artificial seawater of low nutrient content (see operating note 1 and 2).
The prepared reagents should be degassed by vacuum membrane filtration for best performance. Filter with a pore size of 0.5 μm or less should be used. The reagents, pure water and standards should be protected from atmospheric contamination.
Samples should be measured as soon as possible after sampling.
Rinse the manifold according to operating note 6. Rinse wash receptacle each day by pumping baseline reagents for 15 minutes before starting a run. Clean the wash receptacle once a month with hypochlorite solution.
The volume between the air valve and the injection fitting should be minimal, using 0.015" polyethylene tubing cut as short as possible. The joints between glass parts must be perfect without gaps.
If running only in the lowest range the baseline noise can be reduced by diluting the reagents by a factor of 2 or even 5. The linearity of the used range must be checked.
-continued-

93
Appendix B5.–Page 4 of 4. A regular bubble pattern is necessary for low noise. If the bubble pattern is irregular, check that
all plastic tubing is correctly wetted (bubble shape round at front and back. After replacing the pump tubes or parts of the manifold, pump 1N NaOH through all tubes for 15 minutes. (see also operating notes12 and 14)
4. Additional performance data
Sample A Sample B Carryover at 60/hour 0.3% 0.3% Lag time 7 min 10 min
5. Manifold cleaning procedure: Every day use system wash solution (2 g/L SDS) Once a month pump for 20 min. special wash solution (diluted hypochlorite solution) through the system and the sample line, then 30 min. system wash solution 6. Use 0.03” polyethylene tubing for the sample transmission line if running the method alone, otherwise tubing of a suitable diameter for the total flow rate. 7. If dual-range is not needed, remove sample line B and tie off or remove the T-piece. 8. Pump DI water through the sample line which is not connected to the sample probe.
9. If nitrate is not used on this multitest cartridge, remove the tubing between the C3 and the A10 fitting and connect them directly using a sleeve made of 116-0536-16 tubing. 10. If the silicate chemistry is to be used following a chemistry that uses Brij-35 as wetting agent (e.g. the nitrate chemistry), wash thoroughly with 1 N H2SO4 solution. Brij-35 interferes with the silicate chemistry. 11. Even flow and regular air/liquid distribution in the transmission tube from the debubbler after the first mixing coil to the pump is critical to correct method performance. Check for correct flow and that the tubing is wetted (trailing edge of the bubbles must be rounded, not straight). If necessary, especially for new tubing, increase the concentration of surfactant to achieve correct wetting. 12. LED Photometer - By the operation of the AA3 on research vessels it is recommend to use the LED photometer. The noise of the signal caused by vibration and movement of the ship is reduced compared to the lamp photometer. The special filter for the LED must be used. The filter from the lamp photometer cannot be used for the LED. The performance data may change slightly by the use of the LED photometer. 13. If the bubble pattern out of the heating bath becomes irregular, the size of the second air injection pump tube may be increased to orn/orn.