white paper on employment - data.recruitcareer.co.jp · the current situation of internships...
TRANSCRIPT

White Paper on Employment
Research Institute for Graduate Recruitment

Less than half of all companies achieved their recruitment targets.
Amid a seller’s market and a bringing forward of the job hunting schedule
by more than three months, the 2016 new graduate recruitment market saw
the lowest rate for recruitment target fulfilment in the history of the sur-
vey.*
There were significant impacts on companies and students, including a
lengthening of the job hunting period for students.
To improve the situation, for 2017 graduate recruitment, the recruitment
selection period was brought forward by two months from the previous
year.
We look at how these unusual changes for two consecutive years affected
companies and students.
We also examine and summarize the recent trends for internships.
Is has been announced that the 2018 graduate recruitment season will
have the same recruitment and job hunting schedule as the 2017 season.
We hope the results of this survey can be used to achieve “better recruit-
ment and job hunting activities” for both companies and students.
Company Survey
Survey on recruitment for 2017 graduates (undergraduate and graduate school students)
Survey objective : To gain an understanding of the employment of
new graduates by companies
Survey method : Postal survey
Survey target : Companies nationwide that carry out new graduate
recruitment and have five or more employees(4,501
companies)
Survey period : 18 December 2016–25 January 2017
Number of valid responses : 1,229 companies (27.3% response rate)
Student Survey
Survey on job hunting activities for 2017 graduates (undergraduate and graduate school students)
Survey objective : To gain an understanding of the job hunting activities of students
Survey method : Internet survey
Collaborator : Intage Inc.
Survey target : 2,404 male/female students (fourth year undergraduates and sec-
ond year graduate school students) nationwide who looked for jobs
at private companies. Target students were selected by a screening
survey with monitors of Intage, Inc.
Survey period : 26 December 2016–17 January 2017
Number of valid responses : 2,295 students
*For undergraduate students, weighted sampling was implemented referring to the School Basic Survey data by the Ministry of Education, Culture, Sports, Science and Technology, to achieve the nearest com-position ratio of sex, major, and institution type to the recruitment candidate pool.
* This present survey has been conducted since the 2012 graduate recruitment season.
White Paper on Employment 2017Survey Outline
2

The Current Situation of Internships
Outlook for 2018 Graduate Recruitment
The New Graduate Recruitment EnvironmentPart1
Part3
Part4
The Current State of Graduate Recruitment and Job HuntingChanges to the Guidelines for Graduate Recruitment and Job Hunting
Differences Based on the Durations of Internships
References and Survey ListActivities
Overview of 2017 Graduate Recruitment and Job HuntingPart2
Overview of Recruitment and Job Hunting 1 ScheduleOverview of Recruitment and Job Hunting 2 CompaniesOverview of Recruitment and Job Hunting 3 StudentsThe Gap Between Companies and StudentsThe Effect of the Schedule Change on Students
Page 21 2 The data on teacher’s license applications was taken from the following survey
Survey on Recruitment Activities (August 2017 graduate survey)
Survey objective : To gain an understanding of the job hunting activities of un-
dergraduate and graduate school students
Survey method : Internet survey
Survey target : “Rikunabi 2017” members, undergraduate and graduate school
students expected to graduate in March 2017 (at the time of the
survey), 320,361 people
Survey period : 16–28 August 2016
Number of valid responses : 7,500 undergraduate students and 1,764 graduate
school students (2.9% response rate)
*This report denotes years using the Western calendar.
*As percentages are rounded to two decimal places, the
percentages for totals may not correspond precisely with
the separately calculated values.
3
100
90
80
70
60
50
40
30
20
10
0'87 '88 '89 '90 '91 '92 '93 '94 '95 '96 '97 '98 '99 '00 '01 '02 '03 '04 '05 '06 '07 '08 '09 '10 '11 '12 '13 '14 '15 '16 '17
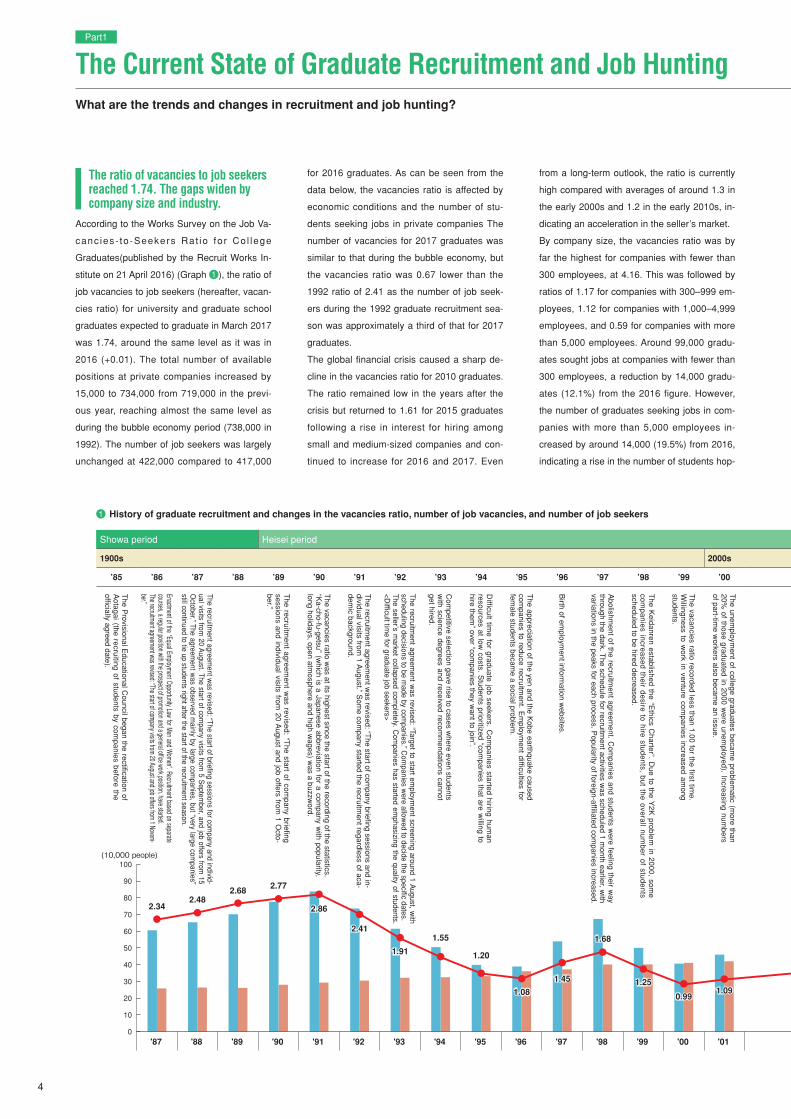
According to the Works Survey on the Job Va-
canc ies- to -Seekers Rat io fo r Co l lege
Graduates(published by the Recruit Works In-
stitute on 21 April 2016) (Graph 1 ), the ratio of
job vacancies to job seekers (hereafter, vacan-
cies ratio) for university and graduate school
graduates expected to graduate in March 2017
was 1.74, around the same level as it was in
2016 (+0.01). The total number of available
positions at private companies increased by
15,000 to 734,000 from 719,000 in the previ-
ous year, reaching almost the same level as
during the bubble economy period (738,000 in
1992). The number of job seekers was largely
unchanged at 422,000 compared to 417,000
for 2016 graduates. As can be seen from the
data below, the vacancies ratio is affected by
economic conditions and the number of stu-
dents seeking jobs in private companies The
number of vacancies for 2017 graduates was
similar to that during the bubble economy, but
the vacancies ratio was 0.67 lower than the
1992 ratio of 2.41 as the number of job seek-
ers during the 1992 graduate recruitment sea-
son was approximately a third of that for 2017
graduates.
The global financial crisis caused a sharp de-
cline in the vacancies ratio for 2010 graduates.
The ratio remained low in the years after the
crisis but returned to 1.61 for 2015 graduates
following a rise in interest for hiring among
small and medium-sized companies and con-
tinued to increase for 2016 and 2017. Even
from a long-term outlook, the ratio is currently
high compared with averages of around 1.3 in
the early 2000s and 1.2 in the early 2010s, in-
dicating an acceleration in the seller’s market.
By company size, the vacancies ratio was by
far the highest for companies with fewer than
300 employees, at 4.16. This was followed by
ratios of 1.17 for companies with 300–999 em-
ployees, 1.12 for companies with 1,000–4,999
employees, and 0.59 for companies with more
than 5,000 employees. Around 99,000 gradu-
ates sought jobs at companies with fewer than
300 employees, a reduction by 14,000 gradu-
ates (12.1%) from the 2016 figure. However,
the number of graduates seeking jobs in com-
panies with more than 5,000 employees in-
creased by around 14,000 (19.5%) from 2016,
indicating a rise in the number of students hop-
2.342.48
2.68 2.77
2.86
2.41
1.91
1.55
1.20
1.08
1.45
1.68
1.25
0.991.09
The Current State of Graduate Recruitment and Job HuntingWhat are the trends and changes in recruitment and job hunting?
Part1
The ratio of vacancies to job seekersreached 1.74. The gaps widen by company size and industry.
Showa period Heisei period
1900s 2000s
’85 ’86 ’87 ’88 ’89 ’90 ’91 ’92 ’93 ’94 ’95 ’96 ’97 ’98 ’99 ’00 ’01 ’02 ’03 ’04 ’05 ’06 ’07 ’08 ’09 ’10 ’11 ’12 ’13 ’14 ’15 ’16
The P
rovisional Educational C
ouncil began the rectification of A
otagai (the recruiting of students by companies before the
officially agreed date).
Enactment of the “Equal Employment Opportunity Law for Men and Women”. Recruitment based on separate
courses, a regular position with the prospect of promotion and a general office work position, have started. The recruitment agreement was revised: “The start of company visits from 20 August and job offers from 1 Novem-ber.”
The recruitm
ent agreement w
as revised: “The start of com
pany briefing sessions and individual visits from
20 August and job offers from
1 Octo-
ber.”
The recruitm
ent agreement w
as revised: “The start of com
pany briefing sessions and in-dividual visits from
1 August.” S
ome com
pany started the recruitment regardless of aca-
demic background.
Com
petitive selection gave rise to cases where even students
with science degrees and received recom
mendations cannot
get hired.
Difficult tim
e for graduate job seekers. Com
panies started hiring human
resources at low costs. S
tudents prioritized “companies that are w
illing to hire them
” over “companies they w
ant to join”.
The appreciation of the yen and the K
obe earthquake caused com
panies to reduce recruitment. E
mploym
ent difficulties for fem
ale students became a social problem
.
Birth of em
ployment inform
ation websites.
The vacancies ratio recorded less than 1.00 for the first tim
e. W
illingness to work in venture com
panies increased among
students.
The unem
ployment of college graduates becam
e problematic (m
ore than 20%
of those graduated in 2000 were unem
ployed). Increasing numbers
of part-time w
orkers also became an issue.
Recruiting needs som
ewhat recovered.
While the econom
ic downturn continued, the num
ber of students scheduled to be hired by com
panies with good perform
ance results, such as automobile m
anufacturing com-
panies, manufacturing com
panies, and logistics companies, increased.
Large and medium
companies doubled the num
ber of new hires, but that of sm
all com-
panies decreased due to the sluggish economy.
Along w
ith economic recovery, both large com
panies and small and m
edi-um
-sized companies increased the desire to hire new
employees.
Com
panies’ desire to hire students increased and the number of students
scheduled to be hired surpassed the bubble economy period. T
he vacan-cies ratio reached over 2 for the first tim
e in 16 years.
The vacancies ratio declined. A
lthough the recruitment w
as still competi-
tive, signs of recovery in employm
ent were seen as large com
panies dra-m
atically increased the number of students to be hired.
The K
eidanren revised the “Ethics C
harter”: “In 2013, PR
activities start from 1 D
ecem-
ber and screening activities start from 1 A
pril.” (This w
as to be maintained until the 2015
graduation year.)
At the request of the governm
ent, the Keidanren published its policies on recruitm
ent: “In 2016, P
R activities start from
1 March and screening activities l start on 1 A
ugust.”
Based on the consultations w
ith companies, universities, and the governm
ent, the K
eidanren revised the recruitment policies: “In 2017, P
R activities start from
1 March and
screening activities start from 1 June.”
Seller’s m
arket accelerated. The inform
ation disclosure to students becam
e obligatory by “The Youth E
mploym
ent Pro-
motion A
ct”.
The vacancies ratio w
as at its highest since the start of the recording of the statistics. “K
a-cho-fu-getsu” (which is a Japanese abbreviation for a com
pany with popularity,
long holidays, open atmosphere and high w
ages) was a buzzw
ord.
The recruitment agreem
ent was revised: “Target to start em
ployment screening around 1 A
ugust, with
scheduling decisions to be made by com
panies.” Com
panies were allow
ed to decide the specific dates. The seller’s m
arket collapsed completely. C
ompanies has started em
phasizing the quality of students. <D
ifficult time for graduate job seekers>
The recruitment agreem
ent was revised: “The start of briefing sessions for com
pany and individ-ual visits from
20 August. The start of com
pany visits from 5 S
eptember, and job offers from
15 O
ctober.” The agreement w
as observed mainly by large com
panies, but “very large companies”
still continued to tie up students right after the start of the recruitment season.
Abolishm
ent of the recruitment agreem
ent. Com
panies and students were feeling their w
ay through the dark. T
he schedule for recruitment activities w
as scheduled 1 month earlier, w
ith variations in the peaks for each process. P
opularity of foreign-affiliated companies increased.
The K
eidanren established the “Ethics C
harter”. Due to the Y
2K problem
in 2000, some
companies increased their desire to hire students, but the overall num
ber of students scheduled to be hired decreased.
History of graduate recruitment and changes in the vacancies ratio, number of job vacancies, and number of job seekers1
(10,000 people)
4

(Ratio)
(March graduation)
3.50
3.00
2.50
2.00
1.50
1.00
0.50
0
'87 '88 '89 '90 '91 '92 '93 '94 '95 '96 '97 '98 '99 '00 '01 '02 '03 '04 '05 '06 '07 '08 '09 '10 '11 '12 '13 '14 '15 '16 '17
Source: Recruit Works Institute, Works Survey on the Job Vacancies-to-Seekers Ratio for College Graduates
*Compiled by the New-Grad Market Research Institute
ing to work in large companies.
Examining the trends by industry, the vacancies
ratio for the construction industry increased by
0.07 from the previous year to 6.25, while that
for the distribution industry increased by 1.33 to
6.98. These industries had substantially higher
ratios than those of the financial industry at
0.19, the services and information industry at
0.49, and the manufacturing industry at 1.93. In
particular, the number of job seekers in the dis-
tribution industry fell by 15.3%, but the total
number of vacancies increased by around
13,000 (4.8%). Because of this, the vacancies
ratio returned to its pre-financial crisis level. In
contrast, the number of graduates seeking jobs
in the financial industry increased by 14.0%,
but the vacancies ratio fell due to a reduction in
available positions by 6.2%.
Turning to the mid-career recruitment market,
on 31 January 2017, the Ministry of Health, La-
bour and Welfare announced that the average
effective vacancies-to-job seekers ratio for
2016 was 1.36 (+0.16 from the previous year).
This was the highest in 25 years since 1991
(1.40) and was a 7-year consecutive increase.
As in graduate recruitment, the seller’s market
continues to grow, signaling tight conditions for
mid-career recruitment.
According to the Recruit Works Institute’s Sur-
vey on Mid-Career Recruitment: 2016 First-half
Results, 2017 Outlook (published on 31 Janu-
ary 2017), 46.5% of firms were not able to se-
cure their desired mid-career recruits in the
first half of 2016. This was around the same
level as in 2015 of 46.7%, comprising nearly
half of all companies. As much as 71.2% of
companies cited “to fill vacant positions” as
their reason for carrying out mid-career recruit-
ment. Among the measures for coping with the
insufficient number of mid-career recruits,
“overtime/working during holidays of current
employees” was mentioned by the highest
share of 32.2% of companies, but the share of
companies that resorted to “increasing gradu-
ate recruitment” was also as high as 20.7%. In
particular, 29.4% of companies in the distribu-
tion industry mentioned “increasing graduate
recruitment”. This difficulty in securing recruits
in the mid-career market is also one of the rea-
sons for the increase in the number of avail-
able positions in the new-graduate market.
1.33 1.301.35 1.37
1.601.89
2.14 2.14
1.62
1.281.23 1.27 1.28
1.611.73 1.74
Vacancies ratio for mid-careerrecruitment reached a 25-year high.
Showa period Heisei period
1900s 2000s
’85 ’86 ’87 ’88 ’89 ’90 ’91 ’92 ’93 ’94 ’95 ’96 ’97 ’98 ’99 ’00 ’01 ’02 ’03 ’04 ’05 ’06 ’07 ’08 ’09 ’10 ’11 ’12 ’13 ’14 ’15 ’16
The P
rovisional Educational C
ouncil began the rectification of A
otagai (the recruiting of students by companies before the
officially agreed date).
Enactment of the “Equal Employment Opportunity Law for Men and Women”. Recruitment based on separate
courses, a regular position with the prospect of promotion and a general office work position, have started. The recruitment agreement was revised: “The start of company visits from 20 August and job offers from 1 Novem-ber.”
The recruitm
ent agreement w
as revised: “The start of com
pany briefing sessions and individual visits from
20 August and job offers from
1 Octo-
ber.”
The recruitm
ent agreement w
as revised: “The start of com
pany briefing sessions and in-dividual visits from
1 August.” S
ome com
pany started the recruitment regardless of aca-
demic background.
Com
petitive selection gave rise to cases where even students
with science degrees and received recom
mendations cannot
get hired.
Difficult tim
e for graduate job seekers. Com
panies started hiring human
resources at low costs. S
tudents prioritized “companies that are w
illing to hire them
” over “companies they w
ant to join”.
The appreciation of the yen and the K
obe earthquake caused com
panies to reduce recruitment. E
mploym
ent difficulties for fem
ale students became a social problem
.
Birth of em
ployment inform
ation websites.
The vacancies ratio recorded less than 1.00 for the first tim
e. W
illingness to work in venture com
panies increased among
students.
The unem
ployment of college graduates becam
e problematic (m
ore than 20%
of those graduated in 2000 were unem
ployed). Increasing numbers
of part-time w
orkers also became an issue.
Recruiting needs som
ewhat recovered.
While the econom
ic downturn continued, the num
ber of students scheduled to be hired by com
panies with good perform
ance results, such as automobile m
anufacturing com-
panies, manufacturing com
panies, and logistics companies, increased.
Large and medium
companies doubled the num
ber of new hires, but that of sm
all com-
panies decreased due to the sluggish economy.
Along w
ith economic recovery, both large com
panies and small and m
edi-um
-sized companies increased the desire to hire new
employees.
Com
panies’ desire to hire students increased and the number of students
scheduled to be hired surpassed the bubble economy period. T
he vacan-cies ratio reached over 2 for the first tim
e in 16 years.
The vacancies ratio declined. A
lthough the recruitment w
as still competi-
tive, signs of recovery in employm
ent were seen as large com
panies dra-m
atically increased the number of students to be hired.
The K
eidanren revised the “Ethics C
harter”: “In 2013, PR
activities start from 1 D
ecem-
ber and screening activities start from 1 A
pril.” (This w
as to be maintained until the 2015
graduation year.)
At the request of the governm
ent, the Keidanren published its policies on recruitm
ent: “In 2016, P
R activities start from
1 March and screening activities l start on 1 A
ugust.”
Based on the consultations w
ith companies, universities, and the governm
ent, the K
eidanren revised the recruitment policies: “In 2017, P
R activities start from
1 March and
screening activities start from 1 June.”
Seller’s m
arket accelerated. The inform
ation disclosure to students becam
e obligatory by “The Youth E
mploym
ent Pro-
motion A
ct”.
Number of vacancies Number of job seekers (private companies) vacancies ratio
Along w
ith plans to increase employees at com
panies with good perform
ance results and busi-nesses w
ith new developm
ent and new branches, the num
ber of students scheduled to be hired increased. Transportation and travel com
panies became popular am
ong students.
The scheduled num
ber of students to be hired was at the highest ever, but the
global financial crisis in Septem
ber led to the economic dow
nturn. Dow
nsizing by laying off tem
p workers becam
e a social problem and the w
illingness to hire w
eakened. Som
e company even cancelled their job offers.
Although the scheduled num
ber of students to be hired decreased, companies had a m
oti-vation to recruit fresh graduates. S
ome com
panies stopped mid-career hiring to hire fresh
graduates.
5

3rd year undergraduate/1st year postgraduate 4th year undergraduate/2nd year postgraduate
*1 Before the 2012 graduate recruitment season, there was no agreement on the starting time for PR activities, but registration through job hunting information websites generally began from 1 Octo-ber of the year before graduation, marking the start of most PR activities.*2 For recruitment screening activities, it was stipulated that “students who will not graduate/complete their studies must refrain from carrying out interviews and other practical screening activities”, but the implementation timing varied among companies.
January–February Winter semester exams
PR activities
Recruitment screening activities
Recruitment screening activities
PR activities
MarchSpring break
April–JulyClasses
July–AugustSummer semester
exams
August–SeptemberSummer break
August–OctoberGrad school
entrance exams
1 April
1 March
1 March 1 June
1 August
Students on study abroad programs return to Japan
1 December
October–JanuaryClasses
PR activities *1
University calendar
2016 graduates
2017–2018 graduates
2013–2015 graduates
–2012 graduates Recruitment screening activities *2
PR activities Recruitment screening activities
1 October
Changes to the Guidelines for Graduate Recruitment and Job HuntingSummary of changes to the 2017 graduate recruitment schedule
Part1
The Japan Business Federation (Keidanren)
published its Guidelines for Recruitment in De-
cember 2015. At the government’s request, PR
activities for 2017 graduate recruitment, such
as company pre-entry applications and infor-
mation sessions began at the same time as for
2016 graduates “from 1 March, immediately
before entering the year of graduation”, while
interviews and other screening activities were
moved forward by 2 months to start “from 1
June in the year of graduation”.
Prior to the change, firms and students had
conducted job hunting and recruitment activi-
ties following the guidelines set out by Keidan-
ren’s Code of Ethics Regarding Recruitment.
According to the guidelines for 2013–2015
graduates, PR activities were conducted “from
1 December in the year before graduation”,
and screening activities began “from 1 April in
the year of graduation”. For the recruitment of
2016 graduates, PR activities were postponed
by 3 months and screening activities by 4
months, prolonging the period for PR activities
by a month (see 1 ).
The changes were made with the aims of “se-
curing students’ study time”, “promoting study
abroad”, and “allowing internship and other
early-career education measures”. It has, as a
result, prolonged the recruitment and selection
process for both companies and students with
the presence of the foreign-affiliated compa-
nies with earlier selection schedules, compa-
nies seeking to recruit bright students earlier
than other companies and students hoping to
receive early job offers.
As described in the guidelines, many of the
most popular companies among students be-
gan screening activities from August. One of
the reasons for the prolongation of the period
was that many students, despite receiving ear-
ly job offers from other companies, continued
job hunting in the hope of still being selected
by the top companies. Amid a high vacancies-
to-job seekers ratio, 2016 graduates received
an average of 2.17 job offers, an increase from
an average of 2.02 offers in 2015 and 1.85 of-
fers in 2014. This led to an increase in the
number of offers being declined, resulting in
many companies not reaching their recruitment
targets. For 2016 graduate recruitment, the
share of companies not reaching their recruit-
ment targets was 48.3%, which was the first
time it reached almost half since the start of
the survey (see White Paper on Employment
2016).
As a result, following discussions between the
government and firms and universities, the de-
cision was made to change the schedule for
the 2017 graduate recruitment season. This
change in the schedule for two consecutive
years was highly unusual. Furthermore, as it
was announced in December in the year be-
fore graduation, it placed significant pressure
on the job hunting and recruitment guidance
activities being conducted by universities.
Many students start to interact with companies
during their PR activities period by submitting
pre-entries through the recruitment websites of
companies they wish to enter or via job recruit-
ment information sites. After that, they receive
PR activities starting from March,screening starting from June.
Changes to the starting dates for recruitment and job hunting activities1
6

(A) Recruitment and Employment Situation
Number of new graduates hired and employees leaving in the last 3 years
Number of male and female new graduates hired in the past 3 years
Average years of employment
(B) Development and Improvement of Vocational Skills
Presence or absence of training/training content
Presence or absence of self-development support/support content*Including whether there is a system whereby employees continuing education/training can take days off or work shorter hours, where applicable
Presence or absence of a mentoring system
Presence or absence of a career consulting system/career consulting system content*Including information on ‘’self-career docks’’ (a mechanism for setting opportunities to re-ceive career consultation on a regular basis), where applicable
Presence or absence of in-house certifications, etc. or their content
(C) Employment Management in the Company
Average monthly overtime for the previous fiscal year
Average paid vacation days for the previous fiscal year
Number of employees eligible for parenting leave/number of employees who received parenting leaves for the previous fiscal year (by gender)
Percentage of women in executive and management positions
For the recruitment of new graduates or similar cases, it is mandatory to provide at least one item of information from each of points (A), (B), and (C) above. In addition, if an applicant makes a request for information on the above items, it shall not constitute a reason to treat them disadvantageously.
Under the 1 March 2016 Youth Employment Promotion Act, com-
panies recruiting new graduates became obligated to provide in-
formation on one or more items for each of points (A), (B), and
(C) in Table 2 . In addition to publishing the information on their
homepage or job information site, providing the information at
briefing sessions, and listing it on their recruitment forms, compa-
nies must provide information by letter or e-mail if requested by
individual applicants. This allows applicants to select companies
where they can “work more like themselves”.
It also became obligatory to detail the often problematic ‘’fixed
overtime pay (overtime work for a fixed amount of time paid at a
fixed rate and extra wages for working on holidays or after mid-
night)”. The cases in which overtime-related payment and extra
wages are due must also be stated.
At schools and administrative institutions, efforts are underway to
promote understanding of labour laws to prevent problems during
job hunting and after employment. It is believed that mismatches
can be prevented through the sharing of information between cor-
porations and individuals.
The Youth Employment Promotion Act: Preventing Mismatches by Disclosing Company Information
column
Strengthening support for young people for a hardworking society
notifications from companies about information
sessions, etc. and attend events they find in-
teresting, meet alumni employees, and seek
out other companies they would like to join.
This is also a time for them to encounter firms
they were not previously aware of, meet peo-
ple they might aspire to become like in the fu-
ture, and familiarize themselves with business
manners through interactions with recruiters
and during company information sessions. Due
to the shortened PR activities period for 2017
graduate recruitment, it is likely that compared
to previous years, job seekers had less time
for self-analysis and for conducting research
on firms and industries.
During the 2016 graduate recruitment season,
many companies completed their recruitment
period with an “insufficient” number of new
hires. As a result, a number of companies
changed their original plans for 2017 gradu-
ates, such as by deciding to “promote early
recognition and awareness of the company”
(33.4%), “attract students’ interest” (32.9%),
and “follow up with students after making of-
fers” (32.6%).
Meanwhile, when asked about any changes to
their planned employment screening sched-
ules, around 30% of companies said they were
making “no changes in particular”. However, it
should be noted that among companies with
“fewer than 300 employees”, 48.9%, nearly
half of the total, had decided to make changes,
while the share was only 14.8% among com-
panies with “5,000 employees or more”.
As such, it can be expected that there was a
particularly large burden on small and medium-
sized companies to market and promote them-
selves to 2017 graduates given the limited
time.
Wide media coverage of the government’s
“work-style reform” efforts has highlighted the
current state of excessive labor practices. This
has led to variety of concerns: “Even if I work
hard and get into a large, popular company, I
might be forced to work a certain way and not
be able to work productively”, “They only say
positive things at information sessions, so I
don’t know what to believe”, “I wonder whether
I can become a productive member of society”,
and “How can I maintain a good work-life bal-
ance?” Even considering the current seller’s
market, many students have concerns that
they are headed for an unclear future.
With the ongoing demographic shifts in Japan
of declining birthrates and an aging population,
the country’s working population is currently in
decline, and finding gainful, stable employment
for young people that allows them to use their
skills is a pressing issue. As a result, the re-
sponsibilities of hiring companies are being
called into question, and a number of ongoing
initiatives are being implemented to assist
young people in choosing the right jobs. Both
students and the companies hiring should fully
understand the content of the Youth Employ-
ment Promotion Act, which is introduced in the
column below.
Students pay new attention to“work style” due to coverage inthe media.
Items of Information Stipulated by the Youth Employment Promotion Act2
7

(%)80
(%)60
70
60
50
50
40
40
30
30
20
20
10
10
0
02015
Before May
Jun AugJul Nov Dec 2016Jan
Feb Mar Apr May Jun Jul AugSep Oct Oct or
later
Sep
Jul2015Before
Oct
Dec or later
Nov Dec 2016 Jan
Feb Mar Apr Sep Oct NovAugJunMay
Student
The start of face-to-face company information sessions/seminars for 2016 graduates was spread between March and April (47.4% and 26.7%, respectively). For 2017 graduates, companies that started in March increased sub-stantially to 63.9%. (19.8% for April.)
For 2016 graduate recruitment, 69.2% of students began collecting information in February in the year prior to graduation. The figure rose to 75.0% for 2017 graduates.
CompanyThe starting peaks for PR activities were from March, interviews from April, and offers and unofficial offers from June
Many students started participating in information sessions andinterviews from March and April
* All companies / Numerical Answer
* Among students who carried out each process / Single Answer
Provision of recruitment information Individual information sessions and seminars (face-to-face) Interviews Offers and early unofficial offers
Information gathering Individual information sessions by companies (face-to-face) Interviews and other screening (face-to-face) First offers
What kinds of activities did businesses and
students engage in, and when did they engage
in them? We examine the recruitment and job
hunting processes from their starting times.
First, we look at the starting times for company
recruitment processes (Graph 1 ). The majority
of companies (72.3%) began to share recruit-
ment information in March 2016. Most (63.9%)
also began meetings for information sessions
and seminars in the same month. Meanwhile,
most companies also launched pre-entry re-
ception activities and cooperative information
sessions/seminars at universities and other
venues in March, concentrating these activities
in what is called “the recruitment PR launch
month”.
Interviews began for the highest share of com-
panies (28.3%) in Apri l . Next was June
(22.4%), then May (17.4%), meaning that
85.2% of companies began the interview pro-
cess between March and June. Meanwhile,
65.3% of companies began interviewing in or
before May.
The earliest unofficial and official job offers
were made during or before May by 42.5% of
companies, while 57.5% made offers from
June. Additionally, most companies began
document screening in March and began apti-
tude testing and written examinations in April.
The starting times for job hunting activities by
students (Graph 2 ) show that 75.0% of stu-
dents began gathering information in February
or earlier, while the share of students who be-
gan participating in individual company infor-
mation sessions (meetings) increased from
December onwards and was the highest in
March (45.5%).
April saw the highest share of students begin-
ning to participate in interviews, at 26.4%, and
the number of students starting the interview
process in May or earlier reached 78.2%. The
number of students receiving job offers in-
creased from around March, with 35.0% of stu-
dents receiving their offers during or before
May. Expanding the range to June or earlier
gives a share of 57.3%.
Overview of Recruitment and Job Hunting 1 ScheduleWhat was the actual schedule for companies and students for 2017 graduate recruitment?
Part2
Around 65% of businesses beganinterviews before May.
Around 8 in 10 students participatedin interviews in May or earlier.
Starting times of recruitment processes1
Starting dates of job hunting processes2
8

November 2015Received a list of food company screening schedules from a senior student and made plans to carry out both research and job hunting activi-ties.
January–February 2016Carried out self-analysis and prepared entry sheets. Prepared answers to frequently asked topics and received feedback from the university career center.
March 2016Started participating in individual company infor-mation sessions. Attended sessions for approxi-mately 15 companies.
April 2016The first week of April was the peak for submit-ting entry sheets. Eventually, applied to between 15 and 20 companies. The peak for first-round screening was toward the end of April.
June 2016Received an unofficial offer from a desired company and concluded job hunting activities.
Job hunting schedulees
StudentCASE1
Scheduled to join a foodmanufacturing companyAgricultural science department
Since I had carried out research related to food
product development, I decided I wanted to work
at a food-related manufacturer. The first step I
took to focus on job hunting was to understand
the company schedules. I received a list of the se-
lection schedules of food-related companies from
a student in my laboratory who was a year ahead
of me. Because it seemed that the companies I
was interested in had not changed their selection
schedules much from the 2016 graduate recruit-
ment season, I assumed my job search would end
by the middle of June if everything went smoothly.
Keeping in mind my plan to present at a confer-
ence in the summer, I planned to make as much
progress on my experiments as possible and put
together information for writing the application en-
try sheets by the end of February.
Early April was especially hectic. I had to deal
with the deadline for submitting my conference
materials as well as attend company information
sessions and meet deadlines for submitting appli-
cations. I coped by prioritizing my tasks by the
dates they were to be completed and created
weekly plans a week in advance. In this way, I
was able to make use of the time-management
skills that I had gained from carrying out research.
I felt throughout my job search that there was
compatibility in the timing between myself and the
company. When selecting a company, I focused
on whether I thought I could achieve what I want-
ed to at the company and whether the company
was local. However, while many companies in the
former category gave out offers until the middle of
June, more companies in the latter category
made offers in August or September. Because I
was preparing for my conference presentation in
the summer, I wasn’t able to consider companies
in the latter category. That was unfortunate, but I
moved on to make the most of the job offer I ob-
tained through my job hunting activities.
I planned my research and job search prepara-tions based on schedules from senior students.
Understanding each company’s selection schedule inadvance allowed for simultaneous research andjob hunting. Job hunting was completed in June.
Generally, our company begins interacting with
students through staffing agencies, etc. starting
from around October in the academic year prior
to graduation. We began our 2017 graduate re-
cruitment season in October of 2015 with the ob-
jective of concluding it by the end of June 2016.
During 2015, we participated in staffing agency
events to raise awareness from students. We fo-
cused on finding “people who can create some-
thing from nothing” and assigned recruiters to
reach out to these kinds of students to provide
them with information that would increase their
ambition and willingness to work with us. We
launched in-house information sessions at the
beginning of the year and, until February, focused
on students who had registered with the staffing
agencies. From March onwards, we also offered
guidance to students who had completed pre-en-
tries from job hunting information sites.Recruiters
Company CASE1
MarketingScreening start date: January
From October 2015 Job hunting events, company information sessions First-round interviews Second-round interviews Aptitute testing Third-round interviews Final interviews Early unofficial offers sent (until September 2016)
Main recruiting processes
Company location: Tokyo Company size : 1,000+ employees Results of 2017 graduate recruitmentRecruitment target: 20 peopleOffers given: 45 offersExpected number of new hires: 30 people(33% offer refusal rate)
COMPANY DATA were introduced for the first time to help attract
the students to our company at an early stage,
but this only resulted in 1 job offer. Merely giving
students advice did not lead them to being at-
tracted to the company. Additionally, many stu-
dents appeared to be waiting for selection deci-
sions from major f irms and did not attend
interviews when invited.Although our company
was ultimately able to fulfill its recruitment goals,
the recruiting season extended to the end of Sep-
tember and left behind other workload-related is-
sues. Our company is organizing its recruitment
process for 2018 graduates, and we are proceed-
ing with detailed planning, such as by establish-
ing recruitment objectives for each stage of the
process. October proved to be too early to begin
interacting with students, so the launch will be
changed to December. We also intend to tempo-
rarily cease the use of recruiters and coordinate
more closely with staffing agencies to approach
the students that we wish to secure earlier.
Despite using recruiters for early recruitment, the results were not effective.
Although recruitment activities began in October, they lasted until the end of September the following year
9
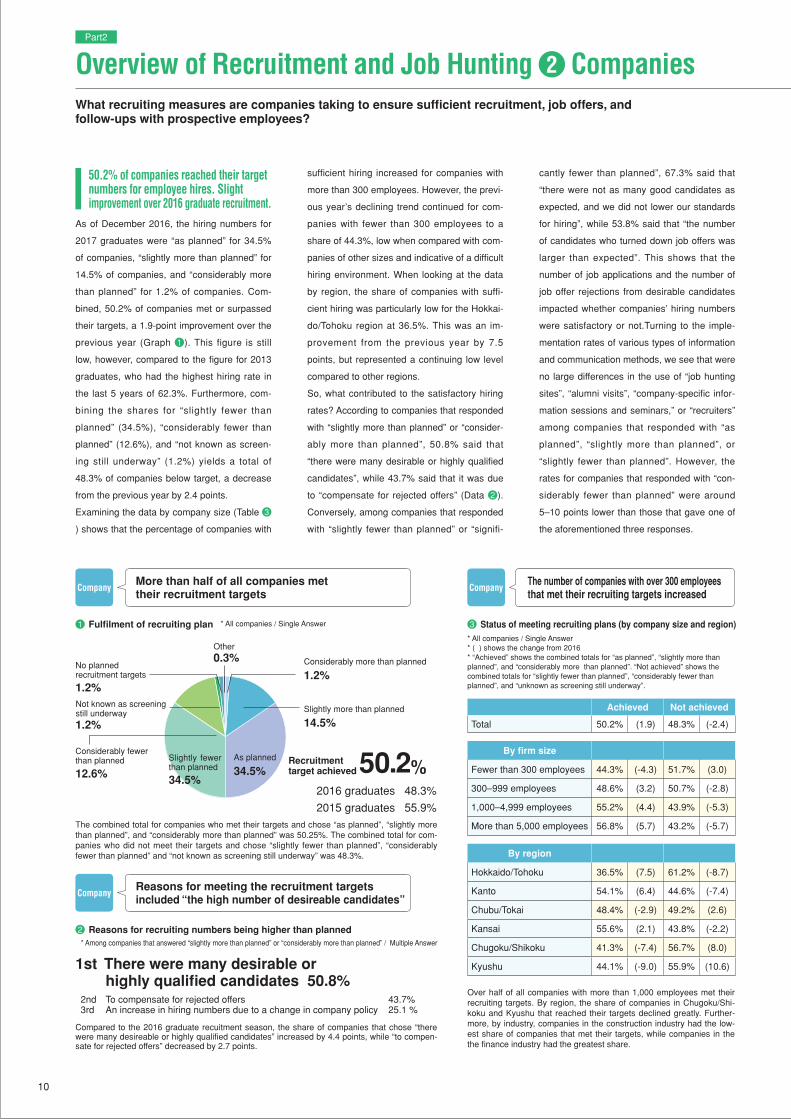
Fulfilment of recruiting plan1 Status of meeting recruiting plans (by company size and region)3
Reasons for recruiting numbers being higher than planned2
The combined total for companies who met their targets and chose “as planned”, “slightly more than planned”, and “considerably more than planned” was 50.25%. The combined total for com-panies who did not meet their targets and chose “slightly fewer than planned”, “considerably fewer than planned” and “not known as screening still underway” was 48.3%.
Over half of all companies with more than 1,000 employees met their recruiting targets. By region, the share of companies in Chugoku/Shi-koku and Kyushu that reached their targets declined greatly. Further-more, by industry, companies in the construction industry had the low-est share of companies that met their targets, while companies in the the finance industry had the greatest share.
1.2%
Not known as screeningstill underway
Company
Company
More than half of all companies met their recruitment targets
Reasons for meeting the recruitment targets included “the high number of desireable candidates”
CompanyThe number of companies with over 300 employees that met their recruiting targets increased
* All companies / Single Answer* ( ) shows the change from 2016* “Achieved” shows the combined totals for “as planned”, “slightly more than planned”, and “considerably more than planned”. “Not achieved” shows the combined totals for “slightly fewer than planned”, “considerably fewer than planned”, and “unknown as screening still underway”.
A Achieved Not achieved
Total 50.2% (1.9) 48.3% (-2.4)
By firm size
Fewer than 300 employees 44.3% (-4.3) 51.7% (3.0)
300–999 employees 48.6% (3.2) 50.7% (-2.8)
1,000–4,999 employees 55.2% (4.4) 43.9% (-5.3)
More than 5,000 employees 56.8% (5.7) 43.2% (-5.7)
By region
Hokkaido/Tohoku 36.5% (7.5) 61.2% (-8.7)
Kanto 54.1% (6.4) 44.6% (-7.4)
Chubu/Tokai 48.4% (-2.9) 49.2% (2.6)
Kansai 55.6% (2.1) 43.8% (-2.2)
Chugoku/Shikoku 41.3% (-7.4) 56.7% (8.0)
Kyushu 44.1% (-9.0) 55.9% (10.6)
2016 graduates 48.3%
2015 graduates 55.9%
50.2%Recruitmenttarget achieved
Slightly fewer than planned
34.5%
Considerably fewerthan planned
12.6%
As planned
34.5%
Slightly more than planned
14.5%
Considerably more than planned
1.2%
Other0.3%
No planned recruitment targets
1.2%
Compared to the 2016 graduate recuitment season, the share of companies that chose “there were many desireable or highly qualified candidates” increased by 4.4 points, while “to compen-sate for rejected offers” decreased by 2.7 points.
1st There were many desirable orhighly qualified candidates 50.8%
* Among companies that answered “slightly more than planned” or “considerably more than planned” / Multiple Answer
2nd To compensate for rejected offers 43.7% 3rd An increase in hiring numbers due to a change in company policy 25.1 %
As of December 2016, the hiring numbers for
2017 graduates were “as planned” for 34.5%
of companies, “slightly more than planned” for
14.5% of companies, and “considerably more
than planned” for 1.2% of companies. Com-
bined, 50.2% of companies met or surpassed
their targets, a 1.9-point improvement over the
previous year (Graph 1 ). This figure is still
low, however, compared to the figure for 2013
graduates, who had the highest hiring rate in
the last 5 years of 62.3%. Furthermore, com-
bining the shares for “slightly fewer than
planned” (34.5%), “considerably fewer than
planned” (12.6%), and “not known as screen-
ing still underway” (1.2%) yields a total of
48.3% of companies below target, a decrease
from the previous year by 2.4 points.
Examining the data by company size (Table 3
) shows that the percentage of companies with
sufficient hiring increased for companies with
more than 300 employees. However, the previ-
ous year’s declining trend continued for com-
panies with fewer than 300 employees to a
share of 44.3%, low when compared with com-
panies of other sizes and indicative of a difficult
hiring environment. When looking at the data
by region, the share of companies with suffi-
cient hiring was particularly low for the Hokkai-
do/Tohoku region at 36.5%. This was an im-
provement from the previous year by 7.5
points, but represented a continuing low level
compared to other regions.
So, what contributed to the satisfactory hiring
rates? According to companies that responded
with “slightly more than planned” or “consider-
ably more than planned”, 50.8% said that
“there were many desirable or highly qualified
candidates”, while 43.7% said that it was due
to “compensate for rejected offers” (Data 2 ).
Conversely, among companies that responded
with “slightly fewer than planned” or “signifi-
cantly fewer than planned”, 67.3% said that
“there were not as many good candidates as
expected, and we did not lower our standards
for hiring”, while 53.8% said that “the number
of candidates who turned down job offers was
larger than expected”. This shows that the
number of job applications and the number of
job offer rejections from desirable candidates
impacted whether companies’ hiring numbers
were satisfactory or not.Turning to the imple-
mentation rates of various types of information
and communication methods, we see that were
no large differences in the use of “job hunting
sites”, “alumni visits”, “company-specific infor-
mation sessions and seminars,” or “recruiters”
among companies that responded with “as
planned”, “slightly more than planned”, or
“slightly fewer than planned”. However, the
rates for companies that responded with “con-
siderably fewer than planned” were around
5–10 points lower than those that gave one of
the aforementioned three responses.
Overview of Recruitment and Job Hunting 2 CompaniesWhat recruiting measures are companies taking to ensure sufficient recruitment, job offers, and follow-ups with prospective employees?
Part2
50.2% of companies reached their target numbers for employee hires. Slight improvement over 2016 graduate recruitment.
* All companies / Single Answer
10

Company
Company
CASE2
ManufacturerScreening start date: May
CASE3
SoftwareScreening start date: May
January 2016 V i s i t s t o l a b o r a t o r i e s b y recruiters, company information sessions, visits by alumni (until late February)
March I n - c o m p a n y a n d u n i v e r s i t y information sessions (until early April)
Early May Entry sheet deadline Mid-May Aptitute testing Late May First-round interviews Second-round interviews Early June Early unofficial offers sent
March 2016 Joint company information sessions
April Entry sheet deadline Mid-May In-company and university
information sessions Aptitute testing First-round interviews Final interviews Late May Early unofficial offers sent
Main recruiting processes
Main recruiting processes
Company location: Osaka Company size : 1,000+ employees Results of 2017 graduate recruitmentRecruitment target: 19 peopleOffers given: 25 offersExpected number of new hires: 21 people(16% offer refusal rate)
COMPANY DATA
Company location: Oita Prefecture Company size : 300–999 employees Results of 2017 graduate recruitmentRecruitment target: 20 peopleOffers given: 22 offersExpected number of new hires: 15 people(32% offer refusal rate)
COMPANY DATA
Every year, our company places emphasis on re-
cruiters’ PR activities. Because we recruit mainly
for technical positions, we first visit around 25 tar-
get universities and offer information about our
company, focusing on our employees’ former
schools and laboratories. This allows us to in-
crease recognition while building affinity for our
company.Based on our experiences from 2016
graduate recruitment, we made changes for 2017
regarding the timing of university visits and the lev-
el of seniority of the visiting employees. For the
former, for 2016 graduate recruitment, we carried
out recruiting activities in February, but other com-
panies carried out their visits earlier and ended up
taking the good students. Therefore, we moved
our visits forward to January. For the latter, instead
of using employees in their third or fourth years of
employment, we appointed around 15 employees
Our company usually offered information via joint
company information sessions and recruiting infor-
mation websites, with information sessions, aptitude
tests, and first round interviews held at our head of-
fice in Oita after the entry sheet selection. However,
since this made it difficult for us to get students from
outside the prefecture to participate, for 2017 gradu-
ate recruitment, information sessions and first round
interviews were held not only at our main office but
also in our branch offices in Kanto, Kansai, and Fu-
kuoka. As a result, we were able to gather a sufficient
number of students who passed the selection pro-
cess and recruited one candidate each from Kanto
and Kansai. Although our costs increased, the effec-
tiveness was clear, so we intend to continue holding
the information sessions and screening processes at
our branch offices for 2018 recruitment.
Despite this, however, we were not able to meet out
in their first or second years of employment. This
was because employees in their third or fourth
years were not likely to be directly known by the
students, which posed a hurdle to building familiar-
ity. In addition, the company recruitment aptitude
test was changed to be test-center based, making
it easier to take for students from afar.As a result,
the number of aptitude test participants was 115%
compared to the previous year. The number of
test participants from further afield, such as the
Kanto region, also increased, and we were satis-
fied with the number of applications and the yield
rate. We felt that the recruiters were able to de-
velop a good level of affinity, too. Although it is
not certain whether there is a direct relation, the
offer acceptance rate for voluntary candidates
was also higher than average.Based on these re-
sults, we do not intend to change the procedures
for recruiting activities for 2018 graduates and will
first focus on recruiters’ PR activities.
recruitment targets, and the offer decline rate was
somewhat higher than normal. One reason for this,
which we feel is important to deal with, is the change
in students’ preferences for where they work. In spring
2016, the highway directly connecting Oita and Kita-
kyushu was opened. This reduced travel times by car,
leading to an increase in the number of students from
Oita as well as the number of students who were out-
side Kyushu but originally from the Kyushu area and
hoping to transfer in the future and considering em-
ployment in Fukuoka rather than Oita. In practice,
there were students who declined our company’s of-
fers to work at similar companies in Fukuoka instead.
Accordingly, for 2018 graduate recruitment activities,
we plan to change the content of our information ses-
sions to emphasize the quality of our operations and
technology. Although until now we had been giving a
general explanation of our company, by conveying the
merits of our company in detail, we aim to show that
our company that is not inferior to other similar com-
panies in Fukuoka.
Employees in their first or second year of employment visited their former universi-ties to build recognition and familiarity.
Previous selection stages carried out only at our main office meant that we could not se-cure candidates from outside the prefecture.
Built affinity in students by strengtheningrecruiters’ PR activities
Conducted the first-round selection also at branch offices outside the prefecture. Succeeded in the recruitment of applicants hoping to transfer back in the future.
11

0 50 100 150 200(%)90
80
70
60
50
40
30
20
10
0
165.7
134.3
156.4
170.9
169.6
73.3
48.9
65.6
77.0
77.2
92.4
85.4
90.8
93.9
92.5
Total
Fewer than 300 employees
300–999employees
1,000–4,999employees
More than 5,000employees
Prospective em
ployee get-togethers
Regular contact by e-m
ail/phone
Sending com
pany newsletters and
information for prospective em
ployees
Correspondence courses (including
e-learning)
Group training
Internal company event arrangem
ents/invitations
Social netw
orking and othercom
munities
Requests for subm
ission of grades/results
Part-tim
e job at the workplace
Contact w
ith students' guardians
Other
None
79.4
60.0
46.0
40.0
29.226.3
19.619.2
11.85.4 2.9
8.1
Number of expected hires (100)
Number of offers given
Number of rejected offersNumber of accepted offers
Regardless of company size, the results show between 1.3 and 1.7 offers were given per expected hire, while 35%–45% of offers were rejected by candidates. The number of accepted offers was between 85 and 94 per 100 expected hires.
“Regular contact by e-mail and phone” increased for companies of all sizes. In particular, there was a large increase among companies with fewer than 300 employees (from 42.3% for 2016 graduates to 60.1% for 2017 graduates).
* Companies that answered all questions from interview to offers / Numerical Answer * All companies / Multiple Answer* Data for 2016 not shown for items only surveyed in 2017.
CompanyIncreasing numbers of companies followed up with regular communication after giving out offers
CompanyBetween 1.3 and 1.7 offers were given per expected hire and 35%–45% of offers were declined.
2016 graduates 2017 graduates
In order to reach the expected hiring numbers,
how many candidates are given job offers by
companies? Converting “the number of offers
given and number of offers accepted per 100
expected hires” (Graph 1 ) from companies’
expected hiring numbers, interview numbers
and job offer numbers, the number of job offers
made to obtain 100 hires was 165.7, around
the same level as in the previous year (166.6).
However, the figure increased by more than 60
offers compared with the result from the Re-
cruit Works Institute’s survey of 2011 gradu-
ates of 104.8 (*1).
Calculating “the number of job offers made and
accepted offers per 100 interviewed candi-
dates” shows that 18.7 job offers were made
for every 100 interviewed candidates, while
10.5 offers were accepted per 100 interviewed
candidates. Comparing these statistics with
those for 2013 graduates, for which the ratio of
job vacancies to job seekers was at its lowest
(*2), shows an increase in the number of job
offers by 7.8 from 10.9 and an increase in the
number of accepted offers by 3.3 from 7.2.
This reflects the recent “seller’s market” envi-
ronment and shows how companies are trying
to compensate for the potential refusal of job
offers by increasing the number of offers they
make.
Also, the number of declined job offers de-
creased by 2.7 from the previous year’s 76.0
to 73.3. As for the recruitment standards,
83.0% of companies responded that their stan-
dards were “the same as for 2016 graduates”,
while 8.2% indicated having “lower standards”,
and 6.2% responded having “higher stan-
dards”.
When asked what they had changed for 2017
graduate recruitment, 35.2% of companies re-
sponded that they “followed up after making a
job offer”. The specific ways in which they said
they followed up are shown in Graph 2 . The
most common was “prospective employee get-
togethers” at 79.4%. This was followed by
“regular contact by email and phone” (60.0%)
and “sending company newsletters and infor-
mation for prospective employees” (46.0%).
While some practices decreased compared to
the previous year, there was an 11.1-point in-
crease in ““regular contact by email and
phone”, up from 48.9% in the previous year.
Thus, we can see how more companies are
making detailed follow-ups with students. On
the other hand, 71.1% of companies said that
“recruitment-related manpower” was a chal-
lenge for 2017 graduate recruitment. Consider-
ing the work required in following up after an
offer, determining where to cut labor costs ap-
pears to be a challenging issue.
Rising number of official andunofficial job offers.
Overview of Recruitment and Job Hunting 2 Companies
Part2
Number of offers given and offers accepted per 100 expected hires1 Status of interaction with students after giving out offers and unofficial offers2
12

Company
Company
CASE4
Specialty companyScreening start date: March
CASE5
Food companyScreening start date: March
2016 Mid-March Company information
sessions (until July) Late March Group discussions Early April First-round interviews Social gatherings Early May Final interviews Mid-May Unofficial offers given (until early September)
From March 2016 Joint company information sessions, on-campus information sessions, onsite company information sessions
Early May Entry sheet deadline June Interviews (1–3 times) Unofficial offers given
Main recruiting processes
Main recruiting processes
Company location: Aichi Prefecture Company size : 1,000+ employees Results of 2017 graduate recruitmentRecruitment target: Approx. 200 peopleOffers given: Approx. 380 offersExpected number of new hires: Approx. 200 people(47% offer refusal rate)
COMPANY DATA
Company location: Aichi Prefecture Company size : 1,000+ employees Results of 2017 graduate recruitmentRecruitment target: 160 peopleOffers given: Approx. 220 offersExpected number of new hires: Approx. 155 people(30% offer refusal rate)
COMPANY DATA
For 2017 graduate recruitment, we focused on
two points: moving earlier than other companies
and conducting a more thorough follow-up with
students who were given offers. Regarding the
former, we estimated that companies and stu-
dents would start to act sooner given the change
in the employment selection schedule. Our re-
search showed that many companies would start
their information sessions toward the end of
March, so we chose to start ours from the middle
of March. As a result, especially in the first ses-
sion, we had strong participant numbers and
were able to secure good applicant numbers.
Also, to start interacting with students at an early
stage, we conducted one-day internships in the
summer and the winter for the first time.
To follow-up with students who are given offers,
every year, we assign one recruiter per student to
For 2017 graduate recruitment, following the
change in the recruitment selection schedule, and
considering the tendency in recent years for stu-
dents to participate in internships and to start re-
searching companies early, we proactively partici-
pated in career seminars (organized by HR
companies, etc.) from November 2015 to Febru-
ary 2016 to encourage early recognition and
awareness of our company. We also conducted
our annual summer, fall, and winter internships as
usual. Although the direct effect of our increased
participation in career seminars on recruitment is
difficult to measure, we were able to offer infor-
mation to more students based on their personal
career and working preferences.
However, a remaining issue is that among the
students who have received offers, the number of
internship participants consequently decreased to
a third of that for 2016 graduate recruitment. We
communicate regularly with them by phone and
give them advice on their job search. Given the
recent acceleration in the seller’s market and the
increase in the possibility of declined offers this
year, we carried out the follow-up even more thor-
oughly than normally.
As a result of these activities, we managed to
achieve our recruitment target. In anticipation of
the continuing seller’s market, we will continue to
try to move earlier than other companies and
conduct thorough follow-ups with students for
2018 graduate recruitment. Further, we plan on
increasing the number of locations for our infor-
mation sessions. An issue for us has been the in-
sufficient recruitment of candidates that can be
assigned outside the areas where our information
sessions are held (Tokyo, Osaka, Aichi, Fukuoka,
and the neighboring regions) despite us having
locations around the country. First, we plan to
host our events in three more locations, and we
will also increase our number of recruiters.
consider the reason for this to be that we were
not able to offer information to deepen students’
understanding of our company or increase their
desire to work for us and were also not able to
convey a sufficient impression of the career pos-
sibilities we have to offer. With the earlier com-
mencement of the selection process by 2 months
for the 2017 graduate recruitment season, the
period of recruiting operations was shortened,
and there was not enough time to continue offer-
ing information to participants after the internships
were concluded.
Given the time and resource constraints, we are
considering what PR and communication mea-
sures we can take to more effectively convey the
impression of a career with us and our working
style and better match the desires of the students.
Assigned one recruiter to each student, making regular contact after an offer is made.
Built early recognition by increasinginteractions with students before February.
Carryied out information sessions one step ahead of other companies with thorough follow-ups after giving offers
Aimed to gain early recognition by participating incareer seminars.
13

70
60
50
40
30
20
10
0 Visits to alum
ni and other former
student employees (num
ber of people)
Contact w
ith recruiters (number of
people)
Pre-entries (num
ber of companies)
Participation in joint inform
ationsessions/sem
inars hosted byuniversities (num
ber of times)
Participation in joint inform
ationsessions/sem
inars not hosted byuniversities (num
ber of times)
Participation in individual com
panyinform
ation sessions/seminars
(face-to-face) (number of com
panies)
Participation in individual com
panyinform
ation sessions/seminars
(online) (number of com
panies)
Subm
ission of entry sheets and otherscreening docum
ents (number of
companies)
Interviews and other face-to-face
screening processes
4.45
5.23
37.91
5.08 5.43
9.39
15.22 16.23
3.19
On average,
2.22 companies
55% of candidates received offers frommultiple companies
Around 4 in 10 students are expected toenter their initial first-choice companies
Student
Student
“Initial first choice” hires are in-creasing year-on-year. However, “intial second choice or lower” hires decreased by 3.5 points from the previous year, while “not initial choice” increased by 3 points.
The share of students who received offers from multiple companies was 55.0%. This increased from 54.5% in 2016 and 50.0% in 2015 along with the average num-ber of offers given.
1 companies
Initial first choice
Initial second choiceor lower
2 companies
4 companies
5 companies More than6 companies
3 companies
45.0%
40.9%
31.7%
25.2%
5.9%
5.5%4.1%
14.2%
Not initialfirst choice
27.4%
Student
All categories decreased, with the exception of visits to alumni and other employees (+0.12 people). Compared to entry sheet submission (-1 .40 companies) and interview participation (0.36 companies), the decrease in pre-entries and individual company in-formation session/seminar participation was large.
Job hunting activities fell, with the exception of alumni visits
* Among students who carried out each process / Numerical Answer
As of December 2016, 87.7% of students
seeking employment at private companies
were able to secure positions with private or
public employers. This represents a 0.9-point
increase compared to 86.8% for 2016 gradu-
ates (as of December 2015) and a 3.2-point in-
crease compared to 84.5% for 2015 graduates,
which is high compared to the previous 5
years. In addition, the ratio of students who
had not decided on a career path was 6.2%.
This represents a decrease by 1.8 points com-
pared to 8.0% for 2016 graduates and is the
lowest proportion in the past 5 years.
Of the students who were successful in finding
an employer, 40.9% found employment at their
first-choice company, a 0.5-point increase from
the previous year (Graph 1 ). However, the
share of students who found employment at
companies they did not originally intend to
work at increased by 3.0 points compared to
the previous year to 27.4%.
Job seekers received offers from an average
of 2.22 companies, a figure which has risen for
4 consecutive years since 2014 graduate re-
cruitment (Graph 2 ). The share of students
who received job offers from multiple compa-
nies was 55.0%, representing the majority of
students, as in the previous year. Looking at
the past 5 years, the proportion of students re-
ceiving only one offer of employment has been
decreasing year on year, while the share of
those receiving three or more offers has been
increasing. Of the students that received one
or more offers, 57.1% continued their job
search even after receiving their first offer. The
most common reason for this was “to under-
take job selection for a more desirable compa-
ny”, which was given by 68.4% (multiple re-
sponses were accepted). As in the case of the
student who received an offer of employment
at a developer as described on page 17, some
students enter the selection process and re-
ceive an offer at another company prior to un-
dergoing the selection process at their first-
choice company. Meanwhile, others who are
not satisfied with an unofficial offer from one
company may decide to challenge themselves
by undergoing the selection process for a more
desirable company.
Looking at the average number of job hunting
processes carried out by students, visits to alumni
and other employees increased slightly, but other
processes showed falling numbers (Graph 3 ). In
particular, the average number of pre-entries de-
creased by around 5 companies compared to the
previous year (from 42.89 to 37.91); the number
of individual company briefings and seminars at-
tended decreased by 2.5 companies (from 17.72
to 15.22); and the number of online individual
Overview of Recruitment and Job Hunting 3 StudentsWhat changes have there been in the job offer situation and the activity levels of students? What are the criteria for choosing companies, and what are the costs involved in job hunting?
Part2
87.7% of job seekers foundan employer.
Job hunting activities by studentsare on a declining trend.
number of offers from companies2
Candidates’ opinions of their prospective employerswhen first starting job hunting
1 Average actual number of job hunting processes performed by students3
2016 graduates 40.4%2015 graduates 37.4%
* Among students who had decided on a company / Single Answer
* Among students who received offers as of December 2016 / Single Answer
2016 graduates2.17 companies
2015 graduates2.02 companies
2015 graduates 2016 graduates 2017 graduates
14

(%)
21.8
17.2
22.7
29.4 9.6
19.1 11.3
19.6 15.4
16.6 19.3
29.623.4
17.724.020.8
30.8 10.226.9
27.119.5
34.219.3
23.8 14.727.3
18.224.321.5
11.5 13.7
21.4
9.2
14.5
16.1
Travelling from Northern Kanto to Tokyo alone cost close to 50,000 yen
I kept costs down by self-studying for half of the civil servant exam
Offer from a train company / Literature student / Kanto region
National civil servant offer / Humanities student / Northern Kanto region
I go to a university in Northern Kanto, and travelling to Tokyo for company informa-tion sessions or interviews would cost 3,000 yen each time for the return trip, so I spent around 40,000–50,000 yen on transport plus 20,000–30,000 on food and drink, around 10,000 yen in total. In my third year of university, I heard from senior students at employment seminars that I would need money for job hunting, so it was good that I increased the number of shifts at my part-time job and saved mon-ey until March.
I started studying from my third year to be a general or specialist national civil ser-vant. It cost about 120,000 yen to take all of the campus civil service exam prepara-tion courses, so I decided to take only some of them. I also bought some ques-tionnaire booklets and taught myself. But even then, in general, for the mock test fees, etc. I had to pay around 70,000–80,000 yen. In the end, I took around six civil service examinations, including those to become a local government official, but was only able to pass the first-round exam for one. I had the feeling that I wasn’t able to study enough.
Student
* Among students who spent at least ¥1 / Numerical Answer
Around 5 in 10 students spent over ¥100,000 on job hunting
Total
Hokkaido/Tohoku
Kanto
Chubu
Kinki
Chugoku/Shikoku
Kyushu
Overall, less than 25% of students spent over ¥50,000 on accommodation costs. However, the share was around 40% for students from Kyushu. Meanwhile, among the students who spent money on job hunting support services, 41.9% was from Kanto.
The highest share was for “¥100,000–¥199,999” at 29.6%. The second-highest share was for “¥50,000–¥99,999” at 23.4%, while 13.7% of students used more than ¥300,000.
Transport costs ¥49,277 (93.8% usage rate)
Clothing costs ¥40,813 (85.7% usage rate)
Accommodation costs ¥29,918 (23.1% usage rate)
Food and drink costs ¥14,179 (79.7% usage rate)
Overalltotal cost ¥170,960
* Subject of average cost calculation : Students who used at least ¥1 for each category / Numerical Answer* Subject of usage rate calculation : Students who used at least ¥1 / Single Answer* The figures shown are the averages for each category so their totals do not equate to the “total cost”.
Documents-related costs ¥6,924 (60.9% usage rate)
Job hunting support services ¥32,015 (4.6% usage rate)
Civil servant exam preparation costs ¥77,441 (14.6% usage rate)
Skill improvement costs ¥28,483 (10.9% usage rate)
company briefings and seminars attended de-
creased by approximately 1 company (from 4.38
to 3.19). This indicates a substantial decrease in
contact with companies being performed at the
information gathering phase. It should also be
noted that the number of companies to which
documents, such as entry sheets, were submitted
decreased by 1.4 companies compared to the
previous year (from 17.63 to 16.23).
As some companies started selecting appli-
cants soon after beginning PR activities, it is
possible that some students decide on a pro-
spective employer before gaining a sufficiently
broad perspective. However, as the number of
offers of employment per person is rising, we
can see that the number of job offers students
receive is increasing, even with the same
amount of job hunting activities as before.
Around how much are the costs for job hunting?
On average, ¥170,960 is spent for all activities
(Data 4 ). However, this amount varies by re-
gion. The highest was for the Hokkaido and To-
hoku area, with a figure of ¥229,343, and the
lowest was Chubu at ¥155,362, a difference of
over ¥70,000. After Hokkaido and Tohoku, the
next highest was Kyushu, where ¥205,800 was
spent. Looking at the cost distribution (Graph 5
), 54.8% of students spent ¥100,000 or more,
while 25.3% spent ¥200,000 or more. By region,
the proportion of people in Hokkaido/Tohoku
and Kyushu who spent ¥200,000 or more was
significantly higher at close to 40% (39.1% in
Hokkaido/Tohoku, 37.6% in Kyushu).
One of the largest costs is thought to be trans-
portation. The average amount spent on trans-
portation costs was highest in Chugoku and
Shikoku, at ¥71,461. The next highest were
Hokkaido and Tohoku at ¥70,748 and Kyushu
at ¥68,222, with the lowest being Kanto
(¥36,919), a difference of between ¥30,000
and ¥35,000. Around 30% of people in these
regions spent ¥100,000 or more on transporta-
tion costs (34.6% in Chugoku and Shikoku,
35.1% in Hokkaido and Tohoku, 29.0% in Ky-
ushu). This shows the large transportation
costs are borne when traveling to metropolitan
areas for company selection procedures.
Other items for which there were large differ-
ences by region were civil servant examination
preparation fees and skills improvement costs.
Civil servant examination preparation fees
were the highest in Hokkaido and Tohoku at
¥98,385, then in Kyushu at ¥97,533, and were
the lowest in Chubu at ¥44,963, a difference of
approximately ¥50,000. Skills improvement
costs were highest in Hokkaido and Tohoku at
¥76,211 and lowest in Kyushu at ¥12,459, a
difference of approximately ¥65,000.
Average amount spent on allactivities is approximately ¥170,000
Amount spent on job hunting (average costs)4
Overall total amount spent on job hunting (by region)5
¥1–¥49,999 ¥50,000–¥99,999 ¥100,000–¥199,999 ¥200,000–¥299,999 ¥300,000+
15

0 10 20 30 40 50(%)
1.41.0
2.52.8
4.01.5
4.713.4
4.87.4
4.95.0
6.66.1
7.39.8
16.716.1
18.117.4
28.919.5Industry
Work location
Job category
Job stability
Salary
Relation with area of studyat university/grad school
Working hours/holiday time
whether there are people withwhom I would like to work
Reputation
Employment system
Company size/structure
Student
Student
Fourth place was “I could see myself working at that company” (30.4%), while fifth was “they tried hard to understand me” (27.4%). By gender, female respon-dents had a reversed order for the second and third-placed items.
2nd There was enough information to determine whetherthe company would be a good match for me.
3rd I met employees that interested me.
1st There were many places and opportunitiesto gain an understanding of the company,such as via its website, brochures, andinformation sessions
* Among students that had interactions with prospective employers after receiving offers / Multiple Answer
The amount of information received and gaining a concrete workingimpression had an influence on choosing a prospective employer
Employment offer ceremonies and social gatherings for offerrecipients increased candidates’ desires to enter a company
StudentAt the start of job hunting, around 3 in 10 students placed greatest importance on “type of industry”
* Among students who had decided on a company or were continuing job hunting / Single Answer * Among student with confirmed job places / Multiple Answer
Fourth place was “regular contact by e-mail and phone” (9.9%), while fifth place was “group training” (9.4%). By region, categories that placed third and fourth in Kanto were ranked first and second in Chubu.
2nd
3rd
1st
“Whether there are people with whom I would like to work” increase consider-ably for humanities students (from 5.9% to 15.7%). It also increased for sci-ence students (from 2.5% to 9.5%) but was low compared to “job stability” (10.9%).
What criteria do students prioritize when selecting
companies? We asked students about their most
important criteria for selecting companies at the
time of beginning their job hunting activities as
well as in December, three months prior to gradu-
ation. The results show that respondents placed
priority in the order of “industry”, “work location”,
then “job category” for both periods (Graph 1 ).
Looking at the differences in responses when
starting job hunting activities and in December,
the highest increase was for “whether there are
people with whom I would like to work”, which
saw an 8.7-point increase (from 4.7% at the start
of job hunting to 13.4% in December). However,
“industry” decreased by 9.4 points (from 28.9% to
19.5% in December). When more detailed op-
tions were given, the criteria given highest em-
phasis when looking for potential companies were
“good benefits, such as in terms of salary and
welfare” (49.1%), “work location” (47.9%), “being
able to do the work that I would like to do”
(41.2%), and “having stable employment (no con-
cerns of being made unemployed)” (37.7%) (mul-
tiple responses were accepted).
Respondents were also asked about the mea-
sures companies had taken that had influenced
their intentions to join them. The most common
response was, “there were many places and op-
portunities to gain an understanding of the com-
pany, such as via its website, brochures, and in-
formation sessions” at 42.2% (Data 2 ). The
next most common responses were, “There was
enough information to determine whether the
company would be a good match for me”
(35.0%) and, “I met employees that interested
me” (34.1%). Meeting employees that job seek-
ers wanted to work with or those that interested
them appeared to have an effect on the deci-
sions of students when deciding which company
to join. It should be noted that the most common
responses provided by students in terms of the
information they most wanted to learn during
their job hunting activities were “specific job de-
scriptions” (66.4%), followed by “work location”
(49.4%) and “starting salary” (43.3%) (multiple
responses were accepted).
The proportion of students who interacted with
the company they planned to join after receiving
an offer of employment was 84.4%, an increase
by 2.1 points from the previous year. Such inter-
actions included “employment offer ceremonies”
(71.9%), “social gatherings for offer recipients”
(63.0%), “requests for the submission of em-
ployment offer acceptance letters” (50.8%),
“regular contact by email and phone” (38.0%),
“group training” (22.4%), and “invitations to in-
ternal company events” (20.0%) (multiple re-
sponses were accepted). Of these, participating
in an employment offer ceremony provided the
most motivation for students (Data 3 ).
Important criteria when selecting companies include industry, location, and position.
Overview of Recruitment and Job Hunting 3 Students
Part2
Highest priorities when choosing a company1 Influencial measures taken by prospective employers2
Influential interactions with the prospective employer that motivatedyou to enter the company
3
When starting job huntingIn December
41.1%Employmentoffer ceremonies
38.9%
11.5%
Social gatherings for offer recipients
Requests for the submission of employment offer acceptance letters
50.8%
35.0 %
34.1 %
16

May 2015Participated in joint company information ses-sions to gain information on internships.
August, September 2015Participated in internships at 2 companies (each 5 days). Also participated in an internship at a developer in February 2016.
March 2016Start of entry sheet submissions. Interviews also started in late March. Entry sheet submissions peaked in late April, with submissions to around 40 companies.
April 2016Received unofficial offers from 1 company in mid-April and from 4 companies in May. Coincid-ed in May with company “meetings” and “job matching”.
June 2016Interviews with 15 companies over 3 days start-ing 1 June. Received unofficial offers from 4 companies and an unofficial offer from the first-choice developer. Concluded job hunting.
Job hunting schedulees
August, September, December 2015Participated in internships at a securities com-pany (5 days) and 2 shipping companies (1 day each). Shipping industry became first choice.
January–February 2016To avoid the risk of restricting job search to only shipping companies, underwent the screening process for consulting firms, but unsuccessful for all.
From March 2016While applying to first-priority shipping compa-nies, also applied to think tanks and for positions as a systems integrator. Unsuccessful for all shipping companies.
Late May 2016From information sessions in March, through Q&A sessions (several times), entry sheets, on-line tests, recruiter interviews, HR interviews, and director interviews, received an unofficial of-fer in May.
Job hunting schedulees
Student
Student
CASE3
Scheduled to join developerEngineering department
CASE2
Scheduled to join think tankEconomics department
I began my job search in August of my third year
of university. My seniors and friends had told me
that I should do an internship, so I participated in
an internship program at a securities company
that I was relatively interested in and that didn’t
require screening. The 5-day program comprised
an introduction into securities and basic econom-
ics, but it was disappointing as I already knew the
content.
After that, I did some self-analysis and started to
realize that I wanted to make a good salary and
take part in broader work. I participated in intern-
ships at two shipping companies. They were held
in September and December, both as 1-day pro-
grams. I learned for the first time how shipping
businesses work and was very satisfied with the
internships.
However, because shipping companies are popu-
lar among students and have low employment
I aspire to be a developer because I want to take
part in planning buildings and cities. I applied to
general trading companies as well as rail and
shipping companies, ultimately receiving unoffi-
cial job offers from 9 companies. I applied to
nearly 15 real estate companies but found out
that the students I frequently saw at interviews
also had unofficial offers from multiple developers
and that the offers were usually given out to the
same group of people.
The difficult aspects during my job search were
scheduling interviews and meeting the demands
from a prospective employer. My interviews were
concentrated during 1–3 June, so it was difficult
to coordinate my schedule. I also struggled to
meet the demands from a prospective employer
that had given me an unofficial offer in May. They
requested a recommendation letter from a profes-
rates, I decided to also apply for consulting com-
panies. I did this because I wanted to work with
intelligent people and in an environment where I
could challenge myself. However, I unfortunately
failed during the process.
After March, I applied to think tanks as I thought
the work would be similar to consulting. At the
same time, I applied to work as a systems inte-
grator in the hope of doing work where I could
think independently. As predicted, the shipping
companies rejected me at the application stage
or during the first interview, but I received an un-
official offer from a think tank in late May and
concluded my job search.
sor, probably to secure my commitment to enter-
ing the company. My university career center
would not deal with my request and advised that
it was better to approach my department. Howev-
er, my professor was not able to issue a follow-up
recommendation letter. I notified the company
who understood the situation. Another complica-
tion was that some other companies who I had
received unofficial offers from wanted me to visit
them on 1 June, i.e., during the interview period
for other companies.
Although the interviews were concentrated during
1–3 June, I was busy during the 2 weeks from
mid-to-late May communicating with companies. I
was frequently called in for “talks” and “job-
matching” and had the opportunity to talk with
regular employees and personnel. Although I was
not told that these meetings were part of the
screening process, I of course treated them as an
interview, and there were some companies that
stopped contacting me afterwards.
My first choice was a popular industry, so I diversified my options.
Interviews were concentrated during1–3 June. In 3 days, I interviewed with15 companies.
Widened my industry preferences while job hunting. Received an unofficial job offer in late May.
A company that gave me an unofficial offer inMay through an open application asked me to submit a letter of recommendation.
17

11.218.6 46.536.3 29.415.2 11.022.7
1.97.1
8.3
4.8
13.916.6 45.939.5 30.013.8 9.021.8
1.2
13.820.6 46.439.8 30.415.3 8.819.5
0.7
Company
Company Company
Of the su rveyed compan ies , 62.0% said they were either “ex-tremely satisfied” or “fairly satis-fied”. The share of those who an-swered “ fa i r ly d issat isf ied” or “ext remely d issat is f ied” com-prised 16.2%. This was an in-c rease f rom 15 .5% fo r 2016 graduates and 10.8% for 2015 graduates.
Of the surveyed students, 80.8% were “very satisfied” or “some-what sa t is f ied” . The to ta l fo r “somewhat dissatisfied” and “very dissatisfied” was 3.8%, showing a slight increase from 3.3% for 2016 graduates, but was low compared to 5.5% for 2015 grad-uates.
62.0% 80.8%
Companies satisfied with their future entrants are on a declining trend Student
8 in 10 students were satisfied with their prospective employers
Companies satisifed with the quality of their expected recruits also decreased
Satisfaction with the number of recruits declined
The total for “extremely satisfied” and “fairly satisfied” was 2.1 points lower than for 2016 graduates and 2.4 points lower than for 2015 graduates.
The total for “extremely satisfied” and “fairly satisfied” was 1.1 points lower than for 2016 graduates and 5.4 points lower than for 2015 graduates.
(%) (%)
Very satisfied Somewhat satisfied Neither satisfied nor dissatisfiedSomewhat dissatisfied Very dissatisfied
Very satisfied Somewhat satisfied Neither satisfied nor dissatisfiedSomewhat dissatisfied Very dissatisfied
2017 graduates
2016 graduates
2015 graduates
2017 graduates
2016 graduates
2015 graduates
Satisfied, total
Dissatisfied, total
57.7% 12.9%
59.8% 10.2%
60.1% 9.5%
Satisfied, total
Dissatisfied, total
55.0% 29.9%
56.1% 30.1%
60.4% 24.3%
The present survey shows emerging gaps be-
tween the reported levels of satisfaction be-
tween companies and students, and the evalu-
ation of students by companies.
We look first at the levels of satisfaction. 62.0%
of companies responded that they were either
“very satisfied” or “somewhat satisfied” with
their future entrants (Data 1 ). This represents
a drop of 2.7 points compared to the data for
2016 graduates and is the lowest figure in the
last 5 years. Further, 16.2% of companies re-
sponded that they were “somewhat dissatis-
fied” or “very dissatisfied”, an increase by 0.7
points from the previous year.
In contrast, 80.8% of students reported that
they were “very satisfied” or “somewhat satis-
fied” with their future employers. Although the
figure fell slightly from the previous year, it re-
mained at a high level (Data 2 ).
We now look at the satisfaction levels of com-
panies for future entrants with regards to quali-
ty and hiring numbers. 55.0% responded that
they were either “very satisfied” or “somewhat
satisfied” in terms of the number of future en-
trants, while 57.7% responded that they were
“very satisfied” or “somewhat satisfied” in
terms of their quality (Graphs 3 , 4 ). Looking
at the relationship between quantity and quality
satisfaction levels shows a tendency for quality
satisfaction to fall whenever quantity satisfac-
tion falls. However, out of all the companies
that said they were “somewhat dissatisfied” in
terms of quantity, 39.7% also said they were
“somewhat satisfied” in terms of quality. Of all
the companies that said they were “very dis-
satisfied” in terms of quantity, 34.6% also said
they “neither satisfied nor dissatisfied in terms
of quality. This suggests that they are not re-
sorting to pursuing unsatisfactory recruits sim-
ply to meet hiring targets.
Next, we look at the evaluations of students
(Graph 5 ). We asked companies to evaluate
student applicants, and the students to evalu-
ate themselves, based on seven criteria. These
included “motivation for work”, “self-analysis”,
and “company research”. The results show that
compared to the previous year, the number of
companies responding with either “fully suffi-
cient” or “somewhat sufficient” fell across all
criteria. The number of students that gave a
“fully sufficient” or “somewhat sufficient” re-
sponse fell for all criteria except “academic
ability”. Meanwhile, although students’ self-
evaluations for all criteria have been improving
in the last 5 years, companies have started to
evaluate students more critically in the last 2
years. These results demonstrate the growing
gap between the two groups.
The Gap Between Companies and StudentsWhat kinds of gaps exist between companies and students for recruitment and job hunting?
Part2
Student self-assessments haveimproved, while the evaluation ofstudents by companies has worsened.
Satisfaction towards future entrants1
Satisfaction with the number of expected recruits3 Degree of satisfaction with the quality of expected recruits4
Satisfaction towards prospective employer2
Satisfied Satisfied
* All companies / Single Answer
* All companies / Single Answer * All companies / Single Answer
* Among students who had decided on a company / Single Answer
2016 graduates 64.7%2015 graduates 68.0%
2016 graduates 81.7%2015 graduates 79.9%
18

(%)60 40 20 20 40 60(%)0 0
58.4
61.9
59.4
52.0
51.7
42.3
42.5
38.3
39.8
35.7
41.2
41.9
40.2
31.8
29.1
40.5
41.0
36.4
31.4
27.5
56.6
58.8
59.3
66.9
62.3
36.0
40.3
39.3
39.8
38.2
25.6
27.4
26.4
25.1
21.9
29.6
34.5
34.5
33.0
30.5
2017 Desire to w
ork
2017
2016 2016
2015 2015
2014 2014
2013 2013
2017 Self-analysis
2017
2016 2016
2015 2015
2014 2014
2013 2013
2017 Research on job/type of w
ork
2017
2016 2016
2015 2015
2014 2014
2013 2013
2017
Com
pany research
2017
2016 2016
2015 2015
2014 2014
2013 2013
Company–Student
-1.8
-3.1
-0.1
14.9
10.6
-6.3
-2.2
1.0
0.0
2.5
-15.6
-14.5
-13.8
-6.7
-7.2
-10.9
-6.5
-1.9
1.6
3.0
CompanyCASE6
Engineering companyScreening start date: March
March 2016 Company information sessions (until June)
Apptitude testing, first-round interviews
Final interviews Early 2016 Unofficial offers given
Main recruiting processes
Company location: Shizuoka Prefecture Company size : Fewer than 300 employees Results of 2017 graduate recruitmentRecruitment target: 2 peopleOffers given: 4 offersExpected number of new hires: 2 people(50% offer refusal rate)
COMPANY DATA
Company Student
The largest gaps in the evalua-t ions for companies and stu-dents for the 2017 graduate re-c r u i t m e n t s e a s o n w e r e f o r “research on job/type of work” ( 1 5 . 6 - p o i n t d i f f e r e n c e ) a n d “company research” (10.9-point difference). For both, the evalu-ations by companies were lower than those by students. In addi-t i on , t he su rvey a l so asked about “academic ability”, “vision of the future”, and “industry re-search”. For 2017 graduate re-cruitment, “satisfied” or “fairly satisfied” were chosen by 49.4% of companies and 42.6% of stu-dents for “academic ability”, a 6.8-point difference. The same options were chosen for “vision of the future” by 25.9% of com-panies and 35.8% of students, a 9.9-point difference. Meanwhile, the resu l t s fo r “ i ndus t ry re -search” were 26.1% for compa-nies and 34.5% for students, an 8.4-point difference.
While student self-evaluations are rising year-on-year, company evaluations of students have fallen for two consecutive years
* All companies/all students. “Satisfied, total” comprises the total companies/students that answered “satisfied” or “fairly satisfied”.
The ratio of declined job offers rose for the 2017
graduate recruitment season. It seems that group
of students who would have normally been de-
clined by major companies and accepted by our
company in previous years were able to secure
offers from major companies. Perhaps major
companies are lowering their hiring criteria.
Therefore, our company also had no choice but
to give unofficial offers to students who would not
have normally received offers in previous years.
However, I think that hiring a group of people pro-
duces a sort of cohort awareness that can keep
resignation levels low, so I believe that hiring a
certain number of people is important, including
high school graduates.
The lack of recruitment personnel is a problem for
our company. There are no dedicated positions
for recruitment, and employees on site are too
busy so it is difficult to request or arrange recruit-
ment activities and information sessions. In addi-
tion, the drive from our company to the nearest
major train station takes 20 minutes, so when we
host information sessions, we usually only get a
turnout of 1 or 2 students. However, if we can get
student to come, they can see the quality of our
factory’s facilities and our working environment,
so I think it is important to keep reaching out to as
many students as possible.
Specifically, I plan to increase efforts by creating
greater connections with universities. Recommen-
dations from university teachers can have a strong
influence on recruitment for students from techni-
cal backgrounds. We accept long-term internships
through universities, and our employees visit the
local universities they have graduated from to pro-
mote recruitment. I hope to also strengthen con-
nections with other universities by looking in the
next few years into increasing the number and fre-
quency of visits as much as possible.
Applicants who we would have been able to hire in previous years chose largecompanies instead.
We had no choice but to lower the hiring criteria to secure personnel.
Company evaluations of student applications and student self-evaluations5
19
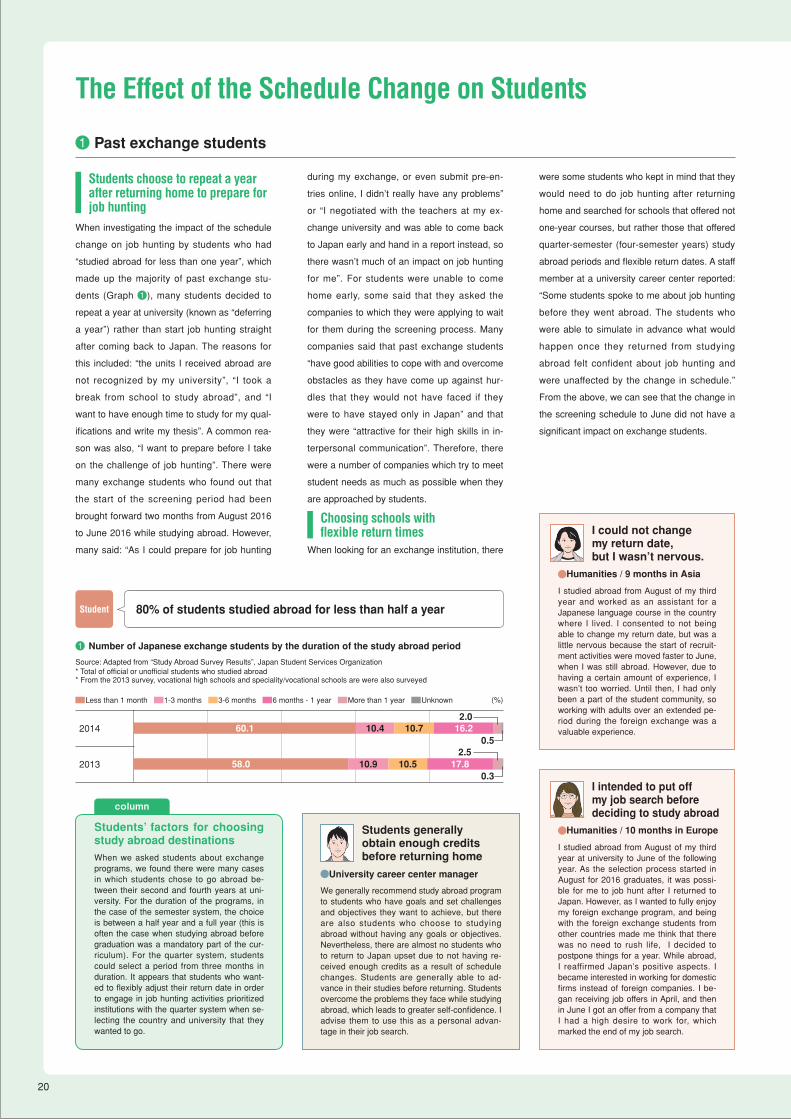
(%)
60.1
58.0
10.710.4
17.810.510.9
16.20.5
2.0
0.3
2.5
Less than 1 month 1-3 months 3-6 months 6 months - 1 year More than 1 year Unknown
Student
The Effect of the Schedule Change on Students
80% of students studied abroad for less than half a year
I could not changemy return date, but I wasn’t nervous.
Students generally obtain enough creditsbefore returning home
I intended to put offmy job search beforedeciding to study abroad
Humanities / 9 months in Asia
University career center manager
Humanities / 10 months in Europe
I studied abroad from August of my third year and worked as an assistant for a Japanese language course in the country where I lived. I consented to not being able to change my return date, but was a little nervous because the start of recruit-ment activities were moved faster to June, when I was still abroad. However, due to having a certain amount of experience, I wasn’t too worried. Until then, I had only been a part of the student community, so working with adults over an extended pe-riod during the foreign exchange was a valuable experience.
We generally recommend study abroad program to students who have goals and set challenges and objectives they want to achieve, but there are also students who choose to studying abroad without having any goals or objectives. Nevertheless, there are almost no students who to return to Japan upset due to not having re-ceived enough credits as a result of schedule changes. Students are generally able to ad-vance in their studies before returning. Students overcome the problems they face while studying abroad, which leads to greater self-confidence. I advise them to use this as a personal advan-tage in their job search.
I studied abroad from August of my third year at university to June of the following year. As the selection process started in August for 2016 graduates, it was possi-ble for me to job hunt after I returned to Japan. However, as I wanted to fully enjoy my foreign exchange program, and being with the foreign exchange students from other countries made me think that there was no need to rush life, I decided to postpone things for a year. While abroad, I reaffirmed Japan’s positive aspects. I became interested in working for domestic firms instead of foreign companies. I be-gan receiving job offers in April, and then in June I got an offer from a company that I had a high desire to work for, which marked the end of my job search.
Source: Adapted from “Study Abroad Survey Results”, Japan Student Services Organization* Total of official or unofficial students who studied abroad* From the 2013 survey, vocational high schools and speciality/vocational schools are were also surveyed
Students’ factors for choosing study abroad destinations
When we asked students about exchange programs, we found there were many cases in which students chose to go abroad be-tween their second and fourth years at uni-versity. For the duration of the programs, in the case of the semester system, the choice is between a half year and a full year (this is often the case when studying abroad before graduation was a mandatory part of the cur-riculum). For the quarter system, students could select a period from three months in duration. It appears that students who want-ed to flexibly adjust their return date in order to engage in job hunting activities prioritized institutions with the quarter system when se-lecting the country and university that they wanted to go.
column
2014
2013
When investigating the impact of the schedule
change on job hunting by students who had
“studied abroad for less than one year”, which
made up the majority of past exchange stu-
dents (Graph 1 ), many students decided to
repeat a year at university (known as “deferring
a year”) rather than start job hunting straight
after coming back to Japan. The reasons for
this included: “the units I received abroad are
not recognized by my university”, “I took a
break from school to study abroad”, and “I
want to have enough time to study for my qual-
ifications and write my thesis”. A common rea-
son was also, “I want to prepare before I take
on the challenge of job hunting”. There were
many exchange students who found out that
the start of the screening period had been
brought forward two months from August 2016
to June 2016 while studying abroad. However,
many said: “As I could prepare for job hunting
during my exchange, or even submit pre-en-
tries online, I didn’t really have any problems”
or “I negotiated with the teachers at my ex-
change university and was able to come back
to Japan early and hand in a report instead, so
there wasn’t much of an impact on job hunting
for me”. For students were unable to come
home early, some said that they asked the
companies to which they were applying to wait
for them during the screening process. Many
companies said that past exchange students
“have good abilities to cope with and overcome
obstacles as they have come up against hur-
dles that they would not have faced if they
were to have stayed only in Japan” and that
they were “attractive for their high skills in in-
terpersonal communication”. Therefore, there
were a number of companies which try to meet
student needs as much as possible when they
are approached by students.
When looking for an exchange institution, there
were some students who kept in mind that they
would need to do job hunting after returning
home and searched for schools that offered not
one-year courses, but rather those that offered
quarter-semester (four-semester years) study
abroad periods and flexible return dates. A staff
member at a university career center reported:
“Some students spoke to me about job hunting
before they went abroad. The students who
were able to simulate in advance what would
happen once they returned from studying
abroad felt confident about job hunting and
were unaffected by the change in schedule.”
From the above, we can see that the change in
the screening schedule to June did not have a
significant impact on exchange students.
Students choose to repeat a yearafter returning home to prepare forjob hunting
Choosing schools with flexible return times
Past exchange students1
Number of Japanese exchange students by the duration of the study abroad period1
20

Student
Student
The start of the screening activities period was changed from August (as it was for 2016 graduates) to June for 2017 graduate job hunting. It was thought that this change in the schedule by two months would cause an overlap between the civil servant examination period and the return or academic activities of students studying abroad. But what were the actual effects? Hideko Tokunaga, Research at the Research Institute for Graduate Recruitment, gathered information on these issues through interactions with companies, students, university officials.
Around 1 in 4 people gave up on acquiring their teaching license
The influence of the job hunting period in addition to the burden of acquiring a teaching license
I have no regrets in jobhunting despite an interrup-tion due to teacher training
I was confused by the screening period changingafter my application
Humanities department
Humanities department
I began job hunting from around March but had to stop for one month during teacher training in May. I was in contact with sev-eral companies during this time as well, and I was able to have some of them wait around three weeks for me by explaining my circumstances. However, some said that times outside their designated dates were out of the question. I really did regret going to teacher training when June came and I returned to job hunting without any job offers. However, I’m sure I would have regretted my actions if I had quit the teacher training as well. I was able to re-ceive an offer in the end, albeit late, so I believe everything worked out for the best.
I applied for teacher training at my alma mater in spring of my third year. I thought that everything would work out if I went to training in May and June and screening be-gan in August. After my application, in De-cember, the start of screening was moved up to June. However, I was unable to can-cel my teacher training for job hunting, and decided to participate in the training. I was hoping to receive at least one offer before training began, but things didn’t go as I had hoped. I became more and more nervous, and having to attend teacher training while hiding the fact that I was job hunting was emotionally difficult as well.
* Among students who considered obtaining a teaching license / Single AnswerSource: Survey on Job Hunting for 2017 Graduates (August survey)
Expected to receive license
Abandonedobtaining license
73.6%
26.4%
Students who wish to receive a teaching license should acquire all the necessary credits for the teacher training course from freshman year. While every year a certain number of students give up on ac-quiring these credits due to the large number of credits required as well as anxiety over their aptitude for teaching, the present survey found that the number of such students was 26.4%. In addition, be-cause the burden borne by instructors is large, there have been cas-es where schools remind students that the desire to become a teacher is a prerequisite. As such, students aiming to receive a teaching license without becoming a teacher end up spending their training period unable to honestly communicate their feelings.
* In my department, teacher training was in September of my fourth year and last year's job hunting started in Au-gust. I gave up on acquiring a teaching license because I thought it would get in the way of job hunting. (Humani-ties, Female Student)* Teacher training overlapped with the job hunting season. (Humanities, Male Student)* I gave up in my second year because I felt that getting a teaching license wasn’t something I could do with the carefree mindset of getting it just in case. (Humanities, Female Student)* I realized I was poorly suited to teaching after experiencing the teacher training. (Humanities, Male Student) * I thought that the content of the license I could acquire in my department didn’t suit me. (Humanities, Female Student)* I couldn’t receive the credits. (Humanities, Female Student)* It was difficult to receive the required credits while also taking regular classes. (Sciences, Male Student)* I was busy studying for the civil service examination and couldn’t do both that and the teacher training course at the same time. (Humanities, Female Student)
June, the month that job screening started for
2017 graduates, is when many students take
part in annual teacher training. What was the
effect of the overlap in the candidate screening
period by private companies and the teacher
training period on teacher training and job hunt-
ing? According to a survey carried out in August
2016, 8.6% of students (9.7% in humanities
and 6.7% in the sciences) “considered obtain-
ing a teaching license after entering university”,
of which 26.4% (25.0% in humanities and
30.3% in the sciences) abandoned this idea
(Graph 2 ). While the reasons for giving up in-
cluded those related to the overlap in the job
hunting and teacher training periods, such as,
“the teacher training and job hunting periods
overlapped” and “so I can dedicate myself to
job hunting instead”, other reasons that are not
related to the overlap were also given. Those
included students deciding to apply to private
companies rather than teaching, such as “I am
not suited to teaching” and “I gave up due to is-
sues related to the teaching units”. A staff mem-
ber at a university career center reported: “As
students that went on teacher training had to
apply to schools almost one year in advance
(meaning they would apply in summer/fall 2015
for training that would commence in spring
2016) it was very difficult to cancel this training,
and some students were panicked about put-
ting off job hunting. There were some students
who cancelled interviews to do their teacher
training. Some students came to speak to me
about how their training in June overlapped
with the screening period for their first choice of
job. Even though there were those who were
able to have the company change the dates
because they were on teacher training, there
were also those who could not have the dates
changed and had to give up.”
There were some students who managed to
balance teacher training and job hunting well.
These students anticipated that the job hunting
and teacher training periods would overlap and
prepared for job hunting early, meaning that
they were not significantly affected. They ex-
plained their circumstances to the companies
to which that they were applying and had the
dates adjusted. When students asked compa-
nies whether they could change certain dates,
some companies said it would be difficult de-
pending on the circumstances, but some said
that they “would adjust the dates as long as
they were within their recruitment periods”.
However, some companies also mentioned
that “they often were not approached about
this by students”, so we can infer that students
sometimes gave up before even reaching out
to companies.
Students experienced pressure dueto an overlap in the teacher training and job hunting periods
Some students were able to bemore flexible due to early preparation
Teacher’s license applicants2
State of plans to acquire a teaching license2
Reasons given by students who answered that they had given up on acquiring a teaching license2
21

March April May June July August September October November December
Late Early Mid Late Early Mid Late Early Mid Late Early Mid Late Early Mid Late Early Mid Late Early Mid Late Early Mid Late Early Mid Late
Civil servantRegular work(non-specialist)
Civil servantGeneral staff(university examination)
Civil servantSpecialist
Local civil servant 1Held two timesUpper column: First timeSecond column:Second time
Local civil servant 2
Local civil servant 3
Local civil servant 4
Civil servant A wide range of exam content, including group work and presentations, etc.
* Announcements of results except for “announcement of final results” are excluded
2016
プレ:プレゼンテーション、GW:グループワーク、ES:エントリーシート
Application period
Application period
Application period
Application period
Application period First-round examination(aptitude test, entry sheet)
Application period First-round examination(written exam, short essay)
First-round examination(written exam, short essay)
Third-round examination(interview)
Second-round examination(interview, aptitude test)
First-round examination(academic skill exam, presentation sheet production)
Second-round examination(presentation, interview)
Second-round examination(essay, interview)
Third-round examination(GW, interview)
Third-round examination(interview, GW)
First-round examination Announcement of final exam resultsSecond-round examination(written exam, personal profile)
First-round examination
First-round examination
First-round examination(academic skill exam, specialized exam)
Application period
Announcement of final exam results
Announcement of final exam results
Announcement of final exam results
Announcement of final exam results
Announcement of final exam results
Application period
Announcement of final exam results
Visit to govern-ment office
Visit to govern-ment office
Second-round examination(written exam, personal profile)
Second-round examination(written exam, personal profile)
Second-round examination(essay, personal profile)
University career center staff and affected stu-
dents often pointed out that those most affected
by the change in schedule were “students ap-
plying to both public and private entities”. So
exactly what effects did the schedule change
have? The employment examination for civil
servants (hereafter referred to as “the Civil Ser-
vice Exam”) is held at different times throughout
the year depending on the ministry and munici-
pality ( 3 ). In many cases, applications for the
exam open around April and the first exam
takes place around May. For students not only
applying to private companies but the civil ser-
vice too, this period is much busier for them
than for students only applying to one or the
other. It also depends on the content of the
exam for the field that they are applying to, but
in addition to the general knowledge and cur-
rent affairs related questions also set for private
companies, there are unique questions that de-
mand a high level of specialization and a deep
knowledge of specific subject matter, meaning
that a number of students also attend prepara-
tory schools for taking the exam. Even those
that study on their own have to spend significant
amounts of time studying. They then also have
to deal with the steps required for entry into a
private company, such as submitting pre-entries
and application sheets, attending company in-
troductory meetings, and alumni visits. The hur-
dles that stand in the way when preparing for
both the Civil Service Exam and job hunting for
private companies are high, and there are stu-
dents who are unable to put all their effort into
both. Despite these issues, there are two main
reasons why students decide to apply for both
career paths. The first reason is that even
though they are technically applying for both,
some students who hope to become civil ser-
vants rather than go into private employment
focus on attending preparatory schools, etc., to
prepare for the Civil Service Exam from their
first year and are wholly devoted to passing it.
However, assuming that they will not pass the
exam despite their preparation, they also carry
out job hunting at private companies. Also, see-
ing “a senior student who was concentrating
only on the Civil Service Exam fail” is making
students afraid to concentrate solely on the Civil
Service Exam. The second reason is because
of the pass or fail decision period. There are in-
stances when the pass or fail result of the Civil
Service Exam, including an interview, is decided
at the end of December or into the new year, so
those students who want to decide on their next
step before they graduate feel as if they cannot
rely on the exam alone. A counsellor at a uni-
versity career center spoke about how “if a stu-
dent has something that they want to do at a
private company, they cannot simply give up on
the path to private employment”.
Difficulties in deciding between public versus private
Students hoping to become civil servants3
Example of the 2016 schedule for civil servants and local civil servants3
The Effect of the Schedule Change on Students
22

March April May June July August September October November December
Late Early Mid Late Early Mid Late Early Mid Late Early Mid Late Early Mid Late Early Mid Late Early Mid Late Early Mid Late Early Mid Late
Civil servantRegular work(non-specialist)
Civil servantGeneral staff(university examination)
Civil servantSpecialist
Local civil servant 1Held two timesUpper column: First timeSecond column:Second time
Local civil servant 2
Local civil servant 3
Local civil servant 4
(People)
Some students wish to decline an offer depending upon the civil service examination result
Took the civil service examination into consideration before studying abroad
University career center staff
Humanities department
Individuals at regional universities such as our university often apply to become civil servants in addition to applying to private companies, so I feel that the change in the hiring period, causing the civil service examination and beginning of the selec-tion process to both come in June, is an issue that needs to be addressed. This puts a large burden on students who ap-ply to both positions and may lead to them only being able to half-focus on both ap-plications. What’s more, there have been students who wish to discuss declining an offer from a private company dependent upon the result of their civil service exami-nation in June. They had received re-quests from those private companies ask-ing them to send in their job offer acceptance letter as soon as possible and were troubled as to what they should do.
I studied abroad during my third year at university, but my desire to become a civil servant began before I left to go abroad. I arranged the timing of my study abroad to match up with the civil service exam in June and made sure I had time to study. The study abroad period was one year. I had all the credits I needed to graduate even though I studied abroad, but, as I had to study for the civil service examina-tion and write my graduation thesis as well, I wasn’t able to complete the aca-demic year. After returning home, I started going to a preparatory school for individu-als taking the civil service examination. The cycle of going back and forth from the preparatory school and information ses-sions for private companies was quite tir-ing, but, in the end, I was able to receive an offer to become a civil servant.
First-round examination(written exam, short essay)
Third-roundexamination(interview)
Second-round examination(interview, aptitude test)
Announcement of final exam results
Announcement of final exam results
Announcement of final exam results
Announcement of final exam results
Civil servant
Prospective civil servants face a difficult hurdle as 1 in 6 pass the exam
Source: National Personnel Authority *Adapted from pub-licly available data
2016 2015 2014
Applications (A) 91,013 86,452 91,759
First-round exam pass-es
24,464 24,077 21,331
Final exam passes (B) 14,414 14,098 12,534
Ratio (A/B) 6.31倍 6.13倍 7.32倍
column
After passing the final exam comes registration on the candidate list, a re-cruitment interview, the job offer, then recruitment. In the recruitment inter-view, the candidates qualifications etc. are confirmed, then an offer is given depending on the result. Hence, there are cases where candidates are not hired despite passing the final exam.
About the announcement of the final exam results for local civil servants
Students who are not only job hunting at pri-
vate companies but also preparing for and sit-
ting the Civil Service Exam and visiting minis-
tries, etc., can become fatigued. Students who
were aiming only for the civil service reported
that they spent a lot of time preparing for the
exam and were tired both physically and men-
tally. There were also some students who were
advised by preparatory schools that “if they
wished to go into the civil service, then they
should concentrate on civil service recruitment
only”, and as a result, decided to give up on
job hunting at private companies. There were
also those students who decided not to pursue
the civil service and dedicated themselves to
job hunting. In some cases, students consulted
with their university career centers about how
they had decided to concentrate on private
companies and had received job offers but
were “unable give up on the path to becoming
a civil servant”. Even when the careers center
counselor recommended accepting a job offer,
some students still decide to try once again for
the Civil Service Exam. Although universities
want students to pursue the paths that they
want to take, they also have the dilemma of
wanting students to accept job offers. Within
companies, there are some managers who
think: “Even after giving out a job offer, we
want students to keep searching until they find
an offer they are satisfied with. It doesn’t mat-
ter if they don’t accept our offer.” While the
number of job offer refusal is becoming an is-
sue among many companies, it is difficult to
maintain this kind of view. However, as the
change in the schedule has caused the over-
lap of job hunting periods for both private com-
panies and the civil service, some have said
there has been an increase in “trade-offs be-
tween the civil service and private companies”.
There are also those who accept job offers and
go to work at private companies, only to quit
later to retake the Civil Service Exam, being
unable to give up on it. Having students decide
on a path that they can fully accept seems to
be the way to prevent students from leaving
jobs early. In order to not have students leave
a halfway feeling by “having to give up either
path” because of the change in the recruitment
schedule, it is important for both students and
companies to think together about what the
necessary processes are when it comes to job
hunting and recruitment.
The necessity of a decision that does not feel like a trade off
(Combined total for graduate and undergraduate students)
Statistics on the Civil Service Examination4
Period of validity of the employment candidate list
According to the National Public Service Act, each government agency must select individuals from their employment candi-date (successful applicant) list, perform an employment interview for them, and, ac-cording to the results, decide whether or not to hire each individual. Each success-ful applicant must, in accordance with the yearly “Government Agency Visitation Rule,” take the employment interview for the government agency they wish to join. With the new employment examination, the period of validity for the employment candidate (successful applicant) list is, excluding a small portion of the exams, three years. This makes it possible for candidates to pass the exams, go on to enter and complete graduate school or serve a full period as a legal apprentice, and still be hired.
23
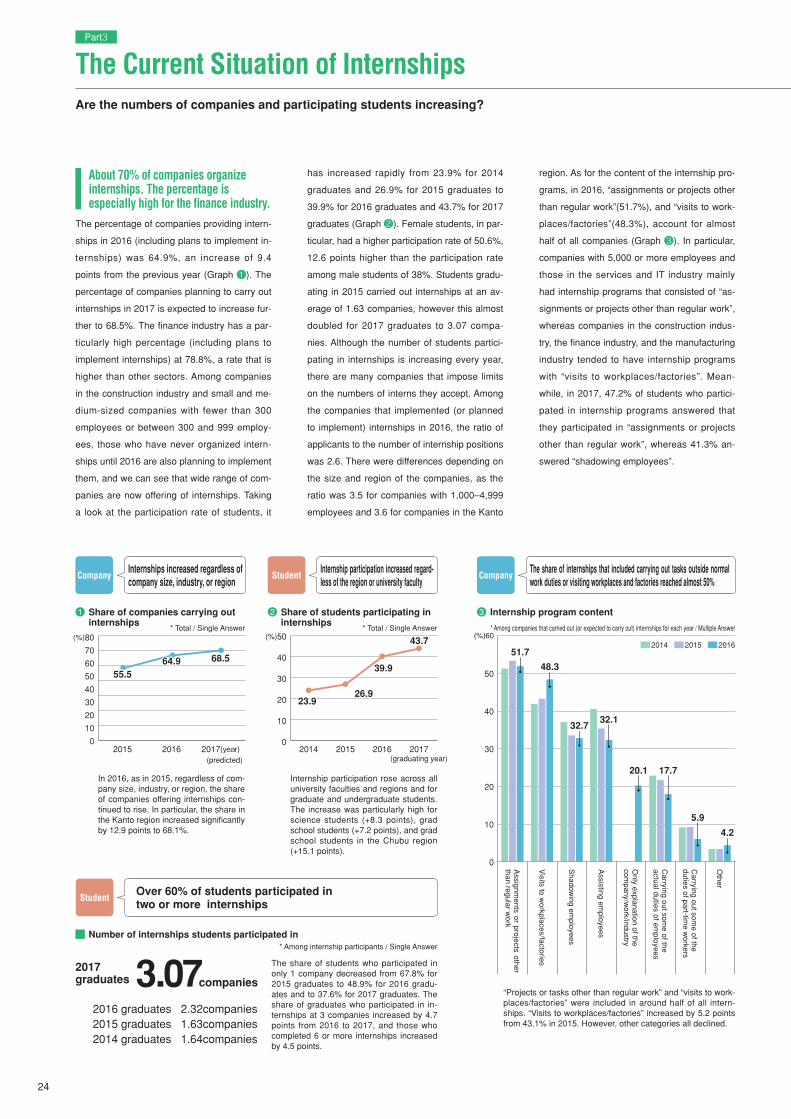
(%)80
70
60
50
40
30
20
10
0
(%)50
40
30
20
10
02015
(%)60
50
40
30
20
10
0
20142016 201620152017(year)(predicted)
2017(graduating year)
55.5
23.9
64.9
26.9
68.5
43.7
39.9
51.7
4.2
5.9
17.720.1
32.132.7
48.3
Assignm
ents or projects other than regular w
ork
Visits to w
orkplaces/factories
Shadow
ing employees
Assisting em
ployees
Only explanation of the
company/w
ork/industry
Carrying out som
e of the actual duties of em
ployees
Carrying out som
e of the duties of part-tim
e workers
Other
Company Company
Over 60% of students participated in two or more internships
Student
Student
In 2016, as in 2015, regardless of com-pany size, industry, or region, the share of companies offering internships con-tinued to rise. In particular, the share in the Kanto region increased significantly by 12.9 points to 68.1%.
Internship participation rose across all university faculties and regions and for graduate and undergraduate students. The increase was particularly high for science students (+8.3 points), grad school students (+7.2 points), and grad school students in the Chubu region (+15.1 points).
“Projects or tasks other than regular work” and “visits to work-places/factories” were included in around half of all intern-ships. “Visits to workplaces/factories” increased by 5.2 points from 43.1% in 2015. However, other categories all declined.
The share of students who participated in only 1 company decreased from 67.8% for 2015 graduates to 48.9% for 2016 gradu-ates and to 37.6% for 2017 graduates. The share of graduates who participated in in-ternships at 3 companies increased by 4.7 points from 2016 to 2017, and those who completed 6 or more internships increased by 4.5 points.
* Among internship participants / Single Answer
Internships increased regardless ofcompany size, industry, or region
Internship participation increased regard-less of the region or university faculty
The share of internships that included carrying out tasks outside normal work duties or visiting workplaces and factories reached almost 50%
* Total / Single Answer * Total / Single Answer * Among companies that carried out (or expected to carry out) internships for each year / Multiple Answer
2014 2015 2016
3.072017graduates companies
The percentage of companies providing intern-
ships in 2016 (including plans to implement in-
ternships) was 64.9%, an increase of 9.4
points from the previous year (Graph 1 ). The
percentage of companies planning to carry out
internships in 2017 is expected to increase fur-
ther to 68.5%. The finance industry has a par-
ticularly high percentage (including plans to
implement internships) at 78.8%, a rate that is
higher than other sectors. Among companies
in the construction industry and small and me-
dium-sized companies with fewer than 300
employees or between 300 and 999 employ-
ees, those who have never organized intern-
ships until 2016 are also planning to implement
them, and we can see that wide range of com-
panies are now offering of internships. Taking
a look at the participation rate of students, it
has increased rapidly from 23.9% for 2014
graduates and 26.9% for 2015 graduates to
39.9% for 2016 graduates and 43.7% for 2017
graduates (Graph 2 ). Female students, in par-
ticular, had a higher participation rate of 50.6%,
12.6 points higher than the participation rate
among male students of 38%. Students gradu-
ating in 2015 carried out internships at an av-
erage of 1.63 companies, however this almost
doubled for 2017 graduates to 3.07 compa-
nies. Although the number of students partici-
pating in internships is increasing every year,
there are many companies that impose limits
on the numbers of interns they accept. Among
the companies that implemented (or planned
to implement) internships in 2016, the ratio of
applicants to the number of internship positions
was 2.6. There were differences depending on
the size and region of the companies, as the
ratio was 3.5 for companies with 1,000–4,999
employees and 3.6 for companies in the Kanto
region. As for the content of the internship pro-
grams, in 2016, “assignments or projects other
than regular work”(51.7%), and “visits to work-
places/factories”(48.3%), account for almost
half of all companies (Graph 3 ). In particular,
companies with 5,000 or more employees and
those in the services and IT industry mainly
had internship programs that consisted of “as-
signments or projects other than regular work”,
whereas companies in the construction indus-
try, the finance industry, and the manufacturing
industry tended to have internship programs
with “visits to workplaces/factories”. Mean-
while, in 2017, 47.2% of students who partici-
pated in internship programs answered that
they participated in “assignments or projects
other than regular work”, whereas 41.3% an-
swered “shadowing employees”.
The Current Situation of Internships Are the numbers of companies and participating students increasing?
Part3
About 70% of companies organizeinternships. The percentage isespecially high for the finance industry.
Share of companies carrying outinternships
1 Share of students participating ininternships
2 Internship program content3
Number of internships students participated in
2016 graduates 2.32companies2015 graduates 1.63companies2014 graduates 1.64companies
24

(%)80
70
60
50
40
30
20
10
0
(%)100
80
60
40
20
02012 2013 2014 2015 2016 2017
69.6
66.0
34.731.2
21.919.7
10.8
4.3
9.7 9.0 8.3
1.11.0
Company Student“To promote understanding of the work and industry” was the top objective for the fourth consecutive year
Understanding of the job and understanding of the industry were objectives for nearly 70% of students. Receiving a job offer was the objective for less than 10%.
* Among companies that carried out (or planned to carry out) internships in each year / Multiple Answer * 2018 graduate internship participants / Multiple answers
◦ To let students show their skills through work and projects that can also prompt the abilities of employees◦ To evaluate the skills of students for recruitment
◦ To promote understanding of the industry and the job, including the company, through observation of work and operations
◦ To search for the types of students who are different from those hired in the conventional manner
◦ To promote understanding and brand awareness among students who may become our future clients
◦ to contribute to society by providing opportunities for students to experience work
◦ To carry out programs that can lead to recruitment
The categories that increased from the 2016 survey were, in order of the larg-est changes and excluding increases of less than 1 point, “to evaluate the skills of students hoping to get hired” (+6.3 points), “to carry out programs that can lead to recruitment” (+2.9 points), and “to promote understanding of the industry and the job, including the company, through observation of work and operations” (2.6 points).
Over 70% of students answered “understanding of the job” and “under-standing of the industry”. In particular, “understanding of the industry” was chosen by 71.2% of students from the Chubu region, 5.2 points higher than the total average. In addition, 39.1% of female students chose “to experience the atmosphere of the industry, organization, or workplace”, 4.4 points higher than for the share for all students. After “understanding of the industry” (an increase of 12.7 points), “to under-stand the business of the industry or organization” also increased greatly from the 2015 graduate recruitment season, by 5.4 points.
What are companies’ objectives for carrying
out internships? Looking at the survey re-
sponses, the most common answer, chosen by
more than 80% of companies, was “to promote
understanding of the industry and the job, in-
cluding the company, through observation of
work and operations”. This answer was the top
answer for 4 consecutive years (Graph 4 ).
Similarly, companies that choose the answer,
“to evaluate the skills of students for recuit-
ment”, increased from previous surveys, dou-
bling from 20.8% in 2012 to 42.7% this time.
Furthermore, companies that answered, “to
search for the types of students who are differ-
ent from those hired in the conventional man-
ner” and “to carry out programs that can lead
to recruitment” also increased slightly, showing
an increase in companies that implement in-
ternships in order to recruit students. Compa-
nies who carry out internships, “to promote un-
derstanding and brand awareness among
students who may become our future clients”
have also been increasing gradually since
2012. Conversely, an answer that was chosen
less in the survey this time was, “to contribute
to society by providing opportunities for stu-
dents to experience work”, which decreased
from 58.4% in 2016 to 51.1%. As such, we can
see that the increase in the number of small
and medium-sized companies implementing
internships for recruitment purposes was ac-
companied with a relative decrease in those
aiming to contribute to society. Meanwhile, the
responses from students about their reasons
for participating in internships showed “under-
standing of the job” and “understanding of the
industry” to be the most common answers at
almost 70%, with “understanding of the indus-
try” at 66.0% (Graph 5 ). The percentage of
students who chose this answer increased by
12.7 points from 53.3% among 2015 gradu-
ates. These answers were followed by “to ex-
perience the atmosphere of the industry, orga-
nization, or workplace” and “to understand the
business of the industry or organization”, both
at around 30%. Overall, the motivation to par-
ticipate in internships was the interest in the
business or work of the industry or company.
The fact that the number of students who
chose answers related to self-understanding
and self-analysis like “ascertaining my own
skills” and “clarifying my own career path”
reached only 20% shows that students empha-
size “industry research” and “company re-
search” when participating in internships. Last-
ly, a small amount, 9.7% of students, did
internships with the purpose of “securing job
offers (directly related to recruitment)”, which
was almost the same level as 2016 at 9.6%.
Gaining understanding of the job and industry is the main objective
Internship objectives4 Objectives for participating in internships5
understanding of the jobunderstanding of the industryto experience the atmosphere of the industry, organization, or workplaceto understand the business of the industry or organizationascertaining my own skillsclarifying my own career pathTo network with employeessecuring job offers (directly related to recruitment)To network with other job hunting studentsTo receive university creditsCompensation/salaryNo particular objectiveOther
25

Company Around 20% of companies carry out internships for recruitment
Around 20% joined companies where they had internedStudent
* Among companes that car-ried out (or planned to carry out) internships for the 2017 graduate recruitment season / Single Answer
* Among 2017 graduates that participated in internships and had confirmed job places / Single Answer
Intend to enter a company atwhich I completed an internship
Intend to work not at the same company at whichI interned, but in the sameindustry
Intend to enter a company in a completely differentindustry
There were no internship participantsamong those we gavejob offers to
Unknown 0.1%(-0.5 points from previous year)
Unknown 0.4%(+0.4 points from previous year)
There was an internshipparticipant among thosewe gave job offers to
The internship was heldspecifically for the purpose of recruitment
Internship was not specificallyfor recruitment, but there was anintern among those we gave offers to
22.4%(+2.0 points from previous year)
27.4%(+2.5 points from previous year)
49.8%(-4.9 points from previous year)
27.5%(-6.0 points from previous year)
72.5%(+6.0 points from previous year)
23.2%(+3.3 points from previous year)
49.1%(+3.1 points from previous year)
Among companies that carried out internships dur-ing the 2017 recruitment season, 72.5% gave offers to candidates that had par-ticipated in their intern-ships, an increase from 66.5% in the previous year. Companies that held in-ternships with the aim of recrui tment comprised 23.2%, an increase from 19.9% from the previous year.
Students who planned to enter a company at which they interned comprised 22.4%, little change from 20.4% in the previous year. Those who expected to enter a company in the same industry comprised 27.4%, a slight in-crease from 24.9% in the previ-ous year.
Decided to join a companybased on interactions with employees during an internship
Participating with goals in mind yieldedresults
Scheduled to join Infrastructure sector / Law department
Scheduled to join Manufacturer / Pharmacy department
Looking through the newspaper made me realize that an internship is crucial to finding a job, so I participated in in-ternships with 10 companies in the hopes of getting preliminary job offers. At a 5-day internship with one of the companies, I sent an email thanking a person who gave me their card, and they sent back a long message full of advice for my job search. I was moved by their kindness, not only on that oc-casion but also when they nicely ex-plained terminology that I didn’t under-stand, etc. That increased my interest in working for that company, and I re-solved to join them.
I decided to try participating in an in-ternship during the summer of my 5th year in pharmacy school, on the recom-mendation of a friend. I had three goals in participating: “know myself,” “know the company,” and “build a job search-ing network.” This yielded a lot of good results, like allowing for self-reflection and changing some of my preconcep-tions about the healthcare industry. In my internship with a certain manufac-turer, I experienced the product devel-opment process firsthand. I was torn between that and another company where I could make good use of my major, but in the end I chose this com-pany because I thought it would let me realize my goals.
The Current Situation of Internships
Part3
How do students interact with their host com-
panies after completing an internship? First,
62.2% of 2017 graduates submitted pre-entries
to at least one of their host companies after
their internships, up from 60.4% in 2016 and
44.5% in 2015. Additionally, looking at the in-
ternships and the number of pre-entries sub-
mitted to those companies, students who par-
ticipated in an internship at one company
submitted an average of 0.44 pre-entries. For
students who interned at two or three compa-
nies, the number of pre-entries rose according-
ly, and students who interned at over six com-
panies submitted an average of 6.74 pre-
entries. However, despite this, 13.6% of
students who interned at more than six compa-
nies did not submit any pre-entries. Next, we
look at the ratio of students hired by their in-
ternship companies. First, looking at data from
the companies, 72.5% of companies reported
that, “there was an internship participant
among those we gave job offers to” (Graph 6
). This was up 6 points from 2016 graduates.
In particular, the ratio was 83.9% for compa-
nies with 1,000–4,999 employees and 90.1%
for companies with over 5,000 employees,
showing an increase along with the size of the
company. Of the companies that held intern-
ships, 23.2% reported, “the internship was held
specifically for the purpose of recruitment”. Al-
most double, 49.1% of companies, stated that,
“internship was not specifically for recruitment,
but there was an intern among those we gave
offers to”. On the other hand, looking at the re-
sponses from students, 22.4% of the 2017
graduates are planning to work at their intern-
ship company. (Graph 7 ). Also, ration of
those who intend to work not at the same com-
pany at which they interned but in the same in-
dustry is 27.4%. As such, 49.8% of students
are planned to work in the same industry as
their internship companies. In particular, for
science major students, those who are sched-
uled to work either at their internship company
or industry was as high as 60.9%.
Approximately 20% of studentswere hired by the companiesthey interned
Internship participation status of graduates who recieived job offer6
Path of students who participated in internship7
26

37.9
33.4
30.0
15.5 17.5 29.1
16.6 23.1 26.9
18.8 30.3 20.9
Company CASE7
Finance companyScreening start date: June
Regular positions
Until February 2016 P a r t i c i p a t i o n i n internships and industry research sessions
March J o i n t c o m p a n y information sessions, university information sessions, in-house company information sessions (until early April)
Mid-April Entry sheet submission deadline
Mid-May Aptitude test deadline June First-round interviews Second-round interviews Final interviews Early July Early unofficial offers sent
Main recruiting processes
Company location: Chubu area Company size : 1,000+ employees Results of 2017 graduate recruitmentRecruitment target: 120 peopleOffers given: Approx. 150 offersExpected number of new hires: Ap-prox. 110 people(27% offer refusal rate)
COMPANY DATA
Of the companies that held internships, some
provided evaluations and other feedback to
participating students after the programs
ended. In 2016, 37.9% “provided feedback to
students only”, 15.5% “did not provide feed-
back to students but provided feedback to
universities”, and 17.5% “provided feedback
to both students and universities”. As such,
approximately 70% of host companies pro-
vided feedback of some form (Graph 8 ).
While these shares have been decreasing in
recent years, the increasing number of com-
panies offering internships shows that com-
panies still appear to acknowledge the signif-
icance of offering feedback. Many companies
with more than 5,000 employees, in particu-
lar, “provided feedback to students only”
(56.5%). In the construction industry, many
companies “did not provide feedback to stu-
dents but provided feedback to universities”
(25.5%) or “provided feedback to both stu-
dents and universities” (33.3%). In the fi-
nance industry, many companies “did not
provide any feedback” (38.6%). Internships
are a valuable opportunity to not only learn
about the outside world (companies and in-
dustries) but also to examine one’s own skills
and strengths and to visualize a career path.
One of the students who participated in pro-
grams with group work stated, “I received a
feedback after the work that my attitude to
work supportively with others was good and
that made me realize my own strengths”
(male student) .
Feedback from companies provides a valuable learning opportunity
Companies that “provided feedback to students only” rose by 7.9 points from 30% in 2014 and by 4.5 points from 33.4% in 2015. However, the share of companies that “pro-vided feedback to both students and universities” (17.5%) was down 5.6 points from 23.1% in 2015, following the de-cline by 7.2 points from 30.3% in 2014.
column
(%)
2016
2015
2014
Feedback and other evaluation for internship participants
8
Every year we carry out five-day internships in
the summer and one-day internships in the win-
ter. The content of the internships aims to deepen
understanding of the industry and our company in
the form of workplace experience in the summer
and group work in the winter. We started conduct-
ing summer internships linked to CSR over 10
years ago, but our winter internship program has
only been running for a few years. In the first
year, it was a two-day program, but since more
companies started to conduct one-day intern-
ships, and it became usual for students partici-
pate in internships at multiple companies, we de-
cided that implementing multiple one-day program
with content deeper than our company informa-
tion sessions would give the right balance regard-
ing the burden on the students and the company.
We changed to a one-day program from the fol-
lowing year, and this continues to the present.
In both the summer and winter programs, the goal
is to facilitate getting a sense of what it is like to
be employed by us and to deepen students’ un-
derstanding of the industry and the company.
Since we select candidates according to the
Keidanren’s guidelines, our internships are not re-
lated to recruitment selection at all, and we do not
approach the participants in any way afterwards.
However, we recognize that there is a certain de-
gree of correlation between internship participa-
tion and entering the recruitment selection pro-
cess. That is to say, over the past several years,
more than 80% of the students who participated
in our internships have taken part in the first
round of interviews for recruitment selection. Dur-
ing the recruitment of 2017 graduates, about 20%
of those who received an offer had participated in
our company’s internships. Furthermore, when
asked in a questionnaire about their motivations
in applying to the company, there were numerous
answers from offer recipients saying they had ap-
plied “because the internship was good”.
Responding to this trend, we increased the num-
ber of internship programs and the number of
people accepted in summer 2016 and winter
2017. We think it is good for students to have op-
portunities to understand the industry and compa-
nies in detail, even if it is only for a day. For us,
this also helps to prevent mismatches and allows
us to form a recruitment pool. In the future, we
would like to keep accepting as many students as
possible.
Carried out a five-day program in the sum-mer and a one-day program in the winter.
Although we don’t directly link internship to recruitment, more than 80% of those who participate take part in the first interview
About 20% of the 2017 graduates who received job offers participated in internships in the summer andthe winter
Provided feedback to students onlyDid not provide feedback to students but provided feedbackto universitiesProvided feedback to both students and universitiesDid not provide any feedback
27
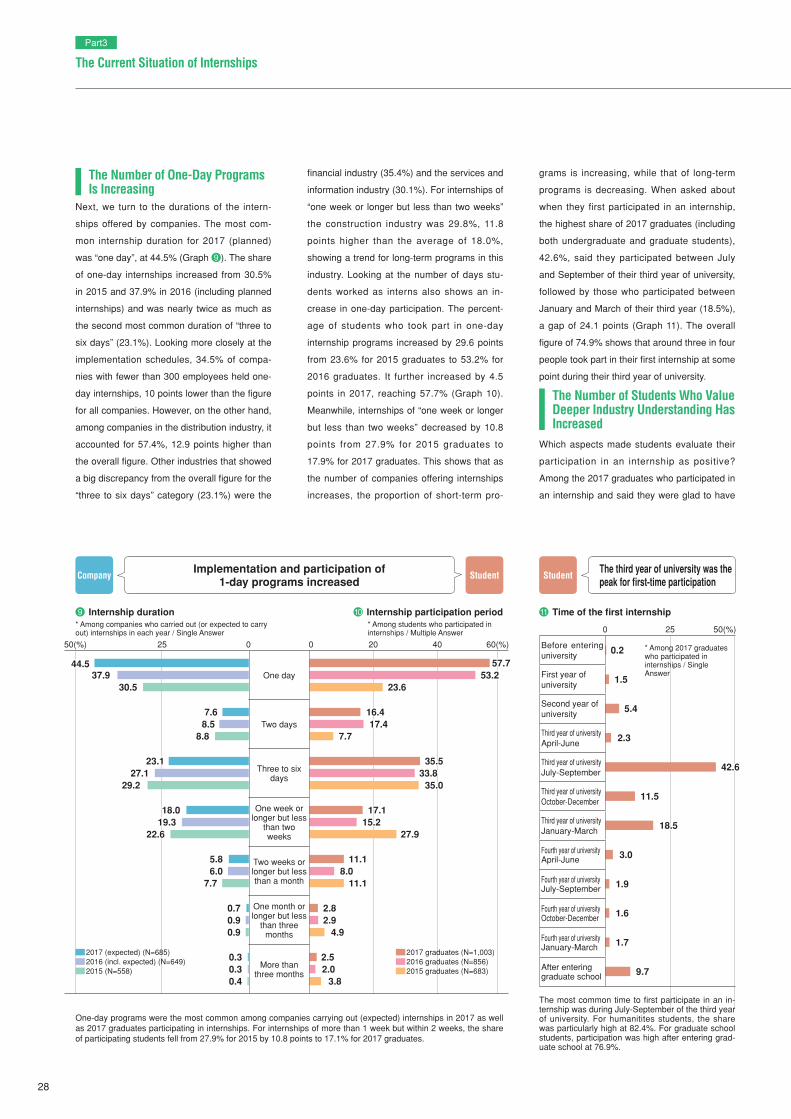
50(%) 25 20 40 60(%)0 0
0 25 50(%)
44.5 57.7
16.4
35.5
17.1
11.1
2.8
2.5
53.2
17.4
33.8
15.2
8.0
2.9
2.0
23.6
7.7
35.0
27.9
11.1
4.9
3.8
37.930.5
7.68.5
8.8
23.127.1
29.2
18.019.3
22.6
5.86.0
7.7
0.70.90.9
0.30.30.4
One day
Two days
Three to six days
One week or longer but less
than two weeks
Two weeks or longer but less than a month
One month or longer but less
than three months
More than three months
0.2
1.5
5.4
2.3
42.6
11.5
18.5
3.0
1.9
1.6
1.7
9.7
Before entering university
First year of university
Second year ofuniversity
Third year of universityApril-June
Third year of universityJuly-September
Third year of universityOctober-December
Third year of universityJanuary-March
Fourth year of universityApril-June
Fourth year of universityJuly-September
Fourth year of universityOctober-December
Fourth year of universityJanuary-March
After enteringgraduate school
Company Student
One-day programs were the most common among companies carrying out (expected) internships in 2017 as well as 2017 graduates participating in internships. For internships of more than 1 week but within 2 weeks, the share of participating students fell from 27.9% for 2015 by 10.8 points to 17.1% for 2017 graduates.
Implementation and participation of1-day programs increased
* Among companies who carried out (or expected to carry out) internships in each year / Single Answer
* Among students who participated in internships / Multiple Answer
* Among 2017 graduates who participated in internships / Single Answer
The third year of university was the peak for first-time participation
Student
The most common time to first participate in an in-ternship was during July-September of the third year of university. For humanitites students, the share was particularly high at 82.4%. For graduate school students, participation was high after entering grad-uate school at 76.9%.
The Current Situation of Internships
Part3
Next, we turn to the durations of the intern-
ships offered by companies. The most com-
mon internship duration for 2017 (planned)
was “one day”, at 44.5% (Graph 9 ). The share
of one-day internships increased from 30.5%
in 2015 and 37.9% in 2016 (including planned
internships) and was nearly twice as much as
the second most common duration of “three to
six days” (23.1%). Looking more closely at the
implementation schedules, 34.5% of compa-
nies with fewer than 300 employees held one-
day internships, 10 points lower than the figure
for all companies. However, on the other hand,
among companies in the distribution industry, it
accounted for 57.4%, 12.9 points higher than
the overall figure. Other industries that showed
a big discrepancy from the overall figure for the
“three to six days” category (23.1%) were the
financial industry (35.4%) and the services and
information industry (30.1%). For internships of
“one week or longer but less than two weeks”
the construction industry was 29.8%, 11.8
points higher than the average of 18.0%,
showing a trend for long-term programs in this
industry. Looking at the number of days stu-
dents worked as interns also shows an in-
crease in one-day participation. The percent-
age of students who took part in one-day
internship programs increased by 29.6 points
from 23.6% for 2015 graduates to 53.2% for
2016 graduates. It further increased by 4.5
points in 2017, reaching 57.7% (Graph 10).
Meanwhile, internships of “one week or longer
but less than two weeks” decreased by 10.8
points from 27.9% for 2015 graduates to
17.9% for 2017 graduates. This shows that as
the number of companies offering internships
increases, the proportion of short-term pro-
grams is increasing, while that of long-term
programs is decreasing. When asked about
when they first participated in an internship,
the highest share of 2017 graduates (including
both undergraduate and graduate students),
42.6%, said they participated between July
and September of their third year of university,
followed by those who participated between
January and March of their third year (18.5%),
a gap of 24.1 points (Graph 11). The overall
figure of 74.9% shows that around three in four
people took part in their first internship at some
point during their third year of university.
Which aspects made students evaluate their
participation in an internship as positive?
Among the 2017 graduates who participated in
an internship and said they were glad to have
The Number of One-Day Programs Is Increasing
The Number of Students Who ValueDeeper Industry Understanding HasIncreased
2017 (expected) (N=685)2016 (incl. expected) (N=649)2015 (N=558)
2017 graduates (N=1,003)2016 graduates (N=856)2015 graduates (N=683)
Internship duration9 Internship participation period10 Time of the first internship11
28

40200 60 80(%)
65.4
64.9
34.6
32.2
21.5
20.3
14.3
12.5
8.8
0.9
5.7
66.1
62.3
33.8
32.4
17.3
14.9
14.1
10.0
8.5
1.6
6.6
68.0
56.9
37.4
32.7
23.2
22.1
15.8
7.6
13.0
1.2
5.9
I was able to learn concrete details about the job
I was able to gain concreteknowledge about the industry
I got to know the atmosphere ofthe company and the workplace
I was able to learn concrete detailsabout the operations of variouscompanies and organizations
I was able to ascertain my own skills
I was able to clarify my career path
I was able to network with otherstudents who were job hunting
I was able to get an offer fromthe company that hosted the internship
I was able to network withemployees
Other
None
* Among internship participants / Multiple Answer
More than 60% said they were able to learn about the job and industry
Student
The top four answers were about learning concrete details about the job, industry, company and workplace atmo-sphere, and the operations of the company or industry. There were also some who answered “none”.
I used the interest I developed during my internship to promote myself in the Interview
I used one-day programs to narrow down career interests
Scheduled to join General trading company / Sociology department
Scheduled to join Securities company / Sociology department
The first time I participated in an intern-ship was during the summer of my third year at university. It was a 5-day program at a financial institution, and I really re-spected the smart and professional em-ployees who worked there. In the Febru-ary of my third year at university, I participated in a program run by a general trading company that was my first choice of employer. I was determined to get ac-cepted onto the program no matter what, so I showed the application form to a stu-dent in the year above who had already received an informal offer of employment from the company, and I was able to get an understanding of the basics of how to write a successful application. During the final interview, I reiterated how my intern-ship experience led me to become inter-ested in working for the company. As a re-sult, I succeeded in receiving an offer.
While I knew that I had a general interest in credit card and leasing companies, I participated in a total of six one-day in-ternships for companies in six different sectors (including, for example, real es-tate) in order to learn more about different kinds of businesses before making a deci-sion. As a result, I was able to reconfirm that a career in finance was the right choice for me, and from March onward I focused my job-hunting activities on the fi-nancial sector. Had I not narrowed down the careers I was interested in before March, I would have been left with too many options to make a decision, so I am glad that I was able to learn more about each industry beforehand.
participated, the top reasons were, “I was able
to learn concrete details about the job” and “I
was able to gain concrete knowledge about the
industry”, answered by 65.4% and 64.9%, re-
spectively. “I got to know the atmosphere of
the company and the workplace” and “I was
able to learn concrete details about the opera-
tions of various companies and organizations”
came next at around 30% (Graph 12). Looking
at the past years, the share of respondents
who answered, “I was able to gain concrete
knowledge about the industry” increased grad-
ually from 56.9% for 2015 graduates to 62.3%
for 2016 graduates and 64.9% for 2017 gradu-
ates. Accordingly, many students believed they
were able to deepen their understanding of the
industry and company as well as the job and
work content. In contrast, responses for “I was
able to ascertain my own skills” and “I was able
to clarify my career path” comprised only
around 20% of the total responses, at 21.5%
and 20.3%, showing that few believed they
were able to deepen their analysis and under-
standing of themselves. In addition, experi-
ences from students included the following
(from a female student): “In my internship in
the retail industry, I often experienced work
that I had experienced in part-time jobs and
was unable to get an idea of how employees
worked, so I decided not to try for that indus-
try”. As such, depending on the program, it
was not possible to obtain students’ evalua-
tions. While many students participated in in-
ternships and valued their experiences, some
students did not participate in any internships.
The most common reason among those who
said they did not participate in an internship
was, “the content of the internship did not ap-
peal to me” (36.7%). This was followed by “I
was busy with academic studies and other ac-
tivities” (23.9%), “I felt it was troublesome to
apply” (19.6%), and “I did not think that it would
be advantageous when applying for a job”
(18.0%). In particular, the percentage of sci-
ence students who answered “I was busy with
academic studies and other activities” (28.8%)
was high compared to that of humanities stu-
dents (21.2%).
Time of the first internship12
2017 graduates (N=1,003)2016 graduates (N=856)2015 graduates (N=683)
29

(%)60
50
40
30
20
10
0
0 20 40 60(%)80
Assignm
ents or projects otherthan regular w
ork
Shadow
ing employees
Only explanation of the com
pany/w
ork/industry
Carrying out som
e of the actualduties of em
ployees
Visits to w
orkplaces/factories
Assisting em
ployees
Carrying out som
e of the duties ofpart-tim
e workers
Other
43.9
29.1
44.0
24.423.4
10.5
0.7
2.6
42.6
48.2
10.9
29.3
38.7
11.0
2.0
45.5
2.216.2
2.08.3
24.669.4
30.813.6
59.617.2
8.08.3
2.78.1
2.86.8
6.15.2
Before the second year of university
Third year of university
April-June
July-September
October-December
January-March
Fourth year of university
April-June
July-September
October-December
January-March
Student
Compared to participants in the 2016 graduate recruitment season, for only internships of more than one week, the share of 2017 graduates who were able to experience “assignments or projects other than regular work” rose by 8.9 points. Also for one-day internships, those who received “only explanation of the company/work/industry” increased by 8.6 points.
For one-day internship participants, 44.0% receivedonly explanations of the company or industry
* Among university students that participated in internships / Multiple Answer
* Among university students who participated in internships / Multiple Answer
Peak for participation in one-day internships was in winter of the third year of university
Student
The biggest difference in the timing of internships lasting for only one day and more than one week was for those during July-September of the third year of uni-versity, where the latter was higher by 44.8 points. Also, for students in their third year of university participating during Janary-March, participation in one-day intern-ships was higher than those lasting more than a week by 42.4 points.
What differences arise from internships based
on the length of the program? Here, we com-
pare one-day programs and programs of one
week or more based on their characteristics
and variations. (* Hereafter, our data on partici-
pating students excludes graduate students
and consists only of undergraduates.) First,
when comparing the times when students par-
ticipated in one-day internships versus those
lasting one or more weeks, we see that partici-
pation in one-day internships was most fre-
quent for 3rd year students between January
and March, while the peak for internships last-
ing one or more weeks was in the later period
of July through September (Graph 13). We can
assume that 3rd year students participate in
programs of one week or more during the long
break in the summer and participate in one-
day programs in the shorter winter break.
When looking at the periods in which intern-
ships were held by businesses, the most fre-
quent period in 2016 was January through
March. This period covered nearly half of all in-
ternships for companies that offered one-day
only internships as their primary program, and,
when examining them month-by-month, most
(a little over 40%) were held in February. For
businesses that mainly offered programs of
one week or more, half were held in August,
and a similar trend can be observed as with
students. Next, when comparing the content of
one-day programs and programs of one or
more weeks in which the students participated,
the most frequently covered content among
one-day programs was about equally divided
between “only explanation of the company/
work/industry” (44.0%) and “assignments or
projects other than regular work” (43.9%)
(Graph 14). Notably, for “only explanation of
the company/work/industry”, there was a gap
of 33.1 points compared to programs of one or
more weeks (10.9%). In contrast, the most
common content covered by programs of one
or more weeks was “shadowingemployees”
(48.2%) and “carrying out some of the actual
duties of employees” (45.5%). The largest gap
with one-day only programs, of 28.2 points,
was for “assisting employees” (38.7%), and we
can see that in general, the longer programs
were more frequently of the type in which stu-
dents experience some of the tasks of the em-
ployees.
Differences Based on the Durations of InternshipsIs the increase in one-day programs worthwhile? What is the reality?
Part3
Participation in one-day programs was greatest during the winter for 3rd year students
Time of internship participation by internship duration13 Content of the internships in which students particpated in by program duration14
Total1 day onlyMore than 1 week only
Total1 day onlyMore than 1 week only
30

CompanyCASE8
Trading companyScreening start date: May
February 2016 Internships (start of separate screening for students wishing to continue their internship)
March Start accepting entry sheet submissions. Joint information sessions at universities and in-house information sessions
April Company information sessions (small numbers, until June) May Document screening (until June) Aptitude tests, written tests (until June) Interviews (until July) Early unofficial offers given to
internship participants Early unofficial offers given to regular
screening candidates (until July)
Main recruitment processes (regular positions)
Company location: Tokyo Company size : 300–999 employees Results of March 2017 graduaterecruitment (regular positions)Recruitmenttarget:10–15peopleOffersgiven:Approx.19offersExpectednumberofnewhires:Approx.10people(47%offerrefusalrate)
COMPANY DATA
August 2015One-day work experience internship at a com-pany in my home region of Kyushu
March 2016Participated in a “U-turn” (for those returning to their home towns/regions) employment joint company information seminar
April–May 2016Submitted entry sheets. Interviews started after Golden Week.
June 2016Peak of interviews. I was rejected from my first-choice company, but received unofficial offers from eight other companies. I decided to enter the company where I had completed an intern-ship.
Job hunting schedulees
StudentCASE4
Scheduled to join IT companuScience department
In 2017, we held five one-day internship pro-
grams in February. The internships started with a
30-minute lecture about our company’s products
as well as an explanation of our industry’s devel-
opment. This was followed by a 60-minute work-
shop where the students could experience a sim-
ulated business environment while handling the
products. The groups were then split up, and the
students spent an hour asking questions to cur-
rent employees. They also received further dem-
onstrations based on their questions. The pro-
grams made the most of the one-day limit by
having the students touch the products and think
about the business directly, and this active en-
gagement kept them from losing interest. It is a
point of pride that the programs were able to
bring the students as close as possible to a real
working environment. For the students, they not
only gained knowledge on our products, but also
learned the general mindset to work in a sales
position.. Thanks to this, 80% of the participants
responded that they would submit an entry sheet.
The merit of the programs is that they increase
the likelihood we will meet highly ambitious stu-
dents. This company is a business-to-business
enterprise, so it is not well known. By having stu-
dents participate, we want them to realize “this
type of industry exists” and “this type of company
exists.” As students who feel the attraction to this
type of business apply, we are able to efficiently
meet the type of students we want to hire. Of the
19 prospective employees from 2017, 10 entered
our company, and of those 10, 3 had participated
in the internship. This was a satisfactory result for
our company because we were able to recruit
students who met our standards.
In 2018, we are planning to recruit at most 10
workers, which is a decrease from 2017. Howev-
er, the number of times the internship will be of-
fered is increasing from five to eight because of
the program’s effectiveness. The program was
one-day as in 2016 because it was easy to orga-
nize, and it reduced the time burden on students.
Designed the program to keep the students active and prevent them from losing interest.
Increasing the number of internships to recruit students in 2018.
Provided students a fruitful content in one-day programs
I did not know how to start job hunting, so I en-
rolled in an internship as a first step. My criteria
for choosing an internship were that it be at a
business located in my home area of Kyushu,
and that it would give me an opportunity to expe-
rience actual work.
I then participated in a one-day internship pro-
gram at a software development and sales com-
pany. Despite it only being one day, I was able to
not only experience a business environment but
also hear the company’s president talk about his
vision for the company. What especially left im-
pression on me was the instruction I received
from a first-year employee. The employee told me
about the actual content of the job in detail, and I
was able to form the concrete thought that “in a
year, I could also grow this much.” This was not
something I could understand from only looking
at the homepage or a recruiting pamphlet. Also,
being able to hear directly from the company
president about the values of the company let me
connect with its desire to improve. Honestly, I had
never even heard of this small company, but I de-
cided to work for the company because of the in-
ternship. Looking back, I am still glad that I partic-
ipated in the internship.
Speaking with first-year employees allowed me to imagine how I could grow as a person
I had absolutely no knowledge of the industry, but I entered the company because of the internship
31

(%)100
80
60
40
20
0
40200 60(%)80
To promote understanding of
the job and the industry, includingthe com
pany
To contribute to society
To evaluate the skills of studentsfor recruitm
ent
To deepen the understanding ofcom
pany and to boost the image
To stimulate em
ployees
To search for the types of studentsw
ho are different from those hired
in the conventional manner
To link to recruitment
Other
84.0
22.7
34.7
33.3
2.7
12.0 12.7
4.7
89.0
84.2
39.7
15.8
6.2 4.1 4.8
31.5
66.061.3
65.546.4
32.830.1
11.029.5
12.018.4
8.913.8
8.86.6
0.620.0
6.38.4
0.63.1
2.50.4
5.28.3
28.522.8
To understand the job
To understand the industry
To get to know the atmo-sphere of the company, or-ganization, or workplace
To understand the con-tent of the work of the company or organization
To ascertain my own skills
To clarify my career path
To network with employees
To receive an offer (link to recruitment)
To receive credit for my university course
To network with otherjobhunting students
Remuneration/compensation
Other
None in particular
Company
“To promote understanding of the job and the industry, including the company” comprised around 80% of responses for both one-day only internships and those of more than one week. For programs of more than one week, “to con-tribute to society” was also high at 84.2%. There were also significant num-bers of responses for “to search for the types of students who are different from those hired in the conventional manner” for one-day programs.
Company offering only “more than 1 week” internshipshave the objective to contribute to society
* Among companies that carried out (or planned to carry out) internships in 2016 / Multiple Answer
Regardless of duration “understanding of the job” was a popular answer.
Student
For “understanding the job”, one-day programs and programs longer than one week both reached over 60%. For programs lasting more than a week, “none in particular” comprised 8.3% of responses.
Differences Based on the Durations of Internships
Part3
Do the goals of companies in offering intern-
ships and the goals of students in participating
in internships vary depending on the period of
the internship? When looking at companies’
goals for implementing programs, we see that
the share of those with the goal “to link to re-
cruitment” (12.7%) was higher for one-day pro-
grams than for programs of one or more
weeks, with a gap of 8.6 points. Furthermore,
the goal “to search for the types of students
who are different from those hired in the con-
ventional manner” (12.0%) had a gap of 5.8
points (Graph 15). Conversely, programs of
one or more weeks with the goal “to contribut-
ing to society” (84.2%) exceeded those for
one-day programs (22.7%) with a gap of 61.5
points. In particular, for companies with 1,000–
4,999 employees, 92.0%, the large majority of
companies had answered so. Also, as there
was a 70.2-point gap versus one-day only pro-
grams, we can infer that the positioning of lon-
ger programs and their goals varies by compa-
ny size. Additionally, the goal “to stimulate
employees” (15.8%) was greater for one-day
programs (2.7%) by a margin of 13.1 points.
Next, when looking at students’ objectives
when participating in internships, we can see
that “to understand the industry” was more
common among the one-day participants
(65.5%) than the one-or-more-week partici-
pants (46.4%), and the gap pertaining to this
objective was the largest, at 19.1 points (Graph
16). The share of one-day participants with the
goal “to understand the industry” increased
from 55.6% by 9.9 points for 2016 graduates,
suggesting an increase in the number students
who participate in one-day internship programs
as part of their industry research. In contrast,
participants in programs of one or more weeks
exceeded those in one-day programs for the
goals “to receive credit for my university
course” (+19.4 points), “to ascertain my own
skills” (+18.5 points), “to clarify my career path”
(+6.4 points), “to network with employees”
(+4.9 points), “remuneration” (+2.5 points), and
“to network with other job hunting students”
(+2.1 points), in this order. Compared to 2016
graduates, those with the goal “to understand
the industry” decreased by 12.4 points.
Students use one-day programs asa means for researching industries
Objectives for conducting internship by program length15
Total1 day onlyMore than 1 week
* Among 2017 graduates who participated in an internship / Multiple Answer
Motivations for internship participation by the duration of the program16
Total1 day onlyMore than 1 week
32

(%)100
80
60
40
20
0
40 60200(%)80
To promote understanding of
the job and the industry, includingthe com
pany
To contribute to society
To evaluate the skills of studentsfor recruitm
ent
To deepen the understanding of com
pany and to boost the image
To stimulate em
ployees
To link to recruitment
To search for the types of students w
ho are different from those hired
in the conventional manner
Other
79.7
18.8
21.026.8
2.2
10.1 7.2
4.3
81.2
71.7
33.3
9.4
0.7 3.6 5.1
26.1
57.262.8
64.050.5
28.535.4
10.936.3
11.925.3
11.617.3
9.08.8
5.413.9
1.42.0
10.08.1
26.526.1
I was able to learn concrete details about the job
I was able to gain concrete knowledge about the industry
I got to know the atmosphere of the company and the workplace
I was able to learn concrete details about the operations of various companies and organizations
I was able to ascertain my own skills
I was able to clarify my career path
I was able to network with other students who were job hunting
I was able to get an offer from the company that hostedthe internship
I was able to network with employees
Other
None
Company
We can see conformity in the intended objectives and the results ob-tained after carrying out the internships for both one-day internships and those lasting more than one week, as the characteristic of the graph is similar to that on page 32.
Company achieved positive results for all intern program duration
Longer programs helped in self-understanding
Student
Regardless of the internship duration, understanding of the job and industry was top. For items related to career perspectives, there were many responses for pro-grams of more than one week.
After an internship is completed, are there dif-
ferences in the outcomes and effectiveness
obtained by businesses and in students’ evalu-
ation and satisfaction depending on the length
of the program? First, one-day programs were
more likely to be judged to have produced re-
sults that satisfied companies’ objectives com-
pared to programs of one or more weeks when
the objective was “to link to recruitment”, with a
share of 10.1%, representing a gap of 9.4
points. Similarly, the objective “to search for
the types of students who are different from
those hired in the conventional manner” was
7.2% with a gap of 3.6 points (Graph 17). Con-
versely, programs of one or more weeks sur-
passed one-day programs for the goal “to con-
tribute to society” with a share of 71.7%, a gap
of 52.9 points. Notably, there was a 62.1-point
gap in the fulfillment of this objective among
companies with 1,000–4,999 employees. The
goal “to evaluate the skills of students for re-
cru i tment” had a rate of 33.3% wi th a
12.3-point gap. The objective “to stimulate em-
ployees” had a rate of 9.4% with a 7.2-point
gap, with the result that recruitment appeared
weaker than with one-day programs. Addition-
ally, when we compare the results of these
programs by their length with the implementa-
tion objectives shown on the left-hand page,
we can see conformity in the intended objec-
tives of the companies and the results obtained
after carrying out the internships (Graph 15
and Graph 17). On the other hand, one-day
programs exceeded programs of one or more
weeks among students giving the evaluation, “I
am glad I participated”, for the answer “I was
able to gain concrete knowledge about the in-
dustry” (64.0%), with a gap of 13.5 points
(Graph 18). Conversely, programs of one or
more weeks exceeded one-day programs for
the answer, “I was able to ascertain my own
skills” (36.3%), with a 25.4-point gap compared
to one-day only programs. After this came, “I
was able to clarify my career path” (13.4-point
gap) and then “I was able to network with em-
ployees” (8.5-point gap). Notably, students who
answered, “I was able to ascertain my own
skills”, increased compared to 2016 graduates
by 8.8 points. From the above, we can see that
students who participated in one-day programs
felt an effect on their industry research, while
students who participated in longer programs
felt an effect on networking and on ascertain-
ing their own skills.
Ascertaining skills and networkingin longer programs
Internship achievments by program duration17
Total1 day onlyMore than 1 week
* Among 2017 graduates who participated in internships / Multiple Answer
* Among companies that carriedout (or expected to carry out)internships / Multiple Answer
Reasons students were glad they participated in an internship by program duration
18
Total1 day onlyMore than 1 week
33

(%)80
60
40
20
0
(%)80
60
40
20
0
Before Oct
Nov Dec Jan Feb Mar Apr May Jun Jul Aug Sep Oct Nov Dec or
later
Before Oct
Nov Dec Jan Feb Mar Apr May Jun Jul Aug Sep Oct Nov Dec or
later
16.7
17.4
26.8
27.6
17.0
35.3
37.3
52.9
52.8
66.1
65.3
63.1
58.5
57.4
30.4
29.8
7.0
7.0
19.9
6.2
5.4
Company Company
The results were not greatly different from the 2017 graduate recruitment season. However, the share of companies who started sharing recruiment information from February was 26.0%, an increase of 8.2 points. Also, the share of compa-nies starting face-to-face in-house company information sessions and seminars in March was 73.4%, a 9.5 point increase.
The share of companies who started interviews in April was increased by 2.0 points to 30.3%. Companies who gave out official and unofficial offers from June increased by 2.7 points to 39.3%. Meanwhile, companies who started holding in-terviews before May were 73.1% and those who gave official and unofficial offers before May were 49.5%.
The starting dates did not change greatly from the 2017 graduate recruitment season
Around 40% of companies expected costs and manpower to increase
* Total / Multiple answers for each
* Total / Multiple answers
2018 graduates: Recruitment information sharing
2017 graduates: Recruitment information sharing
2018 graduates: In-house company information sessions and seminars (face-to-face)
2017 graduates: In-house company information sessions and seminars (face-to-face)
2018 graduates: Interviews 2017 graduates: Interviews 2018 graduates: Unofficial and official offers given 2017 graduates: Unofficial and official offers given
Expect an increase Expect no change Expect a decrease (%)
CompanyPromoting early recognition, attracting students, and following up with students were highlighted
Size of the recruit pool
Number of applicants for screening
Number of screening withdrawls
Number of job offer rejections
People we can hire
Recruitment costs
Manpower involved in recruitment
Following these were aspects including “motivate students (until the job offer stage)” (21.5%) and “selection method (method of identification, etc.)” (18.2%). However, 38.1% answered “none in particular”.
By industry, the shares of companies in the construction industry or financial in-dustry who said that the graduate recruit pool, the number of new recruits, or the number of screening applicants would increase were around 10%, lower than the shares in other industries.
On the outlook for 2018 graduate recruitment,
firstly, there was no change in the recruitment
selection schedule, so accordingly, the survey
did not find any notable differences in the start
times for the processes compared to graduate
recruitment in 2017 (Graphs 1 and 2 ). What
about the size of the recruit pool and recruit-
ment costs? When asked about seven aspects
related to this issue, over half the respondents
replied “expect no change” for each item (Graph
3 ). However, regarding “manpower involved in
recruitment” and “recruitment costs”, nearly 40%
of respondents replied that they “expect an in-
crease”. For “size of the recruit pool” and “num-
ber of applicants for screening”, nearly 30% re-
plied “expect a decrease”. Looking at the
results in terms of company size, for companies
with over 5,000 employees, a little over 20% of
respondents expected an increase in the “size
of the recruit pool”, “number of applicants for
screening”, and “people we can hire”, whereas
for companies with fewer than 5,000 employ-
ees, these shares were under 20%. Meanwhile,
for “manpower involved in recruitment”, about
40% of companies with over 5,000 employees
responded that they expected an increase. In
addition, when asked about whether there were
any aspects that they expected would change
for 2018 graduate recruitment, while almost
40% answered “none in particular”, about 30%
answered “promote early recognition and
awareness of the company”, “attract students’
interest, or “follow up with students after making
offers” (Data 4 ). In particular, among compa-
nies with over 5,000 employees, 50.5% re-
sponded with “attract students’ interest”, 46.5%
with “promote early recognition and awareness
of the company”, and 39.4% with “follow up with
students after making offers”, which were high
percentages compared to the responses from
companies of other sizes.
Together with the prospects for recruitment ac-
tivities, it can be seen that major companies are
increasing their recruitment power and costs. As
such, there is a possibility that the gap between
large companies and small and medium-sized
companies will continue to grow.
When it came to hiring standards, 78.5% of com-
panies responded that their standards would be
“similar to last year”, while 6.5% said that they
would be stricter. However, looking at the trend
in this response since the 2014 graduate recruit-
ment season, a decline was observed up until
2017 (from 17% in 2014 to 6.4% in 2017).
When asked what they would do if there were
unable to fill the positions they had available,
49.0% responded that they “would not lower the
Outlook for 2018 Graduate RecruitmentWhat are companies anticipating for 2018 graduate recruitment?
Part4
Around 4 in 10 companies expected an increase in the manpower andcosts involved in recruitment
Almost 8 out of 10 companiesexpected hiring standards to besimilar to last year
* Total / Multiple answers for each * Previous year company recruitment results / Single answer
Planned starting times for the sharing of recruitment information and n-house company information sessions (face-to-face)
1 Overview of 2018 graduate recruitment activities3
Expected starting dates for interviews, official offers, and unoffi-cial offers
2
Aspects that were expected to change for 2018 graduate recruitment4
1st 32.5%Promote early recognition and awareness of the company
2nd 32.3%Attract students
3rd 28.4%Follow up with students after making offers
34

0 70(%)
10 20 30 40 50 60
60.360.7
17.014.3
23.920.6
16.614.3
10.111.2
11.89.3
10.78.7
22.117.8
24.522.0
13.917.3
8.64.5
5.84.7
9.88.1
Separate recruitment by job category
Separate recruitment by department
Separate recruitment by course
Recruitment limited to by region
Recruitment of candidates introductedby recruiting companies
Recruitment by referral (e.g., from current employees)
Recruitment with differences in starting salary
Year-round recruitment
Summer recruitment
Fall recruitment
Recruitment from employment-related internships
Recruitment of students working as part-time employees
Recruitment for year-round entry
standard of personnel that we look for”, a de-
crease of 2.2 points from last year. Responses
of “we will re-examine our standards and re-
spond flexibly” and “undecided (it depends on
the situation at the time)” both saw an increase
(from 12.4% to 13.2% and 36.4% to 37.8%, re-
spectively). Accordingly, we can see that while
some companies would not lower their stan-
dards unnecessarily, a certain number would
adjust them if needed.
With companies encountering issues with 2017
graduate recruitment in terms of filling their quo-
tas and satisfaction with the quality of the new
hires, how will recruitment methods change for
2018 graduate recruitment? When asked about
their plans to carry out 16 forms of recruitment,
such as “summer recruitment” or “separate re-
cruitment by job category”, planned implementa-
tion by companies exceeded implementation for
the 2017 graduate recruitment season for 10 of
the items (Graph 5 ). The methods that showed
particularly large increases were “year-round re-
cruitment” (4.3-point increase), “recruitment
from employment-related internships” (4.1-point
increase), and “separate recruitment by course”
(3.3-point increase). The method that was
planned to be implemented by the most respon-
dents was “separate recruitment by job catego-
ry”, followed by “summer recruitment”, “separate
recruitment by course”, and “year-round recruit-
ment”. Looking at the results by company size,
among companies with fewer than 300 employ-
ees, the percentages that responded with “sepa-
rate recruitment by job category” (64.9%), “year-
round recruitment” (32.0%), and “recruitment for
year-round entry” (10.8%) were around 7–15
points higher than the corresponding percentag-
es for companies of other sizes. In particular,
“year-round recruitment” showed a 7.1-point in-
crease over 2017 recruitment, and the degree of
increase was larger than that seen in companies
of other sizes. Also, among companies with
more than 5,000 employees, the percentages
for 11 of the categories was higher than for com-
panies of other sizes, including “recruitment by
referral” (21.8%) and “recruitment of students
working as part-time employees, etc.” (28.0%).
Thus, we can see that the trend of diversification
in recruitment methods among large companies
is continuing. As with the example of the student
described on this page who received a job offer
from a software company, there are students
that make use of methods other than applying
directly to companies, such as using recruitment
agencies for new graduates. However, on the
other hand, there are also those like the student
with an offer from a machinery manufacturer
who struggle to make contact with companies.
Depending on the recruitment method, care is
needed to ensure that students do not face un-
necessary pressure.
I used a recruiting agent after failing toreceive a job offer through the normal route
Arranging dates for interviews with a recruiter was a stressful experience
Scheduled to join Software firm / Politics and economics department
Scheduled to join Machinery manufacturer / Foreign languages department
After failing to receive an offer of employment from any of the major automobile manufacturers, IT firms, and other companies I applied to, I temporarily put my job-hunting activities on hold at the end of June. I later found out about a recruitment service for new graduates when I was searching for openings while studying for my end-of-term examinations. Following registration with the agency at around the end of July, I had a telephone interview with an advisor, was introduced to tens of different companies, and, after applying to the businesses I was interested in, I suc-cessfully received informal offers of employment from two differ-ent companies by the end of August. I feel that I benefited from being able to convey my wishes, strengths and weaknesses to the recruiter, allowing them to introduce me to a range of great companies that I would not otherwise have known about.
From March to April, I regularly had appointments for interviews with a recruiter on the weekends, and each exchange with thems when arranging these interviews felt like I was being tested, put-ting me under a lot of pressure. I even had an recruiter stop con-tacting me after I turned up late to getting drinks with them due to a prior engagement taking longer than expected. I was so wor-ried that being unavailable on the proposed date of an interview would leave a bad impression that I did absolutely everything that I could to fit my schedule around the designated interview dates, and I was nervous every time I received a call or message from an unknown number. It was a really difficult time for me.
CompanyYear-round recruitment and recruitment from internships are expected to increase
* Total / Single answer for each* The survey for 2007 graduates allowed mutliple answers across all recruitment methods.
The survey also asked about the “recruitment of new graduates as contract workers” and the “recruitment of new graduate dispatch workers”, but the figures for the 2018 graduate recruitment were low, at 2.1% and 0.4%.
Diversification ofrecruitment methods
Planned recruitment methods for the 2018 graduates5
Implemented for 2017 graduatesExpected implementation for 2018 graduates
35

(%)80
70
60
50
40
30
20
10
0
(%)30
20
10
0
2013 graduate recruitment season
2013 graduate recruitment season
2014
2014
2015
2015
2016 2017
2016 2017
The company contribute to society and to the community Employees can gain special skills or knowledge through work and training The company is fair and abides by laws and regulations * There is stable employment (no concerns about unemployment) The company place importance on employees' physical and mental health and
make efforts to provide a positive work environment The work can help make a difference in the world Employees are treated well with good salary and benefits There is support for a work-life balance
Company StudentCompanies that appeal “good working environment” are increasing
Students are increasingly choosing companies based on the “working hours and vacation time” and “salary level”
* Total / Multiple Answer *Top 8 responses for the 2018 recruitment season * Among students who have confirmed job offers or who are continuing job hunting activities / Single Answer* Top 8 choices among 2017 graduates
Industry Occupation Region of work Whether there is someone at the company they would like to work with Job stability Working hours and vacation time Salary Relation to their university/graduate school major
Amid the insufficient levels of hiring in the 2017 graduate recruitment season, we can see that the shares of companies promoting themselves in ways such as focusing on “the health of workers”, “salary and benefits” and “work-life bal-ance” increased by 4.3-10 points.
“Working hours and vacation time” was chosen by 4.1% of 2013 graduates, but increased by 3.3 points to 7.4% for 2017 graduates. Meanwhile, “salary” was chosen by 3.6% of 2013 graduates but increased to 6.8% for 2016 gradu-ates and 6.1% for i2017 graduates.
* Added for 2015
Based on the survey results from the past five
years, we can observe the following three
points regarding changes in recruitment and
job-hunting activities. First is the diversification
of recruitment methods. As discussed on page
35, looking at the trends in recruitment and re-
cruiting methods from 2014 graduates to 2018
expected graduates, several recruitment meth-
ods increased in popularity, such as depart-
ment-specific recruitment (from 10.4% to
17.0%) and summer recruitment (from 15.4%
to 24.5%). Recruitment by referral, the promo-
tion of part-time workers to full-time positions,
and internships that lead clearly and directly to
hiring have also increased slightly. The second
point is the diversification of information pro-
vided to students. Looking at the trend of infor-
mation provided by companies during recruit-
ment and through PR activities over the last
five years, although there has not been a large
change in the top four items, such as “the com-
pany contribute to society and to the communi-
ty”, there has been an increase in the number
of companies trying to promote the working
environments of their companies, as shown by
answers such as “the company place impor-
tance on employees’ physical and mental
health and make efforts to provide a positive
work environment”, “employees are treated
well with good salary and benefits”, and “there
is support for a work-life balance” (Graph 1 ).
Furthermore, there have also been changes in
the criteria students focus on when choosing a
company, as can be seen in increasing re-
sponses for “working hours and vacation time”
and “salary” (Graph 2 ). The third point is the
shortening of the recruitment selection period.
Looking at the trend in the number of days be-
tween the first interview and issuing a job offer
over the last five years, the shortest case de-
creased by 3.9 days (from an average of 21.9
days for 2013 graduates to 21.9 days for 2017
graduates) and the longest case decreased by
4.9 days (from an average of 43.0 days for
2013 graduates to 38.1 days for 2017 gradu-
ates). In particular, companies taking between
1 and 9 days for their shortest cases have
been increasing (Graph 3 ). The number of
rounds of interviews has also been decreasing,
and the number of companies who answered
“one time” or “two times” for their shortest cas-
es increased from 10.3% in 2013 to 69.3% in
2017. In addition, the duration of the job-hunt-
ing period for students has also been decreas-
ing (Graph 4 ). Amid a continuing sellers’ mar-
ket, these can be seen as ways for companies
to find and secure a sufficient number of high-
quality recruits.
Future trends of recruitment and job-hunting activitiesHow will recruitment and job-hunting activities change in the future?
Part4
Indications of a diversification inrecruitment methods
Information provided during recruitment and through PR activities1 Students’ priorities when choosing a company (as of December)2
36

26.932.9
34.4
29.7
27.8
26.4
40.2 6.026.6
25.9
28.0
24.4
23.6
19.215.6 8.8
15.0 9.8
16.3 10.7
16.7 12.8
17.8 15.1
7.816.1
14.8
15.3
18.2
17.1
17.5 43.9 23.9 5.98.9
13.4 42.5 26.7 4.712.8
Com-pany
CASE9
Restaurant/food companyScreening start date: March
January–February 2016 Participation in industry research seminars at universities
From March Joint company information sessions, university information sessions
In-house company information sessions, aptitude testing
(from February 2017) First-round interviews Final interviewsFrom late March Early unofficial offers
sent (until March 2017)
Main recruiting processes
Company location: Kanto area Company size : 300–900 employees Results of 2017 graduate recruitmentRecruitmenttarget:100peopleOffersgiven:Approx.200offersExpected number of newhires:Approx.80people(60%offerrefusalrate)
COMPANY DATA
Student
* Total / Numerical Answer * Students who finished job hunting / Numberical Answer
The share of companies who took 1-9 days to give out offers was 26.4% in 2013, but rose to over 30% for 2016 graduates (34.4%) and 2017 graduates (32.9%). For 2017 graduates, 59.5% of companies sent out offers within 19 days.
The share of students who finish job hunting within half a year is increasing every year (from 55.9% for 2015 graduates to 67.0% for 2017 graduates). In particular, students who finished job hunting in between 1 and 3 months rose considerable from 13.4% for 2015 graduates to 26.9% for 2017 graduates.
CompanyAround 70% of students finished job hunting within half a year
Over 30% of companies took between 1 and 9 days to send out their first offers after first-round interviews
(%) (%)
1-9 days 10-19 days 20-29 days 30-39 days 40+ days
1-3 months 4-6 months 7-9 months 10-12 months 13+ months
2017 graduates
2016
2015
2017 graduates
2016
2015
2014
2013
Average number of days
18.0days
18.3days
19.4days
21.0days
21.9days
Number of days from the first interview to sending offers to prospective employees (shortest case)
3 Time from the starting to finishing job hunting4
The biggest issue in recruiting 2017 graduates
was “ensuring the number of applications”. This
was because applications and introductions from
recruitment information sites and graduate em-
ployment agencies, which used to be our main
channels, are decreasing year by year. Particular-
ly, during the 2016 graduate recruitment season,
we felt the limitations of attracting candidates us-
ing recruitment information sites, such as when
there were no participants at our combined infor-
mation sessions and aptitude tests.
Therefore, during the recruitment of 2017 gradu-
ates, we acted on the assumption that the number
of applications from recruitment information web-
sites would further decrease. To compensate, we
increased the number of times we attended joint
company information sessions and on-campus in-
formation sessions from 20 to 30. We directly con-
tacted promising students who had submitted pro-
file cards and encouraged them to participate in
our in-house information sessions. As a result, the
number of students we were in direct contact with,
the interview participation rate of the information
session participants, and the number of offer re-
cipients all increased. However, the offer refusal
rate, which is usually around 50%, also increased
to about 60%, which is an issue we need to ad-
dress for 2018 graduate recruitment.
Recruitment channels have been becoming more
diverse over the past few years. Until around the
2013 graduate recruitment season, the focus on
recruitment information sites and employment
agencies was high, but now these are being sup-
plemented by joint company information sessions,
the promotion of part-time employees, and the
employment of recent graduates. In the past, we
promoted employees from part-time positions on
an individual basis if they discussed it with us, but
for the first time, for the 2016 recruitment season,
we publicized internally this form of recruitment,
and the result was the promotion of more than 20
people. For 2017 graduates, too, around 10 peo-
ple are expected to join the company. We are also
employing 5–10 recent graduates every year,
treating them the same as other students.
Applications and introductions from recruit-ment information sites and employment agencies are decreasing year by year
Developing recruitment activities through five channels, such as the promotion of part-time workers and recent graduates
37

References and Survey List
Website
< References >
『大学から社会へ―人材育成と知の還元』小方直幸編 / 玉川大学出版部 / 2011(平成23)年発行 (Naoyuki Ogata, “From University to Society―Human Development and Knowledge Profits to Society”, Tamagawa University Press, 2011)
『就職ジャーナル』( 1985年~2009年発行分) / リクルート (“Shushoku Journal”, Recruit, 1985-2009)
『Works』 6号(1996年)、102号(2010年) / リクルートワークス研究所 (“Works”, vol.6, 1996; vol.102, 2010; Recruit Works Institute)
『「新卒採用」の潮流と課題』(2010年)/ リクルートワークス研究所(“New Graduate Recruitment Trends and Issues”, 2010, Recruit Works Institute)
< Surveys >
厚生労働省「一般職業紹介状況(職業安定業務統計)」(Ministry of Health, Labour and Welfare, “Employment Referrals for General Workers (Occupational Stability Statistics”)
リクルートワークス研究所「ワークス大卒求人倍率調査」(2016年4月)、「ワークス採用見通し調査」(2017年1月)(Recruit Works Institute, “Works Survey on the Ratio of Job Vacancies to Job Seekers”, April 2016, “Works Recruitment Prospects Survey”, January 2017)
日本学生支援機構「留学状況調査結果」(Japan Student Services Organization, “Results of the Survey on Studying Abroad”)
人事院「国家公務員採用試験実施状況」(National Personnel Authority “Implementation of the National Civil Servant Recruitment Examination”)
Published 27 March 2017
■ Published/Editor Hitomi Okazaki, General Manager, Research Institute for Guraduate Recruitment
■ Research Institute for Guraduate Recruitment Kiyoko Sugimura, Hideko Tokunaga, Yosuke Nakagawa, Takami Suzuki, Tomomi Oota, Misaki Yoshida
■ Production partners Yuka Asada (editor/writer), Yuki Hikasa (editor/writer), Shinya Yoshino (writer),
Tateno Kazuhiro (illustrator), Tomoko misawa (survey assistant), Yuki Takayama (production assistant),
Kikuko Hasebe (proofreader), Kuwa Design (designer), Dai Nippon Printing Co., Ltd. (printer),
Adam Majoe (english translator), Mai Furukawa(english proofreader)
The latest survey and research information is available on the Research Institute for Graduate Recruitment website.
From March 2017, we began publishing information on the Employment Process Survey (job offer rate) for 2018 graduates. We report
monthly survey results "as of 1 March" and "as of 1 April", etc. In addition, past survey results, etc. can be found on our homepage. We also
post interviews about corporate efforts and reports on employment readiness, etc.
URL:http://data.recruitcareer.co.jp/
Published Content ・Employment Process Survey (2011–2018 graduates)
*Surveys of 2018 graduates also released
・Employment White Paper (surveys for 2012–2017 graduates)
・Internship case studies
38

White Paper on Employment
Research Institute for Graduate Recruitment
Activities
We want to create a society where as many people can feel vitalized
through the “joy of work”.
This is the corporate vision of Recruit Career.
For the Research Institute for Graduate Recruitment, grasping the
“Now” and “Future” of employment and releasing them to society
can enhance mutual trust among those involved in employment and
recruitment and promote Development, Evolution, and Change.
The Research Institute for Graduate Recruitment periodically conducts quantitative and qualitative sur-
veys of students and companies. We produce interview correspondence and event activities, etc.
based on the survey results.
The Employment Process Survey is a
student survey conducted monthly to
gain an understanding of the job hunt-
ing situation, such as through the job
offer rate or the job hunting activities
implementation rate. We are examine
specific survey items that are of inter-
est, such as the status of internship
implementation, the number of compa-
nies that student receive offers from,
the offer rejection rate, and pressure
on students to finish job hunting.
In November 2016 and February 2005, we hosted the In-
dustry-Academia World Café together with the Sankei Shim-
bun Company and the Osaka Chamber of Commerce and
Industry with the aim of “achieving better job hunting, better
recruitment” for students and companies. Following a panel
discussion, participants were divided into groups for a table
dialogue, and each person made a presentation. After that,
students and participants from companies and universities
exchanged opinions openly, helping to promote mutual un-
derstanding.
The White Paper on employment is a
survey of companies and students to
grasp the recruitment and job hunting
activity characteristics each year. Via
press releases, we introduce commen-
taries on recruitment and job hunting
activities and internships. As part of the
quantitative survey, we interview com-
panies and students, etc. and also is-
sue a booklet.
The February session was held at Kansai University’s Umeda Campus.
We also carry out a range of other surveys, including Charac-
teristics of Companies at Which Students Want to Work, Report
on the Regional Migration of University Students, and Recruit-
ment and Job Hunting Activities of Foreign Students.
Main Activities
■ Employment Process Survey
■ Industry-Academia World Café
Surveys and Research
Events
■ White Paper on Employment
■ Other surveys
39

Not for sale. Printed in Japan.
*The unauthorized reproduction or duplication of the articles, photos, and illustrations in this report is forbidden. Use is allowed with correct citation after informing the “Recruit Career Public Relations Manager ([email protected])” in advance. ©Recruit Career Co., Ltd.
Research Institute for Graduate Recruitment