whitehorse vehicle emissions testing clinic 2009 final report
TRANSCRIPT
_______________________________________________
Whitehorse
Vehicle Emissions Testing Clinic
June 4th and 5th 2009
_______________________________________________
Final Report
Prepared by:
S.J.Stewart PhD., P.Eng. Senior Project Engineer D.I.Gourley P.Eng. Manager, Operations B.Coupland Emissions Testing Specialist Pacific Vehicle Testing Technologies Ltd
June 2009
Summary A voluntary emissions-testing clinic was held in Whitehorse on June 4th and 5th 2009. A total of 161 vehicles were tested, most of which were light-duty trucks (pick-ups, vans and SUV’s) or passenger cars. One motorcycle was tested. The organizational and technical aspects of the clinic went very well, and it was well received by the drivers who came for testing. The results of the tire pressure testing component of the clinic underlined the importance of regularly checking and adjusting tire pressures, especially in a region that has a wide range between winter and summer temperatures. Tires correctly inflated at minus 20 degrees Celsius will be over-inflated at plus 20 degrees Celsius and vice-versa. During the transition from cold to warm ambient temperatures, there should be a tendency to find higher-than-recommended tire pressures and this was observed during the clinic. In 2007, when the clinic was held in the fall, there was a greater tendency to find under-inflated tires as ambient temperatures were in the process of dropping. The emissions testing data indicate that vehicles less than 12 years old in Whitehorse perform about the same as newer vehicles in the Lower Fraser Valley AirCare area. This is due to the technological improvements made by vehicle manufacturers over the last decade. Both the effectiveness and durability of emission control systems have improved significantly, meaning that vehicles remain in compliance with emission standards as long as no major components or sensors fail. Older vehicles have a higher likelihood of having excessive emissions because of greater wear and tear imposed on systems that were somewhat less durable to begin with. The incidence of emission problems with these older vehicles in Whitehorse is significantly higher than in the AirCare area, and this suggests that a mandatory emission inspection requirement for older vehicles could make a real difference to the vehicle emissions problem in the area. There is a clear need for improved repair industry training, in emissions control and diagnosis in general, and in understanding On Board Dignostic systems. This type of training could be developed into a format that could be delivered locally, but there is also scope for some remote, or on-line training delivery and technical support functions. The importance of a competent, aware repair indusrtry is at least equal to the importance of holding regular clinics. At present it does not appear that any suitable training is easily available.
2
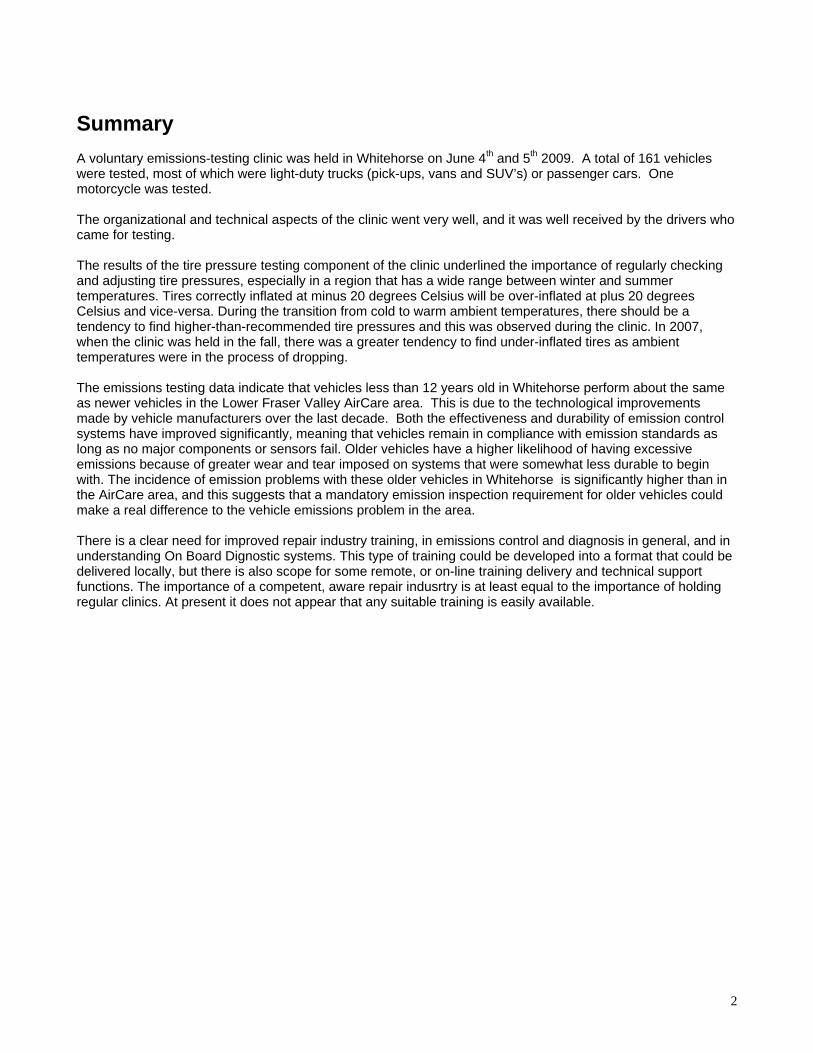
Introduction Until 2005 Environment Canada conducted regular emission testing clinics for in-use light-duty vehicles at various locations across the country. The most recent Environment Canada (EC) clinic in Whitehorse was in 2003. In 2007 the Yukon Energy Solutions Centre contacted Pacific Vehicle Testing Technologies (PVTT), which manages the British Columbia AirCare Program, about running a clinic. The basic concept and intent would be the same as for those conducted by EC. The EC clinics performed a two-speed idle tailpipe test, and relied on paper records, which were later input to a computer for analysis. PVTT created a touch-screen laptop system to enter data directly at the time of the test. PVTT also included On-Board Diagnostic (OBD) inspection as well as the two-speed idle (TSI) tailpipe test, gas cap pressure test, Emission Controls Systems (ECS) tampering inspection, and diesel smoke opacity measurement. At the time of the 2007 clinic it was agreed that it should be repeated periodically, hence the 2009 clinic. The local organization, public information campaign, and a survey of participants were all carried out by the Energy Solutions Centre. The Energy Solutions Centre also conducted a survey to determine which methods of advertising were most effective in bringing motorists to the clinic. The clinic was held in the parking lot of the Canadian Tire building in Whitehorse, and was easily visible to traffic on Two Mile Hill. Two complete inspection operations were set up, to provide two inspection ‘lanes’ .
3
Equipment and Testing
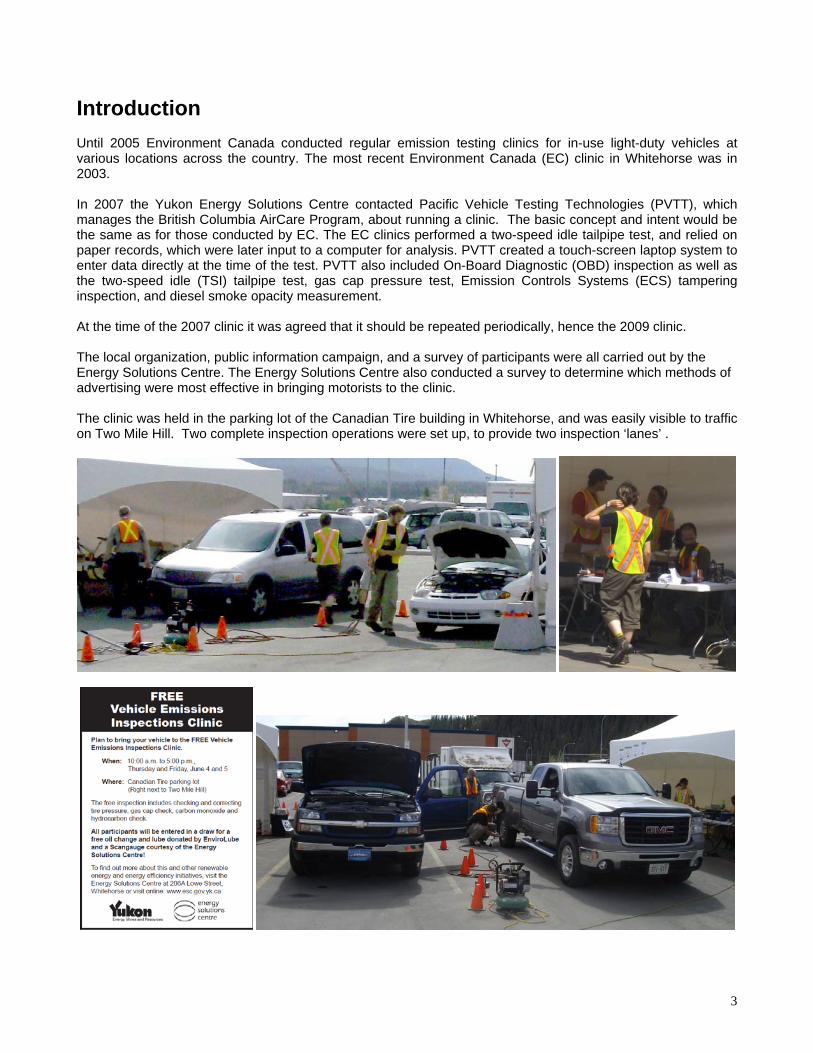
• Tire Pressures were checked using mechanical gauges. All four pressures were recorded; then, in consultation with the vehicle owner and after checking any information on the vehicle decals, the tires that needed it were adjusted upward or downward to the correct pressure as needed.
• Gas Caps on all 1997 and older vehicles were removed and pressure-tested using Waekon hand-held
testers. Diesel caps were not tested because diesel vehicles do not have evaporative emission controls. Most gas caps from 1998 and newer vehicles were not tested, because their sealing ability is regularly checked by the vehicle’s OBD system.
• Emission Control System components were checked on all 1997-and-older model year vehicles for
evidence of tampering or removal. In most cases, the components to be checked were as indicated on the underhood emissions decal. Typical ECS components checked were: Catalytic Converter; Positive Crankcase Ventilation (PCV) valve; Exhaust gas Recirculation (EGR) valve; Air Injection System (AIS); and Evaporative Canister.
4
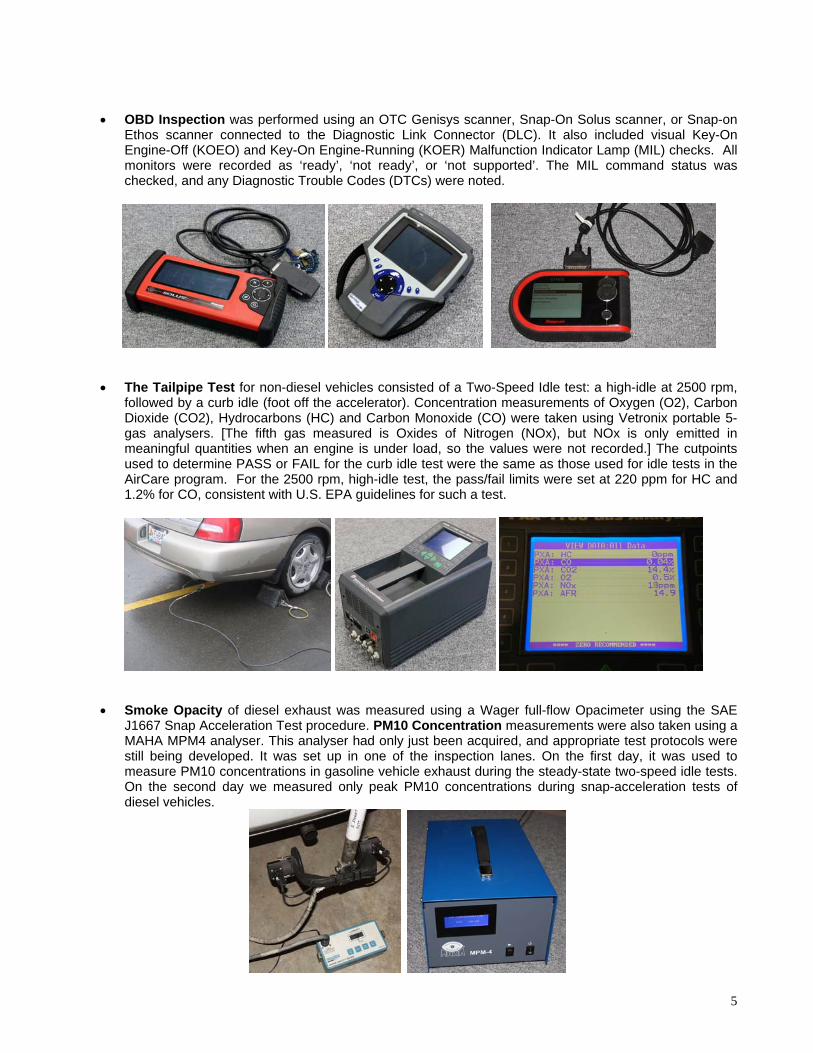
• OBD Inspection was performed using an OTC Genisys scanner, Snap-On Solus scanner, or Snap-on
Ethos scanner connected to the Diagnostic Link Connector (DLC). It also included visual Key-On Engine-Off (KOEO) and Key-On Engine-Running (KOER) Malfunction Indicator Lamp (MIL) checks. All monitors were recorded as ‘ready’, ‘not ready’, or ‘not supported’. The MIL command status was checked, and any Diagnostic Trouble Codes (DTCs) were noted.
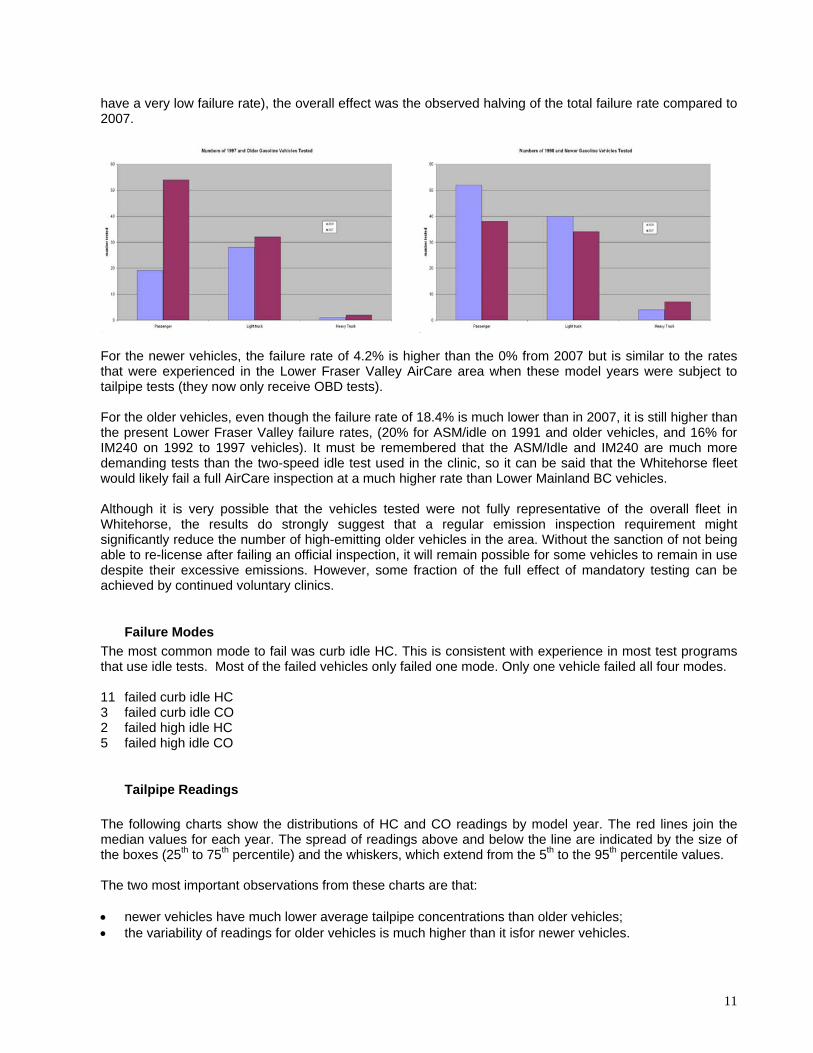
• The Tailpipe Test for non-diesel vehicles consisted of a Two-Speed Idle test: a high-idle at 2500 rpm,
followed by a curb idle (foot off the accelerator). Concentration measurements of Oxygen (O2), Carbon Dioxide (CO2), Hydrocarbons (HC) and Carbon Monoxide (CO) were taken using Vetronix portable 5-gas analysers. [The fifth gas measured is Oxides of Nitrogen (NOx), but NOx is only emitted in meaningful quantities when an engine is under load, so the values were not recorded.] The cutpoints used to determine PASS or FAIL for the curb idle test were the same as those used for idle tests in the AirCare program. For the 2500 rpm, high-idle test, the pass/fail limits were set at 220 ppm for HC and 1.2% for CO, consistent with U.S. EPA guidelines for such a test.
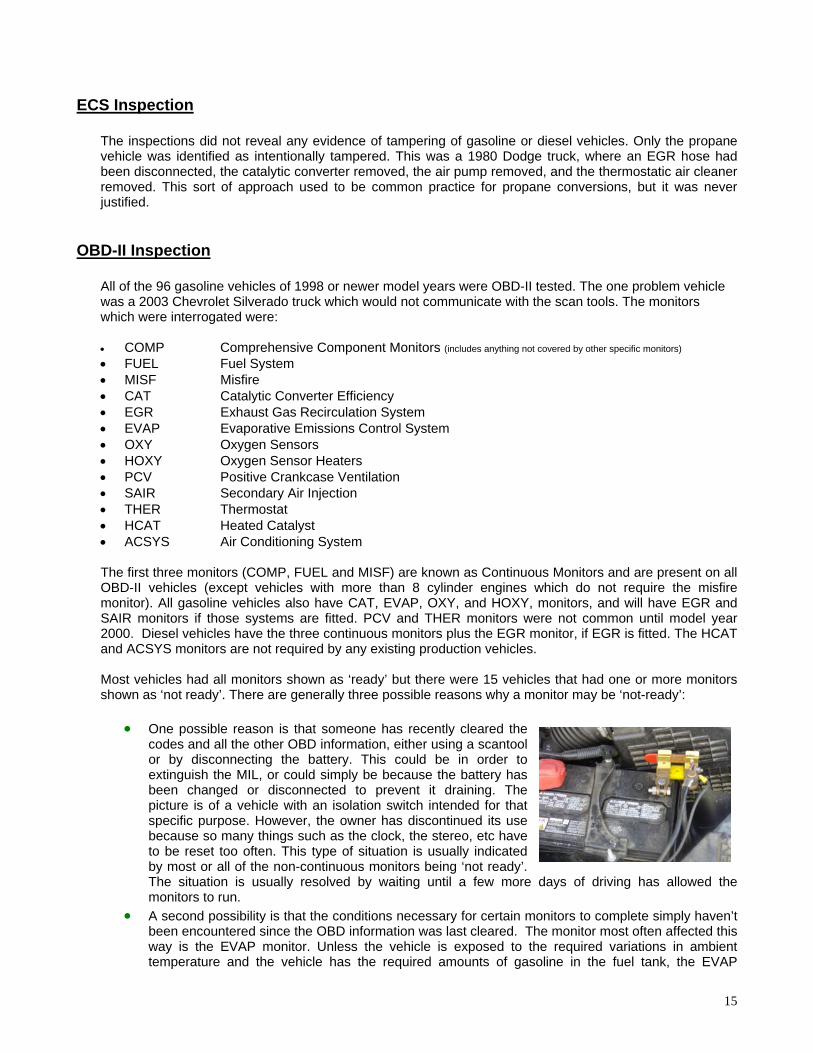
• Smoke Opacity of diesel exhaust was measured using a Wager full-flow Opacimeter using the SAE
J1667 Snap Acceleration Test procedure. PM10 Concentration measurements were also taken using a MAHA MPM4 analyser. This analyser had only just been acquired, and appropriate test protocols were still being developed. It was set up in one of the inspection lanes. On the first day, it was used to measure PM10 concentrations in gasoline vehicle exhaust during the steady-state two-speed idle tests. On the second day we measured only peak PM10 concentrations during snap-acceleration tests of diesel vehicles.
5

Vehicles Tested The total number of vehicles tested over the two days was 161. This total is a bit lower than the 181 tested in September of 2007, with the difference being mainly a smaller number of passenger vehicles with truck numbers being about the same. The clinic was intended for vehicles less than 5000 kg gross vehicle weight rating (GVWR), so in the following sections, ‘heavy truck’ refers to trucks over 3757 kg (8500 lb) GVWR. In 2007, there was a significant number of RHD Japanese vehicles brought to the clinic that had been imported under a 15-year exemption that allows vehicles to be imported, even if they were not manufactured to meet North American safety and emission standards. Only one such vehicle was presented this year, a repeat visit of a diesel truck that was now running on 50% biodiesel. In 2007 the same truck was running on a lower biodiesel concentration of 8%. It would be worth comparing the age profile of the inspected vehicles to the overall age profile for vehicles registered in Whitehorse. The overall registration data should be available from the Yukon Department of Community Services, Motor Vehicles Branch, but PVTT may also be able to obtain some fleet data from Environment Canada. Comparing the tested fleet sample to the overall population would give an indication of how representative the clinic results would be compared to the total vehicle population.
Vehicle Types and Fuel 71 gasoline passenger vehicles 68 gasoline light trucks 5 gasoline heavy trucks 1 hybrid passenger vehicles 1 motorcycle 5 diesel passenger vehicles 1 diesel light truck (this truck was using a biodiesel blend) 9 diesel heavy trucks 1 propane heavy truck
Model Years The overall impression from the clinic was that fewer older vehicles were tested this year than in 2007. This is supported by the basic statistics on median model year and range as well as the shape of this histogram compared to that for 2007. Since we did more OBD tests in 2009, the population of 1998 and newer vehicles was obviously larger in the 2009 sample. Passenger vehicle median model year = 2001, (range from 1984 to 2009) Light truck median model year = 2000, (range from 1987 to 2007 Heavy truck median model year = 2000, (range from 1989 to 2000)
6

Engine Size (gasoline only) Passenger mean=2.0L, (range from 1.3 to 3.8) Light truck mean=3.6L, (range from 2.0 to 5.8) Heavy truck mean=5.7L, (range from 5.4 to 6.8) These values are a little different than was observed in 2007, but not significantly so. There were zero eight cylinder engine passenger cars presented for inspection, consistent with the general shift away from such engines in cars. All of the heavy trucks had V8 engines, while the light trucks had a mix of 4,6 and 8-cylinder engines In the chart below, the red line connects the median values for each model year; the boxes extend from the first quartile value to the third quartile; and the whiskers show the locations of the 5th percentile and the 95th percentile. So as well as indicating how average values relate to model year, the charts also show how much spread the actual values have above and below the average. The chart suggests a general trend to larger displacement engines over time, but the variation within each model year is much greater than the trend in the average.
7

Odometer Readings Passenger mean= 123,151 km, (range from 4,041 to 352,364) Light truck mean= 157,355 km, (range from 24,432 to 363,772) Heavy truck mean= 212,511 km, (range from 70,196 to 463,336) The slope of the following chart suggests that annual mileage (odometer reading divided by age) averages around 19,000 km/year over the first 6 years of life and then drops off a little. This is a bit higher than the observed trend in the Vancouver region.
8

OBD-II vehicles In Canada all 1998 and newer model year light-duty vehicles are required to have second generation On-Board Diagnostics (OBD II). OBD is a system wherein the vehicle’s engine control module continually monitors a number of systems that are essential for controlling emissions. When the system detects a fault, it stores a Diagnostic Trouble Code (DTC) and, for some faults, it immediately lights the Malfunction Indicator Lamp (MIL) on the dash to alert the driver to the need for attention. For other faults the MIL is not illuminated until the fault has been confirmed by being detected a second time. OBD can help ensure that emission-related malfunctions are repaired promptly (rather than later or never) and provides the repair mechanic with useful diagnostic information that can help pinpoint the problem. There were 96 non-diesel vehicles of model years 1998 or newer presented for testing. This was an increase of 16 vehicles compared to 2007. All were OBD-II equipped. 51 gasoline passenger vehicles 40 gasoline light trucks 4 gasoline heavy trucks 1 hybrid The 5 diesel passenger vehicles of 1998 or newer model years were also all OBD-II compliant.
Results
Tire Pressures Of the 161 vehicles tested, there were 60 vehicles (37%) that had at least one tire with low pressure, and 115 vehicles (71%) that had at least one tire over-inflated. The reference for tire pressure was the manufacturer’s recommended cold inflation pressure for the size of tire fitted as shown on the label affixed to the vehicle. Occasionally, vehicle owners had installed different tires or had a specific preference for a higher inflation pressure. It was necessary to apply some judgment as to whether or not to adjust the tire pressures, either up or down. As a general rule, the inflation pressures of left and right side tires on the same axle were set the same. 28 had one tire low 16 had two tires low 10 had three tires low 6 had all four tires low 26 had one tire high 22 had two tires high 24 had three tires high 43 had all four tires high On average, those tires which were low, were low by about 6 psi, and those that were high were high by about 6 psi. The mean difference between lowest and highest pressures on an individual vehicle was10 psi or 22% of the high value Overall, the incidence of incorrect tire pressures was significantly different than observed in 2007 (in 2007 40% had at least one tire low, and 16% at least one tire high). We speculate that the time of year could be a
9

major factor in this observation. The ambient temperature difference from –40oC in winter to +28oC during the time the clinic was held would be enough to cause a 25% increase in tire pressure, so that any tires set correctly some months ago could have been higher by about 8 or 10 psi on the day of the clinic. The observed incidence of high pressures in September 2007 was much lower. The range of ambient temperature between summer and winter in Whitehorse underlines the importance of checking tire pressures more frequently than would be required in regions with less ambient temperature range. Generally, higher inflation pressures correspond to lower rolling resistance and better fuel economy. Manufacturers’ tire pressure recommendations are based on a nominal load of passengers and cargo and strike a balance between ride quality, traction and tire life. Running tires at inflation pressures well above the recommended values causes them to wear in the centre and can compromise traction for braking and accelerating. The natural temperature increase that occurs when driving can push an over-inflated tire beyond the manufacturer’s recommended maximum inflation pressure, which could be dangerous. As a rule, tire pressures above 30 psi are desirable. Inflation pressures greater than 35 psi are generally only recommended for truck tires where load capacity is higher. In future clinics, it is recommended that tire pressures be reduced only if the degree of over-inflation is likely to cause problems. It should also be remembered that, given that vehicles participating in the clinic have been driven recently, their tires could be expected to show a 2-3 psi increase over the cold inflation pressure.
Two-Speed Idle Test
Failure rate The two-mode tailpipe emission test was conducted on all 145 gasoline-powered vehicles. There were 13 gasoline vehicles (9.0%) that failed one or more parts of the test. The one 1980 propane-fueled heavy truck failed. This was not unexpected, however, as propane conversions, unless properly done, typically make emissions output higher, rather than lower. There were not really enough cases to allow an analysis of failure rate by model year, but it is worth defining two age groups: pre-1998 vehicles and 1998 and newer vehicles. This allows comparison of tailpipe results with OBD results. For the pre-1998 gasoline vehicles the failure rates were:
4 passenger vehicles failed out of 19 (21%) 5 light trucks failed out of 28 (18%) 0 heavy trucks failed out of 1 (0%) 0 motorcycles failed out of 1 (0%) So the overall failure rate for these older vehicles was 18.4%.
For the 1998 and newer gasoline vehicles the failure rates were:
4 passenger vehicles failed out of 52 (8%) 0 light trucks failed out of 40 (0%) 0 heavy trucks failed out of 4 (0%) So the overall failure rate for these newer vehicles was 4.2%.
Compared to 2007, the overall failure rate is much lower (9.0% of gasoline vehicles compared to 18.5% in 2007). The big difference is for the older vehicles (pre-1998) which failed at a rate of 34% in 2007 but only at a rate of 18% this year. We simply did not see as many high-emitting old vehicles this time, but it would be pure speculation to suggest that the numbers of such vehicles actually in-use may have decreased. When this reduced failure rate is combined with the increased fraction of newer vehicles (1998 and newer, that
10
have a very low failure rate), the overall effect was the observed halving of the total failure rate compared to 2007.
For the newer vehicles, the failure rate of 4.2% is higher than the 0% from 2007 but is similar to the rates that were experienced in the Lower Fraser Valley AirCare area when these model years were subject to tailpipe tests (they now only receive OBD tests).
For the older vehicles, even though the failure rate of 18.4% is much lower than in 2007, it is still higher than the present Lower Fraser Valley failure rates, (20% for ASM/idle on 1991 and older vehicles, and 16% for IM240 on 1992 to 1997 vehicles). It must be remembered that the ASM/Idle and IM240 are much more demanding tests than the two-speed idle test used in the clinic, so it can be said that the Whitehorse fleet would likely fail a full AirCare inspection at a much higher rate than Lower Mainland BC vehicles. Although it is very possible that the vehicles tested were not fully representative of the overall fleet in Whitehorse, the results do strongly suggest that a regular emission inspection requirement might significantly reduce the number of high-emitting older vehicles in the area. Without the sanction of not being able to re-license after failing an official inspection, it will remain possible for some vehicles to remain in use despite their excessive emissions. However, some fraction of the full effect of mandatory testing can be achieved by continued voluntary clinics.
Failure Modes The most common mode to fail was curb idle HC. This is consistent with experience in most test programs that use idle tests. Most of the failed vehicles only failed one mode. Only one vehicle failed all four modes.
11 failed curb idle HC 3 failed curb idle CO 2 failed high idle HC 5 failed high idle CO
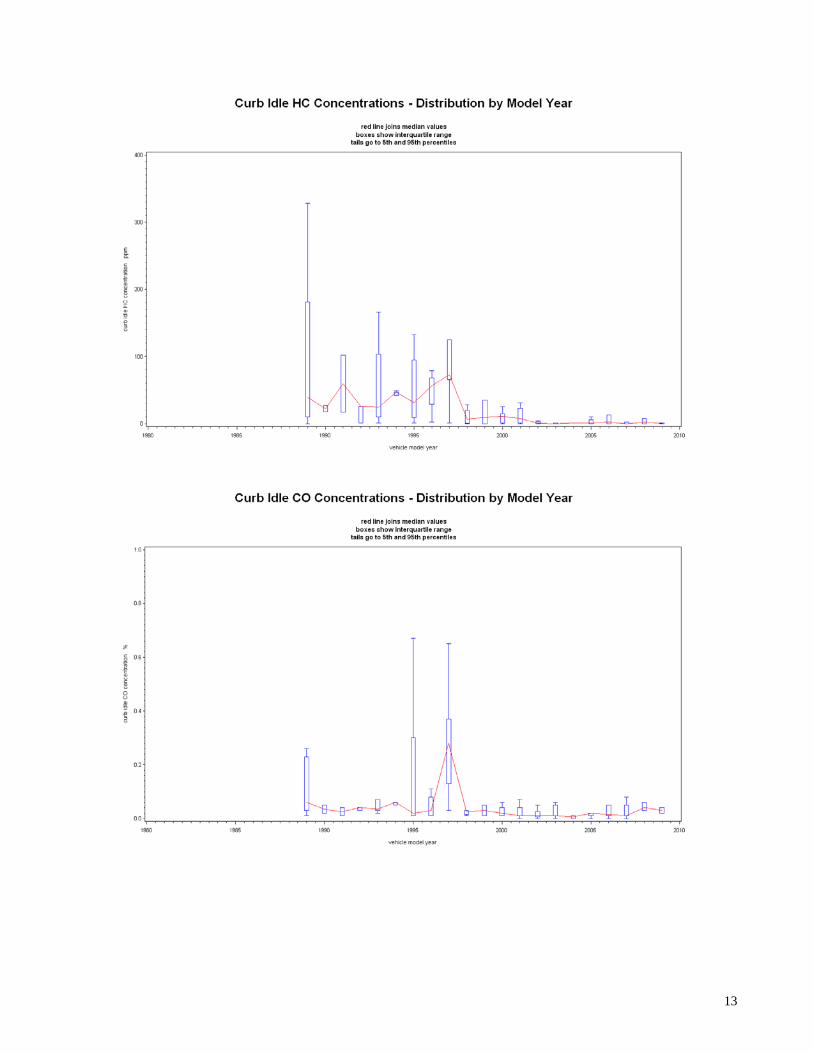
Tailpipe Readings
The following charts show the distributions of HC and CO readings by model year. The red lines join the median values for each year. The spread of readings above and below the line are indicated by the size of the boxes (25th to 75th percentile) and the whiskers, which extend from the 5th to the 95th percentile values.
The two most important observations from these charts are that:
• newer vehicles have much lower average tailpipe concentrations than older vehicles; • the variability of readings for older vehicles is much higher than it isfor newer vehicles.
11

This means that we can confidently expect a newer vehicle to have low readings, with very little probability of being wrong. However, an older vehicle’s performance is much more difficult to predict.
One thing that these charts do not show is just how high the extreme values were. There was one 1998 Mercury Mystique for which both CO readings were about 12%, which indicates an extremely over-rich mixture, and, apart from its environmental and health effects, is bad for the engine and for fuel economy. This vehicle also had extremely high HC readings, again due to the extremely rich air-fuel ratio. The owner was unaware of the problem even though the MIL was illuminated, but he was assured that having the vehicle repaired would undoubtedly improve its fuel consumption significantly, as well as helping the environment and engine longevity. There were also three DTCs, consistent with the vehicle’s extremely over-rich condition and indicating problems with the oxygen sensors that are critical for proper mixture control. The other two vehicles that stood out as particularly high emitters were a 1984 Volkwagen Vanagon and a 1980 Dodge truck running on propane. The VW Vanagon had very high CO and HC readings at the tailpipe. It also had a gross exhaust leak just upstream of the catalytic converter that caused the readings to be greatly diluted (as indicated by very high O2 concentrations), so the actual HC and CO concentrations from the engine would have been 2 or 3 times what was measured at the tailpipe. Fortunately this vehicle is not usually driven. Even so, considering that its emissions are likely 100 times the level expected from a new car or truck, even driving it 200 km a year will produce the same HC and CO emissions as 20,000km in a 2009 model year vehicle.
The owner of the propane Dodge truck claimed to have converted to propane ‘for the environment’. The truck’s emission controls were all disabled or removed, although this might have happened before the conversion. It was once common to remove emission components as part of propane conversions, but this was in the entirely incorrect belief that they were no longer needed when running on propane. In the Vancouver area, all such conversions very quickly failed their emission inspections as soon as the AirCare Program started in 1992, and now there are very few propane vehicles still operating in the region. This particular truck had extremely high HC emissions (unburned fuel in the exhaust) - more than twice as high as any other vehicle tested, as well as very high CO. On pre-OBD vehicles there appears to be some need for training for basic oxygen sensor operation and diagnostics. We observed several vehicles where it was apparent that the vehicle’s on-board computer was not controlling the air-fuel ratio correctly. As the vehicle’s computer uses the feedback from the oxygen sensor to accurately control the air-fuel ratio to an ideal level, ensuring these sensors are working correctly is of the utmost importance. A defective oxygen sensor will cause excessive emissions. While these types of failure are generally associated with excessive CO and HC emissions, depending on the manufacturer of the vehicle and their default strategy in the case of fuel control defects, the vehicle may be an excessive NOx emitter. There could also be some benefits in training repair technicians to identify defective catalytic converters, however, if the shops in Whitehorse are not equipped with gas analyzers this perhaps would be of little benefit.
12
13

Gas Cap The gas caps tested were all from the pre-1998 gasoline vehicles. Five of the caps failed the test because they would not hold air pressure, which is a similar percentage (10%) as was found during initial AirCare studies in the Lower Fraser valley, before regular testing was adopted. The gas cap failure rate in the LFV is now about 3%.
14
ECS Inspection The inspections did not reveal any evidence of tampering of gasoline or diesel vehicles. Only the propane vehicle was identified as intentionally tampered. This was a 1980 Dodge truck, where an EGR hose had been disconnected, the catalytic converter removed, the air pump removed, and the thermostatic air cleaner removed. This sort of approach used to be common practice for propane conversions, but it was never justified.
OBD-II Inspection All of the 96 gasoline vehicles of 1998 or newer model years were OBD-II tested. The one problem vehicle was a 2003 Chevrolet Silverado truck which would not communicate with the scan tools. The monitors which were interrogated were: • COMP Comprehensive Component Monitors (includes anything not covered by other specific monitors)
• FUEL Fuel System • MISF Misfire • CAT Catalytic Converter Efficiency • EGR Exhaust Gas Recirculation System • EVAP Evaporative Emissions Control System • OXY Oxygen Sensors • HOXY Oxygen Sensor Heaters • PCV Positive Crankcase Ventilation • SAIR Secondary Air Injection • THER Thermostat • HCAT Heated Catalyst • ACSYS Air Conditioning System The first three monitors (COMP, FUEL and MISF) are known as Continuous Monitors and are present on all OBD-II vehicles (except vehicles with more than 8 cylinder engines which do not require the misfire monitor). All gasoline vehicles also have CAT, EVAP, OXY, and HOXY, monitors, and will have EGR and SAIR monitors if those systems are fitted. PCV and THER monitors were not common until model year 2000. Diesel vehicles have the three continuous monitors plus the EGR monitor, if EGR is fitted. The HCAT and ACSYS monitors are not required by any existing production vehicles. Most vehicles had all monitors shown as ‘ready’ but there were 15 vehicles that had one or more monitors shown as ‘not ready’. There are generally three possible reasons why a monitor may be ‘not-ready’:
• One possible reason is that someone has recently cleared the codes and all the other OBD information, either using a scantool or by disconnecting the battery. This could be in order to extinguish the MIL, or could simply be because the battery has been changed or disconnected to prevent it draining. The picture is of a vehicle with an isolation switch intended for that specific purpose. However, the owner has discontinued its use because so many things such as the clock, the stereo, etc have to be reset too often. This type of situation is usually indicated by most or all of the non-continuous monitors being ‘not ready’. The situation is usually resolved by waiting until a few more days of driving has allowed the monitors to run.
• A second possibility is that the conditions necessary for certain monitors to complete simply haven’t been encountered since the OBD information was last cleared. The monitor most often affected this way is the EVAP monitor. Unless the vehicle is exposed to the required variations in ambient temperature and the vehicle has the required amounts of gasoline in the fuel tank, the EVAP
15
monitor will not run. Another monitor that can sometimes take a while to complete is the CAT monitor. Each manufacturer strategically programs their catalyst monitor in different ways; some require just a certain amount of highway driving, but others require driving at certain speeds for specific periods. If a vehicle is not operated in the way required for its own catalyst monitor to run, it will simply remain ‘not-ready’. Resolving this type of situation may require some research into exactly what operating cycle is required for the specific vehicle to run the monitor.
• The third possibility is that there is some underlying problem that prevents the monitor completing. All monitors have their own list of pre-conditions, which include certain operating conditions as described above, but also require that certain components are working correctly. A simple example is the catalyst monitor, which relies on upstream and downstream oxygen sensor signals to derive its assessment of catalyst efficiency. If a problem is detected with the oxygen sensors the catalyst monitor simply does not run. This type of problem might be suspected if a monitor still hasn’t completed after a long period, or when one is sure that its required operating conditions have been provided. Its resolution requires some actual troubleshooting and diagnosis to find out what the underlying fault is.
Three of the vehicles that were not completely ready were heavy-duty trucks that were ‘not ready’ for the Catalyst monitor and the O2S monitors. However, these could be data entry errors, because heavy duty trucks would normally be expected to show these monitors as ‘not supported’. The most common monitor to be not ready (8 cases) was the Evaporative System monitor. As mentioned above, it is often the one most likely to be not ready, especially in a location such as Whitehorse where the ambient temperature variation probably does not match very well with the EVAP monitors requirements. The next most common ‘not ready’ monitor was the Catalyst monitor (6 cases) None of the 15 ‘not ready’ vehicles actually had the Malfunction Indicator Lamp (MIL) commanded ON, and only one of them had Diagnostic Trouble Codes (DTCs). This was a 2006 Subaru Impreza with DTCs P0026 and P0028 which are for the variable intake valve solenoid circuit. There was one light duty truck and six passenger vehicles where the MIL was commanded ON. All of these vehicles also failed the KOER test which is a visual check that the MIL goes out when the engine is running. All had stored DTCs. Also, one of the diesel passenger vehicles had the MIL commanded ON, again with DTCs. There were five vehicles that had DTCs, but did not have the MIL commanded ON. In total twelve gasoline vehicles and one diesel vehicle had DTCs. The details are shown in the table.
16

MIL DTC Description
Light TruckDODGE CARAVAN 2002 ON
ON
ON
ON
ONON
ON
ON
P0442 Evaporative Emission System Leak Detected (small leak)P0455 Evaporative Emission System Leak Detected (large leak)
DODGE RAM 1500 2005 OFF P0456 Evaporative Emission System Leak Detected (very small leak)JEEP LIBERTY 2005 OFF P0420 Catalyst System Efficiency Below Threshold
PassengerMERCURY MYSTIQUE 1998 P0153 O2 Sensor Circuit Low Voltage
P1151 System Lean Bank 2P1131 System Lean bank 1
SUBARU OUTBACK 1998 P0325 Knock Sensor 1 CircuitP0400 Exhaust Gas Recirculation Flow
SUBARU OUTBACK 1999 P0325 Knock Sensor 1 CircuitSUBARU IMPREZA 1999 OFF P0303 Cylinder 3 Misfire DetectedSUBARU LEGACY 2001 P0328 Knock Sensor 1 Circuit HighVOLVO V40 2001 P0133 O2 Sensor Circuit Slow Response HOXY NOT SUPPORTED
P0172 System Too RichP0302 Cylinder 2 Misfire Detected
VOLKSW AGEN JETTA 2003 P0351 Ignition Coil "A" Primary/Secondary CircuitCHEVROLET MALIBU 2004 OFF P0128 Coolant Thermostat (Coolant Temperature Below Thermostat Regulating Temperature)
P1258 Engine Coolant Over-Temperature – Protection Mode ActiveSUBARU IMPREZA 2006 OFF P0028 Intake Valve Control Solenoid Circuit Range/Performance (Bank 2)
P0026 Intake Valve Control Solenoid Circuit Range/Performance (Bank 1)
DieselVOLKSW AGON JETTA 1998 P1403 EGR control Problem
P0380 Glow Plug Circuit Monitoring Problem
These codes do not match very well with the ones found to be most common in the LFV AirCare area, but this is a very small sample on which to base any statistical observations. If the OBD-II vehicles had been inspected by AirCare in the LFV, the seven with the MIL commanded on would have failed, giving a failure rate of 7%, which is similar to the rate in the AirCare area, and a little higher than their tailpipe failure rate. There does appears to be a need to provide some training for repair shop and dealerships service advisors. Several vehicle owners commented that their dealership or regular repair shop’s counter staff had dismissed the importance of the vehicle’s MIL illuminating. One vehicle owner stated that their dealership informed them not to worry about the MIL being illuminated, as this is only a “false positive”. Three vehicles had the MIL illuminated with various EVAP DTCs associated with the OBD failure. A common comment from the repair industry is that the cause would likely be the fuel cap being left loose after refueling. While this is a real possibility, it very seldom the actual cause of the failure. This is borne out by the fact these vehicles still have the MIL being commanded on by the vehicle’s on-board computer and the EVAP DTCs stored in memory. Three Subaru vehicles had Knock Sensor DTCs associated with the MIL illumination. As previously mentioned, the owner’s of these vehicles commented that they had a repair shop look into this concern without success. As well as indicating a lack of training regarding OBD repair, it also illustrates that repair shops are not utilizing other resources such as technician-based websites to assist in unusual and or pattern type failures. The Subaru Knock Sensor failures would be considered to be a pattern failure and excellent diagnostic supplemental information is available through various technician web forums.
17
Diesel Smoke Opacity
Diesel smoke opacity was measured using the Wager Opacimeter, basically according to the SAE J1667 procedure. However, no path-length or ambient condition corrections have been applied to the measurements presented. The effect of these corrections would be to lower the opacity values, especially for the smaller engine vehicles.
A total of 15 diesels were tested. They were:
5 passenger vehicles, mean opacity 10% (range from 0% to 18%) 1 light-duty truck, opacity 0% 9 heavy-trucks, mean opacity 9% (range from 0% to 33%)
It should be noted that the heavy-duty trucks formed two distinct groups: four vehicles were of model years 1993 to 1996, and it was these that made visible smoke; the other five were of model years 2006 to 2008 and they made almost no visible smoke. Only one of the older heavy-duty trucks is likely to have failed the loaded opacity test (D147) that is used for mandatory inspections by AirCare. It was a 1994 GMC 2500 that showed 33% opacity. Although the smoke made by all four of the VW Golf and Jettas was noticeable (average value of 13%), it is not certain that they would have failed an AirCare transient test because the optical path-length corrections would have lowered their readings. However, having actual dynamometer load could make them produce much more smoke than in the free acceleration test used in the clinic. The other passenger vehicle was a Smart Fortwo which made no visible smoke. The one diesel light-duty truck was the used RHD Japanese import Landcruiser, operating on 50% biodiesel, and which also made no visible smoke. This is the same as it did in the 2007 clinic, when it was operating on 8% biodiesel.
PM10 Concentration Measurements
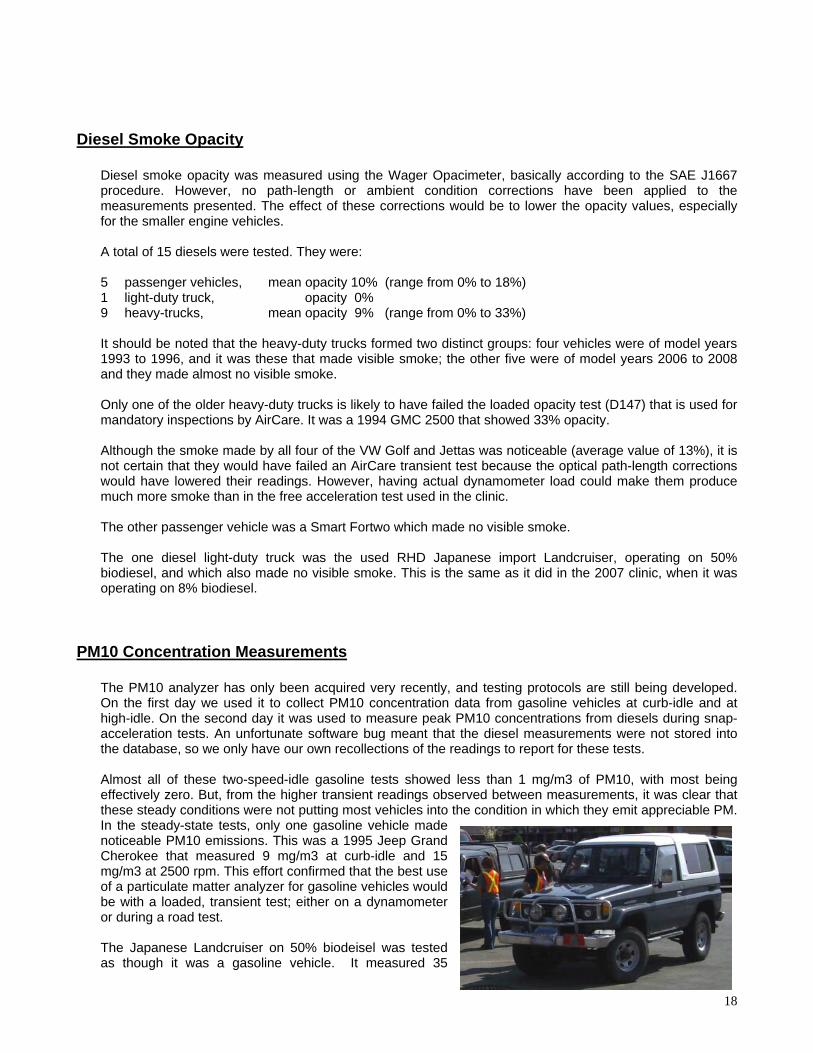
The PM10 analyzer has only been acquired very recently, and testing protocols are still being developed. On the first day we used it to collect PM10 concentration data from gasoline vehicles at curb-idle and at high-idle. On the second day it was used to measure peak PM10 concentrations from diesels during snap-acceleration tests. An unfortunate software bug meant that the diesel measurements were not stored into the database, so we only have our own recollections of the readings to report for these tests. Almost all of these two-speed-idle gasoline tests showed less than 1 mg/m3 of PM10, with most being effectively zero. But, from the higher transient readings observed between measurements, it was clear that these steady conditions were not putting most vehicles into the condition in which they emit appreciable PM. In the steady-state tests, only one gasoline vehicle made noticeable PM10 emissions. This was a 1995 Jeep Grand Cherokee that measured 9 mg/m3 at curb-idle and 15 mg/m3 at 2500 rpm. This effort confirmed that the best use of a particulate matter analyzer for gasoline vehicles would be with a loaded, transient test; either on a dynamometer or during a road test. The Japanese Landcruiser on 50% biodeisel was tested as though it was a gasoline vehicle. It measured 35
18

mg/m3 at curb-idle and 13 mg/m3 at high-idle. This confirmed that, although all the other emission indicators (smoke opacity and HC and CO concentrations) were very good, a diesel engine always emits much more PM than gasoline engines. The inherent characteristics of diesel fuel and the direct injection of diesel fuel into the cylinder means that carbon particles will always be formed. Diesel engine technologies such as common rail injection use extremely high injection pressures (25,000 psi or more) to create finer atomization of the fuel droplets but the burning of these small droplets as opposed to vaporized gasoline will always produce more particulate matter. Only the newest diesel engines (2007 and later) have diesel particulate filters (DPF) that trap the particles and prevent their escape out the tailpipe. There were four such vehicles tested; they were a 2007 Dodge Ram 3500, a 2007 GMC 2500, and two 2008 GMC 2500s. Their results confirmed the effectiveness of the DPFs, as all four had no measurable output of PM10 on any of the snap accelerations performed, and all had 0% opacity readings. Another similar Dodge Ram 3500 with a 2006-spec engine of the same type but with a diesel oxidation catalyst instead of a DPF, recorded PM10 readings of about 130 mg/m3 and average smoke opacity of 7%. It was very disappointing to find that the diesel snap-acceleration PM10 measurements were not saved. They had confirmed the validity of the smoke opacity testing, which has been a surrogate for direct PM measurements, which have not been possible until very recently. The readings had coincided nicely with the opacity measurements. The VW Golf and Jetta vehicles tested measured up to over 700 mg/m3 peak concentrations while showing up to about 18% opacity. This confirms a direct correlation between PM10 and opacity readings. .
Yukon Government Vehicles
Ten government-owned vehicles were tested. They are listed in the table. All of them were found to be running exactly how they should be, with very good readings all round. However, the first Ford F250 had OXY and HOXY monitors that were not ready; and the Chevrolet Tahoe and Ford Taurus both had EVAP monitors not ready.
19

Customer Survey
Reasons for Participation In 2009 there were 29% more people who came to the clinic because they were concerned about the environment and/or the relationship between fuel efficiency and emissions than in 2007. There were 25% fewer people who came to the clinic simply to learn about their vehicle’s performance or because they were just curious.
Why did you choose to take part in this year's clinic?
0%
10%
20%
30%
40%
50%
60%
To learn myvehicle's
performance
Forenvironmental
reasons
To learn moreabout fuel
efficiency andemissions
Just curious Other
Reason
Perc
enta
ge o
f rep
lies
20092007
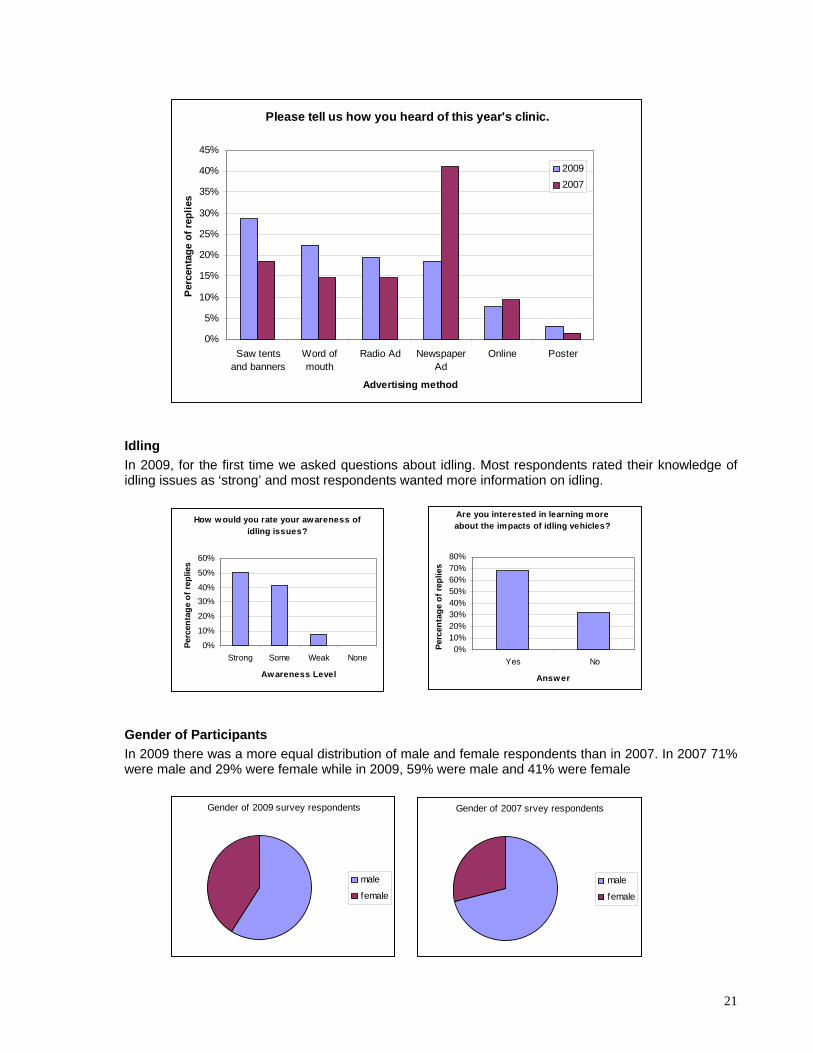
Effectiveness of Advertising In 2009, the most successful form of advertising was that provided by the presence of the tents and banners on site. “Word of Mouth” was also an important method of advertising in 2009 (as it was in 2007), yielding results similar to those of radio and newspaper advertising. Posters did not appear to be a very successful way of advertising the clinic. (In 2007, newspaper advertising was augmented with a newspaper article, which increased the number of people who learned of the clinic via the newspaper in that year.)
20
Please tell us how you heard of this year's clinic.
0%
5%
10%
15%
20%
25%
30%
35%
40%
45%
Saw tentsand banners
Word ofmouth
Radio Ad NewspaperAd
Online Poster
Advertising method
Perc
enta
ge o
f rep
lies
20092007
Idling In 2009, for the first time we asked questions about idling. Most respondents rated their knowledge of idling issues as ‘strong’ and most respondents wanted more information on idling.
How would you rate your awareness of idling issues?
0%
10%
20%
30%40%
50%
60%
Strong Some Weak None
Awareness Level
Perc
enta
ge o
f rep
lies
Are you interested in learning more about the impacts of idling vehicles?
0%10%20%30%40%50%60%70%80%
Yes No
Answer
Perc
enta
ge o
f rep
lies
Gender of Participants In 2009 there was a more equal distribution of male and female respondents than in 2007. In 2007 71% were male and 29% were female while in 2009, 59% were male and 41% were female
Gender of 2009 survey respondents
male
female
Gender of 2007 srvey respondents
male
female
21
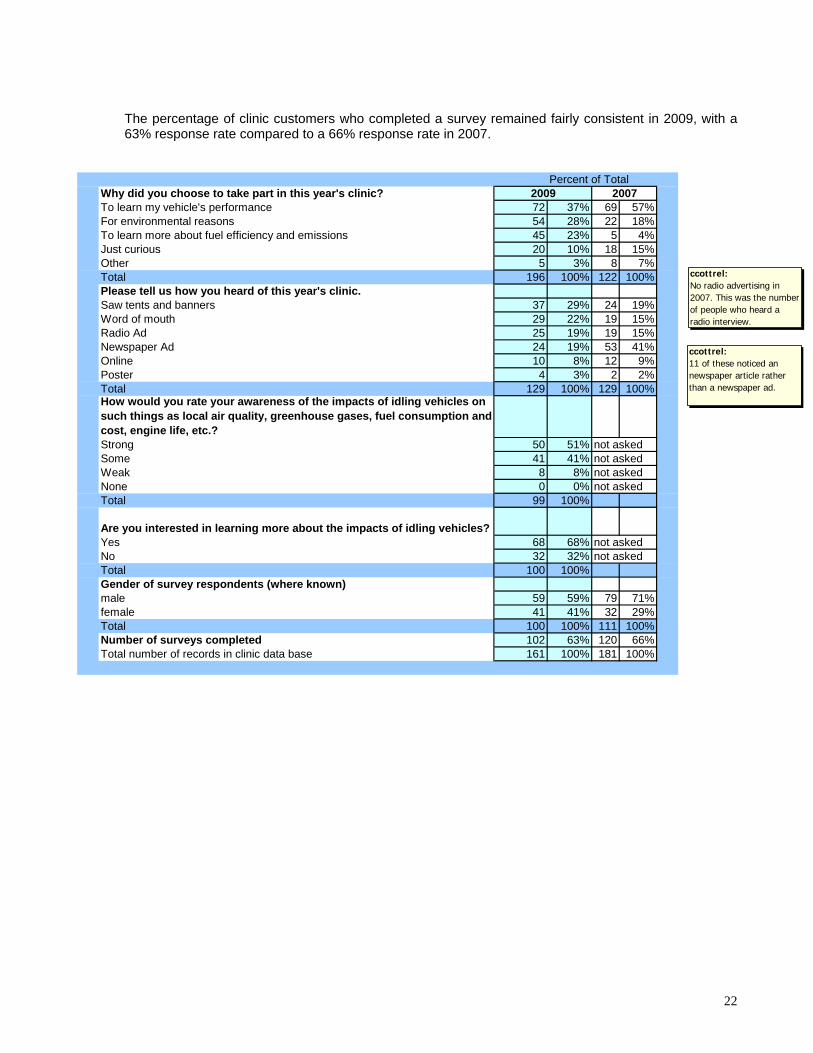
The percentage of clinic customers who completed a survey remained fairly consistent in 2009, with a 63% response rate compared to a 66% response rate in 2007.
Percent of TotalWhy did you choose to take part in this year's clinic?To learn my vehicle's performance 72 37% 69 57%For environmental reasons 54 28% 22 18%To learn more about fuel efficiency and emissions 45 23% 5 4%Just curious 20 10% 18 15%Other 5 3% 8 7%Total 196 100% 122 100%Please tell us how you heard of this year's clinic.Saw tents and banners 37 29% 24 19%Word of mouth 29 22% 19 15%Radio Ad 25 19% 19 15%Newspaper Ad 24 19% 53 41%Online 10 8% 12 9%Poster 4 3% 2 2%Total 129 100% 129 100%How would you rate your awareness of the impacts of idling vehicles on such things as local air quality, greenhouse gases, fuel consumption and cost, engine life, etc.?Strong 50 51% not askedSome 41 41% not askedWeak 8 8% not askedNone 0 0% not askedTotal 99 100%
Are you interested in learning more about the impacts of idling vehicles?Yes 68 68% not askedNo 32 32% not askedTotal 100 100%Gender of survey respondents (where known)male 59 59% 79 71%female 41 41% 32 29%Total 100 100% 111 100%Number of surveys completed 102 63% 120 66%Total number of records in clinic data base 161 100% 181 100%
2009 2007
ccottrel:No radio advertising in 2007. This was the number of people who heard a radio interview.
ccottrel:11 of these noticed an newspaper article rather than a newspaper ad.
22
Conclusions and Reccomendations
Tire Pressures • Tire pressure awareness is much more important in the Yukon with its wide range of winter-to-summer
temperatures than in other, more moderate, climates. The temperature range can easily add or subtract 8 or 10 psi to/from a tire that was set correctly some months previously.
Tailpipe Emissions • The tailpipe emissions failure rate for the pre-1998 vehicles was much lower than in 2007, but it is not
clear whether that simply indicates a different sample of vehicles that showed up for testing, or if it is indicative of any overall change in the performance of the fleet. The failure rate observed for the Whitehorse vehicles is still somewhat higher than the rate currently experienced in the LFV AirCare area.
• Two of the older vehicles could be described as “super-polluters”. Emissions-specific issues are not
normally part of regular vehicle maintenance in Whitehorse, and this suggests that a regular emission inspection requirement could significantly reduce the number of high-emitting older vehicles in the area. Even a voluntary program, if established as a regular event by running these clinics annually, could have a significant effect.
OBD Results • In general, the 1998 and newer, OBD-equipped vehicles appeared similar in emissions performance to
those in the LFV. Their tailpipe failure rate was about the same as previously observed in the LFV by AirCare, and their OBD performance and readiness was similar to that seen at present in the LFV. At the moment this age group of vehicles is producing very little in the way of excess emissions.
• However, the presence of one ‘super-emitter’ of model year 1998 did underline the fact that newer
technology vehicles can develop faults and consequently produce very high emissions. In this particular case, the OBD system was clearly indicating a fault that had been there for some time, but the vehicle’s owner was not inclined to have the matter corrected as the vehicle still ran and drove fairly well. This illustrates an important point: that however good the on-board diagnostic systems are, their indications have to be acknowledged by the vehicle owner and then followed up by a competent repair technician in order to diagnose and mitigate the problem.
Tampering • This clinic saw almost no evidence of intentional tampering with emission control components (except
for the one propane conversion). In general, there is little to be gained from removing or tampering with such devices in modern vehicles. In fact, engine performance and fuel economy are likely to be adversely affected by such actions. With computerized engine controls, tampering will be detected by the on-board computer and could affect warranty coverage. For all these reasons, tampering is now rare.
Diesel Smoke • The range of opacities observed from diesel vehicles was much as expected for the vehicles tested.
Electronic engine controls and the fitting of oxidation catalytic converters to diesel engines circa 1998 have greatly reduced smoke output. At the same time, however, the use of exhaust gas recirculation (EGR) to control NOx emissions has created some long-term problems with diesel engines because the EGR systems can partially or completely clog with soot. Resulting changes in the EGR flow can adversely affect the engine calibration and lead to higher smoke levels. Two very similar VW TDI vehicles, one 2000 and one 2001 model year, showed quite different opacity results, despite having
23

identical engines and emission control systems. Neither vehicle had any indicated problems according to their OBD systems, but it was clear that one produced more smoke than the other.
PM10 Results • The PM10 measurements confirmed that gasoline vehicles emit very little PM when operating in steady-
state; but diesels do, even when they are using biodiesel fuel. The PM10 measurements on diesels confirmed the validity of smoke opacity testing as a low-cost and simple way to identify vehicles that have high PM emissions.
Organisation • Overall the clinic was a great success. Staff and volunteers were kept busy throughout the two days by
a continuous stream of vehicles for testing. So public interest is high. The number of vehicles found to have high tailpipe emissions indicates that there is little else in place to effectively bring these problems to the public attention.
• It would be very worthwhile to obtain data about the total in-use fleet in Whitehorse in order to compare
with the profile of the vehicles tested this year and in 2007. This would help determine what trends really are present versus what is being shown simply as a result of different sample profiles showing up for each clinic. PVTT can undertake this comparison if the data can be obtained.
• Establishing some regular pattern to dates and frequency of the clinics could be of great value, both in
terms of being able to identify trends, and also for public education and awareness of vehicle emissions as an important issue.
Training • The number of customers whose regular or dealers and mechanics had not been able to make any
significant contribution towards correcting the problems which their vehicles’ OBD system indicated was high. And we have previously commented that there seems little available expertise in diagnosing emissions problems in general. This indicates that the Whitehorse repair industry has an unmet need for some basic training in emissions diagnosis and in understanding OBD. PVTT would be pleased to work with ESC and Yukon College to develop and/or provide suitable training.
Acknowledgements PVTT wishes to thank:
EnviroTest Canada for providing test equipment free of charge. The Energy Solutions Centre for the excellent organisation. The volunteers for their enthusiasm, dedication and well-demonstrated abilities.
Their contribution to the success of the clinic was invaluable.
24