09 may 2020 results review 4qfy20 shree cement cement - 4qfy20 - hsie... · 09 may 2020 results...
TRANSCRIPT
09 May 2020 Results Review 4QFY20
Shree Cement
HSIE Research is also available on Bloomberg ERH HDF <GO> & Thomson Reuters
Strong show; Valuations remain expensive
We maintain Reduce rating on Shree Cement with TP of Rs 17,900, as
valuations remain expensive. We expect Shree’s FY21E vol to decline 19% in
FY21, as Covid-led lockdown will drive ~45% YoY sales decline in 1H.
However, falling energy cost and healthy pricing in the north/central markets
should drive margin expansion thus moderating FY21 EBITDA decline. In
4QFY20, while Shree’s vol fell 5% YoY, strong pricing and falling energy costs
bolstered unitary EBITDA to Rs 1,562/MT (industry best!).
Robust 4QFY20 performance: While Covid-19 led shutdown late-Mar
onwards drove 5% YoY cement volume decline, robust pricing in the
north/central regions kept NSR buoyed at +9% YoY. This along with slump
in its merchant power sales drove 2% revenue decline. Further, falling
energy costs drove 3% YoY unitary opex fall. These more than offset weak
demand and Shree’s unitary EBITDA surged 42% YoY to its all time high of
Rs 1,562/MT which is also the industry best. Thus, despite nil EBITDA
contribution from merchant power, total EBITDA/PAT grew 27/83% YoY.
FY20 performance overview: Shree’s cement vol declined (4% YoY) for the
first time in past 18 years, and utilisation dropped to a two-decade low of
~60%. Despite this, robust pricing in the north/central regions, increased
trade focus (~80% in FY20), benefits of lower energy cost and lean overheads
bolstered its unitary EBITDA in FY20 to Rs 1,458/MT (+46% YoY) – its best
ever and highest in the industry. This drove 33/26% EBITDA/PAT growth.
Aided by strong profit and working capital reduction, OCF jumped 82%
YoY to Rs 37.5bn. Lower capex and QIP proceeds further aided a net cash
balance of Rs 41bn vs net debt of Rs 2bn YoY.
Capex and earnings outlook: Shree’s SGU expansions in Odisha and Pune
(3mnMT each) are expected to be commissioned in 2HFY21 (slightly delayed
due to Covid). We expect sales volume to fall 19% in FY21 (driven by sharp
~45% YoY fall in 1H), and 19% YoY recovery in FY22E. Stable pricing and
low energy cost, however should boost unitary EBITDA to ~Rs1,560/MT
during FY21/22E and moderate FY21 EBITDA decline. We have marginally
trimmed EBITDA estimates for FY21/22 by 3/1% respectively.
Maintain REDUCE: We retain Reduce rating on Shree Cement with SOTP
based TP of Rs 17,900 (SOTP based: Cement/power businesses at 15/5x
FY22E EBITDA, and its UAE subsidiary at 1x BV). Despite ascribing
premium valuation, for its superior cost leadership and profitability margin
and strong capex management, the stock price offers no upside.
YE Mar (Rs mn) 4Q
FY20
42Q
FY19
YoY
(%)
3Q
FY19
QoQ
(%) FY19 FY20 FY21E FY22E
Net Sales 32,175 32,849 (2.0) 28,483 13.0 117,221 119,040 98,979 117,604
EBITDA 10,789 8,478 27.3 8,493 27.0 27,694 36,745 31,528 38,444
APAT 5,882 3,209 83.3 3,100 89.8 12,457 15,702 10,497 13,646
AEPS (Rs) 163.0 92.1 76.9 85.9 89.8 357.6 435.2 290.9 378.2
EV /EBITDA (x)
24.4 17.2 20.0 16.4
EV/MT (Rs bn)
16.24 14.55 14.18 13.02
P/E (x)
54.1 42.9 64.2 49.4
RoE (%)
13.5 13.9 7.9 9.7
Source: Company, HSIE Research, Standalone Financials
REDUCE
CMP (as on 8 May 2020) Rs 18,733
Target Price Rs 17,900
NIFTY 9,252
KEY
CHANGES OLD NEW
Rating Reduce Reduce
Price Target Rs 17,900 Rs 17,900
EBITDA % FY21E FY22E
(3.3) (0.5)
KEY STOCK DATA
Bloomberg code SRCM IN
No. of Shares (mn) 36
MCap (Rs bn) / ($ mn) 676/8,945
6m avg traded value (Rs mn) 937
52 Week high / low Rs25,313/15,410
STOCK PERFORMANCE (%)
3M 6M 12M
Absolute (%) (24.7) (6.1) (5.4)
Relative (%) (1.6) 15.4 10.9
SHAREHOLDING PATTERN (%)
Dec-19 Mar-20
Promoters 62.55 62.55
FIs & Local MFs 9.90 11.22
FPIs 13.20 11.90
Public & Others 14.35 14.33
Pledged Shares 0.0 0.0
Source : BSE
Rajesh Ravi
+91-22-6171-7352
Saurabh Dugar
+91-22-6171-7353
Page | 2
Shree Cement: Results Review 4QFY20
Quarterly Standalone Financial Snapshot
Particulars (Rs mn) 4QFY20 4QFY19 YoY (%) 3QFY20 QoQ (%)
Net Sales 32,175 32,849 (2.0) 28,483 13.0
Raw Materials 1,816 2,501 (27.4) 2,503 (27.4)
Power and Fuel 6,217 7,633 (18.6) 4,793 29.7
Employee 1,691 1,705 (0.8) 1,856 (8.9)
Transport 7,144 7,747 (7.8) 6,438 11.0
Other Exp 4,519 4,786 (5.6) 4,400 2.7
EBITDA 10,789 8,478 27.3 8,493 27.0
EBITDA margin (%) 33.5 25.8 29.8
Depreciation 4,362 4,206 3.7 4,322 0.9
EBIT 6,426 4,272 50.4 4,171 54.1
Other Income (Including EO Items) 978 451 116.9 649 50.6
Interest Cost 726 697 4.2 741 (2.1)
PBT - Reported 6,678 4,026 65.9 4,079 63.7
Tax 797 817 (2.5) 980 (18.7)
Tax rate 11.9 20.3 24.0
RPAT 5,882 3,209 83.3 3,100 89.8
EO (Loss) / Profit (Net Of Tax) - - -
APAT 5,882 3,209 83.3 3,100 89.8
Adj PAT margin 18.3 9.8 10.9
Source: Company, HSIE Research
Quarterly Performance Analysis: Cement
Particulars 4QFY20 4QFY19 YoY (%) 3QFY20 QoQ (%)
Sales vol (mn MT) 6.9 7.3 (5.4) 6.2 10.6
Rs/MT trend
NSR 4,600 4,225 8.9 4,512 2.0
Raw materials 263 343 (23.2) 401 (34.4)
Power & fuel 842 830 1.4 713 18.0
Freight 1,034 1,061 (2.5) 1,031 0.3
Employee 245 234 4.8 297 (17.6)
Other Exp 654 656 (0.2) 705 (7.1)
Opex 3,038 3,123 (2.7) 3,146 (3.4)
EBITDA 1,562 1,102 41.7 1,365 14.4
Source: Company, HSIE Research
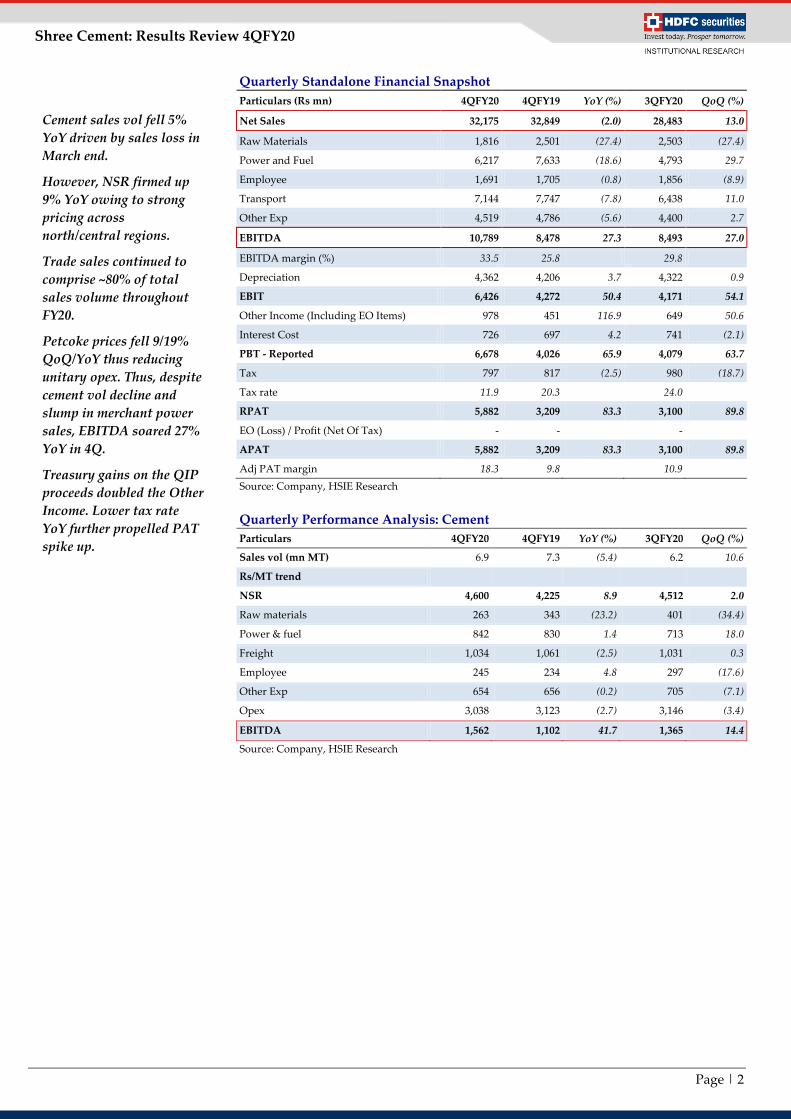
Cement sales vol fell 5%
YoY driven by sales loss in
March end.
However, NSR firmed up
9% YoY owing to strong
pricing across
north/central regions.
Trade sales continued to
comprise ~80% of total
sales volume throughout
FY20.
Petcoke prices fell 9/19%
QoQ/YoY thus reducing
unitary opex. Thus, despite
cement vol decline and
slump in merchant power
sales, EBITDA soared 27%
YoY in 4Q.
Treasury gains on the QIP
proceeds doubled the Other
Income. Lower tax rate
YoY further propelled PAT
spike up.
Page | 3
Shree Cement: Results Review 4QFY20
Operational Trends and Assumptions – Cement business
Particulars FY17 FY18 FY19 FY20 FY21E FY22E
Cement Cap (mn MT) 29.2 34.8 37.8 43.3 46.3 47.3
Sales Volume (mn MT) 20.6 22.5 25.9 24.9 20.2 24.2
YoY change (%) 8.4 9.5 14.8 (3.6) (18.8) 19.3
Utilisation (%) 70.5 64.8 68.4 57.6 43.7 51.1
(Rs/ MT trend)
NSR 3,897 4,172 4,223 4,615 4,699 4,730
YoY change (%) 12.5 7.0 1.2 9.3 1.8 0.7
Raw material cost 305 342 334 308 300 309
Power and fuel cost 501 693 822 797 760 768
Transport cost (in + out) 910 1,120 1,116 1,045 1,000 1,015
Employee cost 261 261 262 293 350 330
Other expenses 777 682 688 713 748 727
Total Opex 2,754 3,099 3,223 3,157 3,158 3,149
YoY change (%) 6.0 12.5 4.0 (2.0) 0.0 (0.3)
EBITDA per MT 1,144 1,073 1,000 1,458 1,542 1,581
YoY change (%) 32.2 (6.2) (6.8) 45.8 5.7 2.6
Source: Company, HSIE Research
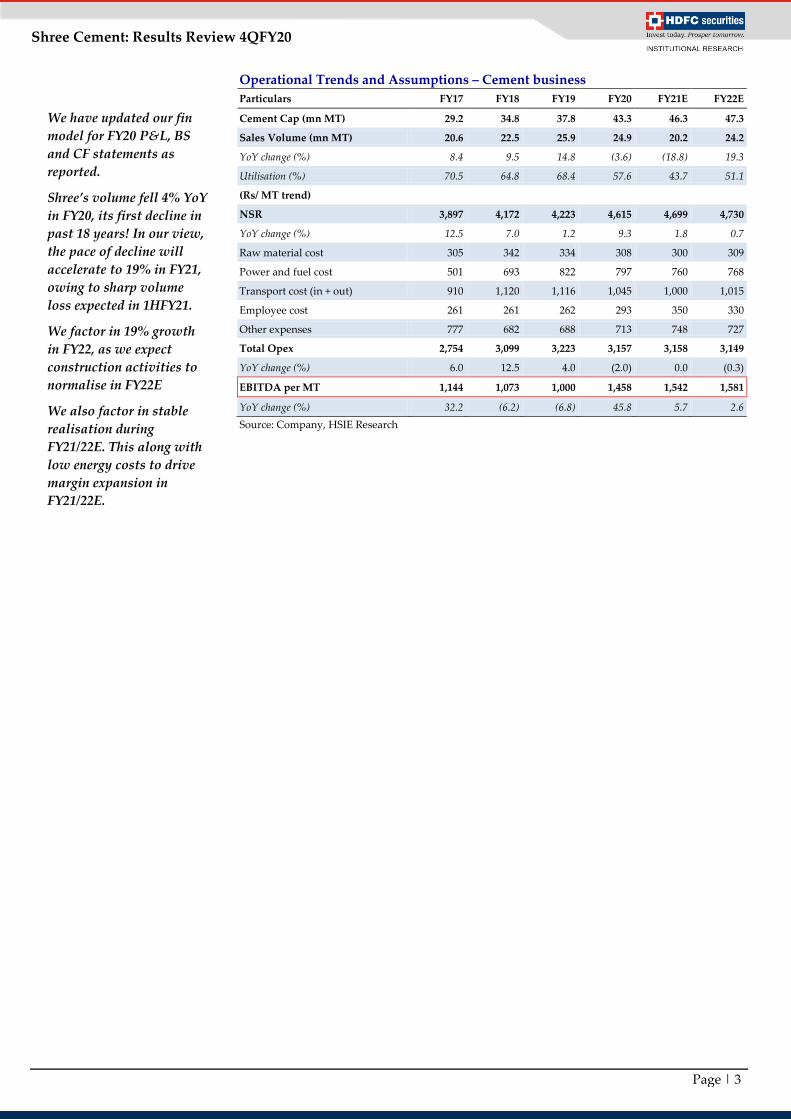
We have updated our fin
model for FY20 P&L, BS
and CF statements as
reported.
Shree’s volume fell 4% YoY
in FY20, its first decline in
past 18 years! In our view,
the pace of decline will
accelerate to 19% in FY21,
owing to sharp volume
loss expected in 1HFY21.
We factor in 19% growth
in FY22, as we expect
construction activities to
normalise in FY22E
We also factor in stable
realisation during
FY21/22E. This along with
low energy costs to drive
margin expansion in
FY21/22E.
Page | 4
Shree Cement: Results Review 4QFY20
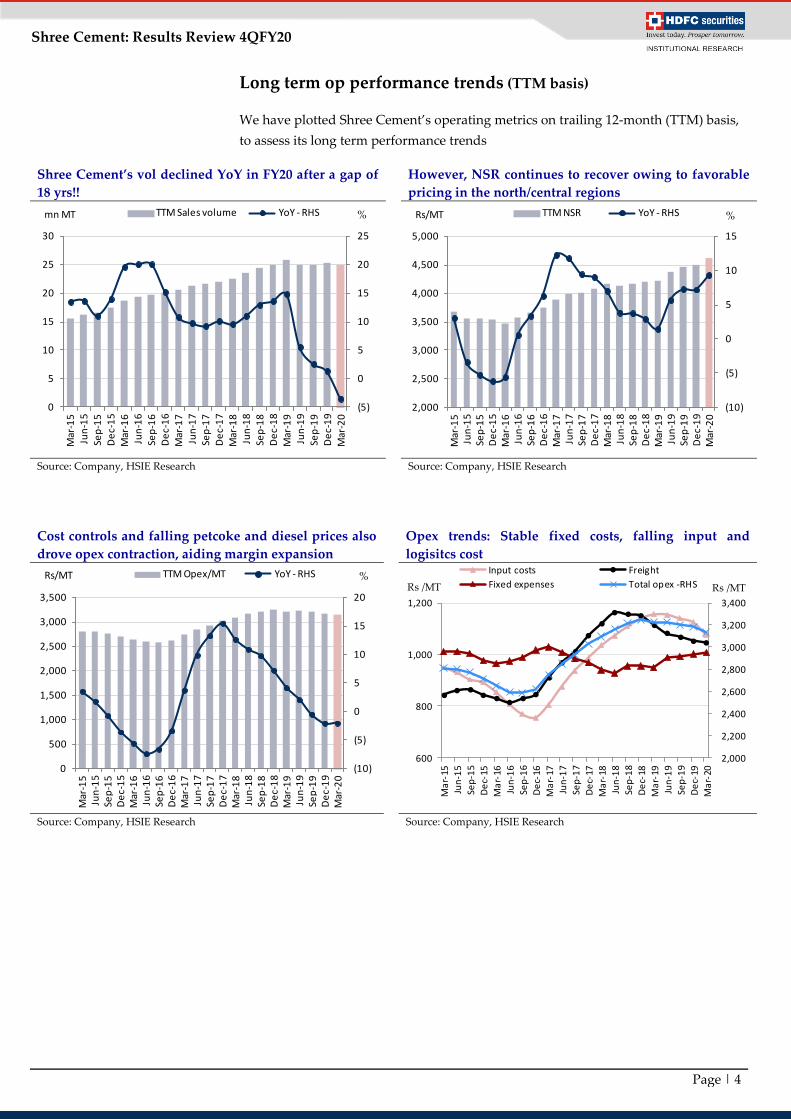
Long term op performance trends (TTM basis)
We have plotted Shree Cement’s operating metrics on trailing 12-month (TTM) basis,
to assess its long term performance trends
Shree Cement’s vol declined YoY in FY20 after a gap of
18 yrs!!
However, NSR continues to recover owing to favorable
pricing in the north/central regions
Source: Company, HSIE Research
Source: Company, HSIE Research
Cost controls and falling petcoke and diesel prices also
drove opex contraction, aiding margin expansion
Opex trends: Stable fixed costs, falling input and
logisitcs cost
Source: Company, HSIE Research Source: Company, HSIE Research
(5)
0
5
10
15
20
25
0
5
10
15
20
25
30
Mar
-15
Jun
-15
Sep
-15
De
c-1
5M
ar-1
6Ju
n-1
6Se
p-1
6D
ec-
16
Mar
-17
Jun
-17
Sep
-17
De
c-1
7M
ar-1
8Ju
n-1
8Se
p-1
8D
ec-
18
Mar
-19
Jun
-19
Sep
-19
De
c-1
9M
ar-2
0
TTM Sales volume YoY - RHSmn MT %
(10)
(5)
0
5
10
15
2,000
2,500
3,000
3,500
4,000
4,500
5,000
Mar
-15
Jun
-15
Sep
-15
De
c-1
5M
ar-1
6Ju
n-1
6Se
p-1
6D
ec-
16
Mar
-17
Jun
-17
Sep
-17
De
c-1
7M
ar-1
8Ju
n-1
8Se
p-1
8D
ec-
18
Mar
-19
Jun
-19
Sep
-19
De
c-1
9M
ar-2
0
TTM NSR YoY - RHS %Rs/MT
(10)
(5)
0
5
10
15
20
0
500
1,000
1,500
2,000
2,500
3,000
3,500
Mar
-15
Jun
-15
Sep
-15
De
c-1
5M
ar-1
6Ju
n-1
6Se
p-1
6D
ec-
16
Mar
-17
Jun
-17
Sep
-17
De
c-1
7M
ar-1
8Ju
n-1
8Se
p-1
8D
ec-
18
Mar
-19
Jun
-19
Sep
-19
De
c-1
9M
ar-2
0
TTM Opex/MT YoY - RHS %Rs/MT
2,000
2,200
2,400
2,600
2,800
3,000
3,200
3,400
600
800
1,000
1,200
Ma
r-15
Jun
-15
Sep
-15
De
c-15
Ma
r-16
Jun
-16
Sep
-16
De
c-16
Ma
r-17
Jun
-17
Sep
-17
De
c-17
Ma
r-18
Jun
-18
Sep
-18
De
c-18
Ma
r-19
Jun
-19
Sep
-19
De
c-19
Ma
r-20
Input costs Freight
Fixed expenses Total opex -RHSRs /MT Rs /MT
Page | 5
Shree Cement: Results Review 4QFY20
Long term performance trends (TTM basis) continued
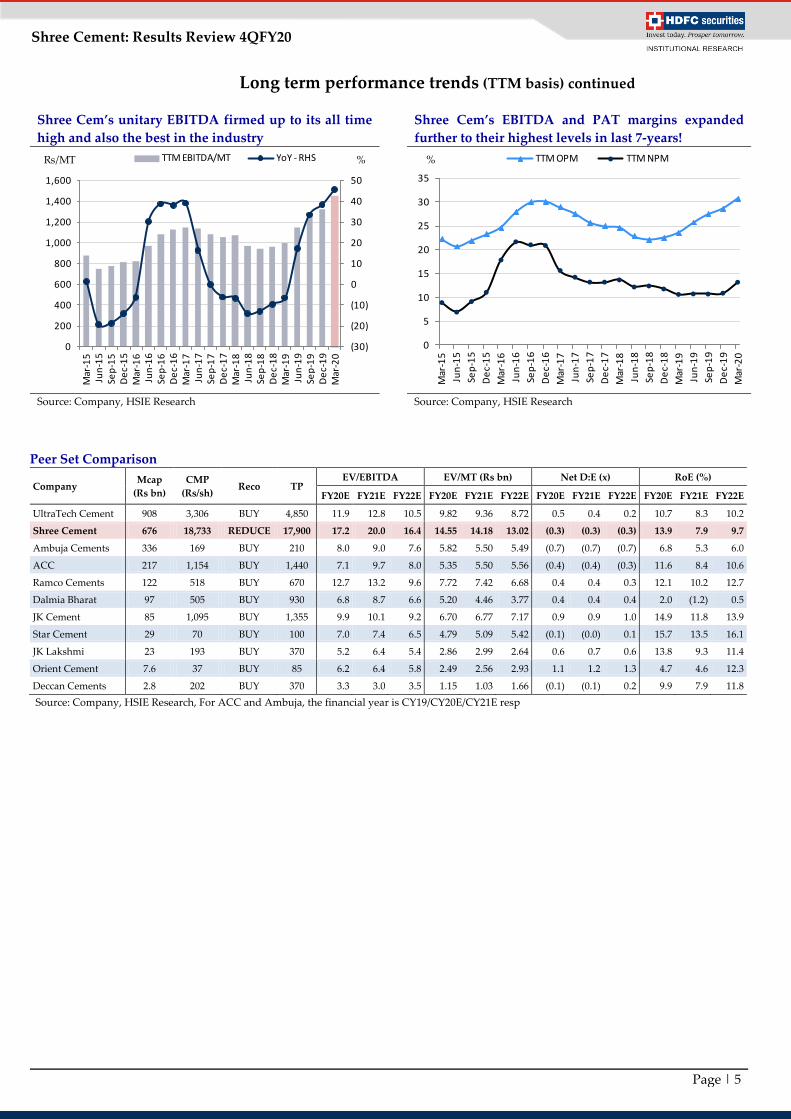
Shree Cem’s unitary EBITDA firmed up to its all time
high and also the best in the industry
Shree Cem’s EBITDA and PAT margins expanded
further to their highest levels in last 7-years!
Source: Company, HSIE Research Source: Company, HSIE Research
Peer Set Comparison
Company Mcap
(Rs bn)
CMP
(Rs/sh) Reco TP
EV/EBITDA EV/MT (Rs bn) Net D:E (x) RoE (%)
FY20E FY21E FY22E FY20E FY21E FY22E FY20E FY21E FY22E FY20E FY21E FY22E
UltraTech Cement 908 3,306 BUY 4,850 11.9 12.8 10.5 9.82 9.36 8.72 0.5 0.4 0.2 10.7 8.3 10.2
Shree Cement 676 18,733 REDUCE 17,900 17.2 20.0 16.4 14.55 14.18 13.02 (0.3) (0.3) (0.3) 13.9 7.9 9.7
Ambuja Cements 336 169 BUY 210 8.0 9.0 7.6 5.82 5.50 5.49 (0.7) (0.7) (0.7) 6.8 5.3 6.0
ACC 217 1,154 BUY 1,440 7.1 9.7 8.0 5.35 5.50 5.56 (0.4) (0.4) (0.3) 11.6 8.4 10.6
Ramco Cements 122 518 BUY 670 12.7 13.2 9.6 7.72 7.42 6.68 0.4 0.4 0.3 12.1 10.2 12.7
Dalmia Bharat 97 505 BUY 930 6.8 8.7 6.6 5.20 4.46 3.77 0.4 0.4 0.4 2.0 (1.2) 0.5
JK Cement 85 1,095 BUY 1,355 9.9 10.1 9.2 6.70 6.77 7.17 0.9 0.9 1.0 14.9 11.8 13.9
Star Cement 29 70 BUY 100 7.0 7.4 6.5 4.79 5.09 5.42 (0.1) (0.0) 0.1 15.7 13.5 16.1
JK Lakshmi 23 193 BUY 370 5.2 6.4 5.4 2.86 2.99 2.64 0.6 0.7 0.6 13.8 9.3 11.4
Orient Cement 7.6 37 BUY 85 6.2 6.4 5.8 2.49 2.56 2.93 1.1 1.2 1.3 4.7 4.6 12.3
Deccan Cements 2.8 202 BUY 370 3.3 3.0 3.5 1.15 1.03 1.66 (0.1) (0.1) 0.2 9.9 7.9 11.8
Source: Company, HSIE Research, For ACC and Ambuja, the financial year is CY19/CY20E/CY21E resp
(30)
(20)
(10)
0
10
20
30
40
50
0
200
400
600
800
1,000
1,200
1,400
1,600
Mar
-15
Jun
-15
Sep
-15
De
c-1
5M
ar-1
6Ju
n-1
6Se
p-1
6D
ec-
16
Mar
-17
Jun
-17
Sep
-17
De
c-1
7M
ar-1
8Ju
n-1
8Se
p-1
8D
ec-
18
Mar
-19
Jun
-19
Sep
-19
De
c-1
9M
ar-2
0
TTM EBITDA/MT YoY - RHS %Rs/MT
0
5
10
15
20
25
30
35
Mar
-15
Jun
-15
Sep
-15
De
c-1
5
Mar
-16
Jun
-16
Sep
-16
De
c-1
6
Mar
-17
Jun
-17
Sep
-17
De
c-1
7
Mar
-18
Jun
-18
Sep
-18
De
c-1
8
Mar
-19
Jun
-19
Sep
-19
De
c-1
9
Mar
-20
TTM OPM TTM NPM%
Page | 6
Shree Cement: Results Review 4QFY20
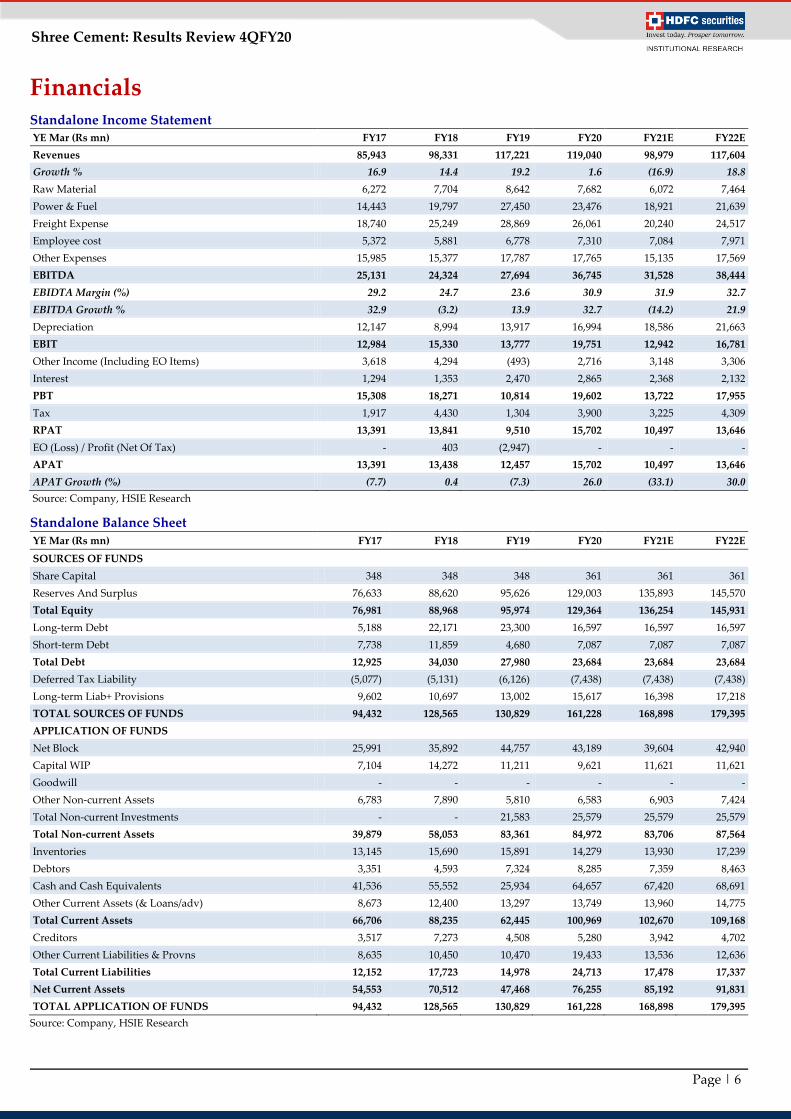
Financials Standalone Income Statement YE Mar (Rs mn) FY17 FY18 FY19 FY20 FY21E FY22E
Revenues 85,943 98,331 117,221 119,040 98,979 117,604
Growth % 16.9 14.4 19.2 1.6 (16.9) 18.8
Raw Material 6,272 7,704 8,642 7,682 6,072 7,464
Power & Fuel 14,443 19,797 27,450 23,476 18,921 21,639
Freight Expense 18,740 25,249 28,869 26,061 20,240 24,517
Employee cost 5,372 5,881 6,778 7,310 7,084 7,971
Other Expenses 15,985 15,377 17,787 17,765 15,135 17,569
EBITDA 25,131 24,324 27,694 36,745 31,528 38,444
EBIDTA Margin (%) 29.2 24.7 23.6 30.9 31.9 32.7
EBITDA Growth % 32.9 (3.2) 13.9 32.7 (14.2) 21.9
Depreciation 12,147 8,994 13,917 16,994 18,586 21,663
EBIT 12,984 15,330 13,777 19,751 12,942 16,781
Other Income (Including EO Items) 3,618 4,294 (493) 2,716 3,148 3,306
Interest 1,294 1,353 2,470 2,865 2,368 2,132
PBT 15,308 18,271 10,814 19,602 13,722 17,955
Tax 1,917 4,430 1,304 3,900 3,225 4,309
RPAT 13,391 13,841 9,510 15,702 10,497 13,646
EO (Loss) / Profit (Net Of Tax) - 403 (2,947) - - -
APAT 13,391 13,438 12,457 15,702 10,497 13,646
APAT Growth (%) (7.7) 0.4 (7.3) 26.0 (33.1) 30.0
Source: Company, HSIE Research
Standalone Balance Sheet
YE Mar (Rs mn) FY17 FY18 FY19 FY20 FY21E FY22E
SOURCES OF FUNDS
Share Capital 348 348 348 361 361 361
Reserves And Surplus 76,633 88,620 95,626 129,003 135,893 145,570
Total Equity 76,981 88,968 95,974 129,364 136,254 145,931
Long-term Debt 5,188 22,171 23,300 16,597 16,597 16,597
Short-term Debt 7,738 11,859 4,680 7,087 7,087 7,087
Total Debt 12,925 34,030 27,980 23,684 23,684 23,684
Deferred Tax Liability (5,077) (5,131) (6,126) (7,438) (7,438) (7,438)
Long-term Liab+ Provisions 9,602 10,697 13,002 15,617 16,398 17,218
TOTAL SOURCES OF FUNDS 94,432 128,565 130,829 161,228 168,898 179,395
APPLICATION OF FUNDS
Net Block 25,991 35,892 44,757 43,189 39,604 42,940
Capital WIP 7,104 14,272 11,211 9,621 11,621 11,621
Goodwill - - - - - -
Other Non-current Assets 6,783 7,890 5,810 6,583 6,903 7,424
Total Non-current Investments - - 21,583 25,579 25,579 25,579
Total Non-current Assets 39,879 58,053 83,361 84,972 83,706 87,564
Inventories 13,145 15,690 15,891 14,279 13,930 17,239
Debtors 3,351 4,593 7,324 8,285 7,359 8,463
Cash and Cash Equivalents 41,536 55,552 25,934 64,657 67,420 68,691
Other Current Assets (& Loans/adv) 8,673 12,400 13,297 13,749 13,960 14,775
Total Current Assets 66,706 88,235 62,445 100,969 102,670 109,168
Creditors 3,517 7,273 4,508 5,280 3,942 4,702
Other Current Liabilities & Provns 8,635 10,450 10,470 19,433 13,536 12,636
Total Current Liabilities 12,152 17,723 14,978 24,713 17,478 17,337
Net Current Assets 54,553 70,512 47,468 76,255 85,192 91,831
TOTAL APPLICATION OF FUNDS 94,432 128,565 130,829 161,228 168,898 179,395
Source: Company, HSIE Research

Page | 7
Shree Cement: Results Review 4QFY20
Standalone Cash Flow YE Mar (Rs mn) FY17 FY18 FY19 FY20 FY21E FY22E
Reported PBT 15,308 18,272 12,596 19,602 13,722 17,955
Non-operating & EO Items (3,333) (3,632) (784) (2,680) (3,148) (3,306)
Interest Expenses 1,294 1,353 2,470 2,865 2,368 2,132
Depreciation 12,147 8,994 13,917 16,994 18,586 21,663
Working Capital Change (509) (1,131) (5,302) 5,591 (5,712) (5,069)
Tax Paid (2,891) (5,068) (2,300) (4,859) (3,225) (4,309)
OPERATING CASH FLOW ( a ) 22,017 18,788 20,597 37,514 22,591 29,066
Capex (12,947) (25,263) (18,853) (12,941) (17,000) (25,000)
Free Cash Flow (FCF) 9,070 (6,475) 1,744 24,573 5,591 4,066
Investments (11,576) (18,365) 8,234 (42,698) - -
Non-operating Income 4,044 7,680 2,493 1,906 3,148 3,306
Others
INVESTING CASH FLOW ( b ) (20,479) (35,947) (8,126) (53,733) (13,852) (21,694)
Debt Issuance/(Repaid) 4,455 20,353 (7,591) 1,175 - -
Interest Expenses (1,278) (1,248) (2,753) (2,868) (2,368) (2,132)
FCFE 12,247 12,631 (8,600) 22,880 3,223 1,934
Share Capital Issuance - - - 23,833 - -
Dividend (4,846) (1,843) (2,308) (6,231) (3,608) (3,969)
FINANCING CASH FLOW ( c ) (1,669) 17,262 (12,653) 15,910 (5,976) (6,100)
NET CASH FLOW (a+b+c) (132) 102 (182) (310) 2,763 1,271
EO Items, Others
Closing Cash & Equivalents 31,004 41,638 55,370 25,624 67,420 68,691
Key Ratios FY17 FY18 FY19 FY20 FY21E FY22E
PROFITABILITY %
EBITDA Margin 29.2 24.7 23.6 30.9 31.9 32.7
EBIT Margin 15.1 15.6 11.8 16.6 13.1 14.3
APAT Margin 15.6 13.7 10.6 13.2 10.6 11.6
RoE 18.4 16.2 13.5 13.9 7.9 9.7
RoIC 21.7 18.4 13.6 15.7 10.0 12.0
RoCE 16.4 13.1 11.0 12.3 7.5 8.8
EFFICIENCY
Tax Rate % 12.5 24.2 12.1 19.9 23.5 24.0
Fixed Asset Turnover (x) 2.0 1.8 1.5 1.2 0.9 0.9
Inventory (days) 56 58 49 44 51 54
Debtors (days) 14 17 23 25 27 26
Other Current Assets (days) 37 46 41 42 51 46
Payables (days) 15 27 14 16 15 15
Other Current Liab & Provns (days) 37 39 33 60 50 39
Cash Conversion Cycle (days) 55 56 67 36 66 72
Net Debt/EBITDA (x) (1.1) (0.9) 0.1 (1.1) (1.4) (1.2)
Net D/E (0.4) (0.2) 0.0 (0.3) (0.3) (0.3)
Interest Coverage 10.0 11.3 5.6 6.9 5.5 7.9
PER SHARE DATA (Rs)
EPS 384.4 385.7 357.6 435.2 290.9 378.2
CEPS 733.1 643.9 757.1 906.2 806.1 978.6
Dividend 140.0 50.0 60.0 110.0 100.0 110.0
Book Value 2,209.7 2,553.8 2,754.9 3,585.4 3,776.4 4,044.6
VALUATION
P/E (x) 50.3 50.2 54.1 42.9 64.2 49.4
P/Cash EPS (x) 26.4 29.5 28.8 20.6 23.2 19.1
P/BV (x) 8.8 7.6 7.0 5.2 4.9 4.6
EV/EBITDA (x) 25.7 26.8 24.4 17.2 20.0 16.4
EV/MT (Rs bn) 22 19 16 15 14 13
Dividend Yield (%) 0.7 0.3 0.3 0.6 0.5 0.6
OCF/EV (%) 3.4 2.9 3.0 5.9 3.6 4.6
FCFF/EV (%) 1.4 (1.0) 0.3 3.9 0.9 0.6
FCFE/M Cap (%) 1.8 1.9 (1.3) 3.4 0.5 0.3
Source: Company, HSIE Research
Page | 8
Shree Cement: Results Review 4QFY20
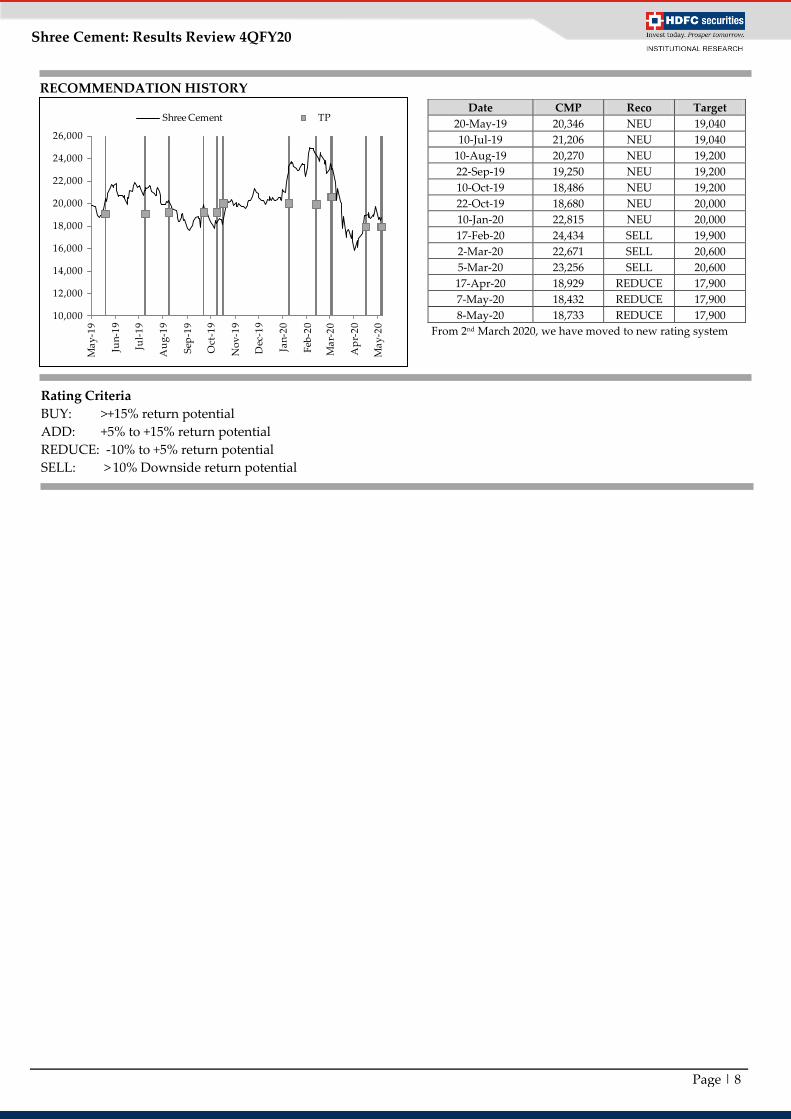
Rating Criteria
BUY: >+15% return potential
ADD: +5% to +15% return potential
REDUCE: -10% to +5% return potential
SELL: > 10% Downside return potential
Date CMP Reco Target
20-May-19 20,346 NEU 19,040
10-Jul-19 21,206 NEU 19,040
10-Aug-19 20,270 NEU 19,200
22-Sep-19 19,250 NEU 19,200
10-Oct-19 18,486 NEU 19,200
22-Oct-19 18,680 NEU 20,000
10-Jan-20 22,815 NEU 20,000
17-Feb-20 24,434 SELL 19,900
2-Mar-20 22,671 SELL 20,600
5-Mar-20 23,256 SELL 20,600
17-Apr-20 18,929 REDUCE 17,900
7-May-20 18,432 REDUCE 17,900
8-May-20 18,733 REDUCE 17,900
From 2nd March 2020, we have moved to new rating system
RECOMMENDATION HISTORY
10,000
12,000
14,000
16,000
18,000
20,000
22,000
24,000
26,000
Ma
y-1
9
Jun
-19
Jul-
19
Au
g-1
9
Sep
-19
Oct
-19
No
v-1
9
Dec
-19
Jan
-20
Feb
-20
Ma
r-2
0
Ap
r-2
0
Ma
y-2
0
Shree Cement TP
Page | 9
Shree Cement: Results Review 4QFY20
Disclosure:
We, Rajesh Ravi, MBA & Saurabh Dugar, MBA, authors and the names subscribed to this report, hereby certify that all of the views expressed in this research
report accurately reflect our views about the subject issuer(s) or securities. HSL has no material adverse disciplinary history as on the date of publication of this
report. We also certify that no part of our compensation was, is, or will be directly or indirectly related to the specific recommendation(s) or view(s) in this
report.
Research Analyst or his/her relative or HDFC Securities Ltd. does not have any financial interest in the subject company. Also Research Analyst or his relative
or HDFC Securities Ltd. or its Associate may have beneficial ownership of 1% or more in the subject company at the end of the month immediately preceding
the date of publication of the Research Report. Further Research Analyst or his relative or HDFC Securities Ltd. or its associate does not have any material
conflict of interest.
Any holding in stock –No
HDFC Securities Limited (HSL) is a SEBI Registered Research Analyst having registration no. INH000002475.
Disclaimer:
This report has been prepared by HDFC Securities Ltd and is solely for information of the recipient only. The report must not be used as a singular basis of any
investment decision. The views herein are of a general nature and do not consider the risk appetite or the particular circumstances of an individual investor;
readers are requested to take professional advice before investing. Nothing in this document should be construed as investment advice. Each recipient of this
document should make such investigations as they deem necessary to arrive at an independent evaluation of an investment in securities of the companies
referred to in this document (including merits and risks) and should consult their own advisors to determine merits and risks of such investment. The
information and opinions contained herein have been compiled or arrived at, based upon information obtained in good faith from sources believed to be
reliable. Such information has not been independently verified and no guaranty, representation of warranty, express or implied, is made as to its accuracy,
completeness or correctness. All such information and opinions are subject to change without notice. Descriptions of any company or companies or their
securities mentioned herein are not intended to be complete. HSL is not obliged to update this report for such changes. HSL has the right to make changes and
modifications at any time.
This report is not directed to, or intended for display, downloading, printing, reproducing or for distribution to or use by, any person or entity who is a citizen
or resident or located in any locality, state, country or other jurisdiction where such distribution, publication, reproduction, availability or use would be
contrary to law or regulation or what would subject HSL or its affiliates to any registration or licensing requirement within such jurisdiction.
If this report is inadvertently sent or has reached any person in such country, especially, United States of America, the same should be ignored and brought to
the attention of the sender. This document may not be reproduced, distributed or published in whole or in part, directly or indirectly, for any purposes or in
any manner.
Foreign currencies denominated securities, wherever mentioned, are subject to exchange rate fluctuations, which could have an adverse effect on their value or
price, or the income derived from them. In addition, investors in securities such as ADRs, the values of which are influenced by foreign currencies effectively
assume currency risk. It should not be considered to be taken as an offer to sell or a solicitation to buy any security.
This document is not, and should not, be construed as an offer or solicitation of an offer, to buy or sell any securities or other financial instruments. This report
should not be construed as an invitation or solicitation to do business with HSL. HSL may from time to time solicit from, or perform broking, or other services
for, any company mentioned in this mail and/or its attachments.
HSL and its affiliated company(ies), their directors and employees may; (a) from time to time, have a long or short position in, and buy or sell the securities of
the company(ies) mentioned herein or (b) be engaged in any other transaction involving such securities and earn brokerage or other compensation or act as a
market maker in the financial instruments of the company(ies) discussed herein or act as an advisor or lender/borrower to such company(ies) or may have any
other potential conflict of interests with respect to any recommendation and other related information and opinions.
HSL, its directors, analysts or employees do not take any responsibility, financial or otherwise, of the losses or the damages sustained due to the investments
made or any action taken on basis of this report, including but not restricted to, fluctuation in the prices of shares and bonds, changes in the currency rates,
diminution in the NAVs, reduction in the dividend or income, etc.
HSL and other group companies, its directors, associates, employees may have various positions in any of the stocks, securities and financial instruments dealt
in the report, or may make sell or purchase or other deals in these securities from time to time or may deal in other securities of the companies / organizations
described in this report.
HSL or its associates might have managed or co-managed public offering of securities for the subject company or might have been mandated by the subject
company for any other assignment in the past twelve months.
HSL or its associates might have received any compensation from the companies mentioned in the report during the period preceding twelve months from t
date of this report for services in respect of managing or co-managing public offerings, corporate finance, investment banking or merchant banking, brokerage
services or other advisory service in a merger or specific transaction in the normal course of business.
HSL or its analysts did not receive any compensation or other benefits from the companies mentioned in the report or third party in connection with
preparation of the research report. Accordingly, neither HSL nor Research Analysts have any material conflict of interest at the time of publication of this
report. Compensation of our Research Analysts is not based on any specific merchant banking, investment banking or brokerage service transactions. HSL may
have issued other reports that are inconsistent with and reach different conclusion from the information presented in this report.
Research entity has not been engaged in market making activity for the subject company. Research analyst has not served as an officer, director or employee of
the subject company. We have not received any compensation/benefits from the subject company or third party in connection with the Research Report.
HDFC securities Limited, I Think Techno Campus, Building - B, "Alpha", Office Floor 8, Near Kanjurmarg Station, Opp. Crompton Greaves, Kanjurmarg
(East), Mumbai 400 042 Phone: (022) 3075 3400 Fax: (022) 2496 5066 Compliance Officer: Binkle R. Oza Email: [email protected] Phone: (022)
3045 3600
HDFC Securities Limited, SEBI Reg. No.: NSE, BSE, MSEI, MCX: INZ000186937; AMFI Reg. No. ARN: 13549; PFRDA Reg. No. POP: 11092018; IRDA
Corporate Agent License No.: CA0062; SEBI Research Analyst Reg. No.: INH000002475; SEBI Investment Adviser Reg. No.: INA000011538; CIN -
U67120MH2000PLC152193
HDFC securities
Institutional Equities
Unit No. 1602, 16th Floor, Tower A, Peninsula Business Park,
Senapati Bapat Marg, Lower Parel, Mumbai - 400 013
Board: +91-22-6171-7330 www.hdfcsec.com