2011 npower business energy index report
DESCRIPTION
An increase in financial, reputational and legislative risks associated with business use of energy means organisations need to put in place effective plans now to reduce their exposure to future risks. This is the key finding of a new white paper, Energy Risk Management for UK Business, commissioned by npower from the London School of Economics.TRANSCRIPT

npower BUSINESS ENERGY INDEX 2011

3 npower Business Energy Index 2011
CONTENTS
INTRODUCTION............................................................................................................................. 4
JARGON BUSTER ........................................................................................................................... 5
EXECUTIVE SUMMARY .................................................................................................................. 6
RESEARCH METHODOLOGY & SAMPLE........................................................................................ 8
ENERGY MANAGEMENT ................................................................................................................ 10
SME and MEU responses.............................................................................................................. 12
SME only responses ..................................................................................................................... 23
MEU only responses..................................................................................................................... 31
CARBON REGULATION & THE ECONOMIC CLIMATE ..................................................................... 34
SME and MEU responses.............................................................................................................. 36
SME only responses ..................................................................................................................... 42
MEU only responses..................................................................................................................... 48
ENERGY RISK ................................................................................................................................. 56
SME and MEU responses.............................................................................................................. 58
MEU only responses..................................................................................................................... 67
CONCLUDING COMMENTARY ....................................................................................................... 72
4 npower Business Energy Index 2011 Introduction 5
INTRODUCTION JARGON BUSTER
Dear Reader
Welcome to the eighth
npower Business Energy
Index nBEI (8) - our annual
index analysing and
monitoring businesses‟
perceptions and opinions
on energy costs and
consumption.
These are key areas, particularly if companies are
looking to mitigate what many business leaders now
consider to be a major business risk – energy. While
businesses have identified the twin concerns of the
cost of energy and future supply in this year‟s nBEI,
many have yet to realise how self generation could be
a crucial element in securing supply and creating a new
revenue stream.
CRC -The Carbon Reduction Commitment Energy
Efficiency Scheme (CRC) is a new mandatory
emissions trading scheme that aims to improve
energy efficiency and reduce the amount of carbon
dioxide (CO2) emitted by businesses in the UK. Full
participation (which is for businesses who consume
over 6000MWh p.a. of power from at least one
half-hourly meter, as measured in 2008) includes
calculating and submitting each year an accurate
Green Deal - A Government initiative announced in
the Energy Bill, the Green Deal will enable private
firms to offer consumers energy efficiency
improvements to their homes, community spaces
and businesses at no upfront cost, and to recoup
payments through a charge in instalments on their
energy bills.
The Green Investment Bank - Set to be the world‟s
As with nBEI (7), the UK remains in the grip of a sluggish
economic revival. The tough measures to tackle the
national deficit are now underway under the coalition
government, which intends to radically reduce public
spending in order to provide the country with a stable
economic base on which to build.
For the business community, this scenario continues to
provide a number of challenges, not least the need to
manage costs to ensure survival, competitiveness and
a base from which to grow in the future. When you
overlay this with increased regulation in the energy
sector, ambitious carbon reduction targets
and uncertainty over security of supply - particularly
in the wake of the Japan earthquake and subsequent
uncertainties surrounding nuclear - the challenges
becomes clear.
This report reflects business attitudes - those of both
major energy users (MEUs) and small to medium
sized enterprises (SMEs) - towards the current energy-
related issues – from energy management through to
procurement and risk. Added to this, and in response
to the current climate of fluctuating fuel prices and
concerns over future supply, in nBEI (8) we have
included questions to gauge views around the issues of
demand management and, linked to this, further
explored the subject of self generation of energy
for businesses.
The report reveals a mixed bag of opinion when it
comes to investing in self generation. The technology
exists, however, it is fair to say it is currently under-
utilised. While there are many reasons for this, from
lack of awareness to financial constraints, this will
become an increasingly important area for business
energy consumers to explore and embrace over the
coming years and as such, it provides an interesting
new topic to explore this year.
Regulation has also played a major role over the last
12 months, and one of the most talked about pieces of
legislation is the Carbon Reduction Commitment
Energy Efficiency Scheme (CRC). When we first looked
at this issue in nBEI (7), we discovered that businesses
felt unprepared for the CRC. Given the changes to the
scheme since its April 2010 implementation, we have
again polled MEUs to find out thoughts and opinion.
The nBEI continues to seek to generate debate, canvass
opinion and pull together the views of the business
community from the smallest of business users up to the
major energy users around a number of important
energy-related issues that will affect them today and into
the future. We hope you find the content of interest.
Yours
David Cockshott
Director of Industrial and Commercial Markets, npower
record of your business‟ CO2 emissions from all
fuel sources that qualify as CRC emissions (not only
electricity), and buying carbon allowances to cover
those emissions.
Demand management - Energy demand
management, also known as demand
side management , refers to the
process whereby business customers uses less
energy during peak times, whether through self-
supply or through turning down consumption assets.
It can also refer to customers moving intensive
energy use to off-peak times to reduce the stress on
the grid.
EMR -The Electricity Market Reform (EMR) is the
statutory consultation on the Government‟s preferred
electricity market framework. Proposals include
implementing a carbon floor price, low carbon
generation revenue support, emissions performance
standard and targeted capacity mechanism.
Feed-in-Tariffs (FiTs) - These are payments to
energy users for renewable electricity they generate.
Changes to the scheme were confirmed by the
Government on 9 June 2011 and the tariffs available
were amended as a result.
first bank dedicated to making a country‟s economy
„greener‟. Its mission will be to accelerate private
sector investment in the UK‟s transition to a green
economy – addressing the market failures which are
holding back private sector investment.
Self generation – This refers to businesses that have
generation assets that they use to self-supply some
or all of their energy needs. Types of self-generation
include on-site generators, solar panels, wind turbines
and CHP plant.
Volume tolerance – This is a pre-agreed deviation %
within which energy usage can increase or decrease
against the advised requirements. Many energy
contracts have volume purchase agreements within
them, where the buyer agrees to purchase and use
a specific amount of energy and use it within a
specific time frame.

6 npower Business Energy Index 2011 Executive Summary 6 7 npower Business Energy Index 2011 Executive Summary 7
EXECUTIVE SUMMARY
Energy Management
– The importance major energy users (MEUs) attached
to energy management and energy efficiency is at the
highest level since the start of nBEI in 2005.
– Measuring energy efficiency using the form of audits –
either using an external company or conducting them
internally – has increased for all business customers
in nBEI (8).
– The percentage of SMEs that have no methods
in place to measure energy efficiency has fallen
from 69% in nBEI (7) to 53% in nBEI (8), hinting
at the greater importance SMEs are placing on
monitoring energy consumption.
– The nBEI reveals some positive figures in terms of
reduction of energy consumption. 50% of SMEs
have achieved savings of up to 10%, and 58% of
MEUs reported the same result. Encouragingly,
8% of MEUs reported savings of over 20% - none
did in nBEI (7).
– Many SMEs do not have any form of self generation
technology, and just over one in three (39%) of MEUs
do not have any.
– MEUs use self generation primarily to produce
heat and power. This is followed very closely by
the fact that it brings reputation and CSR benefits.
– Between nBEI (7) and nBEI (8) MEUs have
reduced the level of energy savings that they
believe are achievable for their organisations.
– Now around 64% believe it to be 10% or more
with around 34% believing it to be 20% or more,
compared to 66% and 42% in nBEI (7). This could
be because they have already made significant
savings, and have therefore adjusted what
is feasible.
Carbon regulation and the
economic climate
– While there is still some scepticism from businesses
that government targets for an 80% reduction in
emissions by 2050 can be achieved, the percentage
has fallen from 79% in nBEI (7) to 69% in nBEI (8).
– Both SMEs and MEUs believe more in the
government‟s interim target of 34% reduction
in carbon emissions by 2020, with 43% of SMEs
and 41% of MEUs believing that the reduction
can be met.
– 24% of SMEs believe that reducing their carbon
footprint will deliver new business opportunities
an increase on nBEI (7).
– Majority of SMEs (85%) had not heard of the
Government‟s Green Deal initiative.
– Half of MEUs are participating in the Carbon
Reduction Commitment Energy Efficiency Scheme.
– Nearly half of participating MEUs (46%) say they
had not received adequate advice on the CRC
from the government.
– Opinion is split about whether Coalition Government
policies will help the UK meet its emissions targets.
Energy risk – MEUs identify energy and legislation as the biggest
risks their businesses face. For SMEs, sales and cash
flow are the biggest risks.
– Strategies for managing energy, legislation and credit
risk are less developed than for all the other risks
businesses face. Just 66% of respondents stating that
they had a strategy to manage these risks, down on
nBEI (7), when 74% had a strategy in place to manage
credit and 70% legislation.
– This varies between MEUs and SMEs – 83% of
MEUs have a strategy to manage energy risk,
compared to 57% of SMEs
– Increased supply costs continue to be identified as
the most important energy risk that both SMEs and
MEUs face; they also continue to identify security of
supply as the second most important.
– 46% of organisations feel that there will be no
impact on their energy supply due to their credit
rating, up from 39% in nBEI (7). 23% see it as a
small risk, and 23% a medium risk, down from 28%
and 30% in nBEI (7).

8 npower Business Energy Index 2011 Research Methodology & Sample 9
RESEARCH METHODOLOGY & SAMPLE
Research objectives
The npower Business Energy Index (nBEI) seeks to
identify and monitor trends in, and expectations about,
key energy market developments in the UK. The survey
Research methodology
This survey was designed by npower, in conjunction
with Datamonitor and executed by Datamonitor.
In-depth telephone interviews were conducted between
Figure 3:
MEU interview count by the number of sites
Figure 4:
MEU interview count by primary location
is an annual barometer of issues affecting both large
and small business energy users.
Specifically, the survey:
– measures and monitors the incidence and efficiency
of energy management measures designed to
increase energy efficiency and reduce energy
consumption;
– explores business attitudes and opinions on current
and future public energy policies; and
– assesses business strategies that deal with
energy risk.
March and May 2011 with a representative sample
of 300 UK businesses, comprising of 200 SMEs with
significant energy usage and 100 MEUs.
In the majority of cases, the respondent was an energy
buyer or a senior figure with responsibility for energy
purchasing. The responses to the survey provided both
comparable quantitative data and verbatim comments
on a range of key energy user issues. This survey also
has a number of new questions that were not covered
in previous issues.
500+
201-500 3
101-200 2
51-100 4
21-50 3
11-20 6
6-10 5
1-5
Figure 5:
24 Wales 4
South West 5
South East 22
Midlands 7
North England 40
Scotland 23
54
Figure 6:
This year, we have also explored business attitudes
to self generation and demand management.
SME interview count by vertical sector SME interview count by number of employees
Figure 1:
MEU interview count by vertical sector
Figure 2:
MEU interview count by number of employees
Financial Services 11
Business Services
Public Sector 15
Transportation 2
50-100 73
52 25-49 12
19-24 27
1-9 90
Financial Services
Business Services 12
Public Sector
Transportation
Construction 5
Retail 10
1000+ 16
5001-10000 10
44 1001-5000 16
101-1000 42
51-100 6
1-50 11
Construction 4
Retail 56
Manufacturing 62
Figure 7:
SME interview count by vertical sector
Manufacturing 30 Wales 8
South West 25
South East 51
Midlands 36
North England 57
Scotland 25
10 npower Business Energy Index 2011 Executive Summary 10 11 npower Business Energy Index 2011 Energy Management 11
ENERGY MANAGEMENT
A challenging economic landscape
continues to form the backdrop for
many in the UK business community.
That said, although cost control remains
of paramount importance, nBEI (8)
reveals that enthusiasm towards
effective energy management has not
been dampened.
In fact, the importance attached by businesses of
all sizes to energy management and reducing energy
consumption has increased in the 12 months since the
question was last posed - up from a 6.9 rating to
7.4 this year. This is at the highest level since the
2005 nBEI.
However, while this trend is encouraging, there is a
notable difference between MEUs and SMEs when it
comes to measuring energy efficiency. 53% of SMEs
have no measurement tools in place, compared to just
15% of MEUs. Measurement is a key component on the
energy management journey, and by conducting simple
audits – either internally or via an external supplier –
businesses can see how effective their energy efficiency
initiatives have been, and where improvements can
be made.
For businesses that have implemented energy efficiency
measures, the nBEI reveals that they are delivering in
terms of reductions in consumption. Some 50% of
SMEs have achieved savings of up to 10%, and 58%
of MEUs are getting the same result. Encouragingly,
8% of MEUs reported savings of over 20% - none did
in nBEI (7).
Conversely, where there has been less of a focus on
energy efficiency, just over a fifth (22%) of businesses –
both large and small – have not achieved any reduction
in consumption in the past year.
In terms of what businesses are actually doing to
become more energy efficient, the attitude of SMEs
towards „quick win‟ energy efficiency measures has
increased significantly since the last index. Low cost
measures such as turning lights and equipment off
when not needed deliver, in their view, the biggest
payback.
Interestingly, the introduction of equipment meters
and smart meters still lags down the list, which perhaps
highlights a lack of awareness that monitoring and
measurement is an important stage in any sustainable
energy management strategy. For example, 79% of
SMEs did not utilise smart meter technology, 58% of
those saying that they were unsure of the benefits.
However, for those that did, the ability to monitor energy
consumption more effectively was seen as
advantageous.
For MEUs, staff engagement is the most popular course
of action to help reduce energy usage and costs. This
achieved a 7.2 rating, compared to 7.1 for investment
in energy efficiency technologies and replacing old
equipment.
Who businesses choose as their partners on their energy
management journey does differ between MEUs and
SMEs. While both admit they seek external advice for
all areas of energy management, including regulatory
changes and reducing emissions, where they get this
advice from does vary. While SMEs generally prefer
to consult their energy suppliers, MEUs are more likely
to turn to NGOs or external consultants.
In this section, we also explore our new area for nBEI (8)
– demand management and the prevalence of
self generation.
At first glance, it appears that the use of self generation
technology is not yet common practice. 39% of MEUs
and 61% of SMEs currently have no self generation
in place. For many, it is just not a business priority,
even though many are increasingly concerned about
future supply and the demand on the grid. It will be
interesting to see how this figure changes over the
coming years.
Indeed, there are already signs that businesses are
prepared to invest in self generation to help manage
demand. For SMEs, when asked which self generation
technology they would be prepared to invest in, 34%
said solar panels. This choice is also attractive to
MEUs - with 60% saying that they would consider this
technology for self generation, followed by CHP at 52%.
For companies that have already taken the step to
implement self generation technology, CHP was the
most popular for MEUs, followed by solar panels. For
SMEs, 22% have CHP, but currently only 6% have
solar panels. With the changes announced to Feed in
Tariffs in June 2011, it will be interesting to see how
these figures differ next year. In addition, with cost
playing a major factor, it will be interesting to see if the
government‟s proposed „Green Deal For Businesses‟
will help SMEs realise their ambitions to invest in solar
panels in the future.
Reasons for using self generation are varied dependent
on the size of the company. Interestingly, for MEUs,
reputational and CSR-related benefits are considered
almost as important as more functional benefits such
as using it as a source of heat and power. On the other
hand, a third of SMEs (33%), signal the practical benefit
of having a back-up power supply during interruption
as the primary reason for self generation. This perhaps
reflects the enormous impact a cut in energy supply
would have on the daily operation of a small business.
That said, for some businesses, the benefits of
investing in self generation are unclear. When asked
why they didn‟t implement such measures, some 40%
of businesses cited lack of finance and 62% said it
was not a business priority. This seems to contradict
worries expressed by MEUs that energy is their number
one business risk – see section 3. It seems that taking
the step to ensure their own future security of supply
via self generation is proving a difficult one for some
businesses to take.
Many are also unaware of the potential commercial
benefits of having self generation technology only
15% currently use it to sell back to the National Grid
and just 11% said they would participate in the National
Grid STOR scheme, which currently is not that easily
accessible. For MEUs in particular, there is the potential
to make significant revenue for example, by selling
reserve back to the grid during times of stress.
Perhaps unsurprisingly, a major barrier is lack of
finance – this is the case for 51% of MEUs and 37% of
SMEs. In terms of where this finance should come
from, this is where MEUs and SMEs are united – 61%
believe government grants should be available to all
to finance self generation projects. Only 18% believe
they should self-fund it, and the same percentage
believed that energy suppliers should be responsible.
The government-backed „Green Deal‟ may go part way
to assisting SMEs, but it will not provide the same help
for MEUs.
Overall, we have a business community that views
energy management as an increasingly important issue,
and there is a desire to be more energy efficient, and
more energy self-sufficient. While more easy-
to-implement measures are happening across all
business sizes, when it comes to large scale projects
requiring significant investment, such as installing solar
panels or wind turbines, there is still some reluctance.
MEUs and SMEs are united in where they think fiscal
support should come from in terms of financing energy
efficiency projects – the government.

Energy supplier 13%
32%
2%
44%
9%
36%
External audits 8%
11%
26%
46%
14%
23%
Internal audits 8%
19%
50%
61%
22%
33%
Other 2%
13%
10%
29%
5%
18%
No measurement 69%
53%
12%
15%
50%
41%
SME Response
Last 6 months
Next 6 months
Undertaken an energy review and/or action plan
5.1
5.1
Monitor consumption regularly
5.6
5.7
Introduced equipment meters
3.5
3.8
Increased lighting efficiency
5.5
5.2
Increased heating efficiency - reduce heat loss
5.6
5.4
Ensured unused equipment is turned off
7.6
6.9
Changed equipment/technology
5.1
4.4
Requested information, e.g. from Carbon Trust
3.8
3.9
Educated staff
5.4
5.3
SMEs SMEs MEUs MEUs All All (7) (8) (7) (8) (7) (8)
12 npower Business Energy Index 2011 Executive Summary 12 13 npower Business Energy Index 2011 Energy Management 13
ENERGY MANAGEMENT
SME and MEU responses
Table 1: How significant an issue for your company is energy management and reducing your energy consumption?
On a scale 1-10, where 10 = very important
Table 3: What steps has your company taken in the last/next 6 months to reduce energy consumption
and increase energy efficiency?
On a scale 1-10, where 10 = very important
Response
nBEI (2)
nBEI (2)
nBEI (3)
nBEI (4)
nBEI (5)
nBEI (6)
nBEI (7)
nBEI (8)
Average - SMEs
5.8
5.7
6
6.5
6.1
6.6
6.1
6.7
Average - MEUs
8
7.8
8.2
8.1
7.8
8.3
8.5
8.8
Average - All
7.2*
6.9
7.4
– The importance SMEs and MEUs attach to energy
management and energy efficiency in nBEI (8) is at
the highest level since the first nBEI in 2005.
* previous years cannot be compared due to changes sample sizes Source: nBEI (8)
– Energy management and energy efficiency grew in
importance for both SMEs and MEUs in nBEI (8).
Table 2: Does your company measure its energy efficiency using any of the following methods?
Select all that apply
Response
Installed smart meters 3.9 3.8
Source: nBEI (8)
* Totals will not equal 100% as interviewees could choose multiple responses. Source: nBEI
(8)
– The most important energy efficiency action for SMEs
in the last 6 months and for the next 6 months is the
same as nBEI (7) - to ensure that unused equipment is
turned off.
– The number of actions that score more than 5.0 have
increased in nBEI (8) compared with nBEI (7), showing
that SMEs are placing greater importance on energy
efficiency.
– Measuring energy efficiency using the form of audits –
either using an external company or conducting them
internally – has increased for all business customers
in nBEI (8).
– Although naturally of greater importance for
MEUs, it has also significantly risen for SMEs.
– This is in line with the responses in Table 3 which
indicates that monitoring consumption is the second
most important concern for SMEs.
– The percentage of SMEs that have no methods in
place to measure energy efficiency has fallen from
69% in nBEI (7) to 53% in nBEI (8), hinting at the
greater importance SMEs are placing on monitoring
energy consumption.
– The least important actions for SMEs over next 6
months are to introduce equipment meters and install
smart meters. Later results will examine the barriers to
using such technology.

MEU Response
Last 6 months
Next 6 months
Changed heating/lighting set-up
7.1
6.6
Changed process equipment/technology
6.4
6.3
Introduced monitoring software
5.6
5.5
Requested information, e.g. from Carbon Trust
6.0
5.4
Undertaken an energy review and/or action plan
7.1
6.4
Engaged with staff to encourage energy efficiency action
7.1
6.9
Invested in microgen technology
4.1
4.8
SMEs SMEs SMEs MEUs MEUs MEUs All All All Response (6) (7) (8) (6) (7) (8) (6) (7) (8)
14 npower Business Energy Index 2011 Executive Summary 14 15 npower Business Energy Index 2011 Energy Management 15
ENERGY MANAGEMENT
Table 4: What steps has your company taken in the last/next 6 months to reduce energy consumption
and increase energy efficiency?
On a scale 1-10, where 10 = very important
Table 5: By how much have you managed to reduce your overall energy consumption in the last 12 months?
Nil 41% 18%
26%
27% 9%
11%
37% 15%
22%
Less than 5% 27% 37%
29%
31% 39%
28%
28% 37%
29%
5% to 10% 6% 31%
21%
13% 29%
30%
8% 31%
23%
11% to 20% 2% 5%
5%
1% 8%
2%
2% 6%
4%
More than 20% - -
1%
- -
8%
- -
3%
Exact % given by: 10% 7%
27%
11% 12%
48%
10% 8%
34%
Don‟t know 14% 3%
18%
17% 3%
21%
15% 3%
18%
Average of exact 15% 18%
percentages:
16%
5% 10%
8%
12% 14%
12%
Installed smart meters 5.9 5.3 Source: nBEI (8)
Source: nBEI (8)
– Perhaps unsurprisingly, MEUs place greater
important on taking steps towards reducing energy
consumption. This could be due to legislation such
as the CRC, which does not affect SMEs.
– The most important action for MEUs over the next six
months still remains „Engage with staff to encourage
energy efficiency action‟, which can be a lower cost
activity than other important actions.
– The least popular method of reducing energy
consumption for both time periods remains „invest
in microgen technology‟. This could be down to the
cost of installing the equipment as well as the lack
of clarity in government regulation.
– Overall, the percentage of businesses who have
reduced their energy consumption has fallen when
compared with nBEI (7).
– However, 21% of SMEs have achieved savings
between 5% and 10%, and 30% of MEUs are getting
the same result. Encouragingly, 8% of MEUs
reported savings of over 20% - none did in nBEI (7).

Energy management/
efficiency 35% 16%
14%
35% 45%
35%
35% 26%
21%
Energy efficient
technologies - -
19%
- -
51%
- -
31%
Energy saving capital
allowances 6% 17%
19%
26% 42%
45%
13% 25%
27%
Reducing/managing
carbon emissions 35% 20%
21%
42% 49%
43%
37% 30%
28%
Regulatory change - 23%
18%
- 48%
43%
- 31%
26%
Renewable generation - 20%
15%
- 48%
40%
- 29%
23%
Response
SMEs (6)
SMEs (7)
SMEs (8)
MEUs (6)
MEUs (7)
MEUs (8)
All (6)
All (7)
All (8)
Energy management/
efficiency
3.7
7.6
8.7
5.4
7.9
8.3
4.2
7.8
8.5
Energy efficient
technologies
-
-
7.7
-
-
7.9
-
-
7.8
Energy saving capital
allowances
4.1
7.4
8.2
5.2
7.4
8.0
4.4
7.4
8.1
Reducing/managing
carbon emissions
3.7
7.5
7.8
5.6
8.0
7.9
4.4
7.8
7.8
Regulatory change
-
6.8
7.7
-
7.4
7.5
-
7.1
7.6
Yes or no for each
SMEs SMEs SMEs MEUs MEUs MEUs All All All Response (6) (7) (8) (6) (7) (8) (6) (7) (8)
16 npower Business Energy Index 2011 Executive Summary 16 17 npower Business Energy Index 2011 Energy Management 17
ENERGY MANAGEMENT
Table 6: Do you consider that you need external advice or support in the following areas? Table 7: For areas with a yes, how important would this advice be?
On a scale 1-10, where 10 = very important
Renewable generation - 7.2 8.6 - 6.4 7.6 - 6.8 8.0
Source: nBEI (8) Source: nBEI (8)
– As businesses become more aware of the benefits of
successful energy management, the need for external
advice for both SMEs and MEUs has fallen compared
with nBEI (7). However, the results show there is still
appetite for it in certain areas.
– Although scores are similar on a number of areas,
SMEs rate „reducing/managing carbon emissions‟ the
highest for external advice, while MEUs rate „energy
saving capital allowances.‟ Scores are relatively close
on a number of areas though.
– For MEUs who sought external advice, „energy
management/efficiency‟ is the most important area
while „regulatory change‟ is the least important.
– For SMEs that need advice, the major areas are
“Energy management/efficiency” followed by by
“renewable generation” and “energy saving capital
allowances”.

Response MEUs SMEs All
CHP
37%
22%
27%
Wind turbines
13%
3%
6%
Solar panels
30%
6%
14%
Ground source heat pumps
19%
1%
7%
Air source heat pumps
19%
3%
9%
Biomass
15%
2%
7%
Other (specify)
10%
12%
11%
Table 9: Which of the following self-generation technologies do you have?
SMEs SMEs SMEs MEUs MEUs MEUs All All All Select all that apply (6) (7) (8) (6) (7) (8) (6) (7) (8)
18 npower Business Energy Index 2011 Executive Summary 18 19 npower Business Energy Index 2011 Energy Management 19
ENERGY MANAGEMENT
Table 8: From where would you prefer to receive advice?
On a scale 1-10, where 10 = very important)
Demand management and onsite generation
Response
Energy consultants 4.1 4.8
3.7
3.5 5.2
5.5
3.9 4.9
4.3
Energy suppliers 4.9 3.7
4.4
4.5 6.0
5.4
4.7 4.4
4.7
Equipment suppliers 5.0 4.1
3.9
4.8 5.8
5.4
4.9 4.7
4.4
NGOs 5.3 4.2
4.3
5.8 7.4
6.4
5.5 5.2
5.0
Source: nBEI (8)
– SMEs would prefer to receive advice from energy
suppliers, a significant shift from nBEI (7), when they
preferred energy consultants.
– As with nBEI (7), MEUs would prefer to receive advice
from NGOs a continuation of the finding from nBEI (7).
– Equipment suppliers are not favoured by either
SMEs or MEUs.
Do not have any 39% 61% 54%
Source: nBEI (8)
– Just over 1 in 3 (39%) of MEUs do not have any
form of self generation technology. This rises to
61% of SMEs.
– Of the ones that do, CHP seems to be the most
popular.
– Wind turbines are least popular for MEUs while
for SMEs it is ground source heat pumps.

Response MEUs SMEs All
CHP
52%
21%
32%
Wind turbines
30%
11%
17%
Solar panels
60%
34%
43%
Ground source heat pumps
50%
10%
24%
Air source heat pumps
45%
10%
22%
Biomass
36%
8%
17%
Response MEUs SMEs All
As a back-up power supply during an interruption
26%
33%
30%
It‟s a renewable asset that brings reputation/CSR benefits
53%
31%
41%
Self-generation of heat and power
55%
35%
44%
Selling electricity to the market
21%
10%
15%
To participate in National Grid STOR scheme
13%
10%
11%
20 npower Business Energy Index 2011 Executive Summary 20 21 npower Business Energy Index 2011 Energy Management 21
ENERGY MANAGEMENT
Table 10: What do you use your on-site self-generation technologies for?
Select all that apply
Table 11: Which of the following self-generation technologies would you be prepared to invest in?
Select all that apply
Other (specify) 23% 38% 31%
Source: nBEI (8)
Other 2% 1% 1%
– MEUs use self generation primarily to produce heat
and power. This is followed very closely by the fact
that it brings reputation and CSR benefits.
– Production of heat and power is also the most
important use for SMEs closely followed by „as a
back-up power supply during an interruption.‟
Source: nBEI (8)
– In terms of future plans, MEUs and SMEs both favour
investment in solar panels.
– Wind turbines are not favoured by MEUs while
biomass is not favoured by SMEs.
– This is contrary to what businesses actually own (see
Table 9), although it should be noted that many SMEs
are in rented premises, so would rely on their landlord
to implement such measures.

Response
SMEs (7)
SMEs (8)
Rent
49%
46%
Own
51%
54%
Response MEUs SMEs All
Lack of finance
51%
37%
40%
Not a business priority
62%
62%
62%
Lack of resource to manage a project
38%
32%
34%
Unsure of benefits
41%
27%
31%
22 npower Business Energy Index 2011 Executive Summary 22 23 npower Business Energy Index 2011 Energy Management 23
ENERGY MANAGEMENT
Table 12: You said you didn‟t have any self generation technologies, why not?
Select all that apply
SME responses only
Table 14: Do you rent or own your premises? For tenants, has your Landlord done anything to improve
the energy efficiency of your building?
Own or rent, yes or no
Unsure of types of assets that are available 31% 27% 28%
Source: nBEI (8)
Percentage of tenants whose landlord has
improved energy efficiency of the building 12% 8%
Source: nBEI (8)
– For many MEUs and SMEs, investing in self-generation
technologies, is not a business priority at the
moment.
– Lack of finance also seems to be a major barrier
for both MEUs and SMEs.
Table 15: If you are a tenant, has your landlord taken any steps to improve the energy efficiency of your
building and help you to reduce your energy costs?
Table 13: How do you think energy efficiency projects for businesses should be financed?
Select all that apply
Yes or no (Breakdown by number of employees)
SMEs
Response (8) 1-9 10-24 25-49 50-100
Response MEUs SMEs All
Bank loan 4% 2% 3%
Government grant 61% 61% 61%
Energy supplier grant 16% 19% 18%
Yes 8% 7% 0% 0% 12%
No 92% 93% 100% 100% 88%
Source: nBEI (8)
The business wishing to undertake the project 19% 17% 18%
Source: nBEI (8)
– Slightly more SMEs own their property than renting it.
– Just 8% of SMEs that rent their premises have had
energy efficiency improvements made by their
landlords, down from 12% in nBEI (7). SMEs with 50-
100 employees were most likely to have had energy
efficiency improvements delivered by their landlords.
– Most MEUs and SMEs agree that the best form of
financing energy efficiency projects for businesses
should be through government grants.
– The least preferred method is a bank loan.

Response
SMEs (8)
New light fixtures and fittings
78%
New boiler or water heater
47%
Boiler servicing
61%
AA rated appliances
51%
Loft insulation
65%
Cavity insulation
39%
Carried out energy audits
35%
Response
SMEs (8)
Scotland
North
Midlands
South East
South West
Wales
Yes
8%
18%
8%
8%
3%
8%
0%
24 npower Business Energy Index 2011 Executive Summary 24 25 npower Business Energy Index 2011 Energy Management 25
ENERGY MANAGEMENT
Table 16: If you are a tenant, has your landlord taken any steps to improve the energy efficiency of your
building and help you to reduce your energy costs?
Yes or no (Breakdown by region)
Table 18: What have you done to improve the energy efficiency of your premises?
Select all that apply
No 92% 82% 92% 92% 97% 92% 100%
Source: nBEI (8)
– Landlords in Scotland undertook the most amount of
energy efficiency work on behalf of their tenants in
the nBEI (8), the South East the least.
Table 17: What has your landlord done to improve the energy efficiency of your premises?
Select all that apply
SMEs
Response (8)
Installed a smart meter 19%
Source: nBEI (8)
New light fixtures and fittings 71%
New boiler or water heater 57%
Boiler servicing 57%
AA rated appliances 43%
Loft insulation 86%
Cavity insulation 86%
Carried out energy audits 29%
Installed a smart meter 14%
Source: nBEI (8)
– Loft and cavity insulation were the most popular
energy efficiency improvements undertaken by
landlords. Smart meters were the least popular.
– New light fixtures and fittings were the top
improvement SMEs that own their premises have
made (Table 18).
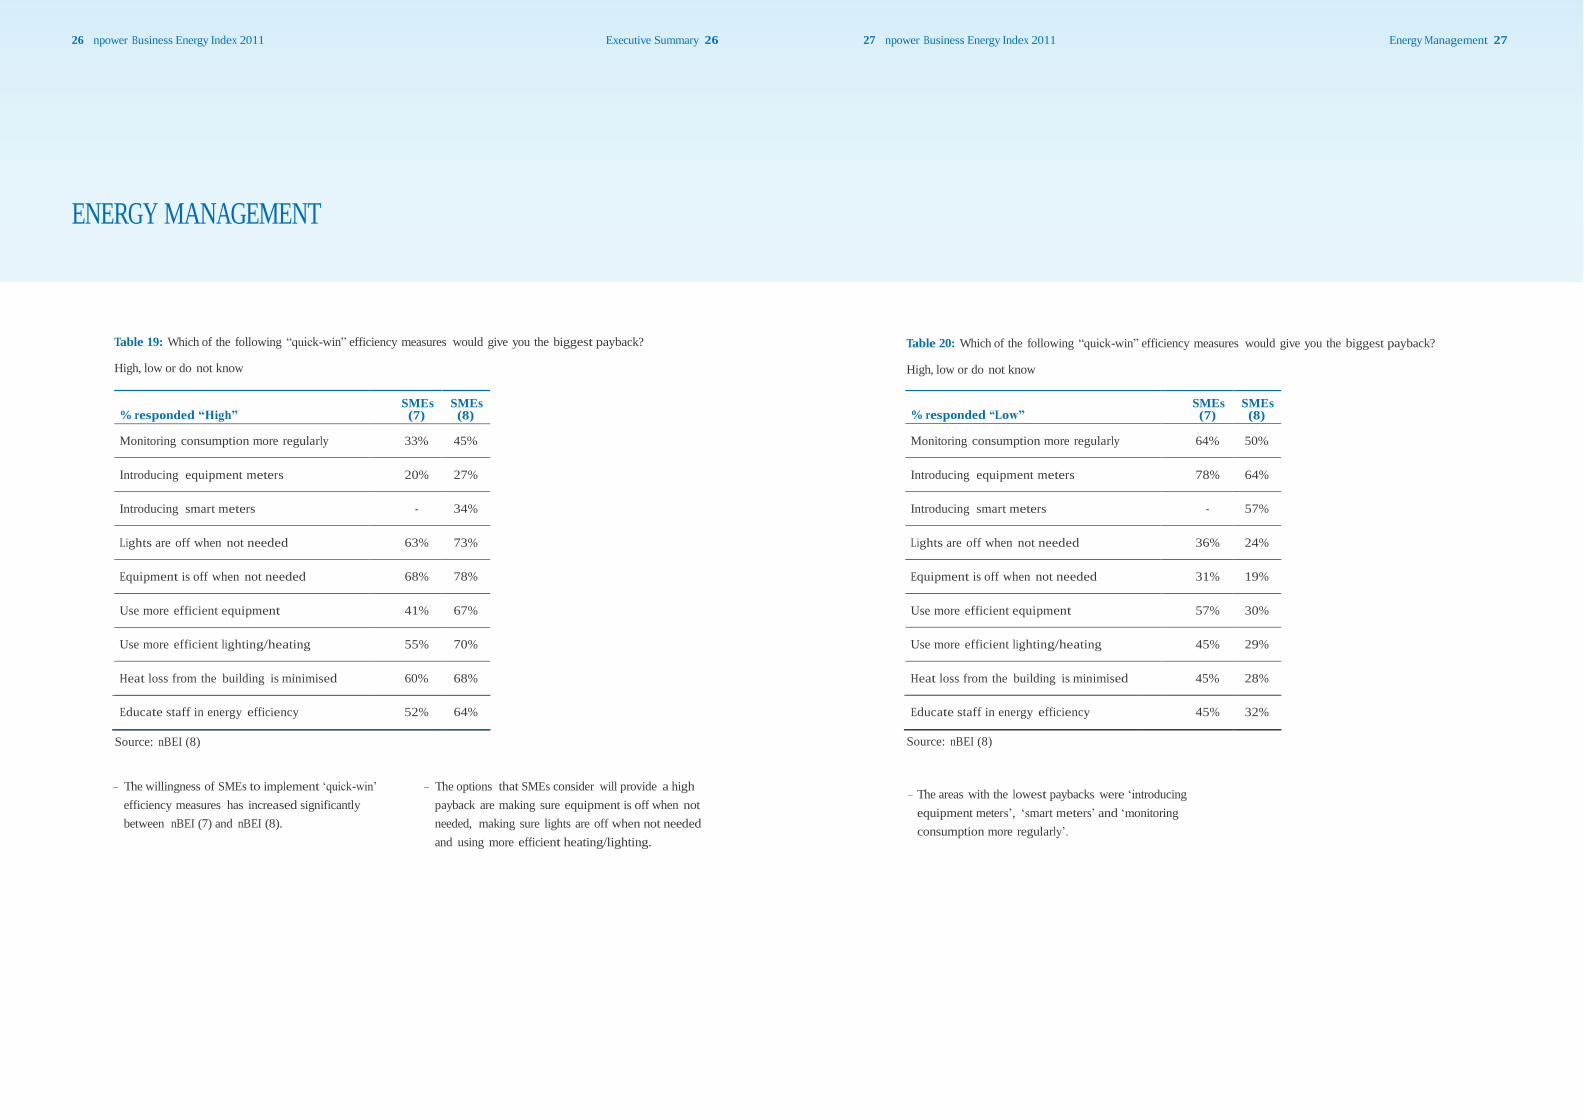
% responded “Low”
SMEs (7)
SMEs (8)
Monitoring consumption more regularly
64%
50%
Introducing equipment meters
78%
64%
Introducing smart meters
-
57%
Lights are off when not needed
36%
24%
Equipment is off when not needed
31%
19%
Use more efficient equipment
57%
30%
Use more efficient lighting/heating
45%
29%
Heat loss from the building is minimised
45%
28%
Educate staff in energy efficiency
52%
64%
Educate staff in energy efficiency
45%
32%
Source: nBEI (8) Source: nBEI (8)
26 npower Business Energy Index 2011 Executive Summary 26 27 npower Business Energy Index 2011 Energy Management 27
ENERGY MANAGEMENT
Table 19: Which of the following “quick-win” efficiency measures would give you the biggest payback?
High, low or do not know
Table 20: Which of the following “quick-win” efficiency measures would give you the biggest payback?
High, low or do not know
% responded “High”
SMEs (7)
SMEs (8)
Monitoring consumption more regularly
33%
45%
Introducing equipment meters
20%
27%
Introducing smart meters
-
34%
Lights are off when not needed
63%
73%
Equipment is off when not needed
68%
78%
Use more efficient equipment
41%
67%
Use more efficient lighting/heating
55%
70%
Heat loss from the building is minimised
60%
68%
– The willingness of SMEs to implement „quick-win‟
efficiency measures has increased significantly
between nBEI (7) and nBEI (8).
– The options that SMEs consider will provide a high
payback are making sure equipment is off when not
needed, making sure lights are off when not needed
and using more efficient heating/lighting.
– The areas with the lowest paybacks were „introducing
equipment meters‟, „smart meters‟ and „monitoring
consumption more regularly‟.

Response
SMEs (8)
1-9
10-24
24-49
50-100
Yes
28%
27%
19%
58%
28%
Response (8) Scotland North Midlands East West Wales
Yes
28%
48%
21%
38%
31%
24%
13%
No
72%
52%
79%
72%
69%
76%
87%
Source: nBEI (8)
Response (8) 1-9 10-24 24-49 50-100
Table 22: Do you have the management time to invest in energy efficiency?
Yes
22%
16%
30%
33%
24%
Yes or no (Breakdown by number of employees) No 78% 84% 70% 67% 76%
Source: nBEI (8)
Response (8) Scotland North Midlands East West Wales
Yes
22%
28%
26%
25%
18%
12%
13%
No
78%
72%
74%
75%
82%
88%
87%
Source: nBEI (8)
28 npower Business Energy Index 2011 Executive Summary 28 29 npower Business Energy Index 2011 Energy Management 29
ENERGY MANAGEMENT
Table 21: Do you have the management time and cash resources to invest in energy efficiency?
Yes or no
Table 23: Do you have the management time to invest in energy efficiency?
Yes or no (Breakdown by region)
Management time Cash resources
Response
SMEs (7)
SMEs (8)
SMEs (7)
SMEs (8)
Yes
31%
28%
34%
22%
No
69%
72%
66%
78%
Source: nBEI (8)
– The percentage of SMEs that believe they have
the management time and cash resources to
invest in energy efficiency has fallen between
nBEI (7) and nBEI (8).
Table 24: Do you have the cash resources to invest in energy efficiency?
Yes or no (Breakdown by number of employees)
SMEs
No 72% 73% 81% 42% 72%
Table 25: Do you have the cash resources to invest in energy efficiency?
Yes or no (Breakdown by region)
Source: nBEI (8) SMEs South South
– SMEs in Scotland were most likely to have the
management time and cash resources to invest
in energy efficiency.

Response
MEUs (7)
MEUs (8)
About 5%
19%
19%
About 10%
24%
30%
About 20%
24%
22%
About 30%
18%
12%
Other (specify)
13%
13%
SMEs (8)
37%
28%
58%
30 npower Business Energy Index 2011 Executive Summary 30 31 npower Business Energy Index 2011 Energy Management 31
ENERGY MANAGEMENT
Table 26: Do you have smart meters at your site?
Yes/no/not sure
SMEs
Response (8)
Yes 17%
No 79%
Not sure 4%
Source: nBEI (8)
Table 27: If not, why not?
Select all that apply
Response
Costs are too high
Inconvenience of installation
Unsure of benefits
Other (specify) 34%
Source: nBEI (8)
MEU responses only
Table 29: What approximate level of energy savings would be technically achievable for your business?
Select one
Table 28: If yes, what features of smart meters are most beneficial for your business?
Rate from 1 to 10
Do not know 3% 5%
Source: nBEI (8)
Response
SMEs (8)
Table 30: Are you able to allocate your energy costs by usage?
The ability to gain an accurate bill and eliminate estimated readings 8.1
The ability to monitor your energy consumption more effectively 7.7
Provide information to help you cut your energy consumption 7.7
Select one
Response
MEUs
(8)
Source: nBEI (8)
– Most SMEs do not have smart meters at their site,
„unsure of the benefits‟ as the biggest barrier.
– SMEs that have installed smart meters find receiving
an accurate bill as the biggest benefit, although there
is little difference between the features.
Yes 50%
No 50%
Source: nBEI (8)
– Between nBEI (7) and nBEI (8), MEUs have
reduced the level of energy savings that they
believe are achievable for their organisations.
– Now, around 64% believe it to be 10% or more
with around 34% believing it to be 20% or more,
compared to 66% and 42% in nBEI (7). This could be
because they have already made significant savings,
and have therefore adjusted what is feasible.

Response
MEUs (5)
MEUs (6)
MEUs (7)
MEUs (8)
Energy consultants and advisors
59%
68%
49%
52%
Energy suppliers
38%
29%
56%
56%
Equipment suppliers
54%
87%
51%
48%
Response
MEUs (5)
MEUs (6)
MEUs (7)
MEUs (8)
Reduced lighting
4.5
4.3
7.2
6.8
More staff working from home
2.4
2.5
3.5
4.0
Major change in manufacturing processes
3.5
3.7
2.8
3.3
Relocate activities overseas
2.1
3.1
2.1
2.3
Undertaken an energy review and/or action plan
-
5.4
7.3
6.6
Engage with staff to encourage energy efficiency action
-
5.6
7.9
7.2
Invest in microgen technology
-
3.9
4.3
5.2
32 npower Business Energy Index 2011 Executive Summary 32 33 npower Business Energy Index 2011 Carbon Regulation & The Economic Climate 33
ENERGY MANAGEMENT
Table 31: How would you rate the feasibility of the following measures to reduce energy costs?
Rate from 1-10, where 10 = highly feasible
Table 32: Do you consider that the energy efficiency services and/or products of any of the following are
helpful to your business?
Select all that apply
NGOs 87% 93% 74% 63%
Source: nBEI (8)
Invest in energy efficiency technologies/replace old equipment - - - 7.1
– The perceived helpfulness of energy efficiency
services and products offered by NGOs continues
to reduce, according to 63% of MEUs in nBEI (8)
compared with 74% in nBEI (7).
– More than half of MEUs consider that energy suppliers
offer energy efficiency services that are helpful to
their business, the same as nBEI (7).
Source: nBEI (8)
– In terms of the feasibility of certain measures to
reduce energy costs, „engage with staff to encourage
energy efficiency action‟ scored the highest while
– Aside from engaging with staff, only „invest in energy
efficiency technologies/replace old equipment‟ now
rates more than 7 out of 10 in terms of feasibility.
Table 33: Do you employ staff for energy
management?
Yes or no
MEUs
Table 34: Do you employ building and/or process
energy management systems?
Yes or no
MEUs
„relocate activities overseas‟ scored the lowest. Response (8) Response (8)
Yes 47%
No 53%
Source: nBEI (8)
Yes 54%
No 46%
Source: nBEI (8)
– Nearly half of MEUs employ staff dedicated to energy
management while over half have building and/or
process energy management systems.

34 npower Business Energy Index 2011 Carbon Regulation & The Economic Climate 35
CARBON REGULATION AND THE ECONOMIC CLIMATE
For many businesses, 2010 was the year
of the Carbon Reduction Commitment
Energy Efficiency Scheme (CRC). In
nBEI (7), we gauged how prepared
businesses were for its introduction, and
found many were unsure of their
obligations. This year, we assessed
attitudes one year on.
Implemented in April last year, the CRC‟s high profile
introduction put energy consumption and related
environmental concerns at the forefront of the minds
of many of the UK‟s major energy users. However,
changes to the scheme, announced in the government‟s
Comprehensive Spending Review in October 2010, added
further confusion and a dose of scepticism, and this is
reflected in this year‟s nBEI.
Half of the MEUs in this year‟s nBEI are participating
in the scheme and their experience and views provide
a good snapshot of how it has been viewed in its early
stages of implementation – and it has revealed a
mixed bag.
The positive impact of the CRC can be seen in the
72% of MEUs who stated they have invested in energy
efficiency measures as a result of their participation in
the scheme, and 62% have installed smart meters. Job
creation has also had a boost with 20% of firms saying
they have taken on additional staff as a direct result of
the CRC. In addition, MEUs agreed that the CRC has
raised energy efficiency and management to a board
level concern. This can only be a positive step in terms
of embedding an energy efficiency culture within the
UK‟s biggest businesses.
That said, only just over a half (54%) say that they have
received adequate advice on the CRC from the
government, and 32% think the removal of recycled
payments from the scheme has affected their ability to
make investments in energy saving measures.
When it comes to assessing what were the most
important CRC-related factors for businesses, compliance
(8.5 rating out of 10) with the associated threat of
significant fines, and improving energy efficiency (8.2
rating out of 10) were the most favoured. Interestingly,
with the first league tables due to be published in
October, the reputational impact of the CRC was placed
bottom, achieving only a 6.6 rating out of 10, perhaps
demonstrating the growing scepticism about the
scheme.
As for the future of the CRC, opinion is divided. An
overwhelming majority 96% want the scheme
simplified and 94% want to see financial incentives
included once again. Over a quarter (26%) want it
scrapped completely.
The CRC is just one way the government is encouraging
businesses to reduce carbon emissions to help it
reach its own targets. That said, as with previous
nBEIs, scepticism remains about whether government
targets are achievable. Also, as seen in previous
reports, reducing costs in the current climate is seen
as more important than reducing emissions. However,
encouragingly this has fallen from 93% in nBEI (7) to
85% in nBEI (8), perhaps demonstrating that MEUs are
recognising that energy efficiency can have the twin
benefits of reducing both costs and carbon emissions.
When asked about the government‟s carbon emission
reduction targets, some 71% of MEUs don‟t believe the
2050 80% target for the UK is achievable, though this is
slightly improved on the last index (78% in nBEI (7)). The
shorter timescale of 2020, with a more modest target of
a 34% carbon reduction, is seen as a more realistic target
with 42% of those questioned saying it could be met.
That said, the majority (64%) are not convinced that the
current coalition government policies will help businesses
reduce carbon emissions. It adds
up to a fragmented business view about the low carbon
economy.
This is reflected in how many businesses recognise
the commercial benefits of a smaller carbon footprint.
While, 24% of SMEs and 41% of MEUs say that such a
reduction could deliver new commercial opportunities,
for SMEs this is an increase, but the figure for MEUs has
fallen in comparison with previous years.
Another trend identified this year has been the desire
by both SMEs and MEUs to increase their activities in
both energy management and energy efficiency
initiatives. Indeed, energy efficiency was highlighted
across the board as the primary area to help reduce
a company‟s carbon emissions. While slightly down
on last year‟s figure, nonetheless it is still significantly
ahead of the second favoured area - equipment/
technology changes.
Interestingly, there appears to be no great drive from
clients and customers to request policies on CSR
and the environment. Just over a fifth (22%) of our
respondents said they had received such a request since
last year, although this increases to 46% of MEUs.
This year, we also gauged opinion and awareness of
new government initiatives, such as the Green Deal for
Business. Particularly relevant for SMEs, this scheme
could provide much needed finance to enable SMEs
to invest in energy efficiency measures. However, the
nBEI has revealed a lack of awareness of the initiative
among the target SME audience. The overwhelming
majority (85%) said they had not heard of it, and the
small number that admitted to knowing about the
initiative and its perceived benefits - access to finance,
advice and help for energy efficiency measures were
cited as reasons to engage in the scheme.
In further disappointing reading for the government,
fewer SMEs this year (38%) compared to 45% in nBEI
(7), felt the administration gave useful advice on the
topic of energy efficiency.
So, while scepticism still exists about government
targets for carbon emission reductions, companies,
both large and small, have continued to implement
energy efficiency measures against a continuing
challenging economic background. While the CRC has
acted as a catalyst for many MEUs to implement energy
efficiency measures, there is a sense of disillusionment,
particularly with the removal of financial incentives. It
will be interesting to gather views as the CRC becomes
further ingrained within the business community in years
to come.
As for SMEs, if the government is serious about the
impact it wants the Green Deal to have to help improve
energy efficiency, it still has some way to educate the
SME marketplace of the detail and the potential benefits
it could bring.

Yes 21%
32%
22%
29%
21%
31%
No 79%
68%
78%
71%
79%
69%
Yes 16%
24%
58%
41%
25%
29%
No 84%
76%
42%
59%
75%
71%
Response
SMEs (8)
MEUs (8)
All (8)
Yes
43%
41%
42%
SMEs SMEs MEUs MEUs All All (7) (8) (7) (8) (7) (8)
36 npower Business Energy Index 2011 Carbon Regulation & The Economic Climate 37
CARBON REGULATION & THE ECONOMIC CLIMATE
SME and MEU responses
Table 35: Do you believe that the UK government‟s target to reduce carbon emissions by 80% by 2050 is realistic?
Yes or no
Response
– While there is still some scepticism from businesses
that government targets for emissions reduction can
be achieved, the percentage has fallen from 79% in
nBEI (7) to 69% in nBEI (8).
– Both SMEs and MEUs believe the government‟s
interim target of 34% by 2020 is more realistic when
compared to the long term target of 80% by 2050,
with 43% of SMEs and 41% of MEUs believing that
the 34% reduction can be met.
– Opinion is split about whether the coalition
government‟s policies will help UK business
reduce its carbon emissions.
Source: nBEI (8)
Table 36: Do you believe that the UK government‟s interim target to reduce carbon emissions by 34% by
2020 is realistic?
Yes or no
Table 38: Do you believe that reducing your carbon footprint could provide your business with new
commercial opportunities?
Yes or no
SMEs SMEs MEUs MEUs All All Response (7) (8) (7) (8) (7) (8)
No 57% 59% 58%
Source: nBEI (8)
Source: nBEI (8)
Table 37: Do you feel the coalition government‟s policies will help UK business reduce its carbon emissions?
Yes/no/do not know
– 24% of SMEs believe that reducing their carbon
footprint will deliver new business opportunities,
an increase from 16% in nBEI (7) .
– On the other hand, compared with nBEI (7), fewer
MEUs believe that reducing their carbon footprint
will deliver new business opportunities.
Response SMEs (8)
MEUs (8)
All (8)
Yes 32% 44% 36%
No 50% 38% 46%
Do not know 18% 18% 18%
Source: nBEI (8)
Energy efficiency 43%
35%
41%
45%
43%
38%
Switching to a green tariff 18%
13%
10%
8%
15%
12%
Staff empowerment 14%
11%
20%
12%
16%
11%
Process changes 14%
3%
24%
5%
17%
4%
Equipment/technology
changes -
29%
-
24%
-
27%
Other 12%
9%
5%
7%
9%
8%
Energy efficiency 6.3
6.4
6.2
6.9
6.2
6.6
Energy management 5.9
6.4
6.2
6.7
6.0
6.5
SMEs SMEs MEUs MEUs All All (7) (8) (7) (8) (7) (8)
SMEs SMEs MEUs MEUs All All (7) (8) (7) (8) (7) (8)
38 npower Business Energy Index 2011 Executive Summary 38 39 npower Business Energy Index 2011 Carbon Regulation & The Economic Climate 39
CARBON REGULATION & THE ECONOMIC CLIMATE
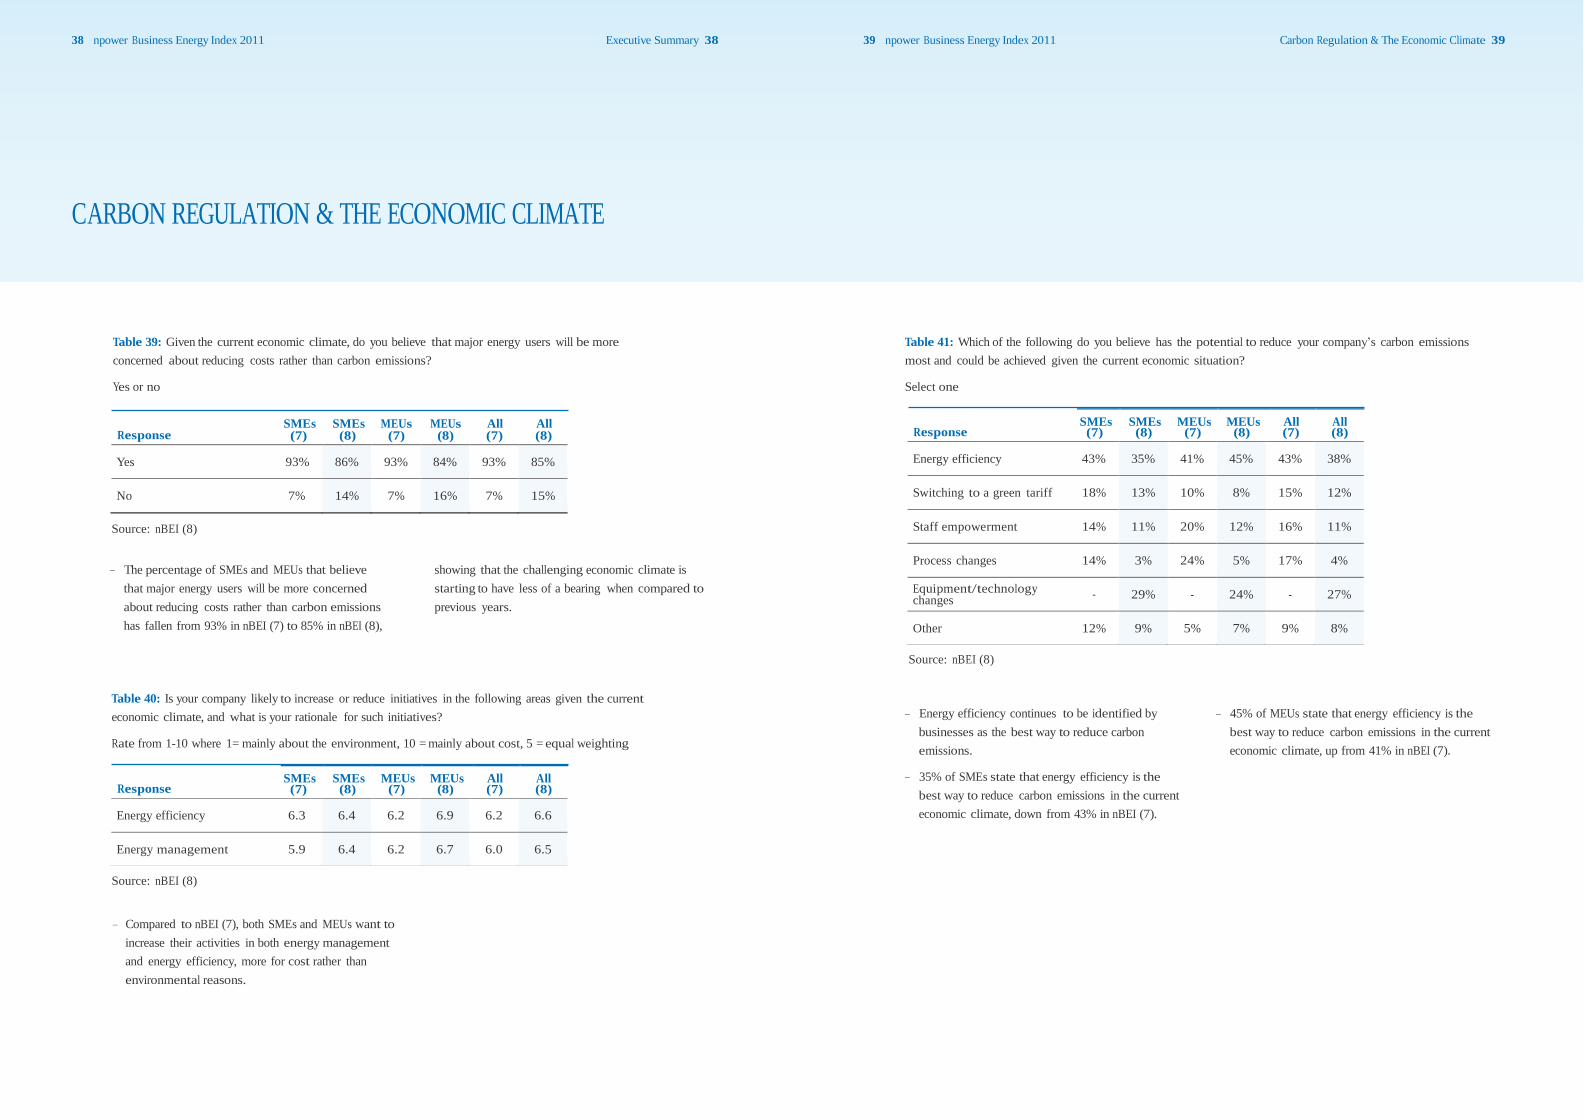
Table 39: Given the current economic climate, do you believe that major energy users will be more
concerned about reducing costs rather than carbon emissions?
Yes or no
Table 41: Which of the following do you believe has the potential to reduce your company‟s carbon emissions
most and could be achieved given the current economic situation?
Select one
Response SMEs (7)
SMEs (8)
MEUs (7)
MEUs (8)
All (7)
All (8)
Response
Yes 93%
86%
93%
84%
93%
85%
No 7%
14%
7%
16%
7%
15%
Source: nBEI (8)
– The percentage of SMEs and MEUs that believe
that major energy users will be more concerned
about reducing costs rather than carbon emissions
has fallen from 93% in nBEI (7) to 85% in nBEI (8),
showing that the challenging economic climate is
starting to have less of a bearing when compared to
previous years.
Source: nBEI (8)
Table 40: Is your company likely to increase or reduce initiatives in the following areas given the current
economic climate, and what is your rationale for such initiatives?
Rate from 1-10 where 1= mainly about the environment, 10 = mainly about cost, 5 = equal weighting
Response
– Energy efficiency continues to be identified by
businesses as the best way to reduce carbon
emissions.
– 35% of SMEs state that energy efficiency is the
best way to reduce carbon emissions in the current
economic climate, down from 43% in nBEI (7).
– 45% of MEUs state that energy efficiency is the
best way to reduce carbon emissions in the current
economic climate, up from 41% in nBEI (7).
Source: nBEI (8)
– Compared to nBEI (7), both SMEs and MEUs want to
increase their activities in both energy management
and energy efficiency, more for cost rather than
environmental reasons.

Response
SMEs (8)
MEUs (8)
All (8)
More impact
29%
27%
28%
Less impact
13%
20%
16%
Response
SMEs (8)
MEUs (8)
All (8)
Yes
11%
46%
22%
SMEs SMEs MEUs MEUs All All (7) (8) (7) (8) (7) (8)
40 npower Business Energy Index 2011 Executive Summary 40 41 npower Business Energy Index 2011 Carbon Regulation & The Economic Climate 41
CARBON REGULATION & THE ECONOMIC CLIMATE
Table 42: Do you think the UK should play a leading role in the reduction of carbon emissions?
Yes or no
Response
Table 44: Do you think the coalition government will have more or less impact on carbon reduction than the
previous government?
Select one
Yes 78%
80%
83%
84%
80%
82%
No 22%
20%
17%
16%
20%
18%
Source: nBEI (8)
– Most interviewees (82%) believe that the UK should
play a leading role in reducing carbon emissions on a
worldwide level, an increase from 80% in nBEI (7).
The same impact 58% 53% 56%
Source: nBEI (8)
Table 43: Have you been asked by clients/customers to provide policies on corporate social responsibility
and the environment?
Yes or no
– Around half of MEUs and SMEs believe that the
coalition government will have the same impact on
carbon reduction as the previous government, with
around a third believing it will have more impact.
No 89% 54% 78%
Source: nBEI (8)
– Nearly half of MEUs (46%) and a small number of
SMEs (11%) have been asked by clients/customers to
provide policies on corporate social responsibility and
the environment.

Response
SMEs (7)
SMEs (8)
Yes
47%
32%
42 npower Business Energy Index 2011 Executive Summary 42 43 npower Business Energy Index 2011 Carbon Regulation & The Economic Climate 43
CARBON REGULATION & THE ECONOMIC CLIMATE
SME only responses
Table 45: Do you believe that the government targets to reduce carbon emissions and the associated
legislation will have an impact on your business?
Table 47: Which type of energy user will be the beneficiary of the Green Deal?
% Yes
SMEs
Yes or no
Response (8)
Residential 65%
Small Business 52%
Large Business 58%
No 53% 68% Source: nBEI (8)
Source: nBEI (8) – The majority of SMEs believe that residential
customers will receive the most benefit.
the Green Deal (currently) does not include large
businesses.
– The number of SMEs who believe that government
targets to reduce carbon emissions and the
associated legislation will impact their business has
reduced from 47% in nBEI (7) to 32% in nBEI (8).
– However, 58% also believe that large businesses
will benefit, demonstrating a lack of awareness as
Table 48: What would the benefits of the proposed Green Deal be for businesses?
Table 46: Have you heard of the new government‟s proposed Green Deal?
Yes or no
SMEs
% Yes
SMEs
Response (8)
Access to finance for energy efficiency measures 58% Response (8)
Yes 15%
No 85%
Source: nBEI (8)
Funding for on-site generation 45%
Access to help and advice on energy efficiency measures 52%
The benefits are only for residential energy users 29%
– The majority of SMEs (85%) have not heard of
the government‟s Green Deal.
Source: nBEI (8)
– 58% of SMEs believe that the biggest benefit to
businesses would be the access to finance, a key
barrier to installing energy efficiency measures
observed earlier in the report.
– Almost a third also think that businesses will not
benefit at all.

Response
SMEs (7)
SMEs (8)
More likely to save energy
27%
38%
Less likely to save energy
4%
1%
44 npower Business Energy Index 2011 Executive Summary 44 45 npower Business Energy Index 2011 Carbon Regulation & The Economic Climate 45
CARBON REGULATION & THE ECONOMIC CLIMATE
Table 49: Would having information about your CO2 emissions on your bill make you…
Select one
Table 51: Is the current economic climate reducing your ability to implement energy efficiency and carbon
footprint reduction plans?
Select one
Response
SMEs (7)
SMEs (8)
Yes 52% 50%
Wouldn‟t make any difference 69% 61%
Source: nBEI (8)
– Over a third of SMEs felt that having information on
CO2 emissions on their bill would make them more
likely to save energy.
Table 50: Do you feel the government offers useful advice on the issue of carbon reduction and energy efficiency?
Select one
No 47% 47%
Do not know 1% 3%
Source: nBEI (8)
Table 52: Is the current economic climate reducing your ability to implement energy efficiency and
carbon footprint reduction plans?
Yes/no/do not know (Breakdown by number of employees)
SMEs
SMEs
SMEs Response (8) 1-9 10-24 24-49 50-100
Response (7) (8) Yes 50% 46% 33% 67% 60%
Yes 45% 38%
No 50% 48%
Do not know 5% 14%
Source: nBEI (8)
No 47% 52% 56% 33% 38%
Do not know 3% 2% 11% 0% 2%
Source: nBEI (8)
– Compared to nBEI (7), fewer SMEs (38%) felt that the
government gave useful advice on energy efficiency
in nBEI (8).
Response
SMEs (8)
Scotland
North
Midlands
South East
South West
Wales
Yes
50%
44%
53%
56%
37%
64%
75%
No
47%
52%
47%
42%
57%
36%
13%
Average shown
SMEs (8)
1-9
10-24
24-49
50-100
Households
7.2
7.3
6.9
7.8
7.1
Motorists
7.3
7.3
7.3
7.8
7.2
Small business
6.1
6.3
5.9
7.0
5.9
Do not know 3% 4% 0% 2% 6% 0% 12% Large business
8.0
8.1
8.3
8.3
7.6
Source: nBEI (8) Government/public sector 7.9 8.0 8.1 8.2 7.7
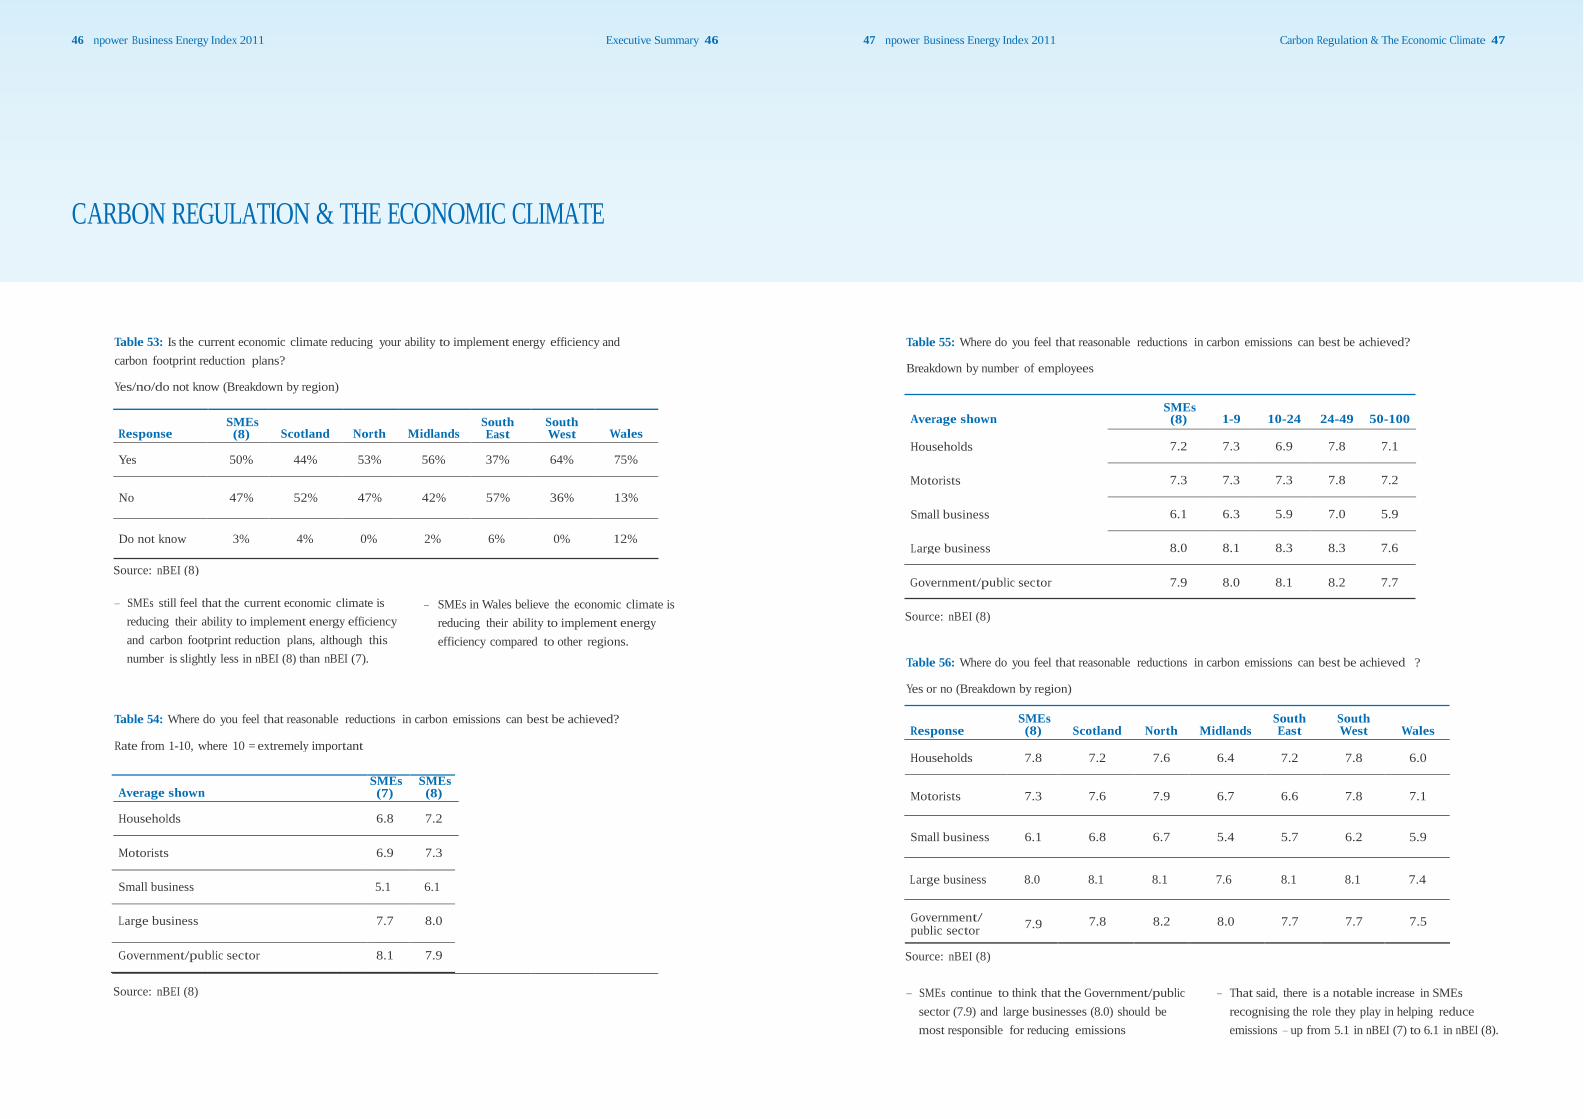
– SMEs still feel that the current economic climate is – SMEs in Wales believe the economic climate is Source: nBEI (8)
Table 56: Where do you feel that reasonable reductions in carbon emissions can best be achieved
reducing their ability to implement energy efficiency reducing their ability to implement energy and carbon footprint reduction plans, although this efficiency compared to other regions. number is slightly less in nBEI (8) than nBEI (7).
Rate from 1-10, where 10 = extremely important Response (8) Scotland North Midlands East West Wales
Households 7.8 7.2 7.6 6.4 7.2 7.8 6.0
Average shown SMEs (7)
SMEs (8)
Motorists
7.3
7.6
7.9
6.7
6.6
7.8
7.1
Households 6.8 7.2
Small business 6.1 6.8 6.7 5.4 5.7 6.2 5.9 Motorists 6.9 7.3
Small business 5.1 6.1 Large business 8.0 8.1 8.1 7.6 8.1 8.1 7.4
Large business
7.7
8.0
Government/ 7.9
public sector
7.8
8.2
8.0
7.7
7.7
7.5
Government/public sector 8.1 7.9 Source: nBEI (8)
46 npower Business Energy Index 2011 Executive Summary 46 47 npower Business Energy Index 2011 Carbon Regulation & The Economic Climate 47
CARBON REGULATION & THE ECONOMIC CLIMATE
Table 53: Is the current economic climate reducing your ability to implement energy efficiency and
carbon footprint reduction plans?
Yes/no/do not know (Breakdown by region)
Table 55: Where do you feel that reasonable reductions in carbon emissions can best be achieved?
Breakdown by number of employees
?
Yes or no (Breakdown by region)
Table 54: Where do you feel that reasonable reductions in carbon emissions can best be achieved? SMEs South South
Source: nBEI (8) – SMEs continue to think that the Government/public
sector (7.9) and large businesses (8.0) should be
most responsible for reducing emissions
– That said, there is a notable increase in SMEs
recognising the role they play in helping reduce
emissions – up from 5.1 in nBEI (7) to 6.1 in nBEI (8).

Response
SMEs (8)
Yes
36%
Response
SMEs (7)
SMEs (8)
Yes
56%
54%
48 npower Business Energy Index 2011 Executive Summary 48 49 npower Business Energy Index 2011 Carbon Regulation & The Economic Climate 49
CARBON REGULATION & THE ECONOMIC CLIMATE
Table 57: Will the feed-in tariffs for small scale renewable generation incentivise your business to invest in
sustainable generation technologies?
Yes/no
Table 59: Do you feel that the level of advice/guidance on CRC provided by the government so far is adequate?
Yes/No
No 64%
Source: nBEI (8)
No 44% 46%
Source: nBEI (8)
– 64% of SMEs believe that the feed-in tariffs for small
scale renewable generation will not incentivise
their business to invest in sustainable generation
technologies.
– Half of the MEUs surveyed are participating in the
Carbon Reduction Commitment Energy Efficiency
Scheme.
– Nearly half of MEUs (46%) say that they have not
received adequate advice on the CRC from the
government, slightly more than in nBEI (7).
MEU only responses
Table 58: Is your organisation participating in the CRC (Carbon Reduction Commitment Energy Efficiency Scheme)?
Yes/no
Table 60: Has the removal of recycled payments from the scheme affected your ability to make
investments in energy savings measures?
Yes/No
MEUs
MEUs Response (8)
Response (8) Yes 32%
Yes 50%
No 50%
Source: nBEI (8)
No 68%
Source: nBEI (8)
– Nearly a third of MEUs (32%) think that the removal
of recycled payments from the scheme has affected
their ability to make investments in energy savings
measures.

Average shown
MEUs (7)
MEUs (8)
Reputation
6.9
6.6
Costs and return on investment
7.7
8.0
Carbon reduction
7.5
7.7
Improving energy efficiency
8.0
8.2
50 npower Business Energy Index 2011 Executive Summary 50 51 npower Business Energy Index 2011 Carbon Regulation & The Economic Climate 51
CARBON REGULATION & THE ECONOMIC CLIMATE
Table 61: What measures has your company implemented to manage your inclusion in CRC? Table 63: From where would you prefer to receive advice about the CRC?
% Yes
Response
MEUs
(8)
Rate from 1-10, where 10 = high preference
Average shown
MEUs
(7)
MEUs
(8)
Use the services of a consultant 50%
Take on extra staff 20%
Invest in energy efficiency measures 72%
Installed smart meters 62%
Gained the Carbon Trust standard 38%
Bought carbon management software 42%
None 10%
Energy suppliers 5.1 4.6
Energy consultants and advisors 5.7 4.9
Equipment suppliers 4.9 4.2
NGOs 7.1 5.5
– MEUs still prefer the advice of NGOs about the CRC,
although this has fallen since nBEI (7), demonstrating
businesses seek advice from a number of sources
Source: nBEI (8)
– Encouragingly, the CRC has resulted in increased
focus on implementing energy efficiency measures.
72% have invested in energy efficiency measures to
manage their participation in the scheme.
– One in five (20%) had also take on additional staff.
Table 64: What is most important to your business under the CRC?
Rate from 1-10, where 10 = high importance
Table 62: Do you agree or disagree with the following statement?
Rate from 1-10, where 10 = high preference
MEUs Average shown (8)
Performance in the CRC scheme‟s league table is an important consideration
when deciding energy efficiency investments in my company
Source: nBEI (8)
3.3 Compliance 7.9 8.5
Source: nBEI (8)
– The threat of significant fines means that compliance
(8.5) is as important for MEUs as improving energy
efficiency (8.2).
– Reputation (6.6) continues to be the least important
outcome from the CRC for MEUs. This could
demonstrate a growing scepticism of the potential
impact of the forthcoming league tables.
Average score
MEUs (8)
I am finding the process simple and straightforward
3.1
I have received sufficient guidance for the process
3.0
I am finding the calculations required for the reports confusing
2.5
Collating data from multiple sites is proving problematic
2.8
The information required is taking a long time to collate
3.1
I am concerned my company will miss the deadline
2.0
I am confident the data my company will submit is correct
4.1
Response
MEUs (8)
The CRC has raised energy efficiency and management to a board level concern
3.4
The CRC is a waste of time and resources
2.5
The CRC places unnecessary financial burden on businesses
3.3
The CRC should be postponed until UK economy‟s financial recovery is more secure
2.9
The CRC will help the UK meet its carbon reduction targets
3.3
The CRC is unnecessarily complex and unwieldy
3.2
Now that the CRC is a tax there is no incentive for businesses to reduce their
own carbon emissions
2.7
The CRC is still an important piece of legislation
3.2
The first league table (published in October 2011) will not carry any real meaning
3.2
52 npower Business Energy Index 2011 Executive Summary 52 53 npower Business Energy Index 2011 Carbon Regulation & The Economic Climate 53
CARBON REGULATION & THE ECONOMIC CLIMATE
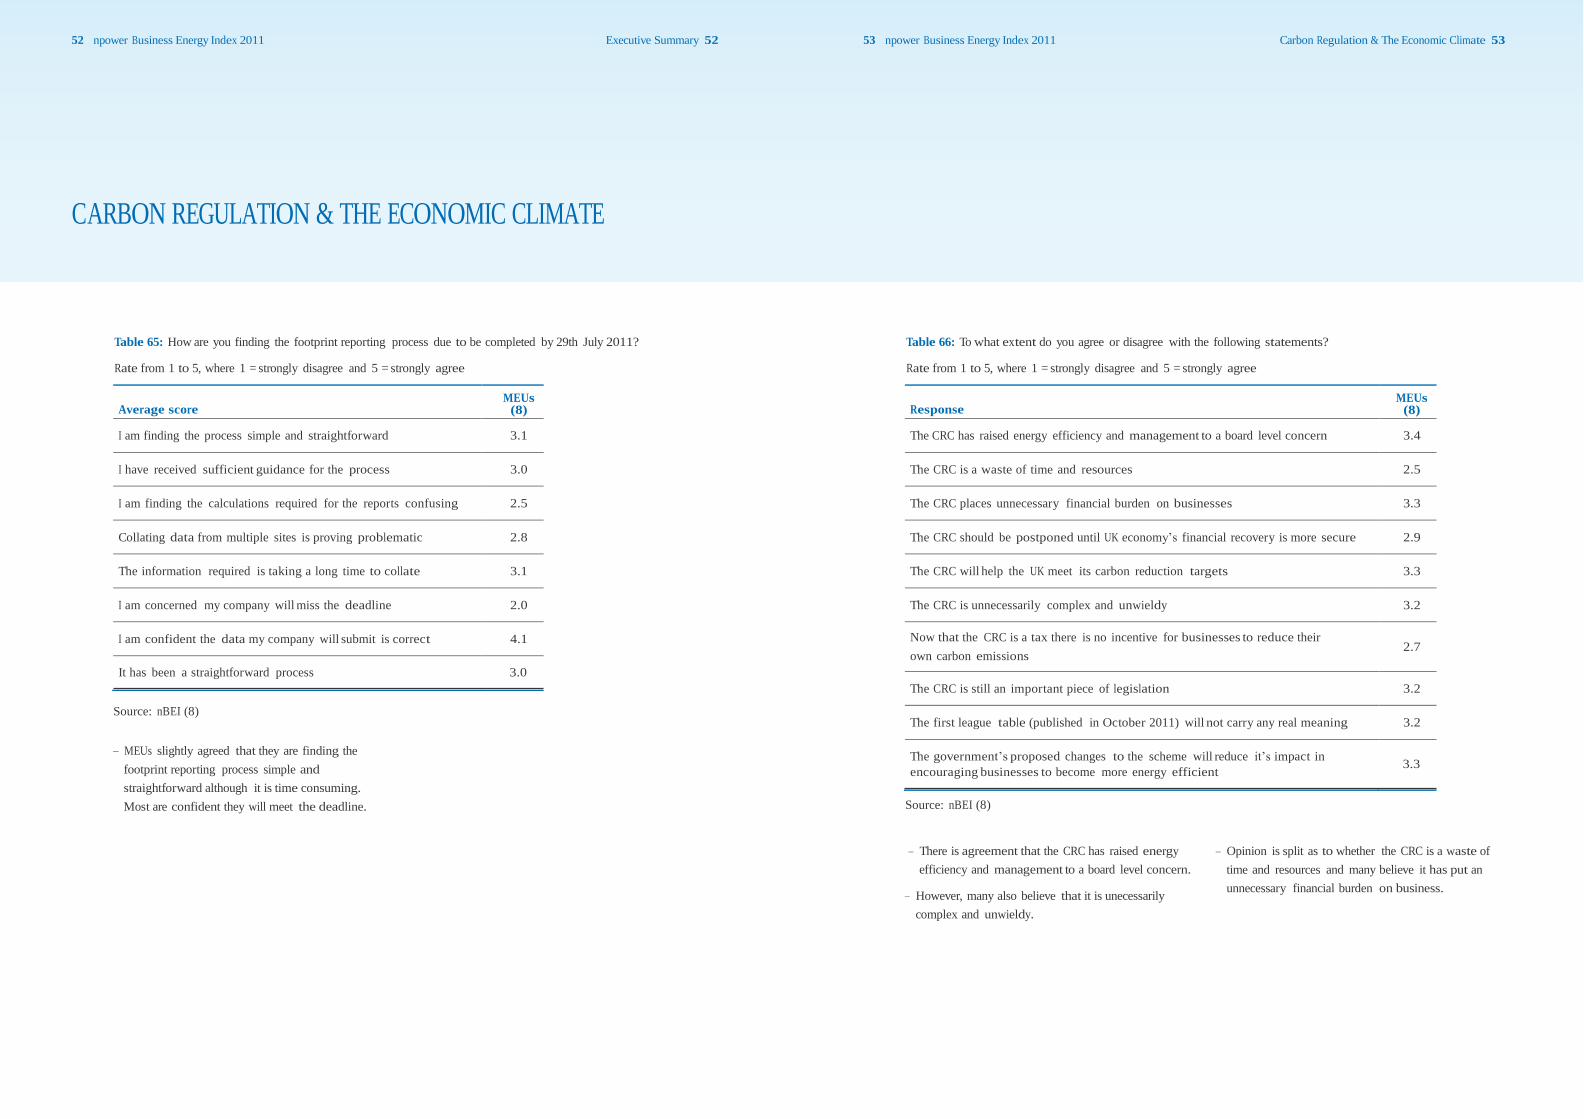
Table 65: How are you finding the footprint reporting process due to be completed by 29th July 2011?
Rate from 1 to 5, where 1 = strongly disagree and 5 = strongly agree
Table 66: To what extent do you agree or disagree with the following statements?
Rate from 1 to 5, where 1 = strongly disagree and 5 = strongly agree
It has been a straightforward process 3.0
Source: nBEI (8)
– MEUs slightly agreed that they are finding the
footprint reporting process simple and
straightforward although it is time consuming.
Most are confident they will meet the deadline.
The government‟s proposed changes to the scheme will reduce it‟s impact in
encouraging businesses to become more energy efficient 3.3
Source: nBEI (8)
– There is agreement that the CRC has raised energy
efficiency and management to a board level concern.
– However, many also believe that it is unecessarily
complex and unwieldy.
– Opinion is split as to whether the CRC is a waste of
time and resources and many believe it has put an
unnecessary financial burden on business.
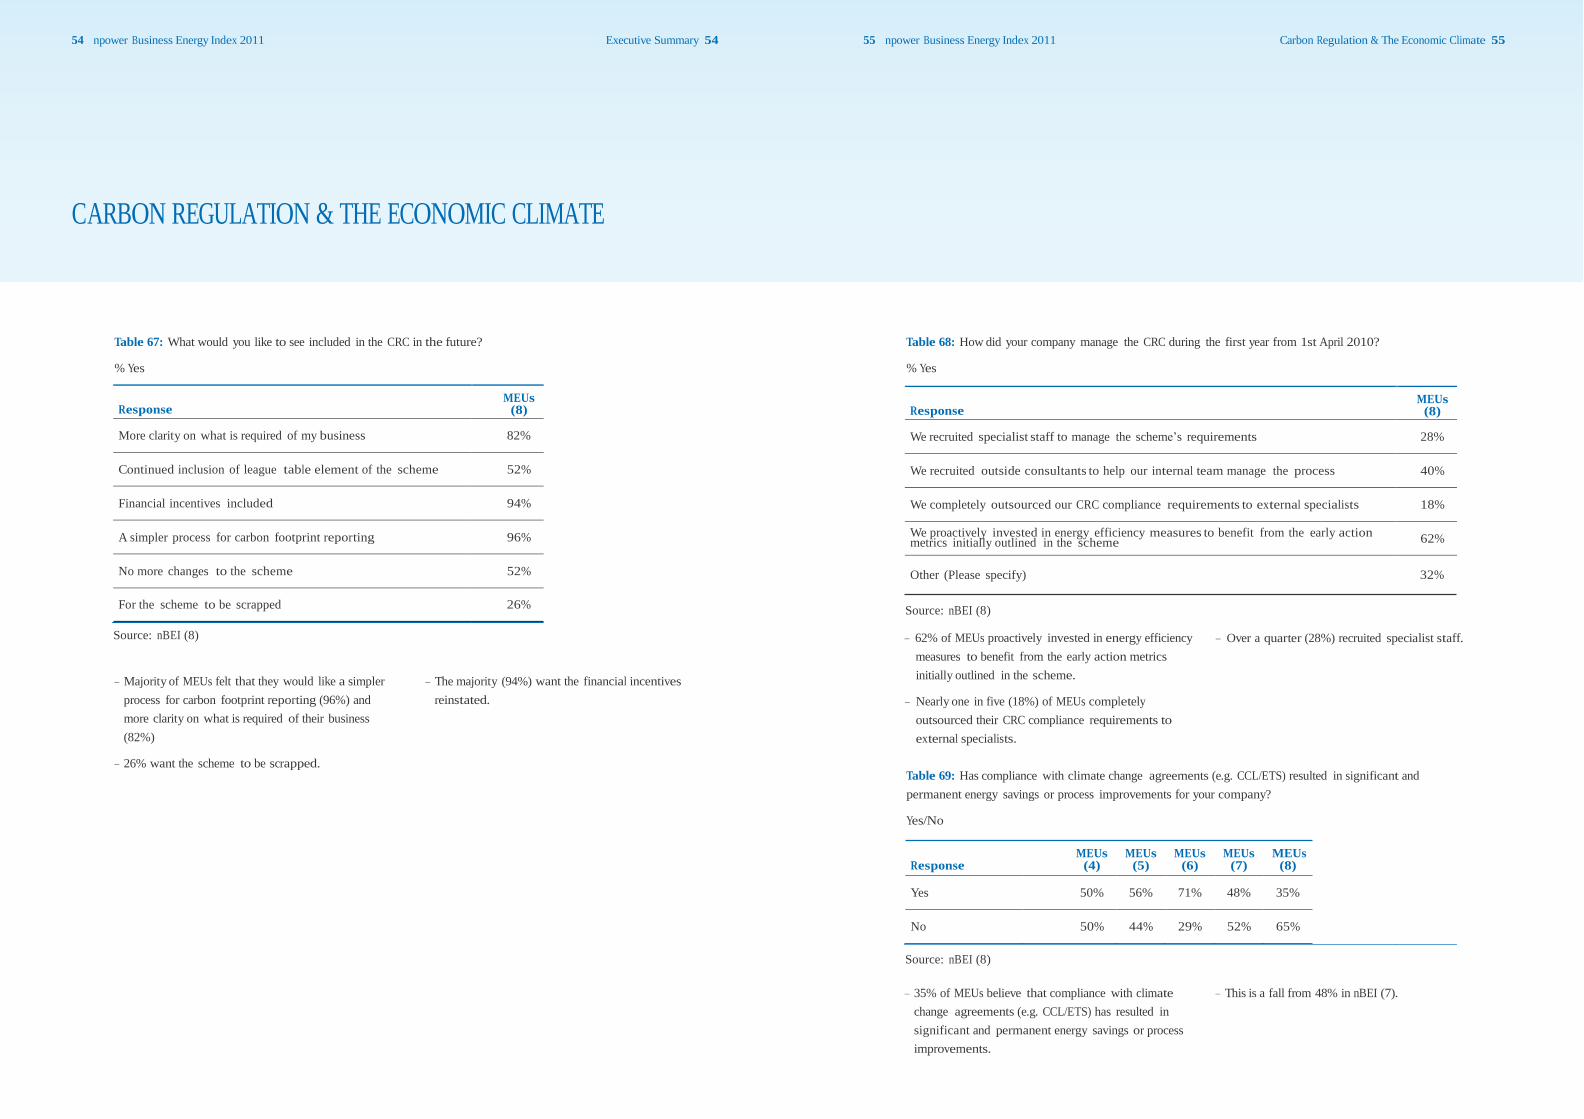
Response
MEUs (8)
More clarity on what is required of my business
82%
Continued inclusion of league table element of the scheme
52%
Financial incentives included
94%
A simpler process for carbon footprint reporting
96%
No more changes to the scheme
52%
Response
MEUs (8)
We recruited specialist staff to manage the scheme‟s requirements
28%
We recruited outside consultants to help our internal team manage the process
40%
We completely outsourced our CRC compliance requirements to external specialists
18%
We proactively invested in energy efficiency measures to benefit from the early action
62%
Response (4) (5) (6) (7) (8)
Yes
50%
56%
71%
48%
35%
No
50%
44%
29%
52%
65%
54 npower Business Energy Index 2011 Executive Summary 54 55 npower Business Energy Index 2011 Carbon Regulation & The Economic Climate 55
CARBON REGULATION & THE ECONOMIC CLIMATE
Table 67: What would you like to see included in the CRC in the future?
% Yes
Table 68: How did your company manage the CRC during the first year from 1st April 2010?
% Yes
For the scheme to be scrapped 26%
metrics initially outlined in the scheme
Other (Please specify) 32%
Source: nBEI (8)
Source: nBEI (8) – 62% of MEUs proactively invested in energy efficiency
measures to benefit from the early action metrics
– Over a quarter (28%) recruited specialist staff.
– Majority of MEUs felt that they would like a simpler
process for carbon footprint reporting (96%) and
more clarity on what is required of their business
(82%)
– 26% want the scheme to be scrapped.
– The majority (94%) want the financial incentives
reinstated.
initially outlined in the scheme.
– Nearly one in five (18%) of MEUs completely
outsourced their CRC compliance requirements to
external specialists.
Table 69: Has compliance with climate change agreements (e.g. CCL/ETS) resulted in significant and
permanent energy savings or process improvements for your company?
Yes/No
MEUs MEUs MEUs MEUs MEUs
Source: nBEI (8)
– 35% of MEUs believe that compliance with climate
change agreements (e.g. CCL/ETS) has resulted in
significant and permanent energy savings or process
improvements.
– This is a fall from 48% in nBEI (7).

56 npower Business Energy Index 2011 Energy Risk 57
ENERGY RISK
We addressed the topic of energy risk
for the first time in nBEI (7). Then,
businesses believed energy risk
outweighed or was equal to, risks
relating to health and safety, security
and credit.
This remains true in this year‟s report. Risk associated
with energy use is the primary factor for concern for
many companies. For MEUs, energy is viewed as
its top risk over other important areas such as staff
and legislation. While the SME community sees it as
much less of a risk when viewed alongside other vital
daily operational areas such as sales, cash flow and
productivity, it was still ranked higher than health
and safety.
However, despite MEUs recognising that energy risk is
their top concern, it is not the top priority for having a
strategy to manage it. While 83% of MEUs do have a
strategy in place, 91% have a health and safety strategy
in place – despite viewing this and other areas below
energy on a perceived risk scale.
However, the importance of energy risk is recognised
through the fact that 44% of MEUs said it has gained a
higher profile within their organisations over the past
three years. Bringing together an acceptance of energy
risk with a higher internal profile should encourage more
companies to implement strategies in the future.
Added to this, for MEUs, the increased awareness of
energy risks has brought about encouraging changes
in how they manage energy, with 81% saying it had
lead to improved monitoring and reporting and 85%
saying it had lead to improved energy efficiency. To
support these acknowledged changes, 63% of MEUs
have a person specifically responsible for energy
purchasing and of those, 14% are a board member,
this is an increase of 3% on the previous year. It could be
argued that with significant business risks identified as
energy cost and supply, we could see an increase in the
number of companies seeking to elevate responsibility
to director level in the future.
In terms of the source of energy risk, there are
differences between MEUs and SMEs. While both agree
that supply costs are the number one risk – for MEUs it
has a 7.2 rating out of 10 and SMEs give it a 6.3 rating
out of 10 - legislative compliance (6.7 rating out of 10)
is the next highest priority for MEUs and security of
supply for SMEs. Clearly, legislation such as the CRC is
having an impact on the businesses it is aimed at.
Indeed, for MEUs, security of supply comes below
reputation on the risk scale, although it is still given a
high ranking (6.3 out of 10). That said, overall, both
small and large sized companies agree that the dual
concerns of cost and security of supply will continue
to be high risks over the next five years. This indicates
that they are not the result of short term pressures such
as price increases or the economic climate, and as such
the argument for demand management becomes ever
clearer.
For MEUs specifically, the absence of a volume tolerance
strategy in the case of 55% of businesses highlights an
area where real progress could be made. By managing
the risks associated with usage fluctuation, and
utilising an improved purchasing strategy that aligns
consumption more closely with cost, real benefits
could be felt.
It is clear that energy and the inherent risks are being
recognised by companies of all sizes. They cite cost
of supply and security of supply as the key areas of
concern, not just now, but into the foreseeable future.
At the same time, important factors such as improving
energy efficiency and management, alongside ongoing
monitoring and reporting, are all areas to help manage
risk. In short, all businesses should have an integrated
strategy in place to manage energy risk – from
procurement through to management.
Most importantly, the need for senior director
engagement is paramount to help drive through
improvements, particularly so energy risk remains a
board level concern, and appropriate measures are put
in place to manage these risks.

Average shown
SMEs (7)
SMEs (8)
MEUs (7)
MEUs (8)
ALL (7)
ALL (8)
Health & safety
4.8
4.6
6.4
5.4
5.4
4.8
Staff
5.9
4.6
6.3
6.2
6.0
5.1
Security
5.4
5.1
6.1
5.8
5.6
5.3
Purchasing
5.3
4.9
6.6
5.9
5.7
5.2
Credit
5.6
4.8
5.2
5.2
5.5
4.9
Cash flow
6.5
5.6
6.4
5.8
6.5
5.7
Productivity
6.1
5.5
6.2
5.9
6.2
5.6
Sales
6.7
6.3
5.4
5.1
6.3
5.9
Legislation
6.6
5.4
6.8
6.4
6.7
5.7
% Yes
SMEs (7)
SMEs (8)
MEUs (7)
MEUs (8)
All (7)
All (8)
Health & safety
76%
72%
88%
91%
80%
78%
Staff
75%
68%
86%
84%
78%
73%
Security
74%
74%
87%
87%
78%
79%
Purchasing
70%
72%
85%
85%
74%
77%
Credit
73%
65%
68%
68%
74%
66%
Cash flow
81%
75%
79%
79%
81%
76%
Productivity
70%
70%
69%
69%
72%
70%
Sales
76%
73%
59%
59%
70%
68%
Legislation
63%
60%
78%
78%
70%
66%
58 npower Business Energy Index 2011 Executive Summary 58 59 npower Business Energy Index 2011 Energy Risk 59
ENERGY RISK
SME and MEU responses
Table 70: What are the primary risks your business is facing?
Rate from 1-10, where 10 = very high risk
Table 71: Does your business have a strategy in place to manage your business risks and if so, which risks do
you manage?
Yes, no or don‟t know
Energy 5.3 5.2 7.3 6.7 6.0 5.7
Source: nBEI (8)
Energy 54% 57% 83% 83% 65% 66%
Source: nBEI (8)
– MEUs identify energy as the biggest risk to their
business, followed by legislation. SMEs identify sales
and cash flow as their biggest risks.
– All figures are slightly lower for nBEI(8) than
nBEI(7)
– Strategies for managing energy, legislation and credit
risk are less developed than for all the other risks
businesses face, with just 66% of respondents stating
that they had a strategy to manage these risks.
– MEUs are far more developed than SMEs in terms of
managing energy risk.

Response
SMEs (7)
SMEs (8)
MEUs (7)
MEUs (8)
All (7)
All (8)
No, it has stayed the same
58%
59%
19%
38%
45%
52%
Energy risk has become lower profile
7%
6%
3%
0%
6%
4%
Energy risk has slightly higher profile
25%
21%
30%
35%
27%
26%
Average shown
SMEs (7)
SMEs (8)
MEUs (7)
MEUs (8)
All (7)
All (8)
Supply costs
6.2
6.3
7.9
7.3
6.7
6.6
Non-commodity charges e.g. distribution costs
-
5.3
-
5.7
-
5.4
Associated CO2 emissions
4.2
4.7
6.7
6.2
5.1
5.2
Legislative compliance
5.2
5.3
7.2
6.7
5.8
5.8
Reputation
5.3
5.4
7.0
6.6
5.9
5.8
Energy sources
4.8
5.4
6.4
5.8
5.3
5.5
Security of supply
5.6
5.9
7.1
6.3
6.1
6.1
Purchasing
5.2
5.3
6.7
6.2
5.7
5.6
Changes to required volume
4.3
4.6
5.8
5.2
4.8
4.8
Credit insurance availability
4.1
4.6
4.6
4.6
4.3
4.6
Credit rating
4.7
5.1
5.1
4.8
4.8
5.0
Capital expenditure for energy saving initiatives
4.7
4.9
6.5
5.9
5.3
5.2
60 npower Business Energy Index 2011 Executive Summary 60 61 npower Business Energy Index 2011 Energy Risk 61
ENERGY RISK
Table 72: Have the risks associated with buying and using energy become more high profile within your
organisation in the last three years?
Select one
Table 73: Where do you perceive the most risk in relation to energy in your business today?
Rate from 1-10, where 10 = very high risk
Energy risk has become much higher profile 10% 14% 48% 27% 23% 18%
Source: nBEI (8)
– Nearly a third of MEUs believe energy risk has become
more high profile in their organisation over the past
three years
– For SMEs, 21% of respondents state that energy risk
has become slightly higher profile and 14% that it
has become much higher profile.
Associated costs of carbon legislation - 5.1 - 5.9 - 5.3
Source: nBEI (8)
– Increased supply costs continue to be identified as
the most important energy risk that both SME and
MEUs face.
– Security of supply is identified as the second most
important for SMEs.
– For MEUs, legislative compliance ranked as the second
highest risk.

Average shown
SMEs (7)
SMEs (8)
MEUs (7)
MEUs (8)
All (7)
All (8)
Supply costs
6.0
6.0
7.8
6.6
6.6
6.2
Non-commodity charges e.g. distribution costs
-
5.1
-
5.5
-
5.2
Associated CO2 emissions
4.3
4.8
6.9
5.9
5.2
5.1
Legislative compliance
5.0
5.2
7.2
6.1
5.7
5.5
Reputation
5.1
5.0
7.1
5.8
5.7
5.3
Energy sources
4.9
5.2
6.4
5.5
5.4
5.3
Security of supply
5.7
5.7
7.1
6.0
6.2
5.8
Purchasing
4.9
5.1
6.4
5.6
5.4
5.3
Changes to required volume
4.1
4.7
5.7
5.1
4.6
4.8
Credit insurance availability
4.0
4.4
4.5
4.7
4.1
4.5
Credit rating
4.4
4.6
4.9
4.9
4.6
4.7
Capital expenditure for energy saving initiatives
4.4
4.7
5.6
5.6
5.1
5.0
Response
SMEs (7)
SMEs (8)
MEUs (7)
MEUs (8)
All (7)
All (8)
No effect
42%
47%
33%
45%
39%
46%
Small risk
27%
24%
29%
19%
28%
23%
Medium risk
27%
22%
35%
26%
30%
23%
62 npower Business Energy Index 2011 Executive Summary 62 63 npower Business Energy Index 2011 Energy Risk 63
ENERGY RISK
Table 74: Where do you perceive the most risk in relation to energy in your business in five years?
Rate from 1-10, where 10 = very high risks
Table 75: How do you perceive your financial performance/credit rating could affect your access to essential
supplies like energy?
Select one
High risk 5% 7% 3% 10% 4% 8%
Source: nBEI (8)
– 46% of organisations feel that there will be no impact
on their energy supply due to their credit rating,
up from 39% in nBEI (7). 23% see it as a small risk,
and 23% a medium risk, down from 28% and 30%
in nBEI (7).
– Very few organisations saw their credit ratings as a
high risk (8%).
Table 76: Would you be prepared to share up-to-date accounting information with insurers and energy
suppliers in order to mitigate any potential risks?
Yes or no
Response SMEs (7)
SMEs (8)
MEUs (7)
MEUs (8)
All (7)
All (8)
Associated costs of carbon legislation - 4.9 5.7 5.7 - 5.2
Source: nBEI (8)
Yes 30% 29% 44% 41% 35% 33%
No 70% 71% 56% 59% 65% 67%
– MEUs and SMEs foresee the same risks over the next
five years as they see today.
– Supply costs and security of supply is expected to
continue to have a higher risk attached to them than
carbon emissions.
Source: nBEI (8)
– MEUs continue to be more likely to provide up to date
accounting information to manage risks (41%) when
compared to SMEs (29%).

Response
SMEs (7)
SMEs (8)
MEUs (7)
MEUs (8)
All (7)
All (8)
Energy consultants
4.2
3.9
6.3
5.3
4.9
4.4
Energy suppliers
5.0
5.3
5.2
5.4
5.1
5.3
Energy brokers
3.9
3.6
5.6
5.5
4.4
4.2
Management consultant
3.1
3.0
5.0
4.1
3.7
3.4
Peer group
4.1
3.8
5.7
5.1
4.6
4.2
Trade association
4.1
3.8
5.2
4.6
4.5
4.1
Response (7) (8) (7) (8) (7) (8)
Third party intermediaries
19%
23%
75%
67%
38%
38%
Direct with Supplier
81%
77%
25%
33%
62%
62%
SMEs SMEs MEUs MEUs All All
64 npower Business Energy Index 2011 Executive Summary 64 65 npower Business Energy Index 2011 Energy Risk 65
ENERGY RISK
Table 77: What purchasing method do you use for energy?
Select one
Table 79: From where are you most likely to seek advice on energy purchasing management?
Rate from 1-10, where 10 = most likely
SMEs SMEs MEUs MEUs All All
Source: nBEI (8)
– MEUs are more likely to use third party intermediaries
(67%) for purchasing than SMEs.
Table 78: What type of energy product do you buy?
Select one
NGOs 8.5 3.7 9.4 4.9 9.1 4.1
Source: nBEI (8)
Response (7) (8) (7) (8) (7) (8)
– Energy suppliers are the preferred source of advice for
– Specifically, for SMEs it is energy suppliers and for
Fixed price and term contract 56% 71% 57% 65% 56% 69% energy purchasing management for all businesses – a
major shift from NGOs in nBEI (7).
MEUs it is energy brokers.
Flexible purchase contract 18% 10% 29% 26% 22% 15%
Product tracked against an index
1%
2%
1%
2%
1%
2%
Capped price product
4%
4%
3%
1%
3%
3%
Tariff
22%
13%
10%
6%
18%
11%
Source: nBEI (8)
– Most SMEs (71%) and MEUs (65%) buy a fixed price
and fixed term product.
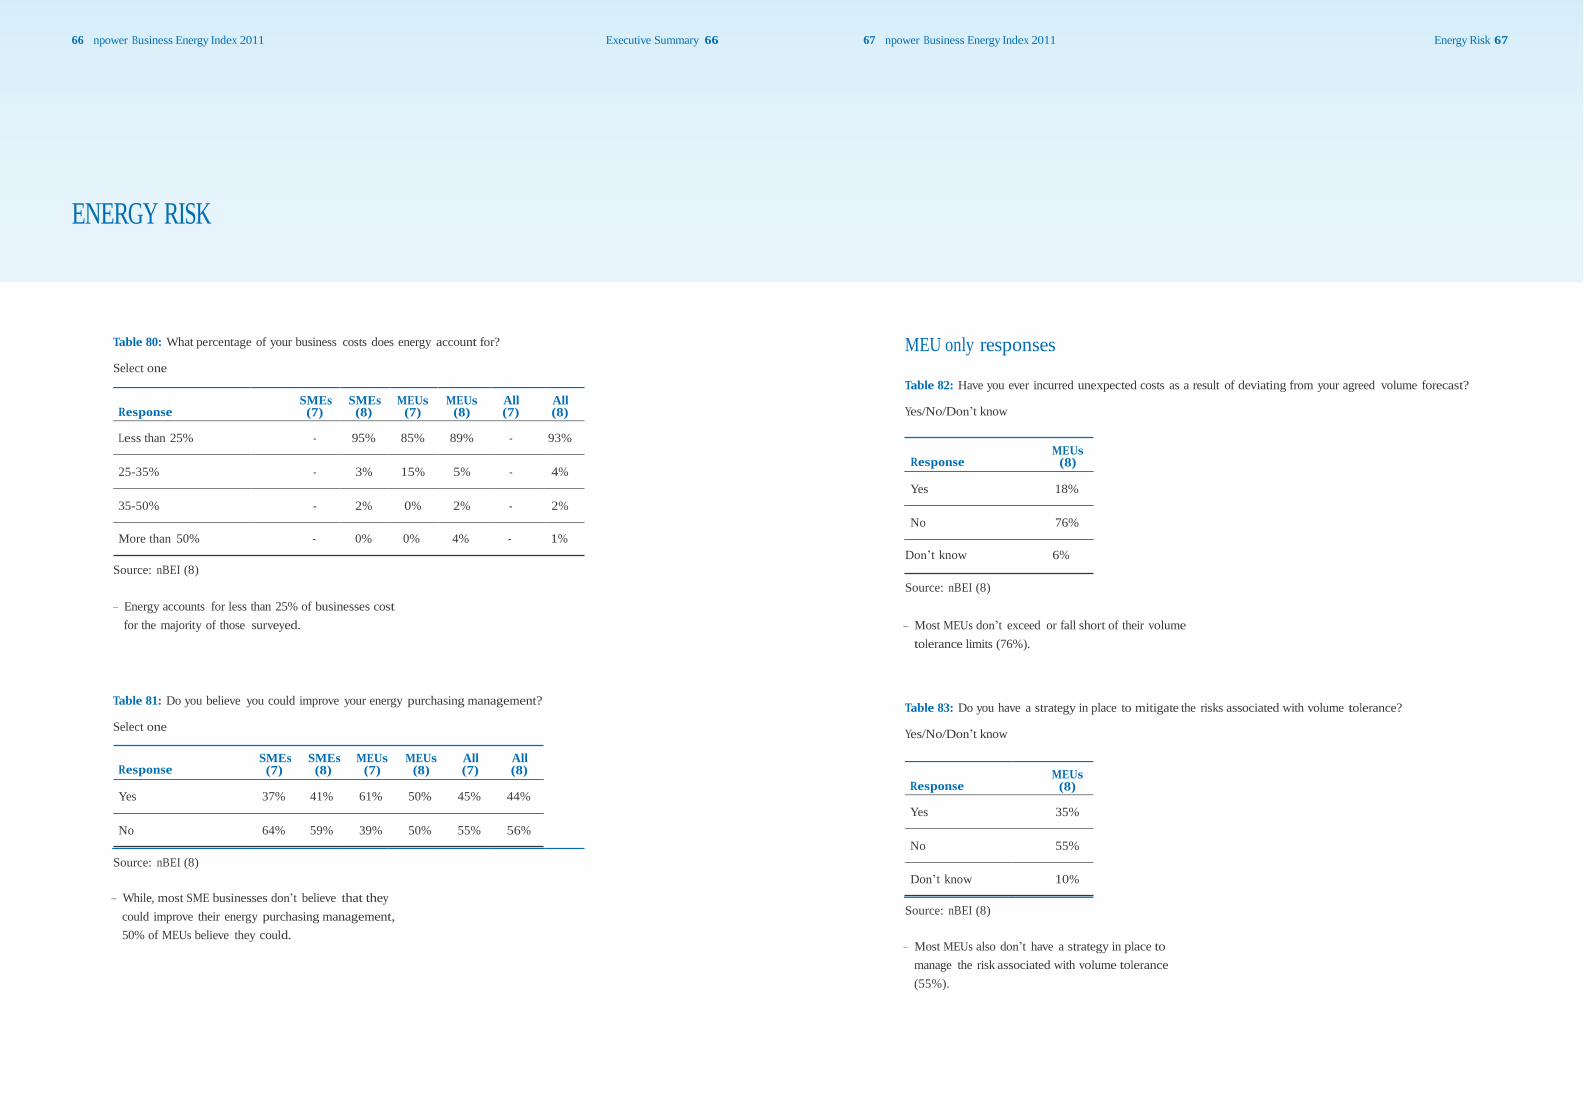
Response
MEUs (8)
Yes
35%
No
55%
Response
SMEs (7)
SMEs (8)
MEUs (7)
MEUs (8)
All (7)
All (8)
Less than 25%
-
95%
85%
89%
-
93%
25-35%
-
3%
15%
5%
-
4%
35-50%
-
2%
0%
2%
-
2%
66 npower Business Energy Index 2011 Executive Summary 66 67 npower Business Energy Index 2011 Energy Risk 67
ENERGY RISK
Table 80: What percentage of your business costs does energy account for?
Select one
MEU only responses
Table 82: Have you ever incurred unexpected costs as a result of deviating from your agreed volume forecast?
Yes/No/Don‟t know
Response MEUs
(8)
Yes 18%
More than 50% - 0% 0% 4% - 1%
Source: nBEI (8)
– Energy accounts for less than 25% of businesses cost
for the majority of those surveyed.
No 76%
Don‟t know 6%
Source: nBEI (8)
– Most MEUs don‟t exceed or fall short of their volume
tolerance limits (76%).
Table 81: Do you believe you could improve your energy purchasing management?
Select one
Table 83: Do you have a strategy in place to mitigate the risks associated with volume tolerance?
Yes/No/Don‟t know
Response
SMEs (7)
SMEs (8)
MEUs (7)
MEUs (8)
All (7)
All (8)
Yes 37% 41% 61% 50% 45% 44%
No 64% 59% 39% 50% 55% 56%
Source: nBEI (8)
– While, most SME businesses don‟t believe that they
could improve their energy purchasing management,
50% of MEUs believe they could.
Don‟t know 10%
Source: nBEI (8)
– Most MEUs also don‟t have a strategy in place to
manage the risk associated with volume tolerance
(55%).

Response Yes No
Yes No
Greater control of purchasing 73% 27%
62% 38%
Used new purchasing methods 62% 38%
60% 40%
Improved energy efficiency and management 90% 10%
85% 15%
Improved monitoring/reporting 85% 15%
81% 19%
Use of a third party intermediary 57% 43%
49% 51%
Use of a single supplier for whole energy portfolio 31% 69%
29% 71%
Use of a single supplier for supply and energy
management 34% 66%
24% 76%
Response
MEUs (7)
MEUs (8)
Yes
84%
63%
Response
MEUs (7)
MEUs (8)
Middle management
58%
53%
Senior management
31%
33%
68 npower Business Energy Index 2011 Executive Summary 68 69 npower Business Energy Index 2011 Energy Risk 69
ENERGY RISK
Table 84: Has your view of energy risks changed your management of energy in the following areas? Table 86: If yes, at what level do they sit?
Yes or no for each option
MEUs (7) MEUs (8)
Select one
Board level 11% 14%
Source: nBEI (8)
– The majority of MEUs have a specific person
responsible for energy purchasing (63%) although
this has dropped significantly since nBEI (7) .
– While the majority of these staff sit at the middle or
senior management level of their organisation, there
has been an increase in responsibility for energy
purchasing sitting at board level – up from 11% in
nBEI (7) to 14% in nBEI (8).
Source: nBEI (8)
– „Improved monitoring/reporting‟ and „Improved
energy efficiency and management‟ continue to be
the most important areas of change brought about
by energy risk for MEUs.
Table 87: Does your business have a strategy to manage energy purchasing?
Yes/No
Table 85: Do you have a person specifically responsible for energy purchasing?
Yes or no
Response
MEUs (7)
MEUs (8)
Yes 81% 49%
No 19% 51%
Source: nBEI (8)
No 16% 37%
Source: nBEI (8)

Response (7) (8)
Yes
61%
50%
No
39%
50%
70 npower Business Energy Index 2011 Executive Summary 70 71 npower Business Energy Index 2011 Energy Risk 71
ENERGY RISK
Table 88: Do you believe you could improve your energy purchasing management?
Yes/No
MEUs MEUs
Source: nBEI (8)
Table 89: In which ways do you believe you could improve your energy purchasing management?
Select all that apply
MEUs (7) MEUs (8)
Not Response Selected Selected
Not Selected Selected
Risk strategy 38% 62%
68% 32%
Variety of purchase methods 18% 82%
72% 28%
Use of market reports 31% 69%
46% 54%
Use of live prices 33% 67%
44% 56%
Use of a third party intermediary 25% 75%
68% 32%
Setting limits when market price hits a certain point 31% 69%
60% 40%
An integrated risk management and purchasing strategy - -
62% 38%
Source: nBEI (8)
– 49% of MEUs have a strategy for managing energy
purchasing and half (50%) believe it can be improved.
– Risk strategy and variety of purchase methods are the
two most important areas where MEUs believe
improvements can be made, followed by having an
integrated risk management and purchasing strategy.

72 npower Business Energy Index 2011 Executive Summary 72 73 npower Business Energy Index 2011 Executive Summary 73
CONCLUDING COMMENTARY
The eighth nBEI reflects the wide-
ranging views of businesses over
the past 12 months, through what
has been a turbulent time for the
economy in general, and the energy
sector in particular.
The report demonstrates that energy management
and the implementation of energy efficiency measures
are becoming increasingly important issues for many
businesses - with companies taking action to reduce
both costs and emissions.
However, we are still seeing a significant number of
companies – 41% - that have no measurement
mechanisms in place to assess how and where they can
improve consumption levels and reduce costs. This is
concerning, as those who have implemented energy
efficiency measures have demonstrated the benefits
they bring. Energy efficiency continues to make sound
businesses sense not only because it reduces costs and
carbon, but also due to the related reputational and
legislative benefits.
The continuation of energy risk as the number one
business risk in the eyes of many is a realisation
that energy is still more important than many of the
traditional areas of risk, such as health and safety, staff,
security, cash flow and legislation.
With both cost and security of energy supply as well as
legislative compliance dominating concerns, it seems
businesses are keeping one eye on the present i.e. the
impact of fluctuating energy costs, while at the same
time looking to the future in terms of longer term
security of energy supply, particularly given the current
global debate around the role nuclear will play.
One way that could help alleviate concern is a greater
use of self generation technologies. It is fair to say
that, to date, self generation uptake has been slow to
gather traction. The majority of businesses questioned
admitted to not having any form of self generation
in place – due in part to a lack of available finance, or
through not really fully understanding the true benefits.
MEUs keen to protect themselves from the energy risks
outlined in this year‟s nBEI, will need to seriously
consider investigating the options for self generation
and demand management if they are to shield
themselves from the energy challenges of the future.
As well as helping to manage the energy risk, there are
also the associated reputational and cost benefits of self
generation, thanks to the role it will play in managing
energy demand.
As self generation becomes an increasingly important
strategy to help mitigate energy risk, we would hope, and
expect, that future nBEIs will demonstrate more
businesses will have embraced the business benefits self
generation technology can deliver.
This index has also revealed the early impact of the
CRC. Encouragingly, it has been a catalyst for many
businesses to implement energy efficiency measures.
On the other hand, 82% said they wanted clarity of
what was required of their business and it is also clear
that many companies are deeply unhappy with the
changes to the scheme, which has seen the removal
of the financial benefits that many had planned to rely
upon to fund future energy efficiency initiatives. This
is allied to an ongoing scepticism (also seen in previous
nBEI reports) about the associated business benefits of
a low carbon economy, and whether the UK will meet its
ambitious carbon reduction targets.
The nBEI also sends out a number of clear messages
to the coalition government from the businesses
community. MEUs and SMEs are adamant that if they
are to implement energy efficiency projects, then they
need financial help from the government.
In a so-called „age of austerity‟ in Britain, and with
looming deep cuts to public services, such a request to
government may well fall on deaf ears. We will see.
In addition, for the SME community, it is clear that
communications around important energy efficiency
initiatives such as the Green Deal are not getting
through. With 85% of the target audience saying they
are unaware of the proposals, it is clear that there is still
a job for the government to do to ensure the messages
– and benefits – are hitting home.
With energy set to dominate the headlines for the rest
of 2011 and into 2012, thanks to major proposals such
as the Electricity Market Reform (EMR), the Energy
Bill and further details on the Green Deal and Green
Investment Bank, we await the findings of nBEI (9) in
2012 with keen interest.


Registered Office:
RWE Npower plc
Windmill Hill Business Park
Whitehill Way
Swindon SN5 6PB
www.npower.com
Registered in England & Wales: No. 3892782