2939600 scor model version 8
TRANSCRIPT

© Copyright 2006 Supply-Chain Council, Inc.
Supply Chain Operations Reference Model
SCOR® Version 8.0
© Supply-Chain Council, 2006. All rights reserved. The Supply-Chain Council has made every effort to assure the accuracy and usefulness of the information and metrics contained herein and is provided on an "AS IS" basis. The Supply-Chain Council makes no warranty, express or implied, of merchantability, fitness for a particular purpose, or accuracy. The Supply-Chain Council makes no representation as to the results obtained or obtainable and disclaims all liability for direct, indirect, special or consequential damage, including lost profits, lost business or the like, whether based in contract, tort (including negligence), product liability or otherwise.
®SCOR is a registered trademark in the United States and Canada.

© Copyright 2006 Supply-Chain Council, Inc.
Acknowledgements The following members (alphabetical by company) of the Supply-Chain Council Technical Development Steering Committee and Project Teams devoted extensive time and/or effort to the development of this
Model – SCOR Version 8.0.
Name Company Kevin Mansfield Air Products & Chemicals, Inc Cheryl Harrity APQC Joe Faccenda Aspentech Steve Hensley Blue Sky Logistics Bill Garrison Boeing
Jörg Nienhaus Bosch, Paul Schiller BP Chemicals Paul Tilsley BP
Sergio Vacca Bulgari Steven Vanne Caterpillar Logistics Eric Cosman The Dow Chemical Company
Russ Dickinson The Dow Chemical Company Stephen Graham The Dow Chemical Company
Ray Walker DuPont Lars Magnusson Ericsson
Charles-Eric Roussel Essilor France Alex Van Breedam Flanders Institute for Logistics
Charlie Gifford GE/Fanuc Georgeann Fears IBM Benchmarking
Chang-rui Ren IBM China Jin Dong IBM China
Luc Kremers iCognitive Rob Hagan International Paper
Jürgen Richert J&M Management Consulting AG Taylor H. Wilkerson LMI
Shruti Mandana The Performance Measurement Group Dan Swartwood Pragmatek
Monty Boyle PriceWaterhouseCoopers Gary Cokins SAS Keith Unger Stone Technologies, Inc.
Melinda Spring Supply-Chain Council Scott Stephens Supply-Chain Council
Arne Ziegenbein ETH Zurich Scott Sealing United Space Alliance John Nyere United States Department of Defense Peter Baker UTi Nancy Craft Volvo Nishioka-san Accenture

© Copyright 2006 Supply-Chain Council, Inc. June 2006
Supply Chain Operations Reference-model (SCOR) 8.0
Contents
• Introduction 1
• PLAN 12
• SOURCE 68
• MAKE 115
• DELIVER 168
• RETURN 252
• Workflow Graphics 306
• Glossary Process Terms 354 Metrics 368 Best Practices 386 Inputs and Outputs 419
• Appendices Appendix A: Metrics Background Development Information 434 Appendix B: Best Practices Background Development Information 511

© Copyright 2006 Supply-Chain Council, Inc. 1 June 2006
Supply Chain Operations Reference-model (SCOR) 8.0
Introduction
The Supply Chain Operations Reference-model (SCOR) is the product of the Supply-Chain Council (SCC), an independent, not-for-profit, global corporation with membership open to all companies and organizations interested in applying and advancing the state-of-the-art in supply-chain management systems and practices. The SCOR-model captures the Council’s consensus view of supply chain management. While much of the underlying content of the Model has been used by practitioners for many years, the SCOR-model provides a unique framework that links business process, metrics, best practices and technology features into a unified structure to support communication among supply chain partners and to improve the effectiveness of supply chain management and related supply chain improvement activities.
The SCC was organized in 1996 and initially included 69 practitioner companies meeting in an
informal consortium. Subsequently, the companies of the Council elected to form an independent not for profit trade association. The majority of the SCC’s members are practitioners and represent a broad cross-section of industries, including manufacturers, distributors, and retailers. Equally important to the Council and the advancement of the SCOR-model are the technology suppliers and implementers, the academicians, and the government organizations that participate in Council activities and the development and maintenance of the Model. At the time of this release, the Council has approximately 800 members worldwide and has established international chapters in Australia/New Zealand, Brazil, Greater China, Europe, Japan, Southeast Asia, and Southern Africa with additional requests for regional chapters pending.
The Supply-Chain Council is interested in providing the widest possible dissemination of the SCOR-model. The wide-spread use of the Model results in better customer-supplier relationships, software systems that can better support members through the use of common measurements and terms, and the ability to rapidly recognize and adopt best practice no matter where it originates. SCC requests that all who use the SCOR-model provide attribution to the Supply-Chain Council. Additionally, members are encouraged to monitor the members section of the SCC website (www.supply-chain.org) to ensure that they are using the latest version of SCOR.
This introduction is provided to assist new users of the SCOR-model to begin analytic and implementation projects. It is intended to remind experienced users of the framework and structure of the Model to assist in more complex applications and operationalizing the Model for their businesses. Finally, it is provided to orient members to the changes between Version 8.0 and Version 7.0.
Version 8.0 of the SCOR-model is the tenth revision since the Model’s introduction in 1996. Revisions of the Model are made when it is determined by Council members that changes should be made to facilitate the use of the Model in practice. Specific changes in Version 8.0 are outlined later in this Introduction.

© Copyright 2006 Supply-Chain Council, Inc. 2 June 2006
Scope
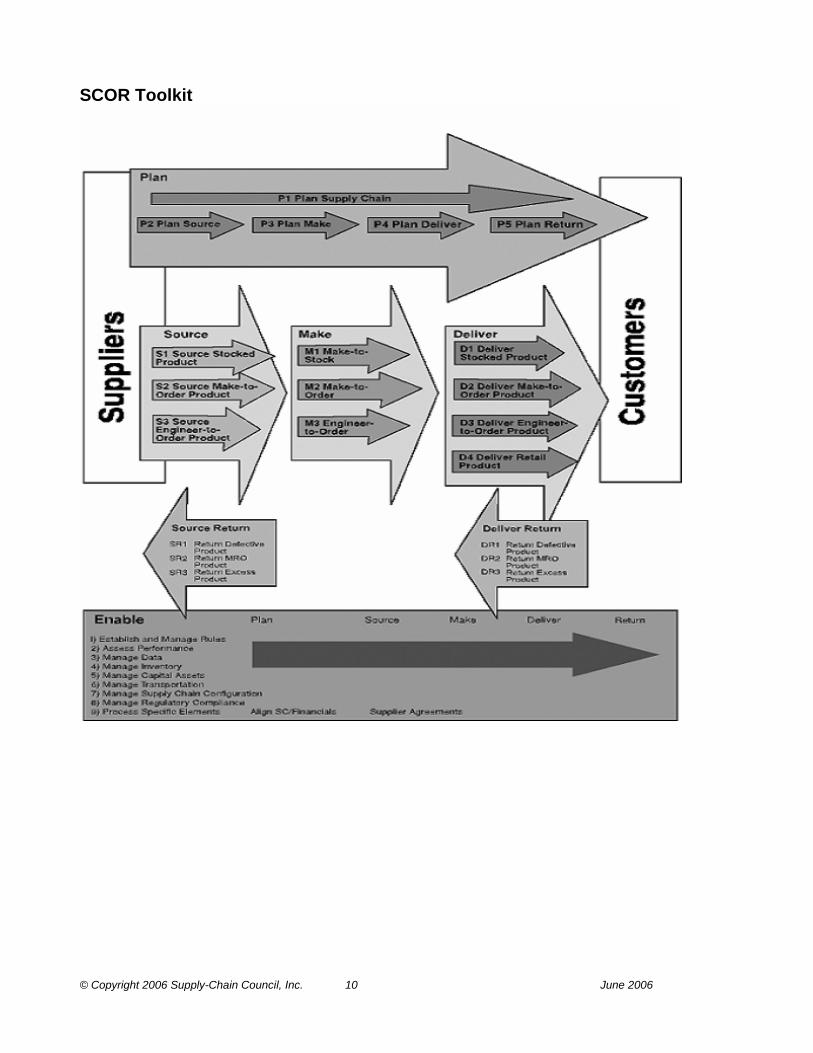
The SCOR-model has been developed to describe the business activities associated with all phases of satisfying a customer’s demand. The Model itself contains several sections and is organized around the five primary management processes of Plan, Source, Make, Deliver, and Return (shown in Figure 1). By describing supply chains using these process building blocks, the Model can be used to describe supply chains that are very simple or very complex using a common set of definitions. As a result, disparate industries can be linked to describe the depth and breadth of virtually any supply chain. The Model has been able to successfully describe and provide a basis for supply chain improvement for global projects as well as site-specific projects.
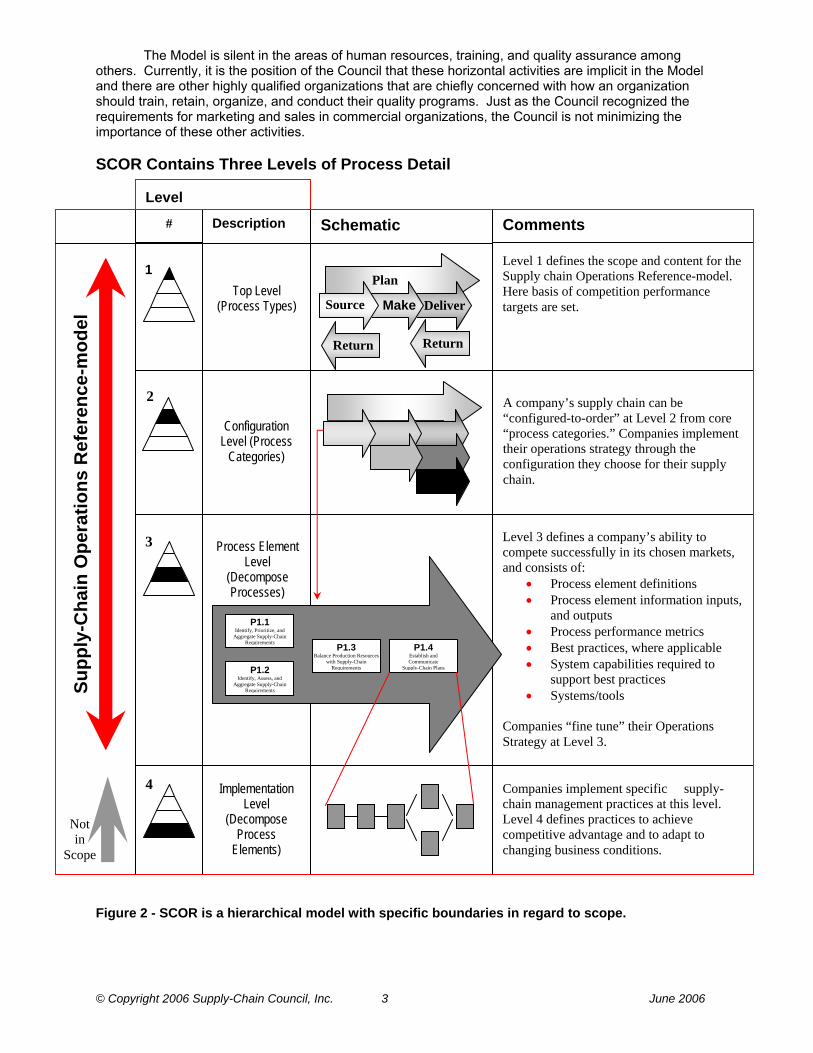
Figure 1 - SCOR is organized around five major management processes. It spans: all customer interactions (order entry through paid invoice), all physical material transactions (supplier’s supplier to customer’s customer, including equipment, supplies, spare parts, bulk product, software, etc.) and all market interactions (from the understanding of aggregate demand to the fulfillment of each order). It does not attempt to describe every business process or activity. Specifically, the Model does not address: sales and marketing (demand generation), product development, research and development, and some elements of post-delivery customer support. It should be noted that the scope of the Model has changed and is anticipated to change based on Council member requirements. With the introduction of Return, the Model has been extended into the area of post-delivery customer support (although it does not include all activities in that area). As shown in Figure 2, the Model is designed and maintained to support supply chains of various complexities and across multiple industries. The Council has focused on three process levels and does not attempt to prescribe how a particular organization should conduct its business or tailor its systems / information flow. Every organization that implements supply chain improvements using the SCOR-model will need to extend the Model, at least to Level 4, using organization-specific processes, systems, and practice.
Customer’s
Customer
Deliver
Suppliers’
Supplier
Supplier
Internal or External Your Company
Customer
Internal or External
SourceDeliverMake Deliver Make Source Source
Plan
Return ReturnSource DeliverMake
Return
Return
Plan Plan Plan Plan
Return Return Return
Return
© Copyright 2006 Supply-Chain Council, Inc. 3 June 2006
The Model is silent in the areas of human resources, training, and quality assurance among others. Currently, it is the position of the Council that these horizontal activities are implicit in the Model and there are other highly qualified organizations that are chiefly concerned with how an organization should train, retain, organize, and conduct their quality programs. Just as the Council recognized the requirements for marketing and sales in commercial organizations, the Council is not minimizing the importance of these other activities.
SCOR Contains Three Levels of Process Detail
Figure 2 - SCOR is a hierarchical model with specific boundaries in regard to scope.
Return
Level
Description Schematic Comments
Top Level
(Process Types)
Level 1 defines the scope and content for the Supply chain Operations Reference-model. Here basis of competition performance targets are set. Source Make Deliver
Plan 1
#
Configuration Level (Process
Categories)
A company’s supply chain can be “configured-to-order” at Level 2 from core “process categories.” Companies implement their operations strategy through the configuration they choose for their supply chain.
2
Process Element Level
(Decompose Processes)
Level 3 defines a company’s ability to compete successfully in its chosen markets, and consists of:
• Process element definitions • Process element information inputs,
and outputs • Process performance metrics • Best practices, where applicable • System capabilities required to
support best practices • Systems/tools
Companies “fine tune” their Operations Strategy at Level 3.
3
P1.1 Identify, Prioritize, and
Aggregate Supply-Chain Requirements
P1.2 Identify, Assess, and
Aggregate Supply-Chain Requirements
P1.3 Balance Production Resources
with Supply-Chain Requirements
P1.4 Establish and Communicate
Supply-Chain Plans
Companies implement specific supply-chain management practices at this level. Level 4 defines practices to achieve competitive advantage and to adapt to changing business conditions.
Implementation Level
(Decompose Process
Elements)
4
Not in
Scope
Supp
ly-C
hain
Ope
ratio
ns R
efer
ence
-mod
el
Return

© Copyright 2006 Supply-Chain Council, Inc. 4 June 2006
The SCOR-model is a business process reference model as illustrated in Figure 3. That is, it is a Model that links process elements, metrics, best practice and the features associated with the execution of a supply chain in a unique format. The uniqueness and power of the Model and its successful implementation is chiefly derived from using these four elements together.
It is important to note that this Model describes processes not functions. In other words, the Model focuses on the activity involved, not the person or organizational element that performs the activity.
Business Process
Reengineering Benchmarking Best Practices
Analysis Process Reference
Model
Characterize the management practices and software solutions that result in “best-in-class” performance
Quantify the operational performance of similar companies and establish internal targets based on “best-in-class” results
Capture the “as-is” state of a process and derive the desired “to-be” future state
Capture the “as-is” state of a process and derive the desired “to-be” future state
Quantify the operational performance of similar companies and establish internal targets based on “best-in-class” results
Characterize the management practices and software solutions that result in “best-in-class” performance
Figure 3 - SCOR is a business process reference model. SCOR-model Structure Besides the five basic management processes (Plan, Source, Make, Deliver, Return) that provide the organizational structure of the SCOR-model, it is useful to distinguish between the three process types in the Model: planning, execution, and enable (formerly infrastructure). A planning element is a process that aligns expected resources to meet expected demand requirements. Planning processes balance aggregated demand across a consistent planning horizon. Planning processes generally occur at regular intervals and can contribute to supply chain response time. Execution processes are triggered by planned or actual demand that changes the state of products. They include scheduling and sequencing, transforming materials and services, and moving product. Enable processes prepare, maintain, and manage information or relationships upon which planning and execution processes rely. A set of standard notation is used throughout the Model. P depicts Plan elements, S depicts Source elements, M depicts Make elements, D depicts Deliver elements, and R depicts Return elements. SR = Source Return and DR = Deliver Return. An E preceding any of the others (e.g., EP) indicates that the process element is an Enable element associated with the Planning or Execution element (in this case, EP would be an Enable Planning element). As indicated in Figure 2, the Model is hierarchical with three levels. P1.1 is a notation that indicates a third level process element. In this case, it is a Plan (P – Level 1) element that is concerned with supply chain planning (1 – Level 2) and is specific to identifying, prioritizing, and aggregating supply chain requirements (.1 – Level 3).

© Copyright 2006 Supply-Chain Council, Inc. 5 June 2006
The SCOR-model contains 8 basic sections: Introduction, Plan, Source, Make, Deliver, Return, Glossary and Appendices. For modeling purposes, Return is documented in two locations – Source and Deliver. Those Return processes that connect an organization with its supplier (i.e., the return of raw material) are documented as Source Return activities. Those processes that connect an organization with its customer (i.e. the receipt of returned finished goods) are documented as Deliver Return activities. This preserves the concept that Source connects an organization with its suppliers and Deliver connects an organization with its customers. The Plan and Execution (Source, Make, Deliver, Return) sections are the heart of the Model while the Glossary provides a listing of the standard process and metrics terms that are used within the Model. The Appendices provide detailed information on metrics and best practices.
Plan, Source, Make, Deliver, and Return sections are organized with a standard structure. At the beginning of each section, there are graphics that provide a visual representation of the process elements, their relationships to each other, and the inputs and outputs that are germane to each process element. Following the graphics are text tables that identify: 1) the standard name for the process element, 2) the notation for the process element, 3) SCC’s “standard” definition for the process element, 4) performance attributes that are associated with the process element, 5) metrics that are associated with the performance attributes, 6) best practices that are associated with the process (candidates, not necessarily an exhaustive list), and features (generally technologically related) that can contribute to heightened performance of the process. Within the Source, Make and Deliver process elements, a common internal structure has been agreed upon. The Model focuses on three environments, Make-to-Stock, Make-to-Order, and Engineer-to-Order. As a result, S1 becomes Source Make-to-Stock Product, S2 becomes Source Make-to-Order Product and S3 becomes Source Engineer-to-Order Product. This same convention is used for Make, i.e. M1 – Make-to-Stock, and Deliver, i.e. D2 – Deliver Make-to-Order Product. This convention was extended to Return in Version 5.0. R1 is the Return of Defective Product, R2 is the Return of Maintenance, Repair or Overhaul (MRO) Product, and R3 is the Return of Excess Product. Within each of the planning and execution sections and following the graphic and text descriptions, the associated Enable elements are described using the same graphic and text formats. It is important to note, that like the process elements themselves, the metrics are intended to be hierarchical. Although not explicit in the Model, Level 1 metrics, as shown in Figure 4 are typically “assigned” to P1 (Plan Supply Chain) and are decomposed (Level 2 and diagnostic metrics) to the respective planning, execution and enable elements.
© Copyright 2006 Supply-Chain Council, Inc. 6 June 2006
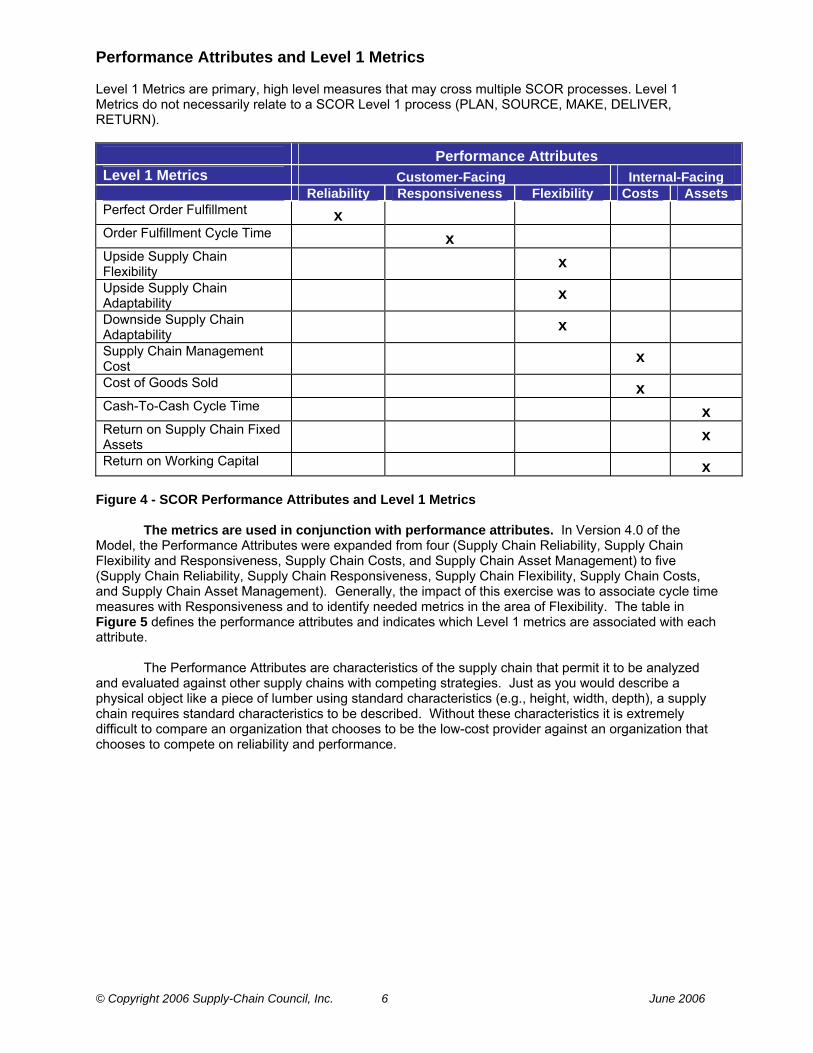
Performance Attributes and Level 1 Metrics Level 1 Metrics are primary, high level measures that may cross multiple SCOR processes. Level 1 Metrics do not necessarily relate to a SCOR Level 1 process (PLAN, SOURCE, MAKE, DELIVER, RETURN). Performance Attributes Level 1 Metrics Customer-Facing Internal-Facing Reliability Responsiveness Flexibility Costs Assets Perfect Order Fulfillment x Order Fulfillment Cycle Time x Upside Supply Chain Flexibility
x
Upside Supply Chain Adaptability
x
Downside Supply Chain Adaptability
x
Supply Chain Management Cost
x
Cost of Goods Sold x Cash-To-Cash Cycle Time x Return on Supply Chain Fixed Assets
x Return on Working Capital x
Figure 4 - SCOR Performance Attributes and Level 1 Metrics The metrics are used in conjunction with performance attributes. In Version 4.0 of the Model, the Performance Attributes were expanded from four (Supply Chain Reliability, Supply Chain Flexibility and Responsiveness, Supply Chain Costs, and Supply Chain Asset Management) to five (Supply Chain Reliability, Supply Chain Responsiveness, Supply Chain Flexibility, Supply Chain Costs, and Supply Chain Asset Management). Generally, the impact of this exercise was to associate cycle time measures with Responsiveness and to identify needed metrics in the area of Flexibility. The table in Figure 5 defines the performance attributes and indicates which Level 1 metrics are associated with each attribute. The Performance Attributes are characteristics of the supply chain that permit it to be analyzed and evaluated against other supply chains with competing strategies. Just as you would describe a physical object like a piece of lumber using standard characteristics (e.g., height, width, depth), a supply chain requires standard characteristics to be described. Without these characteristics it is extremely difficult to compare an organization that chooses to be the low-cost provider against an organization that chooses to compete on reliability and performance.

© Copyright 2006 Supply-Chain Council, Inc. 7 June 2006
Performance Attributes and Associated Level 1 Metrics Performance Attribute
Performance Attribute Definition Level 1 Metric
Supply Chain Reliability
The performance of the supply chain in delivering: the correct product, to the correct place, at the correct time, in the correct condition and packaging, in the correct quantity, with the correct documentation, to the correct customer.
Perfect Order Fulfillment
Supply Chain Responsiveness
The speed at which a supply chain provides products to the customer.
Order Fulfillment Cycle Time
Upside Supply Chain Flexibility Upside Supply Chain Adaptability
Supply Chain Flexibility
The agility of a supply chain in responding to marketplace changes to gain or maintain competitive advantage.
Downside Supply Chain Adaptability Supply Chain Management Cost Supply Chain
Costs The costs associated with operating the supply chain. Cost of Goods Sold
Cash-to-Cash Cycle Time
Return on Supply Chain Fixed Assets
Supply Chain Asset Management
The effectiveness of an organization in managing assets to support demand satisfaction. This includes the management of all assets: fixed and working capital.
Return on Working Capital Figure 5 – Definitions for SCOR Performance Attributes and which Level 1 metrics are associated with each attribute.
Associated with the Performance Attributes are the Level 1 Metrics. These Level 1 Metrics are
the calculations by which an implementing organization can measure how successful they are in achieving their desired positioning within the competitive market space. While these Performance Attributes are critical in implementing the Model, formal definitions were not previously included in the Model. In Version 4.0, standard Performance Attribute definitions were provided. In Version 5.0, the process tables associated with Level 2 and 3 activities were reconciled to reflect the separation of the flexibility and responsiveness attributes and to ensure that the metrics measured what they were intended to measure. First time users of the Model should be aware that the metrics in the Model are hierarchical – just as the process elements are hierarchical. Level 1 Metrics are created from lower level calculations. (Level 1 Metrics are primary, high level measures that may cross multiple SCOR processes. Level 1 Metrics do not necessarily relate to a SCOR Level 1 process (PLAN, SOURCE, MAKE, DELIVER, RETURN).
Lower level calculations (Level 2 metrics) are generally associated with a narrower subset of processes. For example, Delivery Performance is calculated as the total number of products delivered on time and in full based on a commit date. Additionally, even lower level metrics (diagnostics) are used to diagnose variations in performance against plan. For example, an organization may wish to examine the correlation between the request date and commit date.
© Copyright 2006 Supply-Chain Council, Inc. 8 June 2006
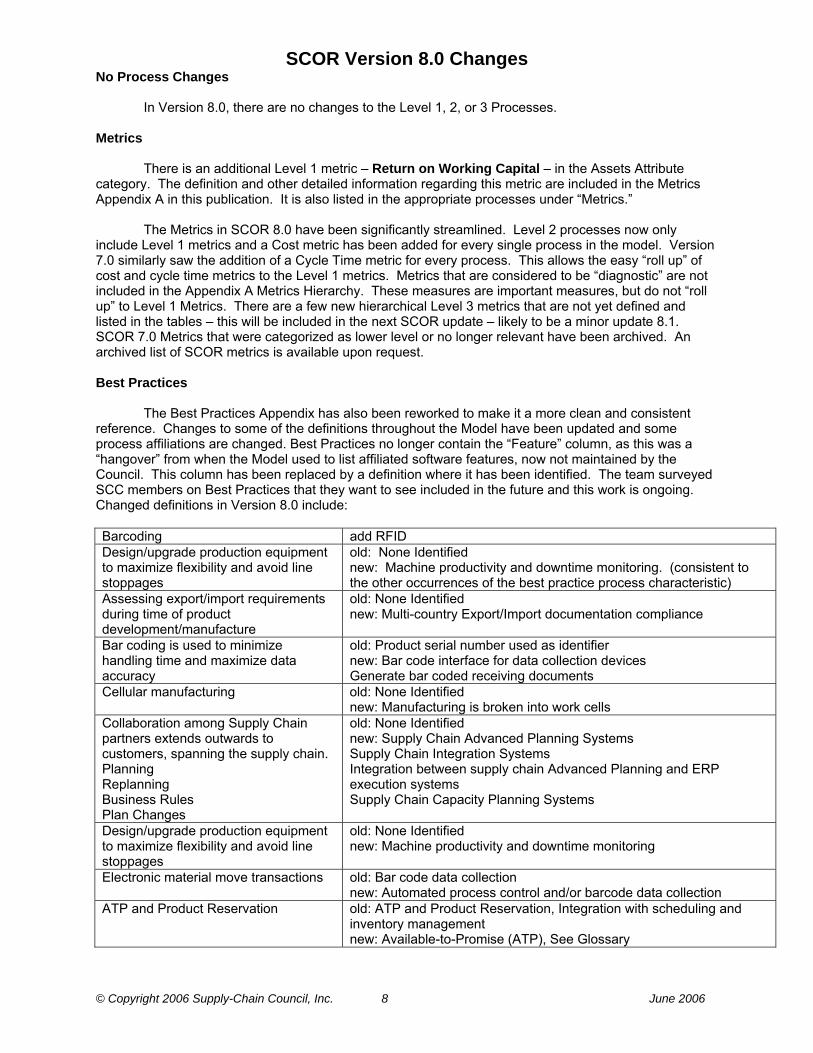
SCOR Version 8.0 Changes No Process Changes In Version 8.0, there are no changes to the Level 1, 2, or 3 Processes. Metrics There is an additional Level 1 metric – Return on Working Capital – in the Assets Attribute category. The definition and other detailed information regarding this metric are included in the Metrics Appendix A in this publication. It is also listed in the appropriate processes under “Metrics.” The Metrics in SCOR 8.0 have been significantly streamlined. Level 2 processes now only include Level 1 metrics and a Cost metric has been added for every single process in the model. Version 7.0 similarly saw the addition of a Cycle Time metric for every process. This allows the easy “roll up” of cost and cycle time metrics to the Level 1 metrics. Metrics that are considered to be “diagnostic” are not included in the Appendix A Metrics Hierarchy. These measures are important measures, but do not “roll up” to Level 1 Metrics. There are a few new hierarchical Level 3 metrics that are not yet defined and listed in the tables – this will be included in the next SCOR update – likely to be a minor update 8.1. SCOR 7.0 Metrics that were categorized as lower level or no longer relevant have been archived. An archived list of SCOR metrics is available upon request. Best Practices The Best Practices Appendix has also been reworked to make it a more clean and consistent reference. Changes to some of the definitions throughout the Model have been updated and some process affiliations are changed. Best Practices no longer contain the “Feature” column, as this was a “hangover” from when the Model used to list affiliated software features, now not maintained by the Council. This column has been replaced by a definition where it has been identified. The team surveyed SCC members on Best Practices that they want to see included in the future and this work is ongoing. Changed definitions in Version 8.0 include: Barcoding add RFID Design/upgrade production equipment to maximize flexibility and avoid line stoppages
old: None Identified new: Machine productivity and downtime monitoring. (consistent to the other occurrences of the best practice process characteristic)
Assessing export/import requirements during time of product development/manufacture
old: None Identified new: Multi-country Export/Import documentation compliance
Bar coding is used to minimize handling time and maximize data accuracy
old: Product serial number used as identifier new: Bar code interface for data collection devices Generate bar coded receiving documents
Cellular manufacturing old: None Identified new: Manufacturing is broken into work cells
Collaboration among Supply Chain partners extends outwards to customers, spanning the supply chain. Planning Replanning Business Rules Plan Changes
old: None Identified new: Supply Chain Advanced Planning Systems Supply Chain Integration Systems Integration between supply chain Advanced Planning and ERP execution systems Supply Chain Capacity Planning Systems
Design/upgrade production equipment to maximize flexibility and avoid line stoppages
old: None Identified new: Machine productivity and downtime monitoring
Electronic material move transactions old: Bar code data collection new: Automated process control and/or barcode data collection
ATP and Product Reservation old: ATP and Product Reservation, Integration with scheduling and inventory management new: Available-to-Promise (ATP), See Glossary
© Copyright 2006 Supply-Chain Council, Inc. 9 June 2006
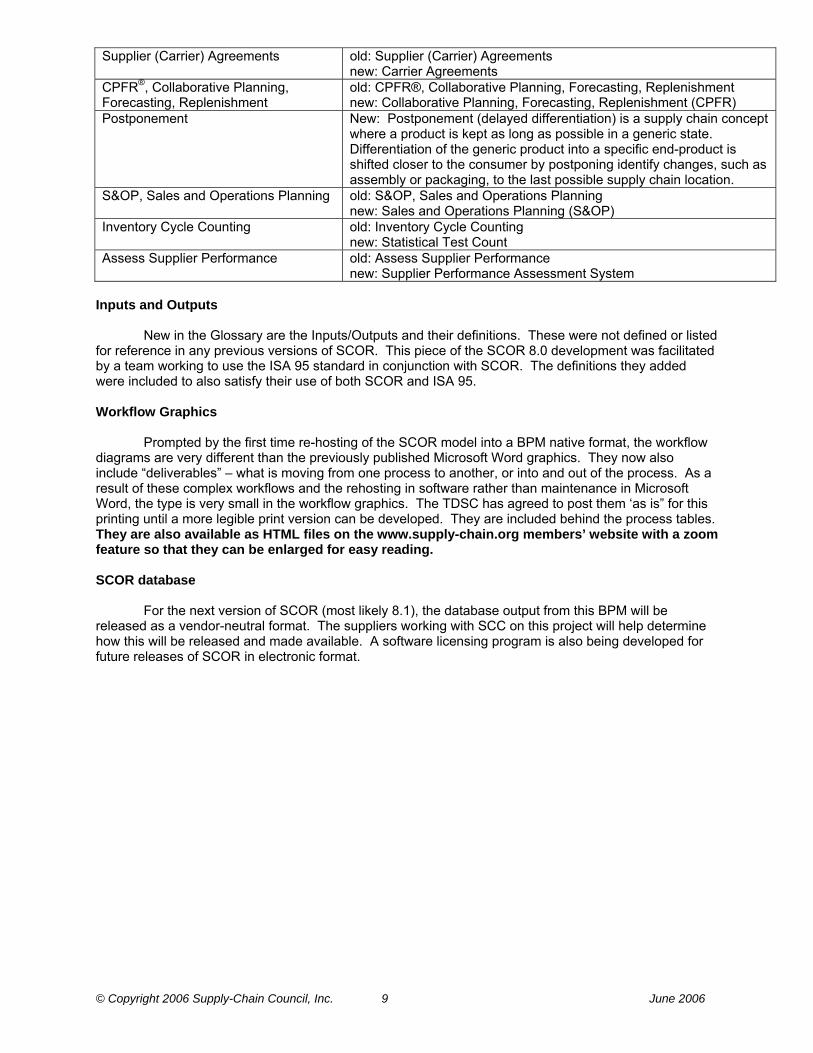
Supplier (Carrier) Agreements old: Supplier (Carrier) Agreements new: Carrier Agreements
CPFR®, Collaborative Planning, Forecasting, Replenishment
old: CPFR®, Collaborative Planning, Forecasting, Replenishment new: Collaborative Planning, Forecasting, Replenishment (CPFR)
Postponement New: Postponement (delayed differentiation) is a supply chain concept where a product is kept as long as possible in a generic state. Differentiation of the generic product into a specific end-product is shifted closer to the consumer by postponing identify changes, such as assembly or packaging, to the last possible supply chain location.
S&OP, Sales and Operations Planning old: S&OP, Sales and Operations Planning new: Sales and Operations Planning (S&OP)
Inventory Cycle Counting old: Inventory Cycle Counting new: Statistical Test Count
Assess Supplier Performance old: Assess Supplier Performance new: Supplier Performance Assessment System
Inputs and Outputs New in the Glossary are the Inputs/Outputs and their definitions. These were not defined or listed for reference in any previous versions of SCOR. This piece of the SCOR 8.0 development was facilitated by a team working to use the ISA 95 standard in conjunction with SCOR. The definitions they added were included to also satisfy their use of both SCOR and ISA 95. Workflow Graphics Prompted by the first time re-hosting of the SCOR model into a BPM native format, the workflow diagrams are very different than the previously published Microsoft Word graphics. They now also include “deliverables” – what is moving from one process to another, or into and out of the process. As a result of these complex workflows and the rehosting in software rather than maintenance in Microsoft Word, the type is very small in the workflow graphics. The TDSC has agreed to post them ‘as is” for this printing until a more legible print version can be developed. They are included behind the process tables. They are also available as HTML files on the www.supply-chain.org members’ website with a zoom feature so that they can be enlarged for easy reading. SCOR database For the next version of SCOR (most likely 8.1), the database output from this BPM will be released as a vendor-neutral format. The suppliers working with SCC on this project will help determine how this will be released and made available. A software licensing program is also being developed for future releases of SCOR in electronic format.
© Copyright 2006 Supply-Chain Council, Inc. 10 June 2006
SCOR Toolkit

© Copyright 2006 Supply-Chain Council, Inc. 11 June 2006
The Technical Change Process The SCOR-model is developed and maintained by the voluntary efforts of the Supply Chain Council members. Unlike other organizations with large technical staffs, the Council depends on the contributions of its members to actively advance the state of knowledge in supply chain by identifying required Model changes, researching and validating those changes, and developing the consensus regarding the proposed changes. SCOR-model versions prior to Version 6.0 were developed in a Committee structure that was focused on developing a stable, usable Model that could be used by experienced Council members as well as organizations newly introduced to the SCOR concept. In 2002, confident that the Model’s stability had been demonstrated with over 5 years of application experience by Council members, the Supply Chain Council shifted its technical development focus to specific implementation issues. The current technical development process relies on project teams composed of volunteers from Supply Chain Council member organizations. These project teams are short-lived groups that focus on specific Model challenges. It is expected that the normal term of a project team will be between 3-6 months. The change process and the coordination of the project team activities is led by the Technical Development Steering Committee (TDSC), a standing body elected by their peers in the Council. Changes to the Model are normally initiated by a Council member or members (but may be initiated by a Special Industry Group, an implementation project team, or the Chief Technical Officer). The primary mechanism for changing the Model is the Project Team. These self-organizing and self-directed teams propose areas of investigation, pursue and develop proposals for Model development and publish research results on the Council website. These activities are coordinated by the Supply Chain Council’s Technical Development Steering Committee, which is comprised of elected representatives from the Council’s membership.
The Model change process is documented on the SCC’s website. Essentially, the process consists of: 1) The Council issues a call for volunteers to work on an identified need for revision or change, 2) volunteers submit a Charter Proposal to the TDSC outlining the concept, scope of work, schedules and milestones, and identifying the volunteer resources, 3) the TDSC reviews the proposed Charter and provides feedback on the proposed changes to the initiating group, 4) upon approval, the Project Team crafts the details of their scope of work and determines whether it is likely their efforts will lead to a Model change (which generally includes the modification of SCOR processes, metrics, best practice, features and inputs and outputs) or a research report (white paper), 5) the Project Team proposes how to integrate proposed changes into the overall Model, 6) after final technical review the TDSC forwards the technical community recommendations for proposed changes/additions to the SCC Board of Directors, and 7) following the approval of the Board, the new Model is published for the SCC membership.

© Copyright 2006 Supply-Chain Council, Inc. 12 June 2006
P1 Plan Supply Chain The development and establishment of courses of action over specified time periods that represent a projected appropriation of supply chain resources to meet supply chain requirements for the longest time fence constraints of supply resources. The Category P1 includes four Level 3 Elements: P1.1 Identify, Prioritize, and Aggregate Supply Chain Requirements
The process of identifying, aggregating, and prioritizing, all sources of demand for the integrated supply chain of a product or service at the appropriate level, horizon and interval. The sales forecast is comprised of the following concepts: sales forecasting level, time horizon, and time interval. The sales forecasting level is the focal point in the corporate hierarchy where the forecast is needed at the most generic level. i.e. Corporate forecast, Divisional forecast, Product Line forecast, SKU, SKU by Location. The sales forecasting time horizon generally coincides with the time frame of the plan for which it was developed i.e. Annual, 1-5 years, 1- 6 months, Daily, Weekly, Monthly. The sales forecasting time interval generally coincides with how often the plan is updated, i.e. Daily, Weekly, Monthly, and Quarterly.
P1.2 Identify, Assess, and Aggregate Supply Chain Resources
The process of identifying, prioritizing, and aggregating, as a whole with constituent parts, all sources of supply that are required and add value in the supply chain of a product or service at the appropriate level, horizon and interval.
P1.3 Balance Supply Chain Resources with Supply Chain Requirements
The process of identifying and measuring the gaps and imbalances between demand and resources in order to determine how to best resolve the variances through marketing, pricing, packaging, warehousing, outsource plans or some other action that will optimize service, flexibility, costs, assets, (or other supply chain inconsistencies) in an iterative and collaborative environment. The process of developing a time-phased course of action that commits supply-chain resources to meet supply-chain requirements.
P1.4 Establish Supply Chain Plans The establishment and communication of courses of action over the appropriate time-defined (long-term, annual, monthly, weekly) planning horizon and interval, representing a projected appropriation of supply-chain resources to meet supply-chain requirements.
Metrics (see Appendix A for metrics attributes): Cash-To-Cash Cycle Time [Inventory Days of Supply + Days Sales Outstanding - Days Payable
Outstanding] The time it takes for an investment made to flow back into a company after it has been spent for raw materials. For services, this represents the time from the point where a company pays for the resources consumed in the performance of a service to the time that the company received payment from the customer for those services.
Cost to Plan Supply Chain The sum of the costs associated with planning supply chain activities. Order Fulfillment Cycle Time The average actual cycle time consistently achieved to fulfill customer
orders. Plan Cycle Time The average time associated with planning source activities Return on Supply Chain Fixed Assets Return on Supply Chain Fixed Assets measures the return an organization
receives on its invested capital in supply chain fixed assets. This includes the fixed assets used in Plan, Source, Make, Deliver, and Return. The levels of aggregation can be at any element associated with a supply chain asset.

© Copyright 2006 Supply-Chain Council, Inc. 13 June 2006
Return on Working Capital Return on working capital is a measurement which assesses the magnitude of investment relative to a company’s working capital position verses the revenue generated from a supply chain. Components include accounts receivable, accounts payable, inventory, supply chain revenue, cost of goods sold and supply chain management costs.
Best Practices: All Functions and Organizations Understand Their Impact on Supply/Demand Balancing, Including Sales, Marketing, Product Management, Manufacturing, Customer, Suppliers, Materials Management, and Product Development
None identified
Capability to Run “Simulated“ Full-Stream Supply/Demand Balancing for “What-If“ Scenarios
Supply chain modeling and visualization system
Change in the Demand Signal Instantaneously “Reconfigures“ the Production and Supply Plans
Event-driven supply chain re-planning
Collaborative Planning, Forecasting, Replenishment (CPFR)
Collaborative Planning, Forecasting and Replenishment is a concept that allows collaborative processes across the supply chain, using a set of process and technology models.... (From www.cpfr.org/intro.html)
On-Line Visibility of All Supply-Chain Demand Requirements and Resources, both Currently Available and Committed (Pegged)
Enterprise resource planning system Customer relationship management system
Re-Balancing of Full-Stream Supply/Demand on a Daily Basis, Including Source-Make-Deliver Resources and Requirements from “Customers’ Customer to Suppliers’ Supplier“
Enterprise-wide planning system customer Relationship Systems
Responsiveness and Flexibility Are Emphasized By Developing Expertise in Making Business Processes Re-Programmable, Re-Configurable and Continuously Changeable
Integrated process modeling and software reconfiguration tools
Sales and Operations Planning (S&OP) A process to develop tactical plans that provide management the ability to strategically direct its businesses to achieve competitive advantage on a continuous basis by integrating customer-focused marketing plans for new and existing products with the management of the supply chain. The process brings together all the plans for the business (sales, marketing, development, manufacturing, sourcing, and financial) into one integrated set of plans. It is performed at least once a month and is reviewed by management at an aggregate (product family) level. The process must reconcile all supply, demand, and new-product plans at both the detail and aggregate levels and tie to the business plan. It is the definitive statement of the company’s plans for the near to intermediate term, covering a horizon sufficient to plan for resources and to support the annual business planning process. Executed properly, the sales and operation planning process links the strategic plans for the business with its execution and reviews performance measurements for continuous improvement. (From APICS online dictionary.)
Supply Chain is Designed to Have Supply Flexibility Equal to Demand Volatility
None identified
Supply/Demand Process is Highly Integrated from Customer Data Gathering to Order Receipt, through Production to Supplier Request
Integrated supply chain planning system with interfaces to all supply/demand data sources through public and private digitally enabled supply networks.
Tools Support Balanced Decision Making (e.g., Trade-Off between Service Level and Inventory Investment)
Supply chain planning optimization system
© Copyright 2006 Supply-Chain Council, Inc. 14 June 2006
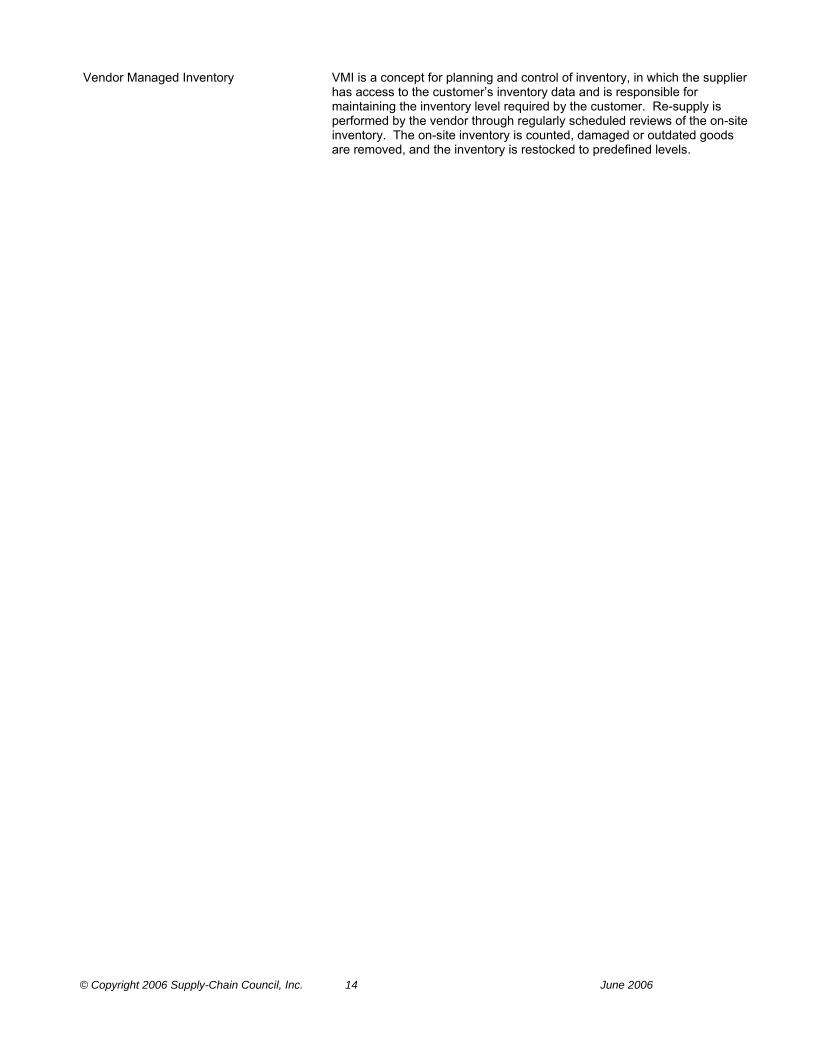
Vendor Managed Inventory VMI is a concept for planning and control of inventory, in which the supplier has access to the customer’s inventory data and is responsible for maintaining the inventory level required by the customer. Re-supply is performed by the vendor through regularly scheduled reviews of the on-site inventory. The on-site inventory is counted, damaged or outdated goods are removed, and the inventory is restocked to predefined levels.

© Copyright 2006 Supply-Chain Council, Inc. 15 June 2006
P1.1 Identify, Prioritize, and Aggregate Supply Chain Requirements The process of identifying, aggregating, and prioritizing, all sources of demand for the integrated supply chain of a product or service at the appropriate level, horizon and interval. The sales forecast is comprised of the following concepts: sales forecasting level, time horizon, and time interval. The sales forecasting level is the focal point in the corporate hierarchy where the forecast is needed at the most generic level. i.e. Corporate forecast, Divisional forecast, Product Line forecast, SKU, SKU by Location. The sales forecasting time horizon generally coincides with the time frame of the plan for which it was developed i.e. Annual, 1-5 years, 1- 6 months, Daily, Weekly, Monthly. The sales forecasting time interval generally coincides with how often the plan is updated, i.e. Daily, Weekly, Monthly, and Quarterly. Metrics (see Appendix A for metrics attributes): Cost to Identify, Prioritize, and Aggregate Supply Chain Requirements
The sum of the costs associated with identifying, assessing and aggregating supply chain requirements.
Forecast Accuracy
Forecast accuracy is calculated for products and/or families for markets/distribution channels, in unit measurement. Common calculation is Forecast Sum - Sum of Variance/Sum of Actuals to determine percentage error. *monitoring the delta of Forecast Accuracy over measured time periods can determine success rates.
Identify, Prioritize, and Aggregate Supply Chain Requirements Cycle Time
The average time associated with the identifying, prioritizing, and aggregating supply chain requirements
Best Practices: Collaboration among Operations Strategy Team
Supply Chain Advanced Planning Systems Supply Chain Integration Systems Integration between supply chain advanced planning and ERP execution systems Supply Chain Capacity Planning Systems
Digital Links (XML Based, EDI. Etc.) Among Supply Chain Members
Real-time exchange of supply chain information between supply chain members collaborative planning systems, Internet Trading Exchanges, B2B Integration and Application Server Systems
Joint Service Agreements (JSA) Collaborative Planning Systems Push-Based Forecasts Are Replaced with Customer Replenishment “Pull-Based“ Signals
Standards Based (RosettaNet, eBXML, OAGI, etc) B2B integration tools and systems
Supply Chain Advance Planning System Collaboration among Supply Chain partners extends outwards to customers, spanning the supply chain. Planning Re-planning Business Rules Plan Changes
Systems Support Accurate On-Line Visibility of Full-Stream Demand Requirements and Priorities
Advance Planning and Scheduling System Supply Chain Event Management Software
Inputs: Customer Requirements from Source: Customer
The part of the supply chain requirements related to the customer’s needs, including sales forecasts and actual orders and backorders
Order Backlog from D1.3 Reserve Inventory & Determine Delivery Date
Orders that have been received and entered into the order processing system and are in a queue waiting to be processed and shipped.
Order Backlog from D1.11 Load Vehicle & Generate Shipping Documentation
Orders that have been received and entered into the order processing system and are in a queue waiting to be processed and shipped.

© Copyright 2006 Supply-Chain Council, Inc. 16 June 2006
Planning Data from EP.3 Manage PLAN Data Collection
Execution information necessary to plan the balance of supply chain resources to demand requirements at both the highest aggregate and lowest SKU planning levels.
Revised Aggregate Forecast and Projections from EP.9 Align Supply Chain Unit Plan with Financial Plan
An update to the aggregate Supply-Chain Forecasts of Demand by Product Family supporting the Market/Channel Plans. Corresponding Projections, supporting Make, Source, Deliver, Inventory and Response Time Plans through the Supply-Chain are produced from these Forecasts Together, they represent balanced Supply and Demand.
Revised Business Assumptions from EP.5 Manage Integrated Supply Chain Capital Assets
An update to the expected cause and effect statements that are the base for the Revised Aggregate Forecast and Projections. These are reviewed periodically with actual results to verify the linkage of actual cause and effect.
Revised Business Assumptions from EP.9 Align Supply Chain Unit Plan with Financial Plan
An update to the expected cause and effect statements that are the base for the Revised Aggregate Forecast and Projections. These are reviewed periodically with actual results to verify the linkage of actual cause and effect.
Shipments from D1.11 Load Vehicle & Generate Shipping Documentation
Transactions related to sending the product to the customer.
Shipments from D1.3 Reserve Inventory & Determine Delivery Date
Transactions related to sending the product to the customer.
Outputs: Supply Chain Requirements to P1.3 Balance Supply Chain Resources with Supply Chain Requirements
Sources of demand for the integrated supply chain of a product or service at the appropriate level, horizon and interval.

© Copyright 2006 Supply-Chain Council, Inc. 17 June 2006
P1.2 Identify, Assess, and Aggregate Supply Chain Resources The process of identifying, prioritizing, and aggregating, as a whole with constituent parts, all sources of supply that are required and add value in the supply chain of a product or service at the appropriate level, horizon and interval. Metrics (see Appendix A for metrics attributes): Cost to Identify, Assess, and Aggregate Supply Chain Resources
The sum of the costs associated with identifying, assessing and aggregating supply chain resources.
Identify, Assess, and Aggregate Supply Chain Resources Cycle Time
The average time associated with the identifying, assessing, and aggregating supply chain resource availability
Inventory Days of Supply Five point annual average of the sum of all gross inventories (raw materials & WIP, plant FG, field FG, field samples, other) ÷ (COGS ÷ 365). Total gross value of inventory at standard cost before reserves for excess and obsolescence. Only includes inventory on company books, future liabilities should not be included
Best Practices: Digital Links (XML Based, EDI. Etc.) Among Supply Chain Members
Real-time exchange of supply chain information between supply chain members collaborative planning systems, Internet Trading Exchanges, B2B Integration and Application Server Systems
Joint Service Agreements (JSA) Collaborative Planning Systems Lead Times Updated Monthly None identified Review Product Profitability ABC and cost modeling. Inputs: Delivery Plans from P4.4 Establish Delivery Plans
A plan for a course of action over specified time periods that involves a projected appropriation of supply resources to meet delivery requirements.
Inventory from Source: Customer In business management, inventory consists of a list of goods and materials held available in stock. Also, those stocks or items used to support production (raw materials and work-in-process items), supporting activities (maintenance, repair, and operating supplies), and customer service (finished goods and spare parts)
Make/Buy Decision from EP.5 Manage Integrated Supply Chain Capital Assets
The output of the process used to determine whether a demand will be supplied with internal capacity or purchased through contract manufacturing and/or contracted services externally.
Outsource Plan from EP.5 Manage Integrated Supply Chain Capital Assets
A plan that describes how a company will utilize third party business partners to provide products and services which the company chooses not to provide with internal capacity. Outsource Plans can vary in detail from simple policy statements to highly detailed plans with specifics about the third party business partners, specifications for products and services, performance expectations, and contract considerations.
Outsource Plan from EP.6 Manage Integrated Supply Chain Transportation
A plan that describes how a company will utilize third party business partners to provide products and services which the company chooses not to provide with internal capacity. Outsource Plans can vary in detail from simple policy statements to highly detailed plans with specifics about the third party business partners, specifications for products and services, performance expectations, and contract considerations.
Planning Data from EP.3 Manage PLAN Data Collection
Execution information necessary to plan the balance of supply chain resources to demand requirements at both the highest aggregate and lowest SKU planning levels.
Production Plans from P3.4 Establish Production Plans
A master production plan used to allocate capacity among manufacturing resources and schedule finite manufacturing activities or executing the performance of a service. Production Plan includes production capability.

© Copyright 2006 Supply-Chain Council, Inc. 18 June 2006
Regulatory Requirements from EP.8 Manage PLAN Regulatory Requirements and Compliance
Requirements dictated by process standards set by external entities (i.e. government, trade officials, etc.).
Revised Capital Plan from EP.6 Manage Integrated Supply Chain Transportation
A revision to plan for capital expenditures necessitated by either changes in specific business plans or factors and assumptions affecting a business plan.
Revised Capital Plan from EP.5 Manage Integrated Supply Chain Capital Assets
A revision to plan for capital expenditures necessitated by either changes in specific business plans or factors and assumptions affecting a business plan.
Sourcing Plans from P2.4 Establish Sourcing Plans
An aggregate material requirements plan used to schedule material deliveries to meet production plan.
Outputs: Supply Chain Resources to P1.3 Balance Supply Chain Resources with Supply Chain Requirements
As a whole with constituent parts, all sources of supply that are required to add value in the supply chain of a product or service at the appropriate level, horizon and interval.

© Copyright 2006 Supply-Chain Council, Inc. 19 June 2006
P1.3 Balance Supply Chain Resources with Supply Chain Requirements The process of identifying and measuring the gaps and imbalances between demand and resources in order to determine how to best resolve the variances through marketing, pricing, packaging, warehousing, outsource plans or some other action that will optimize service, flexibility, costs, assets, (or other supply chain inconsistencies) in an iterative and collaborative environment. The process of developing a time-phased course of action that commits supply-chain resources to meet supply-chain requirements. Metrics (see Appendix A for metrics attributes): Balance Supply Chain Resources with Supply Chain Requirements Cycle Time
The average time associated with balancing supply chain resources with supply chain requirements.
Cost to Balance Supply Chain Resources with Supply Chain Requirements
The sum of the costs associated with balance of supply chain resources with supply chain requirements.
Fill Rate The percentage of ship-from-stock orders shipped within 24 hours of order receipt. For services, this metric is the proportion for services that are filled so that the service is completed within 24 hours
Inventory Days of Supply Five point annual average of the sum of all gross inventories (raw materials & WIP, plant FG, field FG, field samples, other) ÷ (COGS ÷ 365). Total gross value of inventory at standard cost before reserves for excess and obsolescence. Only includes inventory on company books, future liabilities should not be included
Best Practices: Business Intelligence (BI) A data warehouse / data mart is the source of all planning (master) data,
business rules and transaction data. Analytical tools enable the ongoing maintenance and improvement of the business rules based on actual data.
Customer Relationship Management (CRM) Software that provides customer input and keeps the customer informed about the planning of the production and delivery process by managing all contacts and communication with the customer thorough all channels including internet and traditional sales and customer service channels.
Demand Planning, Demand Flow Leadership
Software that provides multiple data models including the business rules and metrics for the entire supply chain planning process. Algorithms use the business rules and metrics as the drivers for the planning engine.
Inputs: Supply Chain Resources from P1.2 Identify, Assess, and Aggregate Supply Chain Resources
As a whole with constituent parts, all sources of supply that are required to add value in the supply chain of a product or service at the appropriate level, horizon and interval.
Supply Chain Requirements from P1.1 Identify, Prioritize, and Aggregate Supply Chain Requirements
Sources of demand for the integrated supply chain of a product or service at the appropriate level, horizon and interval.
Inventory Strategy from EP.4 Manage Integrated Supply Chain Inventory
The total supply chain inventory strategy. Contains the plan for total inventory limits or levels (including Raw Material, Work In Process, Finished and Purchased Finished Goods) including replenishment models, ownership, product mix, and stocking locations, both inter and intra company.
Planning Decision Policies from EP.1 Manage Business Rules for PLAN Processes
Any company policies that affect how a planning process is defined, approved, and performed.
Supply Chain Performance Improvement Plan from EP.2 Manage Performance of Supply Chain
A plan that describes goals and objectives for a supply chain and the steps that will be taken to reach those goals and objectives from the current performance levels.
Outputs: Workflow to P1.4 Establish Supply Chain Plans

© Copyright 2006 Supply-Chain Council, Inc. 20 June 2006
P1.4 Establish Supply Chain Plans The establishment and communication of courses of action over the appropriate time-defined (long-term, annual, monthly, weekly) planning horizon and interval, representing a projected appropriation of supply-chain resources to meet supply-chain requirements. Metrics (see Appendix A for metrics attributes): Cost to Establish and Communicate Supply Chain Plans
The sum of the costs associated with establishing and communicating supply chain plans.
Establish Supply Chain Plans Cycle Time The average time associated with establishing and communicating supply chain plans
Inventory Days of Supply Five point annual average of the sum of all gross inventories (raw materials & WIP, plant FG, field FG, field samples, other) ÷ (COGS ÷ 365). Total gross value of inventory at standard cost before reserves for excess and obsolescence. Only includes inventory on company books, future liabilities should not be included
Best Practices: Collaboration among Operations Strategy Team
Supply Chain Advanced Planning Systems Supply Chain Integration Systems Integration between supply chain advanced planning and ERP execution systems Supply Chain Capacity Planning Systems
Digital Links (XML Based, EDI. Etc.) Among Supply Chain Members
Real-time exchange of supply chain information between supply chain members collaborative planning systems, Internet Trading Exchanges, B2B Integration and Application Server Systems
Joint Service Agreements (JSA) Collaborative Planning Systems Supply Chain Advance Planning System Collaboration among Supply Chain partners extends outwards to
customers, spanning the supply chain. Planning Replanning Business Rules Plan Changes
Systems Support Accurate On-Line Visibility of Full-Stream Demand Requirements and Priorities as Well as Resource Utilization and Availability
Advance Planning and Scheduling System
Inputs: Workflow from P1.3 Balance Supply Chain Resources with Supply Chain Requirements Outputs: Supply Chain Plans to P5.1 Assess, and Aggregate Return Requirements
Courses of action over specified time periods that represent a projected appropriation of total supply-chain resources to meet total supply-chain demand requirements.
Supply Chain Plans to P4.1 Identify, Prioritize, and Aggregate Delivery Requirements
Courses of action over specified time periods that represent a projected appropriation of total supply-chain resources to meet total supply-chain demand requirements.
Supply Chain Plans to Customer Courses of action over specified time periods that represent a projected appropriation of total supply-chain resources to meet total supply-chain demand requirements.
Supply Chain Plans to P2.1 Identify, Prioritize, and Aggregate Product Requirements
Courses of action over specified time periods that represent a projected appropriation of total supply-chain resources to meet total supply-chain demand requirements.

© Copyright 2006 Supply-Chain Council, Inc. 21 June 2006
Supply Chain Plans to P3.1 Identify, Prioritize, and Aggregate Production Requirements
Courses of action over specified time periods that represent a projected appropriation of total supply-chain resources to meet total supply-chain demand requirements.

© Copyright 2006 Supply-Chain Council, Inc. 22 June 2006
P2 Plan Source The development and establishment of courses of action over specified time periods that represent a projected appropriation of material resources to meet supply chain requirements. The Category P2 includes four Level 3 Elements: P2.1 Identify, Prioritize, and Aggregate Product Requirements
The process of identifying, prioritizing, and considering, as a whole with constituent parts, all sources of demand for a product or service in the supply chain.
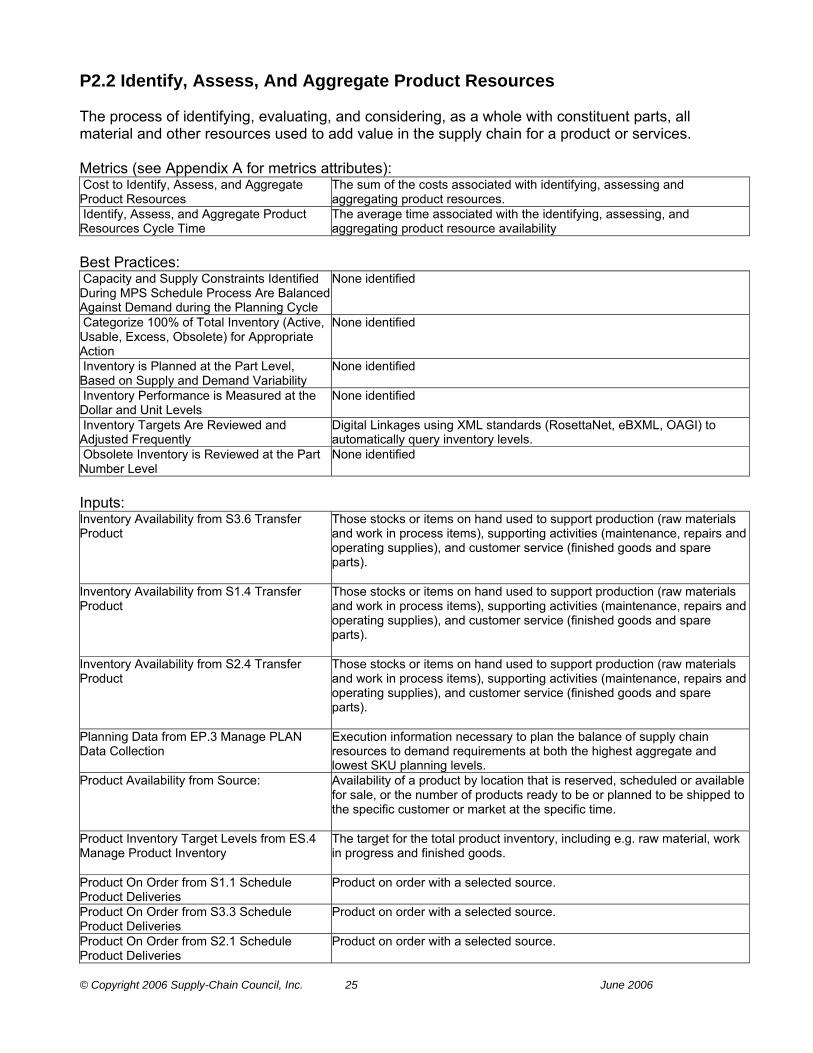
P2.2 Identify, Assess, And Aggregate Product Resources
The process of identifying, evaluating, and considering, as a whole with constituent parts, all material and other resources used to add value in the supply chain for a product or services.
P2.3 Balance Product Resources with Product Requirements
The process of developing a time-phased course of action that commits resources to meet requirements.
P2.4 Establish Sourcing Plans The establishment of courses of action over specified time periods that represent a projected appropriation of supply resources to meet sourcing plan requirements.
Metrics (see Appendix A for metrics attributes): Cash-To-Cash Cycle Time [Inventory Days of Supply + Days Sales Outstanding - Days Payable
Outstanding] The time it takes for an investment made to flow back into a company after it has been spent for raw materials. For services, this represents the time from the point where a company pays for the resources consumed in the performance of a service to the time that the company received payment from the customer for those services.
Cost to Plan Source The sum of the costs associated with planning source activities. Order Fulfillment Cycle Time The average actual cycle time consistently achieved to fulfill customer
orders. Plan Source Cycle Time The average time associated with planning source activities Return on Supply Chain Fixed Assets Return on Supply Chain Fixed Assets measures the return an
organization receives on its invested capital in supply chain fixed assets. This includes the fixed assets used in Plan, Source, Make, Deliver, and Return. The levels of aggregation can be at any element associated with a supply chain asset.
Return on Working Capital Return on working capital is a measurement which assesses the magnitude of investment relative to a company’s working capital position verses the revenue generated from a supply chain. Components include accounts receivable, accounts payable, inventory, supply chain revenue, cost of goods sold and supply chain management costs.
Best Practices: All Key Participants in the Supply Chain, Including Strategic Partners, Have Full Visibility of the Demand/Supply Plan
Supply Chain Event Management Systems
Distinct and Consistent Linkages Exist to Ensure Disruptions and Opportunities in Material Resources Are Quickly and Accurately Communicated and Acted Upon
Bi-directional Digital Links (XML, EDI, etc) or Internet procurement networks to customer service linkage
EDI Links Integrate Supplier Resource Information (Inventory, Capacity Availability, Etc.) with Own Resources
Inter-company resource planning with EDI/Internet communication
Joint Service Agreements with Suppliers Define the Levels of “Flexibility“ or Resource Upside Available Within Stated Lead Times and Agreed Upon Conditions
None identified

© Copyright 2006 Supply-Chain Council, Inc. 23 June 2006
P2.1 Identify, Prioritize, and Aggregate Product Requirements The process of identifying, prioritizing, and considering, as a whole with constituent parts, all sources of demand for a product or service in the supply chain. Metrics (see Appendix A for metrics attributes): Cost to Identify, Prioritize, and Aggregate Product Requirements
The sum of the costs associated with identifying, assessing and aggregating deliver requirements.
Forecast Accuracy Forecast accuracy is calculated for products and/or families for markets/distribution channels, in unit measurement. Common calculation is Forecast Sum - Sum of Variance/Sum of Actuals to determine percentage error. *monitoring the delta of Forecast Accuracy over measured time periods can determine success rates.
Identify, Prioritize, and Aggregate Product Requirements Cycle Time
The average time associated with the identifying, prioritizing, and aggregating product requirements
Best Practices: Capacity and Supply Constraints Are Balanced Against Demand during the Planning Cycle
None identified
Categorize 100% of Total Inventory (Active, Usable, Excess, Obsolete) for Appropriate Action
None identified
Master Production Scheduling Reflects Management of Capacity and/or Supply Constraints
None identified
Sales and Operations Agree to Limits of Short Term Flexibility
None identified
The Demand Plan is Updated Frequently to Reflect Actual Consumption or Customer Forecast Information
None identified
Inputs: Bill of Materials from EP.7 Manage Planning Configuration
The Bill of Materials is a structured list of all the materials or parts needed to produce a particular finished product, assembly, subassembly, manufactured part, whether purchased or not.
Delivery Plans from P4.4 Establish Delivery Plans
A plan for a course of action over specified time periods that involves a projected appropriation of supply resources to meet delivery requirements.
Item Master from EP.7 Manage Planning Configuration
A record of specific information for each product, which defines the system parameters with which to effectively plan and execute using ERP (MRP, etc) systems.
Order Signal from D3.3 Enter Order, Commit Resources & Launch Program
Reserved inventory and/or planned capacity and delivery date for a specific order.
Order Signal from D2.3 Reserve Resources & Determine Delivery Date
Reserved inventory and/or planned capacity and delivery date for a specific order.
Planning Data from EP.3 Manage PLAN Data Collection
Execution information necessary to plan the balance of supply chain resources to demand requirements at both the highest aggregate and lowest SKU planning levels.
Product Routings from EP.7 Manage Planning Configuration
Product routings represent the way products are made and are integrated with the Bill of Materials. Key elements of proper Routings include proper sequence of operations, work center identification, relevant tolerances, run times, lot size and setups. The equivalent concepts for services are the workflow processes and rules.

© Copyright 2006 Supply-Chain Council, Inc. 24 June 2006
Production Plans from P3.4 Establish Production Plans
A master production plan used to allocate capacity among manufacturing resources and schedule finite manufacturing activities or executing the performance of a service. Production Plan includes production capability.
Source Return Requirements from P5.4 Establish and Communicate Return Plans
All sources of demand in the Source Return of a product or service.
Supply Chain Plans from P1.4 Establish Supply Chain Plans
Courses of action over specified time periods that represent a projected appropriation of total supply-chain resources to meet total supply-chain demand requirements.
Outputs: Product Requirements to P2.3 Balance Product Resources with Product Requirements
As a whole with constituent parts, all sources of demand for a product or service in the supply chain.
© Copyright 2006 Supply-Chain Council, Inc. 25 June 2006
P2.2 Identify, Assess, And Aggregate Product Resources The process of identifying, evaluating, and considering, as a whole with constituent parts, all material and other resources used to add value in the supply chain for a product or services. Metrics (see Appendix A for metrics attributes): Cost to Identify, Assess, and Aggregate Product Resources
The sum of the costs associated with identifying, assessing and aggregating product resources.
Identify, Assess, and Aggregate Product Resources Cycle Time
The average time associated with the identifying, assessing, and aggregating product resource availability
Best Practices: Capacity and Supply Constraints Identified During MPS Schedule Process Are Balanced Against Demand during the Planning Cycle
None identified
Categorize 100% of Total Inventory (Active, Usable, Excess, Obsolete) for Appropriate Action
None identified
Inventory is Planned at the Part Level, Based on Supply and Demand Variability
None identified
Inventory Performance is Measured at the Dollar and Unit Levels
None identified
Inventory Targets Are Reviewed and Adjusted Frequently
Digital Linkages using XML standards (RosettaNet, eBXML, OAGI) to automatically query inventory levels.
Obsolete Inventory is Reviewed at the Part Number Level
None identified
Inputs: Inventory Availability from S3.6 Transfer Product
Those stocks or items on hand used to support production (raw materials and work in process items), supporting activities (maintenance, repairs and operating supplies), and customer service (finished goods and spare parts).
Inventory Availability from S1.4 Transfer Product
Those stocks or items on hand used to support production (raw materials and work in process items), supporting activities (maintenance, repairs and operating supplies), and customer service (finished goods and spare parts).
Inventory Availability from S2.4 Transfer Product
Those stocks or items on hand used to support production (raw materials and work in process items), supporting activities (maintenance, repairs and operating supplies), and customer service (finished goods and spare parts).
Planning Data from EP.3 Manage PLAN Data Collection
Execution information necessary to plan the balance of supply chain resources to demand requirements at both the highest aggregate and lowest SKU planning levels.
Product Availability from Source: Availability of a product by location that is reserved, scheduled or available for sale, or the number of products ready to be or planned to be shipped to the specific customer or market at the specific time.
Product Inventory Target Levels from ES.4 Manage Product Inventory
The target for the total product inventory, including e.g. raw material, work in progress and finished goods.
Product On Order from S1.1 Schedule Product Deliveries
Product on order with a selected source.
Product On Order from S3.3 Schedule Product Deliveries
Product on order with a selected source.
Product On Order from S2.1 Schedule Product Deliveries
Product on order with a selected source.

© Copyright 2006 Supply-Chain Council, Inc. 26 June 2006
Outputs: Product Sources to P2.3 Balance Product Resources with Product Requirements
As a whole with constituent parts, all material and other resources used to add value in the supply chain for a product or services.

© Copyright 2006 Supply-Chain Council, Inc. 27 June 2006
P2.3 Balance Product Resources with Product Requirements The process of developing a time-phased course of action that commits resources to meet requirements. Metrics (see Appendix A for metrics attributes): Balance Product Resources with Product Requirements Cycle Time
The average time associated with balancing product resources and product requirements.
Cost to Balance Product Resources with Product Requirements
The sum of the costs associated with balance of product resources with product requirements.
Best Practices: Suppliers Share Responsibility for Balancing Supply and Demand through Joint Service Agreements
None identified
Inputs: Product Sources from P2.2 Identify, Assess, And Aggregate Product Resources
As a whole with constituent parts, all material and other resources used to add value in the supply chain for a product or services.
Product Requirements from P2.1 Identify, Prioritize, and Aggregate Product Requirements
As a whole with constituent parts, all sources of demand for a product or service in the supply chain.
Planning Decision Policies from EP.1 Manage Business Rules for PLAN Processes
Any company policies that affect how a planning process is defined, approved, and performed.
Outputs: Workflow to P2.4 Establish Sourcing Plans

© Copyright 2006 Supply-Chain Council, Inc. 28 June 2006
P2.4 Establish Sourcing Plans The establishment of courses of action over specified time periods that represent a projected appropriation of supply resources to meet sourcing plan requirements. Metrics (see Appendix A for metrics attributes): Cost to Establish Sourcing Plans The sum of the costs associated with establishing and communicating
source plans. Establish Sourcing Plans Cycle Time The average time associated with establishing and communicating source
plans Best Practices: Blanket Purchase Orders Cover Period Requirements
None identified
Digital Linkage (EDI, XML, Etc.) is Used to Provide Real-Time Demand Information and Handle Routine Transactions
None identified
Inputs: Workflow from P2.3 Balance Product Resources with Product Requirements Outputs: Sourcing Plans to DR1.4 Transfer Defective Product
An aggregate material requirements plan used to schedule material deliveries to meet production plan.
Sourcing Plans to P4.2 Identify, Assess, and Aggregate Delivery Resources and Capabilities
An aggregate material requirements plan used to schedule material deliveries to meet production plan.
Sourcing Plans to D1.3 Reserve Inventory & Determine Delivery Date
An aggregate material requirements plan used to schedule material deliveries to meet production plan.
Sourcing Plans to ES.4 Manage Product Inventory
An aggregate material requirements plan used to schedule material deliveries to meet production plan.
Sourcing Plans to D2.3 Reserve Resources & Determine Delivery Date
An aggregate material requirements plan used to schedule material deliveries to meet production plan.
Sourcing Plans to ES.3 Maintain Source Data
An aggregate material requirements plan used to schedule material deliveries to meet production plan.
Sourcing Plans to S1.1 Schedule Product Deliveries
An aggregate material requirements plan used to schedule material deliveries to meet production plan.
Sourcing Plans to P1.2 Identify, Assess, and Aggregate Supply Chain Resources
An aggregate material requirements plan used to schedule material deliveries to meet production plan.
Sourcing Plans to P3.2 Identify, Assess, and Aggregate Production Resources
An aggregate material requirements plan used to schedule material deliveries to meet production plan.
Sourcing Plans to S3.3 Schedule Product Deliveries
An aggregate material requirements plan used to schedule material deliveries to meet production plan.
Sourcing Plans to P5.2 Identify, Assess, and Aggregate Return Resources
An aggregate material requirements plan used to schedule material deliveries to meet production plan.
Sourcing Plans to S3.1 Identify Sources of Supply
An aggregate material requirements plan used to schedule material deliveries to meet production plan.
Sourcing Plans to P5.1 Assess, and Aggregate Return Requirements
An aggregate material requirements plan used to schedule material deliveries to meet production plan.
Sourcing Plans to DR2.4 Transfer MRO Product
An aggregate material requirements plan used to schedule material deliveries to meet production plan.
Sourcing Plans to DR3.4 Transfer Excess Product
An aggregate material requirements plan used to schedule material deliveries to meet production plan.
Sourcing Plans to S2.1 Schedule Product Deliveries
An aggregate material requirements plan used to schedule material deliveries to meet production plan.
Sourcing Plans to D3.3 Enter Order, Commit Resources & Launch Program
An aggregate material requirements plan used to schedule material deliveries to meet production plan.

© Copyright 2006 Supply-Chain Council, Inc. 29 June 2006
P3 Plan Make The development and establishment of courses of action over specified time periods that represent a projected appropriation of production resources to meet production requirements. The Category P3 includes four Level 3 Elements: P3.1 Identify, Prioritize, and Aggregate Production Requirements
The process of identifying, prioritizing, and considering as a whole with constituent parts, all sources of demand in the creation of a product or service.
P3.2 Identify, Assess, and Aggregate Production Resources
The process of identifying, evaluating, and considering, as a whole with constituent parts, all things that add value in the creation of a product or performance of a service.
P3.3 Balance Production Resources with Production Requirements
The process of developing a time-phased course of action that commits creation and operation resources to meet creation and operation requirements.
P3.4 Establish Production Plans The establishment of courses of action over specified time periods that represent a projected appropriation of supply resources to meet production and operating plan requirements.
Metrics (see Appendix A for metrics attributes): Cash-To-Cash Cycle Time [Inventory Days of Supply + Days Sales Outstanding - Days Payable
Outstanding] The time it takes for an investment made to flow back into a company after it has been spent for raw materials. For services, this represents the time from the point where a company pays for the resources consumed in the performance of a service to the time that the company received payment from the customer for those services.
Order Fulfillment Cycle Time The average actual cycle time consistently achieved to fulfill customer orders.
Return on Supply Chain Fixed Assets Return on Supply Chain Fixed Assets measures the return an organization receives on its invested capital in supply chain fixed assets. This includes the fixed assets used in Plan, Source, Make, Deliver, and Return. The levels of aggregation can be at any element associated with a supply chain asset.
Return on Working Capital Return on working capital is a measurement which assesses the magnitude of investment relative to a company’s working capital position verses the revenue generated from a supply chain. Components include accounts receivable, accounts payable, inventory, supply chain revenue, cost of goods sold and supply chain management costs.
Best Practices: Distinct and Consistent Linkages Exist to Ensure that Disruptions and Opportunities in Production Are Quickly and Accurately Communicated and Responses Made
Multi-plant supply/demand planning and execution
© Copyright 2006 Supply-Chain Council, Inc. 30 June 2006
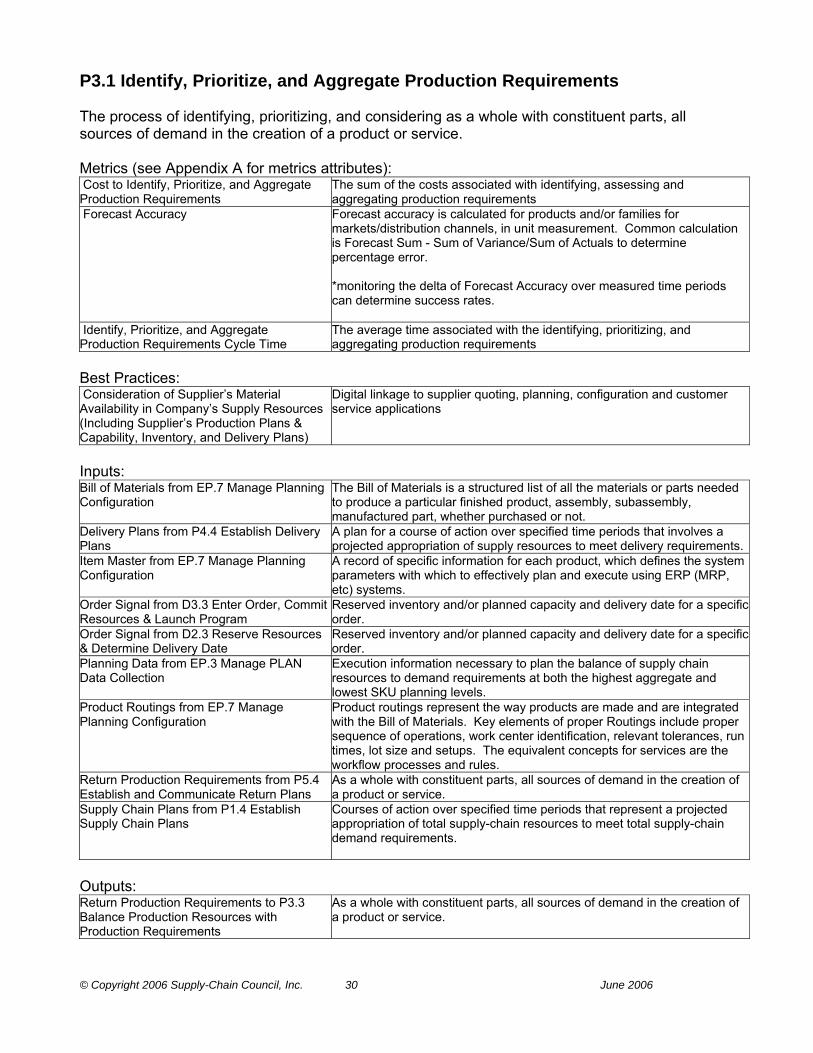
P3.1 Identify, Prioritize, and Aggregate Production Requirements The process of identifying, prioritizing, and considering as a whole with constituent parts, all sources of demand in the creation of a product or service. Metrics (see Appendix A for metrics attributes): Cost to Identify, Prioritize, and Aggregate Production Requirements
The sum of the costs associated with identifying, assessing and aggregating production requirements
Forecast Accuracy Forecast accuracy is calculated for products and/or families for markets/distribution channels, in unit measurement. Common calculation is Forecast Sum - Sum of Variance/Sum of Actuals to determine percentage error. *monitoring the delta of Forecast Accuracy over measured time periods can determine success rates.
Identify, Prioritize, and Aggregate Production Requirements Cycle Time
The average time associated with the identifying, prioritizing, and aggregating production requirements
Best Practices: Consideration of Supplier’s Material Availability in Company’s Supply Resources (Including Supplier’s Production Plans & Capability, Inventory, and Delivery Plans)
Digital linkage to supplier quoting, planning, configuration and customer service applications
Inputs: Bill of Materials from EP.7 Manage Planning Configuration
The Bill of Materials is a structured list of all the materials or parts needed to produce a particular finished product, assembly, subassembly, manufactured part, whether purchased or not.
Delivery Plans from P4.4 Establish Delivery Plans
A plan for a course of action over specified time periods that involves a projected appropriation of supply resources to meet delivery requirements.
Item Master from EP.7 Manage Planning Configuration
A record of specific information for each product, which defines the system parameters with which to effectively plan and execute using ERP (MRP, etc) systems.
Order Signal from D3.3 Enter Order, Commit Resources & Launch Program
Reserved inventory and/or planned capacity and delivery date for a specific order.
Order Signal from D2.3 Reserve Resources & Determine Delivery Date
Reserved inventory and/or planned capacity and delivery date for a specific order.
Planning Data from EP.3 Manage PLAN Data Collection
Execution information necessary to plan the balance of supply chain resources to demand requirements at both the highest aggregate and lowest SKU planning levels.
Product Routings from EP.7 Manage Planning Configuration
Product routings represent the way products are made and are integrated with the Bill of Materials. Key elements of proper Routings include proper sequence of operations, work center identification, relevant tolerances, run times, lot size and setups. The equivalent concepts for services are the workflow processes and rules.
Return Production Requirements from P5.4 Establish and Communicate Return Plans
As a whole with constituent parts, all sources of demand in the creation of a product or service.
Supply Chain Plans from P1.4 Establish Supply Chain Plans
Courses of action over specified time periods that represent a projected appropriation of total supply-chain resources to meet total supply-chain demand requirements.
Outputs: Return Production Requirements to P3.3 Balance Production Resources with Production Requirements
As a whole with constituent parts, all sources of demand in the creation of a product or service.

© Copyright 2006 Supply-Chain Council, Inc. 31 June 2006
P3.2 Identify, Assess, and Aggregate Production Resources The process of identifying, evaluating, and considering, as a whole with constituent parts, all things that add value in the creation of a product or performance of a service. Metrics (see Appendix A for metrics attributes): Cost to Identify, Assess, and Aggregate Production Resources
The sum of the costs associated with identifying, assessing and aggregating production resources.
Identify, Assess, and Aggregate Production Resources Cycle Time
The average time associated with the identifying, assessing, and aggregating production resource availability
Best Practices: Inventory Targets Are Reviewed and Adjusted Frequently
Digital Linkages using XML standards (RosettaNet, eBXML, OAGI) to automatically query inventory levels.
Obsolete Inventory is Reviewed at the Part Number Level
None identified
Inputs: Equipment and Facilities Replacement and Disposition Plans from EM.5 Manage Equipment and Facilities
Actions relating to the planning, financing and disposition of capital outlays for such purposes as the purchase of new equipment, the introduction of new product lines, and the modernization of plant facilities
Inventory Availability from M3.3 Issue Sourced/In-Process Product
Those stocks or items on hand used to support production (raw materials and work in process items), supporting activities (maintenance, repairs and operating supplies), and customer service (finished goods and spare parts).
Inventory Availability from M1.2 Issue Material
Those stocks or items on hand used to support production (raw materials and work in process items), supporting activities (maintenance, repairs and operating supplies), and customer service (finished goods and spare parts).
Inventory Availability from M2.2 Issue Sourced/In-Process Product
Those stocks or items on hand used to support production (raw materials and work in process items), supporting activities (maintenance, repairs and operating supplies), and customer service (finished goods and spare parts).
Planning Data from EP.3 Manage PLAN Data Collection
Execution information necessary to plan the balance of supply chain resources to demand requirements at both the highest aggregate and lowest SKU planning levels.
Production Schedule from M3.2 Schedule Production Activities
A plan that authorizes the factory to manufacture or repair a certain quantity of a specific item.
Production Schedule from M1.1 Schedule Production Activities
A plan that authorizes the factory to manufacture or repair a certain quantity of a specific item.
Production Schedule from M2.1 Schedule Production Activities
A plan that authorizes the factory to manufacture or repair a certain quantity of a specific item.
Sourcing Plans from P2.4 Establish Sourcing Plans
An aggregate material requirements plan used to schedule material deliveries to meet production plan.
Outputs: Production Resources to P3.3 Balance Production Resources with Production Requirements
As a whole with constituent parts, all things that add value in the creation of a product or performance of a service.

© Copyright 2006 Supply-Chain Council, Inc. 32 June 2006
P3.3 Balance Production Resources with Production Requirements The process of developing a time-phased course of action that commits creation and operation resources to meet creation and operation requirements. Metrics (see Appendix A for metrics attributes): Balance Production Resources with Product Creation Requirements Cycle Time
The average time associated with balancing production resources with production creation requirements.
Cost to Balance Production Resources with Product Creation Requirements
The sum of the costs associated with balance of production resources with product creation requirements.
Best Practices: Inventory Targets Are Reviewed and Adjusted Frequently
Digital Linkages using XML standards (RosettaNet, eBXML, OAGI) to automatically query inventory levels.
Inputs: Return Production Requirements from P3.1 Identify, Prioritize, and Aggregate Production Requirements
As a whole with constituent parts, all sources of demand in the creation of a product or service.
Production Resources from P3.2 Identify, Assess, and Aggregate Production Resources
As a whole with constituent parts, all things that add value in the creation of a product or performance of a service.
Planning Decision Policies from EP.1 Manage Business Rules for PLAN Processes
Any company policies that affect how a planning process is defined, approved, and performed.
Outputs: Workflow to P3.4 Establish Production Plans
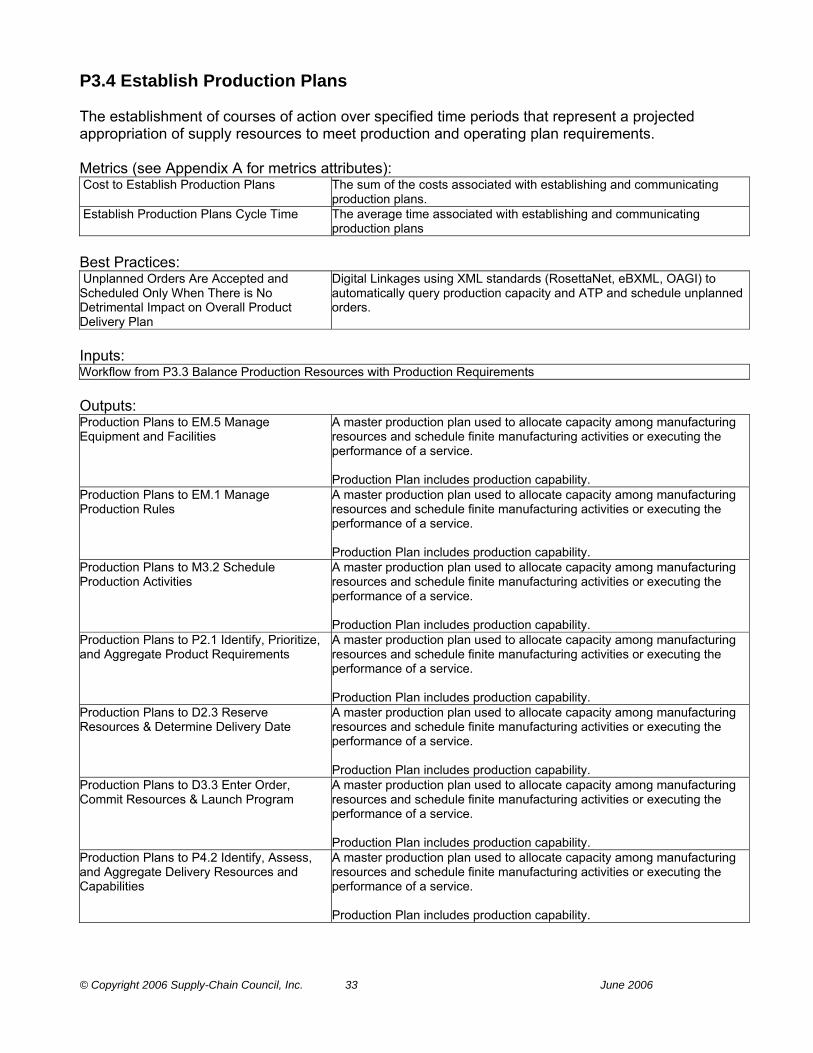
© Copyright 2006 Supply-Chain Council, Inc. 33 June 2006
P3.4 Establish Production Plans The establishment of courses of action over specified time periods that represent a projected appropriation of supply resources to meet production and operating plan requirements. Metrics (see Appendix A for metrics attributes): Cost to Establish Production Plans The sum of the costs associated with establishing and communicating
production plans. Establish Production Plans Cycle Time The average time associated with establishing and communicating
production plans Best Practices: Unplanned Orders Are Accepted and Scheduled Only When There is No Detrimental Impact on Overall Product Delivery Plan
Digital Linkages using XML standards (RosettaNet, eBXML, OAGI) to automatically query production capacity and ATP and schedule unplanned orders.
Inputs: Workflow from P3.3 Balance Production Resources with Production Requirements Outputs: Production Plans to EM.5 Manage Equipment and Facilities
A master production plan used to allocate capacity among manufacturing resources and schedule finite manufacturing activities or executing the performance of a service. Production Plan includes production capability.
Production Plans to EM.1 Manage Production Rules
A master production plan used to allocate capacity among manufacturing resources and schedule finite manufacturing activities or executing the performance of a service. Production Plan includes production capability.
Production Plans to M3.2 Schedule Production Activities
A master production plan used to allocate capacity among manufacturing resources and schedule finite manufacturing activities or executing the performance of a service. Production Plan includes production capability.
Production Plans to P2.1 Identify, Prioritize, and Aggregate Product Requirements
A master production plan used to allocate capacity among manufacturing resources and schedule finite manufacturing activities or executing the performance of a service. Production Plan includes production capability.
Production Plans to D2.3 Reserve Resources & Determine Delivery Date
A master production plan used to allocate capacity among manufacturing resources and schedule finite manufacturing activities or executing the performance of a service. Production Plan includes production capability.
Production Plans to D3.3 Enter Order, Commit Resources & Launch Program
A master production plan used to allocate capacity among manufacturing resources and schedule finite manufacturing activities or executing the performance of a service. Production Plan includes production capability.
Production Plans to P4.2 Identify, Assess, and Aggregate Delivery Resources and Capabilities
A master production plan used to allocate capacity among manufacturing resources and schedule finite manufacturing activities or executing the performance of a service. Production Plan includes production capability.
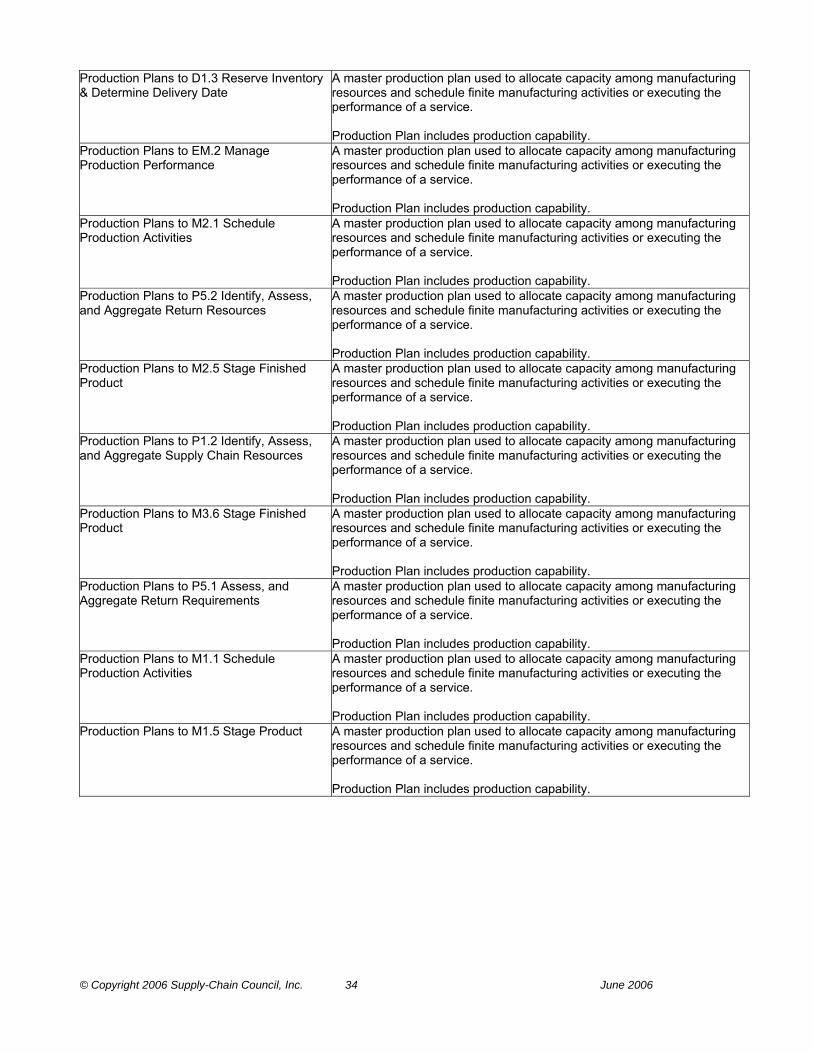
© Copyright 2006 Supply-Chain Council, Inc. 34 June 2006
Production Plans to D1.3 Reserve Inventory & Determine Delivery Date
A master production plan used to allocate capacity among manufacturing resources and schedule finite manufacturing activities or executing the performance of a service. Production Plan includes production capability.
Production Plans to EM.2 Manage Production Performance
A master production plan used to allocate capacity among manufacturing resources and schedule finite manufacturing activities or executing the performance of a service. Production Plan includes production capability.
Production Plans to M2.1 Schedule Production Activities
A master production plan used to allocate capacity among manufacturing resources and schedule finite manufacturing activities or executing the performance of a service. Production Plan includes production capability.
Production Plans to P5.2 Identify, Assess, and Aggregate Return Resources
A master production plan used to allocate capacity among manufacturing resources and schedule finite manufacturing activities or executing the performance of a service. Production Plan includes production capability.
Production Plans to M2.5 Stage Finished Product
A master production plan used to allocate capacity among manufacturing resources and schedule finite manufacturing activities or executing the performance of a service. Production Plan includes production capability.
Production Plans to P1.2 Identify, Assess, and Aggregate Supply Chain Resources
A master production plan used to allocate capacity among manufacturing resources and schedule finite manufacturing activities or executing the performance of a service. Production Plan includes production capability.
Production Plans to M3.6 Stage Finished Product
A master production plan used to allocate capacity among manufacturing resources and schedule finite manufacturing activities or executing the performance of a service. Production Plan includes production capability.
Production Plans to P5.1 Assess, and Aggregate Return Requirements
A master production plan used to allocate capacity among manufacturing resources and schedule finite manufacturing activities or executing the performance of a service. Production Plan includes production capability.
Production Plans to M1.1 Schedule Production Activities
A master production plan used to allocate capacity among manufacturing resources and schedule finite manufacturing activities or executing the performance of a service. Production Plan includes production capability.
Production Plans to M1.5 Stage Product A master production plan used to allocate capacity among manufacturing resources and schedule finite manufacturing activities or executing the performance of a service. Production Plan includes production capability.

© Copyright 2006 Supply-Chain Council, Inc. 35 June 2006
P4 Plan Deliver The development and establishment of courses of action over specified time periods that represent a projected appropriation of delivery resources to meet delivery requirements. The Category P4 includes four Level 3 Elements: P4.1 Identify, Prioritize, and Aggregate Delivery Requirements
The process of identifying, prioritizing, and considering, as a whole with constituent parts, all sources of demand in the delivery of a product or service.
P4.2 Identify, Assess, and Aggregate Delivery Resources and Capabilities
The process of identifying, evaluating, and considering, as a whole with constituent parts, all things that add value in the delivery of a product or service.
P4.3 Balance Delivery Resources and Capabilities with Delivery Requirements
The process of developing a time-phased course of action that commits delivery resources to meet delivery requirements.
P4.4 Establish Delivery Plans The establishment of courses of action over specified time periods that represent a projected appropriation of delivery resources to meet delivery requirements.
Metrics (see Appendix A for metrics attributes): Cash-To-Cash Cycle Time [Inventory Days of Supply + Days Sales Outstanding - Days Payable
Outstanding] The time it takes for an investment made to flow back into a company after it has been spent for raw materials. For services, this represents the time from the point where a company pays for the resources consumed in the performance of a service to the time that the company received payment from the customer for those services.
Cost to Plan Deliver The sum of the costs associated with planning the delivery of product. Order Fulfillment Cycle Time The average actual cycle time consistently achieved to fulfill customer
orders. Return on Supply Chain Fixed Assets Return on Supply Chain Fixed Assets measures the return an organization
receives on its invested capital in supply chain fixed assets. This includes the fixed assets used in Plan, Source, Make, Deliver, and Return. The levels of aggregation can be at any element associated with a supply chain asset.
Return on Working Capital Return on working capital is a measurement which assesses the magnitude of investment relative to a company’s working capital position verses the revenue generated from a supply chain. Components include accounts receivable, accounts payable, inventory, supply chain revenue, cost of goods sold and supply chain management costs.
Total Deliver Costs The sum of the costs associated with the Deliver processes. Best Practices: Distinct and Consistent Linkages Exist to Ensure Disruptions and Opportunities in Material Resources Are Quickly and Accurately Communicated and Acted Upon
Bi-directional Digital Links (XML, EDI, etc) or Internet procurement networks to customer service linkage
Proactive Education of Customers to Set Expectations and Encourage Close Working Relationships (Knowledge of Long-Lead Items, Visibility to Supply Resources, Agreement on Levels of Flexibility)
None identified

© Copyright 2006 Supply-Chain Council, Inc. 36 June 2006
P4.1 Identify, Prioritize, and Aggregate Delivery Requirements The process of identifying, prioritizing, and considering, as a whole with constituent parts, all sources of demand in the delivery of a product or service. Metrics (see Appendix A for metrics attributes): Cost to Identify, Prioritize, and Aggregate Delivery Requirements
The sum of the costs associated with identifying, assessing and aggregating deliver requirements
Forecast Accuracy Forecast accuracy is calculated for products and/or families for markets/distribution channels, in unit measurement. Common calculation is Forecast Sum - Sum of Variance/Sum of Actuals to determine percentage error. *monitoring the delta of Forecast Accuracy over measured time periods can determine success rates.
Identify, Prioritize, and Aggregate Delivery Requirements Cycle Time
The average time associated with the identifying, prioritizing, and aggregating delivery requirements
Best Practices: Customer Relationship and Digital Linkages (XML, EDI, Etc.) Provide Accurate Visibility into Actual Demand via Customer Forecasts, Product Plans, Production Plans, and Inventory Positions
Tightly integrated supply chain or demand planning with point of sale and customer inventory systems
Electronic Matching Between POS Data and Store Inventory (Shelves and Back Room)
Integrated Software Systems
Eliminate “Special Deals“ Sales to Reduce Returns and Improve Forecast Accuracy (Reduces Uncertainty, Lowers Safety Stock Requirements, Cheaper to Administer)
None identified
Forecasts Are Replaced with Actual Customer Replenishment Signals and Orders Where Possible
B2B Integration and Application Server Systems
Ideal Stock Position Based on Days/Weeks of Supply
Pilot by Wal-Mart. MIT
Matching Shelf Stock to Expectations A software based system that corrects shelf inventory levels based on actual product present (possible RFID solution). Identifies stock-outs from shrinkage or item misplacement.
Planogram Flexibility for Seasonal/Promotional changes
None identified
RFID and Other Tagging POG software/field force Unplanned Orders Are Accepted and Scheduled Only When There is No Detrimental Impact on Overall Product Delivery Plan
Digital Linkages using XML standards (Rosettanet, eBXML, OAGI) to automatically query production capacity and ATP and schedule unplanned orders.
Vendor Managed Inventory VMI is a concept for planning and control of inventory, in which the supplier has access to the customer’s inventory data and is responsible for maintaining the inventory level required by the customer. Re-supply is performed by the vendor through regularly scheduled reviews of the on-site inventory. The on-site inventory is counted, damaged or outdated goods are removed, and the inventory is restocked to predefined levels.
Inputs: Actual Shrink from Source: Company Reductions of actual quantities of items in stock, in process, or in transit.
The loss may be caused by scrap, theft, deterioration, evaporation, etc.

© Copyright 2006 Supply-Chain Council, Inc. 37 June 2006
DC/Vendor Lead Time from Source: Company
The amount of time that normally elapses between the time an order is received and the time the order is shipped.
DC/Vendor Transit Time from Source: Company
A standard allowance that is assumed on any given order for the movement of items from one operation to the next.
Deliver Return Requirements from P5.4 Establish and Communicate Return Plans
A determination or projection of the requirements the supply chain must meet in the handling and execution of returns. (i.e. quantity, mix, timing)
EOQ/ESQ’s from Source: Company Economic Order Quantity - Result of a calculation that determines the most cost effective to quantity to order or produce. Economic Shipping Quantity - Result of a calculation that determines the most cost effective quantity to ship.
Item Master from EP.7 Manage Planning Configuration
A record of specific information for each product, which defines the system parameters with which to effectively plan and execute using ERP (MRP, etc) systems.
Markdown Plans from Source: Company Part of the Market Plan, which establishes an allowance or deduction, granted by the seller to the buyer, usually when the buyer meets certain stipulated conditions that reduce the price of the products purchased. For example, based upon paying early, buying in quantity, etc.
Merchandise Category/Classification from Source: Company
The categorization of goods based upon the range of specifications met during the manufacturing process.
Order Backlog from D1.3 Reserve Inventory & Determine Delivery Date
Orders that have been received and entered into the order processing system and are in a queue waiting to be processed and shipped.
Order Backlog from D2.3 Reserve Resources & Determine Delivery Date
Orders that have been received and entered into the order processing system and are in a queue waiting to be processed and shipped.
Order Backlog from D3.3 Enter Order, Commit Resources & Launch Program
Orders that have been received and entered into the order processing system and are in a queue waiting to be processed and shipped.
Planning Data from EP.3 Manage PLAN Data Collection
Execution information necessary to plan the balance of supply chain resources to demand requirements at both the highest aggregate and lowest SKU planning levels.
Point of Sale Data (Daily) from D4.6 Checkout
The relief of inventory and computation of sales data at the time and place of the sales, generally (may be manual) through the use of bar-coding, or magnetic media and equipment.
Product Routings from EP.7 Manage Planning Configuration
Product routings represent the way products are made and are integrated with the Bill of Materials. Key elements of proper Routings include proper sequence of operations, work center identification, relevant tolerances, run times, lot size and setups. The equivalent concepts for services are the workflow processes and rules.
Product/Category Lifecycle from Source: Company
The time from initial research and development to the time at which the sales and support of the product to customers are withdrawn.
Promotion/Event Plans from Source: Company
Promotion activities - other than advertising, publicity, and personal selling - that stimulate, interest, trial or purchase by final customers or others in the marketing channel.
Service Levels from EP.1 Manage Business Rules for PLAN Processes
Performance targets in service related measures (i.e. delivery performance, lead times, etc.) compared to the established service requirements. Service levels are established by balancing requirements against operational strategy.
Stock-out History from Source: Company History of a lack of materials, components, or finished goods that are ordered.
Store Shelf Inventory Counts from D4.4 Stock Shelf
The determination of inventory quantity by actual count. Physical inventories can be taken on a continuous, periodic or annual basis.
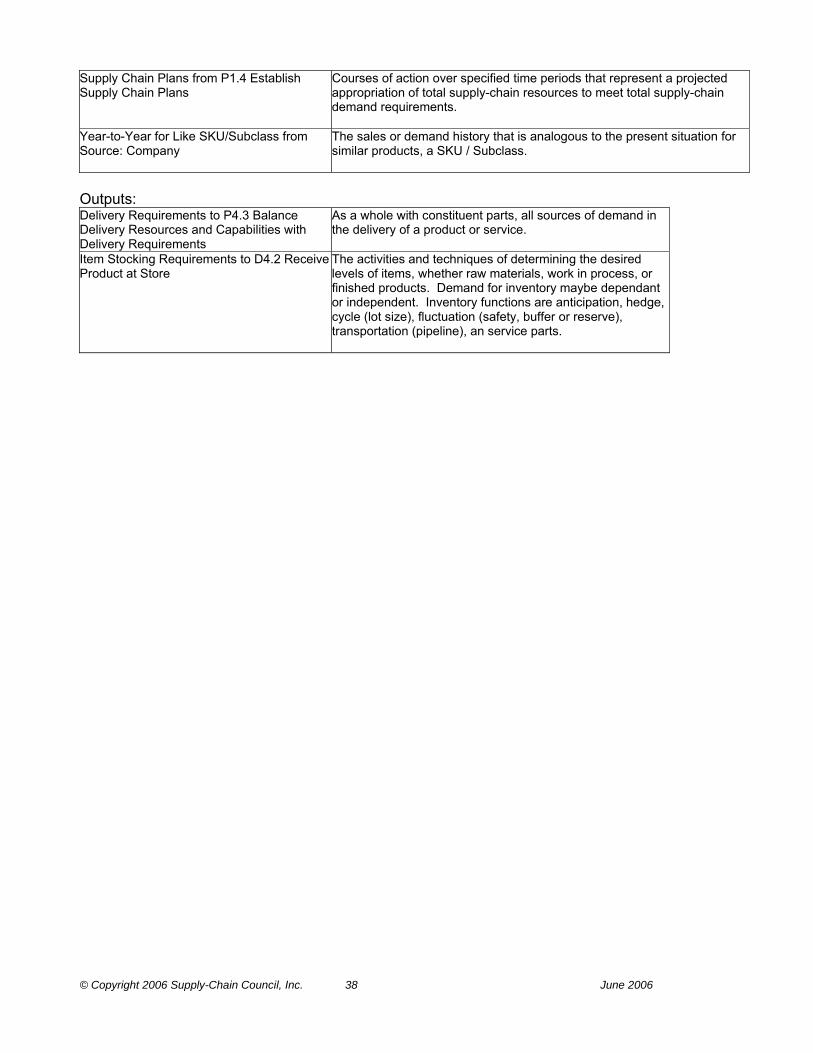
© Copyright 2006 Supply-Chain Council, Inc. 38 June 2006
Supply Chain Plans from P1.4 Establish Supply Chain Plans
Courses of action over specified time periods that represent a projected appropriation of total supply-chain resources to meet total supply-chain demand requirements.
Year-to-Year for Like SKU/Subclass from Source: Company
The sales or demand history that is analogous to the present situation for similar products, a SKU / Subclass.
Outputs: Delivery Requirements to P4.3 Balance Delivery Resources and Capabilities with Delivery Requirements
As a whole with constituent parts, all sources of demand in the delivery of a product or service.
Item Stocking Requirements to D4.2 Receive Product at Store
The activities and techniques of determining the desired levels of items, whether raw materials, work in process, or finished products. Demand for inventory maybe dependant or independent. Inventory functions are anticipation, hedge, cycle (lot size), fluctuation (safety, buffer or reserve), transportation (pipeline), an service parts.

© Copyright 2006 Supply-Chain Council, Inc. 39 June 2006
P4.2 Identify, Assess, and Aggregate Delivery Resources and Capabilities The process of identifying, evaluating, and considering, as a whole with constituent parts, all things that add value in the delivery of a product or service. Metrics (see Appendix A for metrics attributes): Cost to Identify, Assess, and Aggregate Production Resources
The sum of the costs associated with identifying, assessing and aggregating production resources.
Forecast Accuracy Forecast accuracy is calculated for products and/or families for markets/distribution channels, in unit measurement. Common calculation is Forecast Sum - Sum of Variance/Sum of Actuals to determine percentage error. *monitoring the delta of Forecast Accuracy over measured time periods can determine success rates.
Identify, Assess, and Aggregate Delivery Resources Cycle Time
The average time associated with the identifying, assessing, and aggregating delivery resource availability
Inputs: Deliver Return Requirements from P5.4 Establish and Communicate Return Plans
A determination or projection of the requirements the supply chain must meet in the handling and execution of returns. (i.e. quantity, mix, timing)
Finish Goods Inventory Target Levels from ED.4 Manage Finished Goods Inventories
In a min-max inventory system, the equivalent of the maximum. The target inventory is equal to the order point plus a variable order quantity.
Inventory Availability/Delivery Date from D1.3 Reserve Inventory & Determine Delivery Date
Those stocks or items on hand used to support production (raw materials and work in process items), supporting activities (maintenance, repairs and operating supplies), and customer service (finished goods and spare parts). Determination of the time required from the receipt of the order until the item should be delivered.
Inventory Availability/Delivery Date from D2.3 Reserve Resources & Determine Delivery Date
Those stocks or items on hand used to support production (raw materials and work in process items), supporting activities (maintenance, repairs and operating supplies), and customer service (finished goods and spare parts). Determination of the time required from the receipt of the order until the item should be delivered.
Load Information from D1.5 Build Loads Information relative to a load that is built and shipped, i.e. customer, items, destinations, weight, etc
Planning Data from EP.3 Manage PLAN Data Collection
Execution information necessary to plan the balance of supply chain resources to demand requirements at both the highest aggregate and lowest SKU planning levels.
Production Plans from P3.4 Establish Production Plans
A master production plan used to allocate capacity among manufacturing resources and schedule finite manufacturing activities or executing the performance of a service. Production Plan includes production capability.
Resource Availability from D3.3 Enter Order, Commit Resources & Launch Program
The capability of a system or resource to produce a quantity of output in a particular time period, or the available resources at a point in time able to generate an output.
Sourcing Plans from P2.4 Establish Sourcing Plans
An aggregate material requirements plan used to schedule material deliveries to meet production plan.
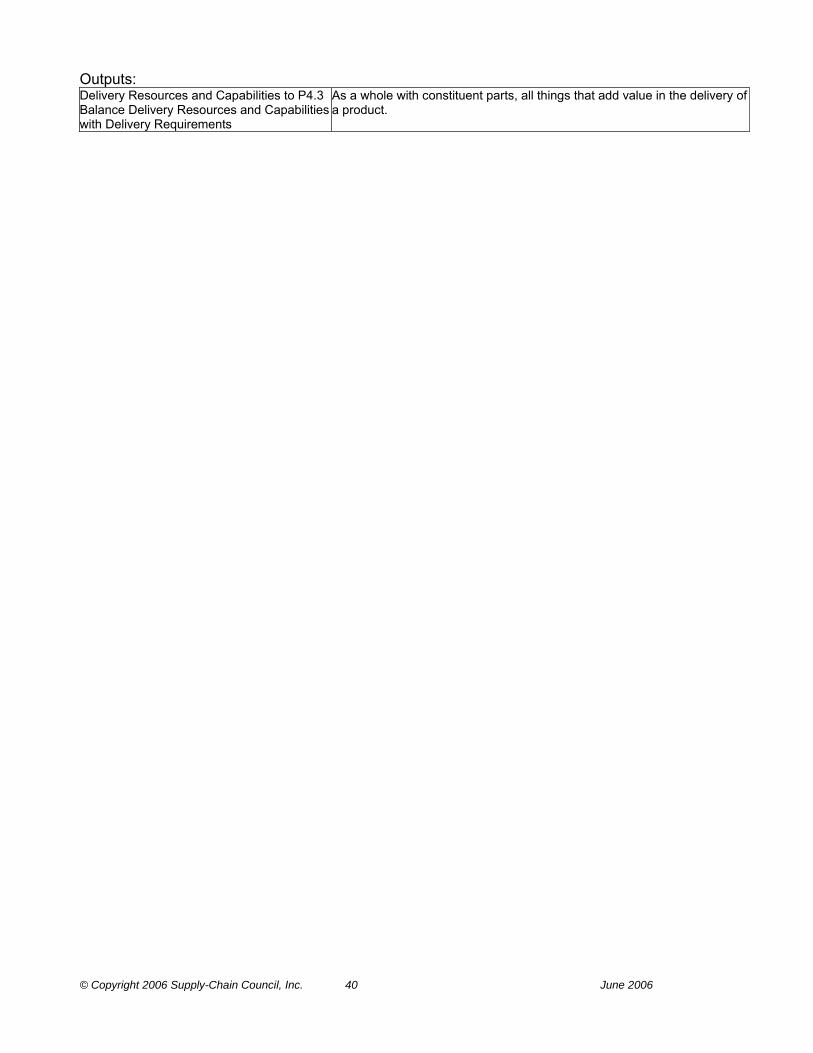
© Copyright 2006 Supply-Chain Council, Inc. 40 June 2006
Outputs: Delivery Resources and Capabilities to P4.3 Balance Delivery Resources and Capabilities with Delivery Requirements
As a whole with constituent parts, all things that add value in the delivery of a product.

© Copyright 2006 Supply-Chain Council, Inc. 41 June 2006
P4.3 Balance Delivery Resources and Capabilities with Delivery Requirements The process of developing a time-phased course of action that commits delivery resources to meet delivery requirements. Metrics (see Appendix A for metrics attributes): Balance Delivery Resources with Delivery Requirements Cycle Time
The average time associated with balancing deliver resources and deliver requirements.
Cost to Balance Delivery Resources with Delivery Requirements
The sum of the costs associated with balance of delivery resources with delivery requirements.
Best Practices: Demand Priorities Reflecting Strategic Customer Relationships as Business Policies Are Automatically Followed in Allocating Resources; First-In-First-Out (FIFO) is Utilized as the Default Scheduling Priority
Rules-based distribution planning system Trading partner agreements
Inputs: Delivery Resources and Capabilities from P4.2 Identify, Assess, and Aggregate Delivery Resources and Capabilities
As a whole with constituent parts, all things that add value in the delivery of a product.
Delivery Requirements from P4.1 Identify, Prioritize, and Aggregate Delivery Requirements
As a whole with constituent parts, all sources of demand in the delivery of a product or service.
Planning Decision Policies from EP.1 Manage Business Rules for PLAN Processes
Any company policies that affect how a planning process is defined, approved, and performed.
Outputs: Workflow to P4.4 Establish Delivery Plans

© Copyright 2006 Supply-Chain Council, Inc. 42 June 2006
P4.4 Establish Delivery Plans The establishment of courses of action over specified time periods that represent a projected appropriation of delivery resources to meet delivery requirements. Metrics (see Appendix A for metrics attributes): Cost to Establish Delivery Plans The sum of the costs associated with establishing and communicating
deliver plans. Establish Delivery Plans Cycle Time The average time associated with establishing and communicating deliver
plans Fill Rate The percentage of ship-from-stock orders shipped within 24 hours of order
receipt. For services, this metric is the proportion for services that are filled so that the service is completed within 24 hours
Best Practices: Plans that Violate Business Rules (e.g. Joint Service Agreements) Are Addressed Cross-Functionally, Considering Total Business Impacts (Revenue, Cost, Quality, Customer Service, Etc.)
None identified
Plans Which Do Not Violate Business Rules Are Communicated Openly and Cross-Functionally for Execution
None identified
Specific Changes to the Plan Are Agreed to Cross-Functionally, According to Defined Business Rules
None identified
To Address Conditions which Cannot be Adequately Satisfied During the Current Planning Period, Each Functional Area Develops Prioritized Recommendations for the Subsequent Planning Period
None identified
Inputs: Workflow from P4.3 Balance Delivery Resources and Capabilities with Delivery Requirements Outputs: Delivery Plans to P1.2 Identify, Assess, and Aggregate Supply Chain Resources
A plan for a course of action over specified time periods that involves a projected appropriation of supply resources to meet delivery requirements.
Delivery Plans to D1.3 Reserve Inventory & Determine Delivery Date
A plan for a course of action over specified time periods that involves a projected appropriation of supply resources to meet delivery requirements.
Delivery Plans to P5.1 Assess, and Aggregate Return Requirements
A plan for a course of action over specified time periods that involves a projected appropriation of supply resources to meet delivery requirements.
Delivery Plans to P3.1 Identify, Prioritize, and Aggregate Production Requirements
A plan for a course of action over specified time periods that involves a projected appropriation of supply resources to meet delivery requirements.
Delivery Plans to P2.1 Identify, Prioritize, and Aggregate Product Requirements
A plan for a course of action over specified time periods that involves a projected appropriation of supply resources to meet delivery requirements.
Delivery Plans to D3.3 Enter Order, Commit Resources & Launch Program
A plan for a course of action over specified time periods that involves a projected appropriation of supply resources to meet delivery requirements.
Delivery Plans to P5.2 Identify, Assess, and Aggregate Return Resources
A plan for a course of action over specified time periods that involves a projected appropriation of supply resources to meet delivery requirements.
Delivery Plans to M3.6 Stage Finished Product
A plan for a course of action over specified time periods that involves a projected appropriation of supply resources to meet delivery requirements.
Delivery Plans to D2.3 Reserve Resources & Determine Delivery Date
A plan for a course of action over specified time periods that involves a projected appropriation of supply resources to meet delivery requirements.
Delivery Plans to M1.5 Stage Product A plan for a course of action over specified time periods that involves a projected appropriation of supply resources to meet delivery requirements.
Delivery Plans to M2.5 Stage Finished Product
A plan for a course of action over specified time periods that involves a projected appropriation of supply resources to meet delivery requirements.
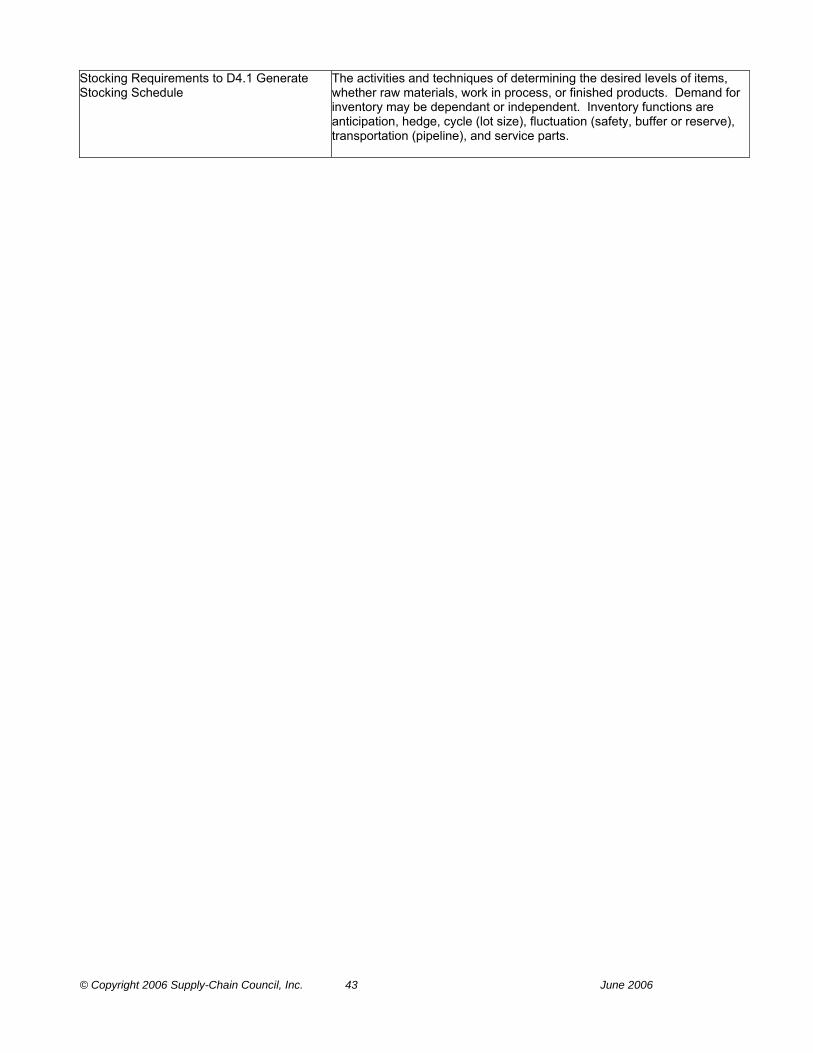
© Copyright 2006 Supply-Chain Council, Inc. 43 June 2006
Stocking Requirements to D4.1 Generate Stocking Schedule
The activities and techniques of determining the desired levels of items, whether raw materials, work in process, or finished products. Demand for inventory may be dependant or independent. Inventory functions are anticipation, hedge, cycle (lot size), fluctuation (safety, buffer or reserve), transportation (pipeline), and service parts.
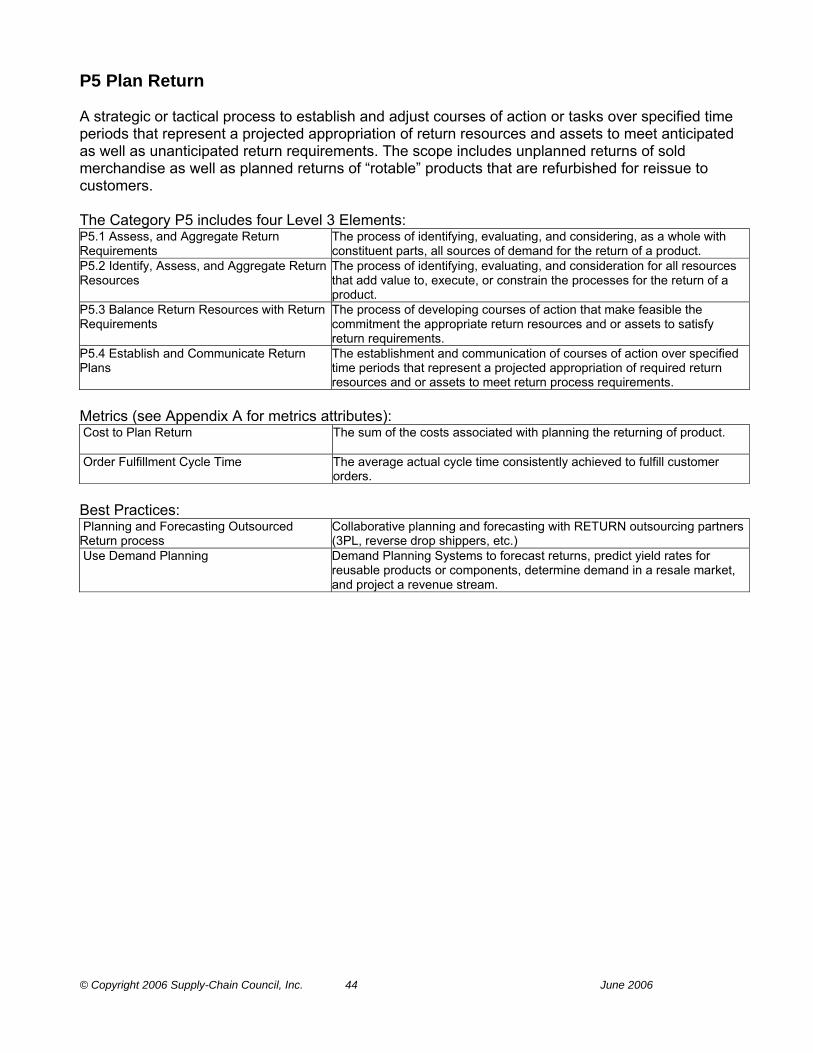
© Copyright 2006 Supply-Chain Council, Inc. 44 June 2006
P5 Plan Return A strategic or tactical process to establish and adjust courses of action or tasks over specified time periods that represent a projected appropriation of return resources and assets to meet anticipated as well as unanticipated return requirements. The scope includes unplanned returns of sold merchandise as well as planned returns of “rotable” products that are refurbished for reissue to customers. The Category P5 includes four Level 3 Elements: P5.1 Assess, and Aggregate Return Requirements
The process of identifying, evaluating, and considering, as a whole with constituent parts, all sources of demand for the return of a product.
P5.2 Identify, Assess, and Aggregate Return Resources
The process of identifying, evaluating, and consideration for all resources that add value to, execute, or constrain the processes for the return of a product.
P5.3 Balance Return Resources with Return Requirements
The process of developing courses of action that make feasible the commitment the appropriate return resources and or assets to satisfy return requirements.
P5.4 Establish and Communicate Return Plans
The establishment and communication of courses of action over specified time periods that represent a projected appropriation of required return resources and or assets to meet return process requirements.
Metrics (see Appendix A for metrics attributes): Cost to Plan Return
The sum of the costs associated with planning the returning of product.
Order Fulfillment Cycle Time The average actual cycle time consistently achieved to fulfill customer orders.
Best Practices: Planning and Forecasting Outsourced Return process
Collaborative planning and forecasting with RETURN outsourcing partners (3PL, reverse drop shippers, etc.)
Use Demand Planning Demand Planning Systems to forecast returns, predict yield rates for reusable products or components, determine demand in a resale market, and project a revenue stream.

© Copyright 2006 Supply-Chain Council, Inc. 45 June 2006
P5.1 Assess, and Aggregate Return Requirements The process of identifying, evaluating, and considering, as a whole with constituent parts, all sources of demand for the return of a product. Metrics (see Appendix A for metrics attributes): Cost to Identify, Prioritize, and Aggregate Return Requirements
The sum of the costs associated with identifying, assessing and aggregating return requirements.
Identify, Prioritize, and Aggregate Return Requirements Cycle Time
The average time associated with the identifying, prioritizing, and aggregating return requirements
Best Practices: Real Time Return Anticipation Having real time data on return demand and including it in the plan and
forecast. Requires a connection with customers, call centers or CRM system, possibly to the store level with retail returns. The return demand needs to be included in the production plan as soon as possible because upon repair it may be the next piece of serviceable inventory to satisfy demand.
Use Historical Based Return Rate Forecasts None identified Inputs: Actual Sales History from D2.2 Receive, Configure, Enter and Validate Order
Amount of past sales spanning any specified period of time (weeks, months, years, etc.) and expressed in any specified increments (per day, week, month, year, etc.)
Actual Sales History from D3.3 Enter Order, Commit Resources & Launch Program
Amount of past sales spanning any specified period of time (weeks, months, years, etc.) and expressed in any specified increments (per day, week, month, year, etc.)
Actual Sales History from D1.2 Receive, Enter & Validate Order
Amount of past sales spanning any specified period of time (weeks, months, years, etc.) and expressed in any specified increments (per day, week, month, year, etc.)
Business Rules for Return Processes from ER.1 Manage Business Rules for Return Processes
Rules for conducting business, i.e. developing and maintaining customer and channel performance standards of an return processes such as service levels, given service requirements by supply chain stakeholders/trading partners. Business rules align Return process policies with business strategy, goals, and objectives.
Contractual Obligations from Source: Plan (Marketing, Sales, Legal)
A promise in a contract that binds one to a specific course of action. These promises maybe made by either the buyer of seller.
Delivery Plans from P4.4 Establish Delivery Plans
A plan for a course of action over specified time periods that involves a projected appropriation of supply resources to meet delivery requirements.
Historical Return Rates from SR1.3 Request Defective Return Authorization
A judgmental forecasting technique based upon the a return history that is analogous to a present situation, such as the return history on a similar product, and using the past pattern to predict future returns.
Historical Return Rates from DR3.1 Authorize Excess Product Return
A judgmental forecasting technique based upon the a return history that is analogous to a present situation, such as the return history on a similar product, and using the past pattern to predict future returns.
Historical Return Rates from SR3.3 Request Excess Return Authorization
A judgmental forecasting technique based upon the a return history that is analogous to a present situation, such as the return history on a similar product, and using the past pattern to predict future returns.
Historical Return Rates from DR2.1 Authorize MRO Product Return
A judgmental forecasting technique based upon the a return history that is analogous to a present situation, such as the return history on a similar
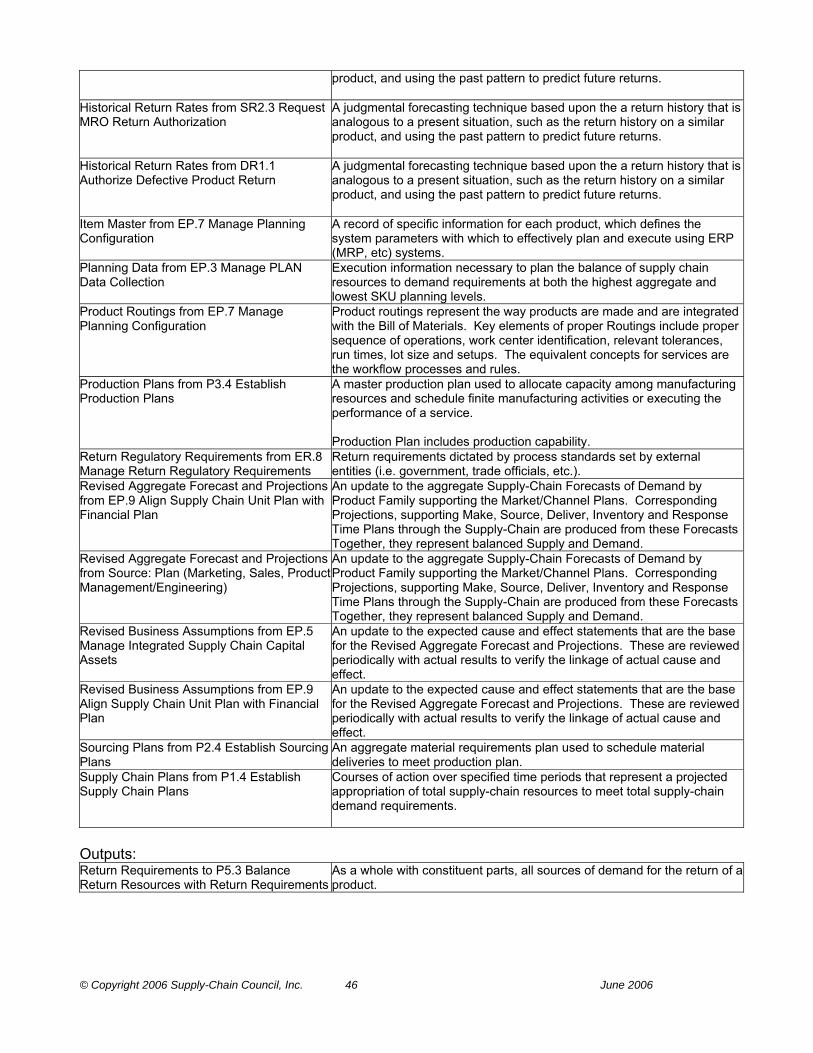
© Copyright 2006 Supply-Chain Council, Inc. 46 June 2006
product, and using the past pattern to predict future returns.
Historical Return Rates from SR2.3 Request MRO Return Authorization
A judgmental forecasting technique based upon the a return history that is analogous to a present situation, such as the return history on a similar product, and using the past pattern to predict future returns.
Historical Return Rates from DR1.1 Authorize Defective Product Return
A judgmental forecasting technique based upon the a return history that is analogous to a present situation, such as the return history on a similar product, and using the past pattern to predict future returns.
Item Master from EP.7 Manage Planning Configuration
A record of specific information for each product, which defines the system parameters with which to effectively plan and execute using ERP (MRP, etc) systems.
Planning Data from EP.3 Manage PLAN Data Collection
Execution information necessary to plan the balance of supply chain resources to demand requirements at both the highest aggregate and lowest SKU planning levels.
Product Routings from EP.7 Manage Planning Configuration
Product routings represent the way products are made and are integrated with the Bill of Materials. Key elements of proper Routings include proper sequence of operations, work center identification, relevant tolerances, run times, lot size and setups. The equivalent concepts for services are the workflow processes and rules.
Production Plans from P3.4 Establish Production Plans
A master production plan used to allocate capacity among manufacturing resources and schedule finite manufacturing activities or executing the performance of a service. Production Plan includes production capability.
Return Regulatory Requirements from ER.8 Manage Return Regulatory Requirements
Return requirements dictated by process standards set by external entities (i.e. government, trade officials, etc.).
Revised Aggregate Forecast and Projections from EP.9 Align Supply Chain Unit Plan with Financial Plan
An update to the aggregate Supply-Chain Forecasts of Demand by Product Family supporting the Market/Channel Plans. Corresponding Projections, supporting Make, Source, Deliver, Inventory and Response Time Plans through the Supply-Chain are produced from these Forecasts Together, they represent balanced Supply and Demand.
Revised Aggregate Forecast and Projections from Source: Plan (Marketing, Sales, Product Management/Engineering)
An update to the aggregate Supply-Chain Forecasts of Demand by Product Family supporting the Market/Channel Plans. Corresponding Projections, supporting Make, Source, Deliver, Inventory and Response Time Plans through the Supply-Chain are produced from these Forecasts Together, they represent balanced Supply and Demand.
Revised Business Assumptions from EP.5 Manage Integrated Supply Chain Capital Assets
An update to the expected cause and effect statements that are the base for the Revised Aggregate Forecast and Projections. These are reviewed periodically with actual results to verify the linkage of actual cause and effect.
Revised Business Assumptions from EP.9 Align Supply Chain Unit Plan with Financial Plan
An update to the expected cause and effect statements that are the base for the Revised Aggregate Forecast and Projections. These are reviewed periodically with actual results to verify the linkage of actual cause and effect.
Sourcing Plans from P2.4 Establish Sourcing Plans
An aggregate material requirements plan used to schedule material deliveries to meet production plan.
Supply Chain Plans from P1.4 Establish Supply Chain Plans
Courses of action over specified time periods that represent a projected appropriation of total supply-chain resources to meet total supply-chain demand requirements.
Outputs: Return Requirements to P5.3 Balance Return Resources with Return Requirements
As a whole with constituent parts, all sources of demand for the return of a product.

© Copyright 2006 Supply-Chain Council, Inc. 47 June 2006
P5.2 Identify, Assess, and Aggregate Return Resources The process of identifying, evaluating, and consideration for all resources that add value to, execute, or constrain the processes for the return of a product. Metrics (see Appendix A for metrics attributes): Cost to Identify, Assess, and Aggregate Return Resources
The sum of the costs associated with identifying, assessing and aggregating return resources.
Identify, Assess, and Aggregate Return Resources Cycle Time
The average time associated with the identifying, assessing, and aggregating return resource availability
Best Practices: Allow Source Suppliers Full Visibility into the Current Return Situations and the Forecasted Return Activity
Shared supply chain forecasting and event management functionality with Source suppliers
Joint Service Agreements with Source Suppliers to Share Responsibilities and Costs of Returns
Collaborative planning tools with the Source suppliers
Rapid Reconfiguration of Return Capacity Use of RETURN tracking and projection systems and flexible partner agreements that allow the rapid addition of RETURN capacity to match unexpected demand.
Inputs: Budget Constraints from EP.9 Align Supply Chain Unit Plan with Financial Plan
A plan that includes an estimate of future costs and revenues related to expected activities. The budget serves as pattern for and a control over future operations.
Business Rules for Return Processes from ER.1 Manage Business Rules for Return Processes
Rules for conducting business, i.e. developing and maintaining customer and channel performance standards of an return processes such as service levels, given service requirements by supply chain stakeholders/trading partners. Business rules align Return process policies with business strategy, goals, and objectives.
Data About Return Capabilities from ER.3 Manage Return Data Collection
Information required in the process of integrating and maintaining the accuracy of return execution.
Delivery Plans from P4.4 Establish Delivery Plans
A plan for a course of action over specified time periods that involves a projected appropriation of supply resources to meet delivery requirements.
Inventory Strategy from EP.4 Manage Integrated Supply Chain Inventory
The total supply chain inventory strategy. Contains the plan for total inventory limits or levels (including Raw Material, Work In Process, Finished and Purchased Finished Goods) including replenishment models, ownership, product mix, and stocking locations, both inter and intra company.
Make/Buy Decision from EP.5 Manage Integrated Supply Chain Capital Assets
The output of the process used to determine whether a demand will be supplied with internal capacity or purchased through contract manufacturing and/or contracted services externally.
MRO Product Return Capabilities from ER.2 Manage Performance of Return Processes
See “Product Return Capabilities“
MRO Product Return Capabilities from ER.5 Manage Return Capital Assets
See “Product Return Capabilities“
Outsource Plan from EP.6 Manage Integrated Supply Chain Transportation
A plan that describes how a company will utilize third party business partners to provide products and services which the company chooses not to provide with internal capacity. Outsource Plans can vary in detail from simple policy statements to highly detailed plans with specifics about the third party business partners, specifications for products and services, performance expectations, and contract considerations.
Planning Data from EP.3 Manage PLAN Data Collection
Execution information necessary to plan the balance of supply chain resources to demand requirements at both the highest aggregate and lowest SKU planning levels.

© Copyright 2006 Supply-Chain Council, Inc. 48 June 2006
Production Plans from P3.4 Establish Production Plans
A master production plan used to allocate capacity among manufacturing resources and schedule finite manufacturing activities or executing the performance of a service. Production Plan includes production capability.
Projected Internal and External Capacity from EP.6 Manage Integrated Supply Chain Transportation
An estimate of the amount of product or service a particular part of the business (internal capacity) or a third party business partner (external capacity) is capable of producing over a particular period of time when all factors that control the production processes are working optimally.
Regulatory Requirements from EP.8 Manage PLAN Regulatory Requirements and Compliance
Requirements dictated by process standards set by external entities (i.e. government, trade officials, etc.).
Return Inventory Targets from ER.4 Manage Return Inventory
The goals and approach to the management of return inventories.
Return Inventory Transfer Data from DR2.3 Receive MRO Product
The process of receipt and verification of the returned item against the return authorization and other documentation and prepares the item for transfer.
Return Inventory Transfer Data from DR3.3 Receive Excess Product
The process of receipt and verification of the returned item against the return authorization and other documentation and prepares the item for transfer.
Return Inventory Transfer Data from DR2.4 Transfer MRO Product
The process of receipt and verification of the returned item against the return authorization and other documentation and prepares the item for transfer.
Return Inventory Transfer Data from DR1.3 Receive Defective Product
The process of receipt and verification of the returned item against the return authorization and other documentation and prepares the item for transfer.
Return Inventory Transfer Data from DR1.4 Transfer Defective Product
The process of receipt and verification of the returned item against the return authorization and other documentation and prepares the item for transfer.
Return Inventory Transfer Data from DR3.4 Transfer Excess Product
The process of receipt and verification of the returned item against the return authorization and other documentation and prepares the item for transfer.
Return Process Capabilities from EP.2 Manage Performance of Supply Chain
The capability of a system or resources to produce a quantity output in a particular time period
Return Process Workflow Definition and Policies from ER.7 Manage Return Network Configuration
Definition and maintenance of the information flow about the Returns supply chain network for a group of similar or complimentary items through out their life cycle
Return Regulatory Requirements from ER.8 Manage Return Regulatory Requirements
Return requirements dictated by process standards set by external entities (i.e. government, trade officials, etc.).
Return Transportation Guidelines, Policies, & Agreements from ER.6 Manage Return Transportation
Guidelines, policies and agreements for the transportation activities around return process.
Revised Capital Plan from EP.5 Manage Integrated Supply Chain Capital Assets
A revision to plan for capital expenditures necessitated by either changes in specific business plans or factors and assumptions affecting a business plan.
Sourcing Plans from P2.4 Establish Sourcing Plans
An aggregate material requirements plan used to schedule material deliveries to meet production plan.
Outputs: Return Resources to P5.3 Balance Return Resources with Return Requirements
All resources that add value to, execute, or constrain the processes for the return of a product.

© Copyright 2006 Supply-Chain Council, Inc. 49 June 2006

© Copyright 2006 Supply-Chain Council, Inc. 50 June 2006
P5.3 Balance Return Resources with Return Requirements The process of developing courses of action that make feasible the commitment the appropriate return resources and or assets to satisfy return requirements. Metrics (see Appendix A for metrics attributes): Balance Return Resources with Return Requirements Cycle Time
The average time associated with balancing return resources and return requirements.
Cost to Balance Return Resources with Return Requirements
The sum of the costs associated with balance of return resources with return requirements.
Best Practices: Advance Planning Engines Applied to Returns
Advanced math model “solvers“ that optimize / minimize constraints, routing, restocking priorities and costs.
Cost Accounting System to Determine the Best Return Process to Follow from a Cost of Business Perspective
ABC costing system
Dynamic Return Restocking Management Dynamic prioritization of restocking plans in order to rapidly re-sell products that are in demand thus reducing new inventory demand.
Inputs: Return Resources from P5.2 Identify, Assess, and Aggregate Return Resources
All resources that add value to, execute, or constrain the processes for the return of a product.
Return Requirements from P5.1 Assess, and Aggregate Return Requirements
As a whole with constituent parts, all sources of demand for the return of a product.
Planning Decision Policies from EP.1 Manage Business Rules for PLAN Processes
Any company policies that affect how a planning process is defined, approved, and performed.
Supply Chain Performance Improvement Plan from EP.2 Manage Performance of Supply Chain
A plan that describes goals and objectives for a supply chain and the steps that will be taken to reach those goals and objectives from the current performance levels.
Outputs: Workflow to P5.4 Establish and Communicate Return Plans
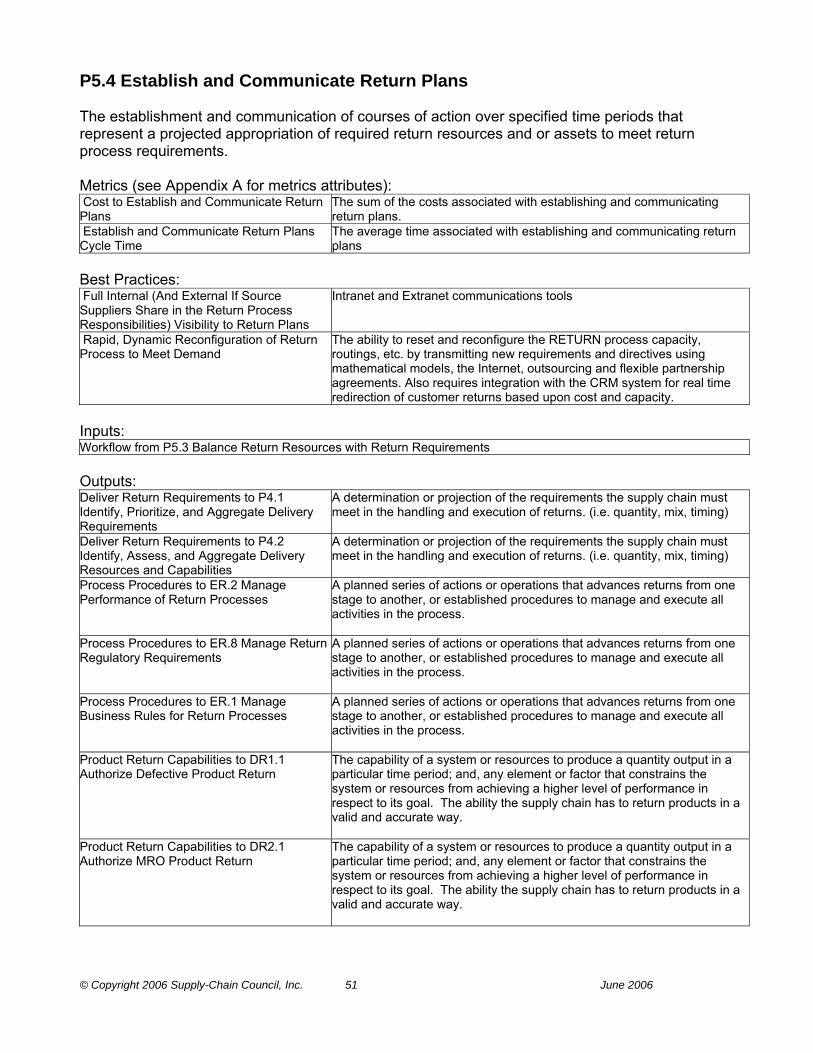
© Copyright 2006 Supply-Chain Council, Inc. 51 June 2006
P5.4 Establish and Communicate Return Plans The establishment and communication of courses of action over specified time periods that represent a projected appropriation of required return resources and or assets to meet return process requirements. Metrics (see Appendix A for metrics attributes): Cost to Establish and Communicate Return Plans
The sum of the costs associated with establishing and communicating return plans.
Establish and Communicate Return Plans Cycle Time
The average time associated with establishing and communicating return plans
Best Practices: Full Internal (And External If Source Suppliers Share in the Return Process Responsibilities) Visibility to Return Plans
Intranet and Extranet communications tools
Rapid, Dynamic Reconfiguration of Return Process to Meet Demand
The ability to reset and reconfigure the RETURN process capacity, routings, etc. by transmitting new requirements and directives using mathematical models, the Internet, outsourcing and flexible partnership agreements. Also requires integration with the CRM system for real time redirection of customer returns based upon cost and capacity.
Inputs: Workflow from P5.3 Balance Return Resources with Return Requirements Outputs: Deliver Return Requirements to P4.1 Identify, Prioritize, and Aggregate Delivery Requirements
A determination or projection of the requirements the supply chain must meet in the handling and execution of returns. (i.e. quantity, mix, timing)
Deliver Return Requirements to P4.2 Identify, Assess, and Aggregate Delivery Resources and Capabilities
A determination or projection of the requirements the supply chain must meet in the handling and execution of returns. (i.e. quantity, mix, timing)
Process Procedures to ER.2 Manage Performance of Return Processes
A planned series of actions or operations that advances returns from one stage to another, or established procedures to manage and execute all activities in the process.
Process Procedures to ER.8 Manage Return Regulatory Requirements
A planned series of actions or operations that advances returns from one stage to another, or established procedures to manage and execute all activities in the process.
Process Procedures to ER.1 Manage Business Rules for Return Processes
A planned series of actions or operations that advances returns from one stage to another, or established procedures to manage and execute all activities in the process.
Product Return Capabilities to DR1.1 Authorize Defective Product Return
The capability of a system or resources to produce a quantity output in a particular time period; and, any element or factor that constrains the system or resources from achieving a higher level of performance in respect to its goal. The ability the supply chain has to return products in a valid and accurate way.
Product Return Capabilities to DR2.1 Authorize MRO Product Return
The capability of a system or resources to produce a quantity output in a particular time period; and, any element or factor that constrains the system or resources from achieving a higher level of performance in respect to its goal. The ability the supply chain has to return products in a valid and accurate way.
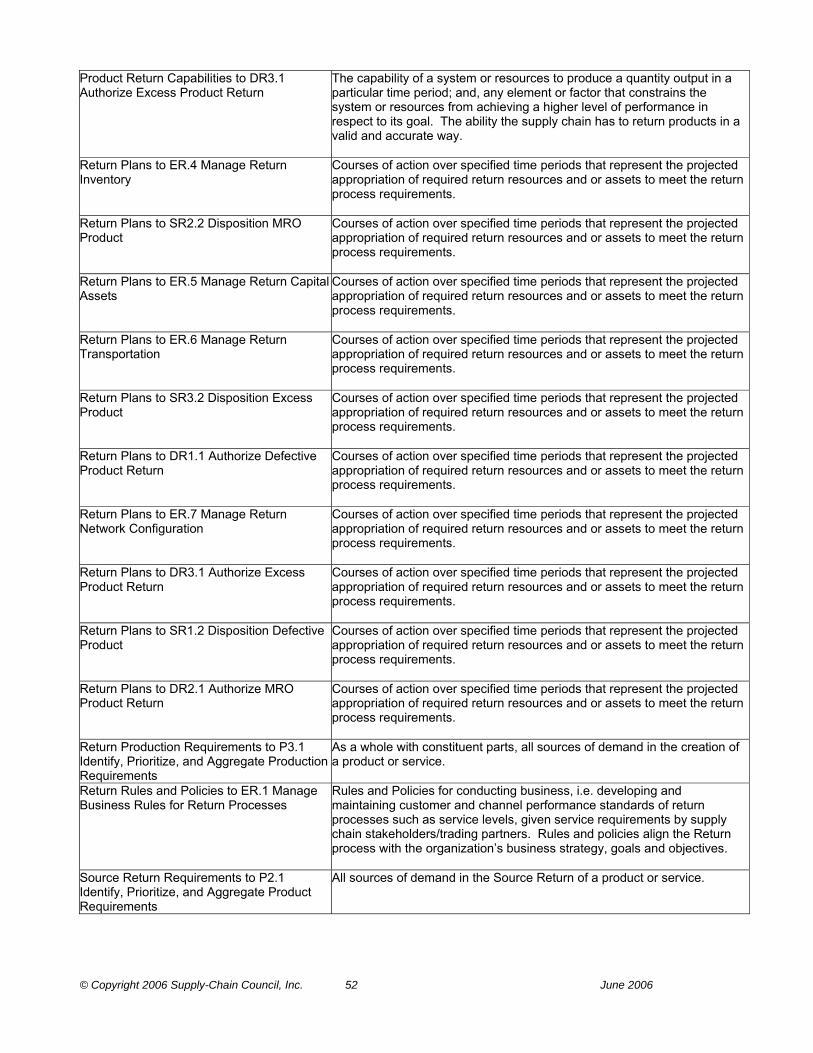
© Copyright 2006 Supply-Chain Council, Inc. 52 June 2006
Product Return Capabilities to DR3.1 Authorize Excess Product Return
The capability of a system or resources to produce a quantity output in a particular time period; and, any element or factor that constrains the system or resources from achieving a higher level of performance in respect to its goal. The ability the supply chain has to return products in a valid and accurate way.
Return Plans to ER.4 Manage Return Inventory
Courses of action over specified time periods that represent the projected appropriation of required return resources and or assets to meet the return process requirements.
Return Plans to SR2.2 Disposition MRO Product
Courses of action over specified time periods that represent the projected appropriation of required return resources and or assets to meet the return process requirements.
Return Plans to ER.5 Manage Return Capital Assets
Courses of action over specified time periods that represent the projected appropriation of required return resources and or assets to meet the return process requirements.
Return Plans to ER.6 Manage Return Transportation
Courses of action over specified time periods that represent the projected appropriation of required return resources and or assets to meet the return process requirements.
Return Plans to SR3.2 Disposition Excess Product
Courses of action over specified time periods that represent the projected appropriation of required return resources and or assets to meet the return process requirements.
Return Plans to DR1.1 Authorize Defective Product Return
Courses of action over specified time periods that represent the projected appropriation of required return resources and or assets to meet the return process requirements.
Return Plans to ER.7 Manage Return Network Configuration
Courses of action over specified time periods that represent the projected appropriation of required return resources and or assets to meet the return process requirements.
Return Plans to DR3.1 Authorize Excess Product Return
Courses of action over specified time periods that represent the projected appropriation of required return resources and or assets to meet the return process requirements.
Return Plans to SR1.2 Disposition Defective Product
Courses of action over specified time periods that represent the projected appropriation of required return resources and or assets to meet the return process requirements.
Return Plans to DR2.1 Authorize MRO Product Return
Courses of action over specified time periods that represent the projected appropriation of required return resources and or assets to meet the return process requirements.
Return Production Requirements to P3.1 Identify, Prioritize, and Aggregate Production Requirements
As a whole with constituent parts, all sources of demand in the creation of a product or service.
Return Rules and Policies to ER.1 Manage Business Rules for Return Processes
Rules and Policies for conducting business, i.e. developing and maintaining customer and channel performance standards of return processes such as service levels, given service requirements by supply chain stakeholders/trading partners. Rules and policies align the Return process with the organization’s business strategy, goals and objectives.
Source Return Requirements to P2.1 Identify, Prioritize, and Aggregate Product Requirements
All sources of demand in the Source Return of a product or service.

© Copyright 2006 Supply-Chain Council, Inc. 53 June 2006
EP Enable PLAN A plan for the development and establishment of courses of action over specified time periods to appropriate delivery resources to meet projected delivery requirements. The plan contains necessary business requirements for information and relationships to effectively and efficiently PLAN the Supply Chain. The Category EP includes nine Level 3 Elements: EP.1 Manage Business Rules for PLAN Processes
The process of establishing, maintaining, and enforcing decision support criteria for Supply Chain Planning which translate to rules for conducting business, i.e. developing and maintaining customer and channel performance standards of an entire supply chain such as service levels, given service requirements by supply chain stakeholders/trading partners. Business rules align PLAN process policies with business strategy, goals, and objectives.
EP.2 Manage Performance of Supply Chain The process of measuring actual integrated Supply Chain performance against internal and/or external standards to develop and implement a course of action to achieve targeted performance levels. Performance targets established for the execution of supply chain processes are reflected in the process elements for PLAN, i.e. cost, delivery reliability, cycle time, responsiveness, and assets.
EP.3 Manage PLAN Data Collection The process of collecting, integrating and maintaining the accuracy of supply chain execution information necessary to plan the balance of supply chain resources to demand requirements at both the highest aggregate and lowest SKU planning levels.
EP.4 Manage Integrated Supply Chain Inventory
The process of establishing total supply chain inventory strategy and planning the total inventory limits or levels (including Raw Material, Work In Process, Finished and Purchased Finished Goods) including replenishment models, ownership, product mix, and stocking locations, both inter and intra company.
EP.5 Manage Integrated Supply Chain Capital Assets
The process of defining capacity strategy (i.e. internal versus contract manufacturing or internal versus 3rd Party Logistics) and then acquiring, maintaining and dispositioning an organization’s capital assets to operate the integrated supply chain.
EP.6 Manage Integrated Supply Chain Transportation
The process of defining an integrated supply chain transportation strategy and maintaining the information which characterizes total supply chain transportation requirements, and the management of transporters both inter and intra company.
EP.7 Manage Planning Configuration The process of defining and maintaining the information about a unique supply chain network for a group of similar or complimentary products through their full life cycle, including the evaluation of market need, product realization (development, introduction and production), product discontinuation, and after-market support. This element also includes the management of critical sub processes needed to manage the life cycle of individual item numbers including item masters, routings, event planning (promotions, etc.), ABC classification, rationalization, and bill of materials.
EP.8 Manage PLAN Regulatory Requirements and Compliance
The process of identifying and complying with regulatory documentation and process standards set by external entities (i.e. government, trade officials, etc.) when planning for the integrated supply chain network.
EP.9 Align Supply Chain Unit Plan with Financial Plan
The process of revising the long-term supply chain capacity and resource plans, given the inputs from the strategic and business plans. This includes revision of not only aggregate forecast and projections related to supply chain, source, make, and delivery plans, but also business assumptions.
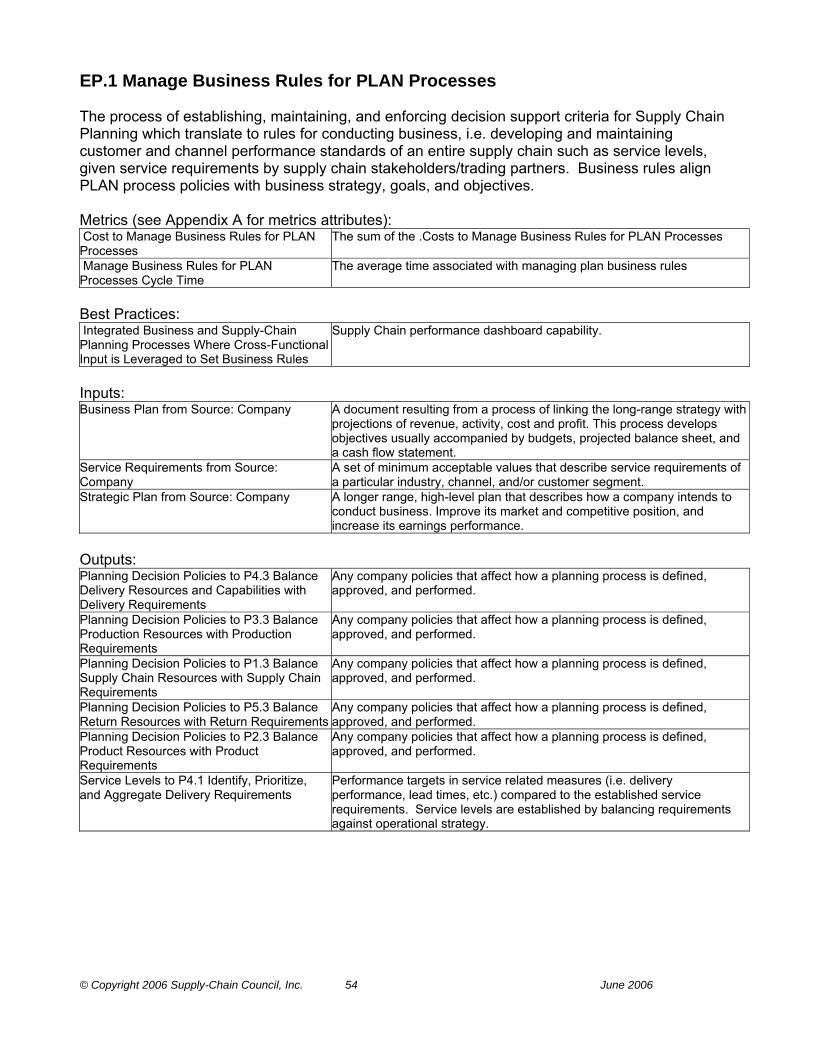
© Copyright 2006 Supply-Chain Council, Inc. 54 June 2006
EP.1 Manage Business Rules for PLAN Processes The process of establishing, maintaining, and enforcing decision support criteria for Supply Chain Planning which translate to rules for conducting business, i.e. developing and maintaining customer and channel performance standards of an entire supply chain such as service levels, given service requirements by supply chain stakeholders/trading partners. Business rules align PLAN process policies with business strategy, goals, and objectives. Metrics (see Appendix A for metrics attributes): Cost to Manage Business Rules for PLAN Processes
The sum of the .Costs to Manage Business Rules for PLAN Processes
Manage Business Rules for PLAN Processes Cycle Time
The average time associated with managing plan business rules
Best Practices: Integrated Business and Supply-Chain Planning Processes Where Cross-Functional Input is Leveraged to Set Business Rules
Supply Chain performance dashboard capability.
Inputs: Business Plan from Source: Company A document resulting from a process of linking the long-range strategy with
projections of revenue, activity, cost and profit. This process develops objectives usually accompanied by budgets, projected balance sheet, and a cash flow statement.
Service Requirements from Source: Company
A set of minimum acceptable values that describe service requirements of a particular industry, channel, and/or customer segment.
Strategic Plan from Source: Company A longer range, high-level plan that describes how a company intends to conduct business. Improve its market and competitive position, and increase its earnings performance.
Outputs: Planning Decision Policies to P4.3 Balance Delivery Resources and Capabilities with Delivery Requirements
Any company policies that affect how a planning process is defined, approved, and performed.
Planning Decision Policies to P3.3 Balance Production Resources with Production Requirements
Any company policies that affect how a planning process is defined, approved, and performed.
Planning Decision Policies to P1.3 Balance Supply Chain Resources with Supply Chain Requirements
Any company policies that affect how a planning process is defined, approved, and performed.
Planning Decision Policies to P5.3 Balance Return Resources with Return Requirements
Any company policies that affect how a planning process is defined, approved, and performed.
Planning Decision Policies to P2.3 Balance Product Resources with Product Requirements
Any company policies that affect how a planning process is defined, approved, and performed.
Service Levels to P4.1 Identify, Prioritize, and Aggregate Delivery Requirements
Performance targets in service related measures (i.e. delivery performance, lead times, etc.) compared to the established service requirements. Service levels are established by balancing requirements against operational strategy.

© Copyright 2006 Supply-Chain Council, Inc. 55 June 2006
EP.2 Manage Performance of Supply Chain The process of measuring actual integrated Supply Chain performance against internal and/or external standards to develop and implement a course of action to achieve targeted performance levels. Performance targets established for the execution of supply chain processes are reflected in the process elements for PLAN, i.e. cost, delivery reliability, cycle time, responsiveness, and assets. Metrics (see Appendix A for metrics attributes): Cost to Manage Performance of Supply Chain
The sum of the costs associated with assessing supplier performance.
Manage Performance of Supply Chain Cycle Time
The average time associated with managing the performance of return activities
Best Practices: Efficient and Effective Benchmarking Process Leveraging Cross Industry Metrics and Definitions
None identified
Reliable Continuous Improvement Process and Methodology.
None identified
Sound Project Management Process and Methodology
None identified
Inputs: Continuous Improvement Process from Source: Company
A process that identifies opportunities for performance improvement and facilitates their realization through the use of metrics, process development methodologies/approaches, project management principles, and reporting tools that support strategic and business plans.
Supply-Chain Performance Metrics from ED.2 Assess Delivery Performance
Standard measures that indicate how well a supply chain performs within certain categories of performance known as Performance Attributes, e.g. delivery reliability, flexibility and responsiveness, cost, and asset management.
Supply-Chain Performance Metrics from ES.4 Manage Product Inventory
Standard measures that indicate how well a supply chain performs within certain categories of performance known as Performance Attributes, e.g. delivery reliability, flexibility and responsiveness, cost, and asset management.
Supply-Chain Performance Metrics from ER.2 Manage Performance of Return Processes
Standard measures that indicate how well a supply chain performs within certain categories of performance known as Performance Attributes, e.g. delivery reliability, flexibility and responsiveness, cost, and asset management.
Supply-Chain Performance Metrics from EM.2 Manage Production Performance
Standard measures that indicate how well a supply chain performs within certain categories of performance known as Performance Attributes, e.g. delivery reliability, flexibility and responsiveness, cost, and asset management.
Outputs: Return Process Capabilities to P5.2 Identify, Assess, and Aggregate Return Resources
The capability of a system or resources to produce a quantity output in a particular time period
Supply Chain Performance Improvement Plan to P1.3 Balance Supply Chain Resources with Supply Chain Requirements
A plan that describes goals and objectives for a supply chain and the steps that will be taken to reach those goals and objectives from the current performance levels.
Supply Chain Performance Improvement Plan to P5.3 Balance Return Resources with Return Requirements
A plan that describes goals and objectives for a supply chain and the steps that will be taken to reach those goals and objectives from the current performance levels.

© Copyright 2006 Supply-Chain Council, Inc. 56 June 2006
EP.3 Manage PLAN Data Collection The process of collecting, integrating and maintaining the accuracy of supply chain execution information necessary to plan the balance of supply chain resources to demand requirements at both the highest aggregate and lowest SKU planning levels. Each occurrence consumes time: Metrics (see Appendix A for metrics attributes): Cost to Manage PLAN Data Collection The sum of the costs to Manage PLAN Data Collection. Manage PLAN Data Collection Cycle Time The average time associated with collecting plan data Best Practices: Integrated Demand and Supply Planning - Demand Planning, Supply Planning and especially the Supply Plan Execution Are no longer disconnected. All required planning and execution data is integrated and shared in between all functional areas within an organization.
Memory based planning systems provide one single data model and data mart (including the business rules) for the entire supply chain planning and execution process. Algorithms use the business rules as the driver for the planning engine.
Single Data Source for Decision Support and Business Rules
A data warehouse/data mart is the source of all planning (master) data, business rules and transaction data. Analyzing tools enable the ongoing maintenance and improvement of the business rules based on actual data.
Inputs: Supply Chain Execution Data from Source: Company
Information necessary to plan the balance of supply chain resources to demand requirements at both the highest aggregate and lowest SKU planning levels.
Outputs: Planning Data to P4.2 Identify, Assess, and Aggregate Delivery Resources and Capabilities
Execution information necessary to plan the balance of supply chain resources to demand requirements at both the highest aggregate and lowest SKU planning levels.
Planning Data to P5.1 Assess, and Aggregate Return Requirements
Execution information necessary to plan the balance of supply chain resources to demand requirements at both the highest aggregate and lowest SKU planning levels.
Planning Data to P1.2 Identify, Assess, and Aggregate Supply Chain Resources
Execution information necessary to plan the balance of supply chain resources to demand requirements at both the highest aggregate and lowest SKU planning levels.
Planning Data to P1.1 Identify, Prioritize, and Aggregate Supply Chain Requirements
Execution information necessary to plan the balance of supply chain resources to demand requirements at both the highest aggregate and lowest SKU planning levels.
Planning Data to P2.2 Identify, Assess, And Aggregate Product Resources
Execution information necessary to plan the balance of supply chain resources to demand requirements at both the highest aggregate and lowest SKU planning levels.
Planning Data to P3.1 Identify, Prioritize, and Aggregate Production Requirements
Execution information necessary to plan the balance of supply chain resources to demand requirements at both the highest aggregate and lowest SKU planning levels.
Planning Data to P5.2 Identify, Assess, and Aggregate Return Resources
Execution information necessary to plan the balance of supply chain resources to demand requirements at both the highest aggregate and lowest SKU planning levels.
Planning Data to P4.1 Identify, Prioritize, and Aggregate Delivery Requirements
Execution information necessary to plan the balance of supply chain resources to demand requirements at both the highest aggregate and lowest SKU planning levels.
Planning Data to P2.1 Identify, Prioritize, andAggregate Product Requirements
Execution information necessary to plan the balance of supply chain resources to demand requirements at both the highest aggregate and lowest SKU planning levels.

© Copyright 2006 Supply-Chain Council, Inc. 57 June 2006
Planning Data to P3.2 Identify, Assess, and Aggregate Production Resources
Execution information necessary to plan the balance of supply chain resources to demand requirements at both the highest aggregate and lowest SKU planning levels.
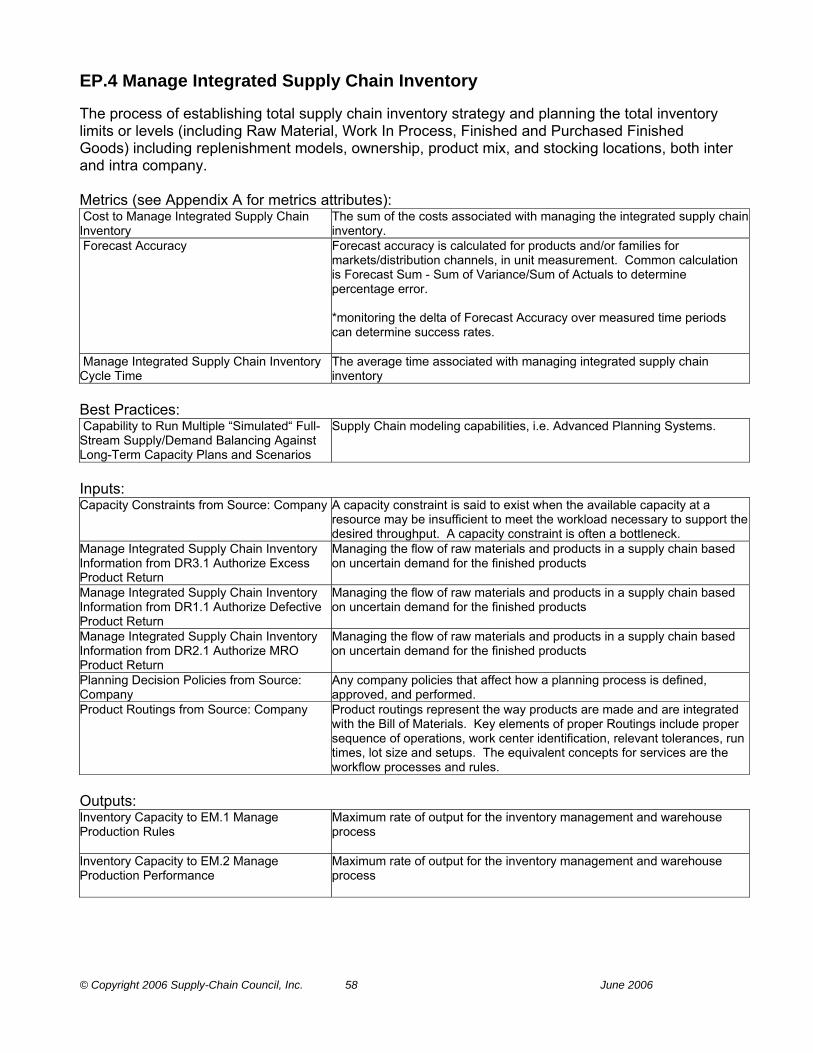
© Copyright 2006 Supply-Chain Council, Inc. 58 June 2006
EP.4 Manage Integrated Supply Chain Inventory The process of establishing total supply chain inventory strategy and planning the total inventory limits or levels (including Raw Material, Work In Process, Finished and Purchased Finished Goods) including replenishment models, ownership, product mix, and stocking locations, both inter and intra company. Metrics (see Appendix A for metrics attributes): Cost to Manage Integrated Supply Chain Inventory
The sum of the costs associated with managing the integrated supply chain inventory.
Forecast Accuracy Forecast accuracy is calculated for products and/or families for markets/distribution channels, in unit measurement. Common calculation is Forecast Sum - Sum of Variance/Sum of Actuals to determine percentage error. *monitoring the delta of Forecast Accuracy over measured time periods can determine success rates.
Manage Integrated Supply Chain Inventory Cycle Time
The average time associated with managing integrated supply chain inventory
Best Practices: Capability to Run Multiple “Simulated“ Full-Stream Supply/Demand Balancing Against Long-Term Capacity Plans and Scenarios
Supply Chain modeling capabilities, i.e. Advanced Planning Systems.
Inputs: Capacity Constraints from Source: Company A capacity constraint is said to exist when the available capacity at a
resource may be insufficient to meet the workload necessary to support the desired throughput. A capacity constraint is often a bottleneck.
Manage Integrated Supply Chain Inventory Information from DR3.1 Authorize Excess Product Return
Managing the flow of raw materials and products in a supply chain based on uncertain demand for the finished products
Manage Integrated Supply Chain Inventory Information from DR1.1 Authorize Defective Product Return
Managing the flow of raw materials and products in a supply chain based on uncertain demand for the finished products
Manage Integrated Supply Chain Inventory Information from DR2.1 Authorize MRO Product Return
Managing the flow of raw materials and products in a supply chain based on uncertain demand for the finished products
Planning Decision Policies from Source: Company
Any company policies that affect how a planning process is defined, approved, and performed.
Product Routings from Source: Company Product routings represent the way products are made and are integrated with the Bill of Materials. Key elements of proper Routings include proper sequence of operations, work center identification, relevant tolerances, run times, lot size and setups. The equivalent concepts for services are the workflow processes and rules.
Outputs: Inventory Capacity to EM.1 Manage Production Rules
Maximum rate of output for the inventory management and warehouse process
Inventory Capacity to EM.2 Manage Production Performance
Maximum rate of output for the inventory management and warehouse process

© Copyright 2006 Supply-Chain Council, Inc. 59 June 2006
Inventory Strategy to P5.2 Identify, Assess, and Aggregate Return Resources
The total supply chain inventory strategy. Contains the plan for total inventory limits or levels (including Raw Material, Work In Process, Finished and Purchased Finished Goods) including replenishment models, ownership, product mix, and stocking locations, both inter and intra company.
Inventory Strategy to P1.3 Balance Supply Chain Resources with Supply Chain Requirements
The total supply chain inventory strategy. Contains the plan for total inventory limits or levels (including Raw Material, Work In Process, Finished and Purchased Finished Goods) including replenishment models, ownership, product mix, and stocking locations, both inter and intra company.
Manage Integrated Supply Chain Inventory Information to DR1.1 Authorize Defective Product Return
Managing the flow of raw materials and products in a supply chain based on uncertain demand for the finished products
Manage Integrated Supply Chain Inventory Information to DR3.1 Authorize Excess Product Return
Managing the flow of raw materials and products in a supply chain based on uncertain demand for the finished products
Manage Integrated Supply Chain Inventory Information to DR2.1 Authorize MRO Product Return
Managing the flow of raw materials and products in a supply chain based on uncertain demand for the finished products
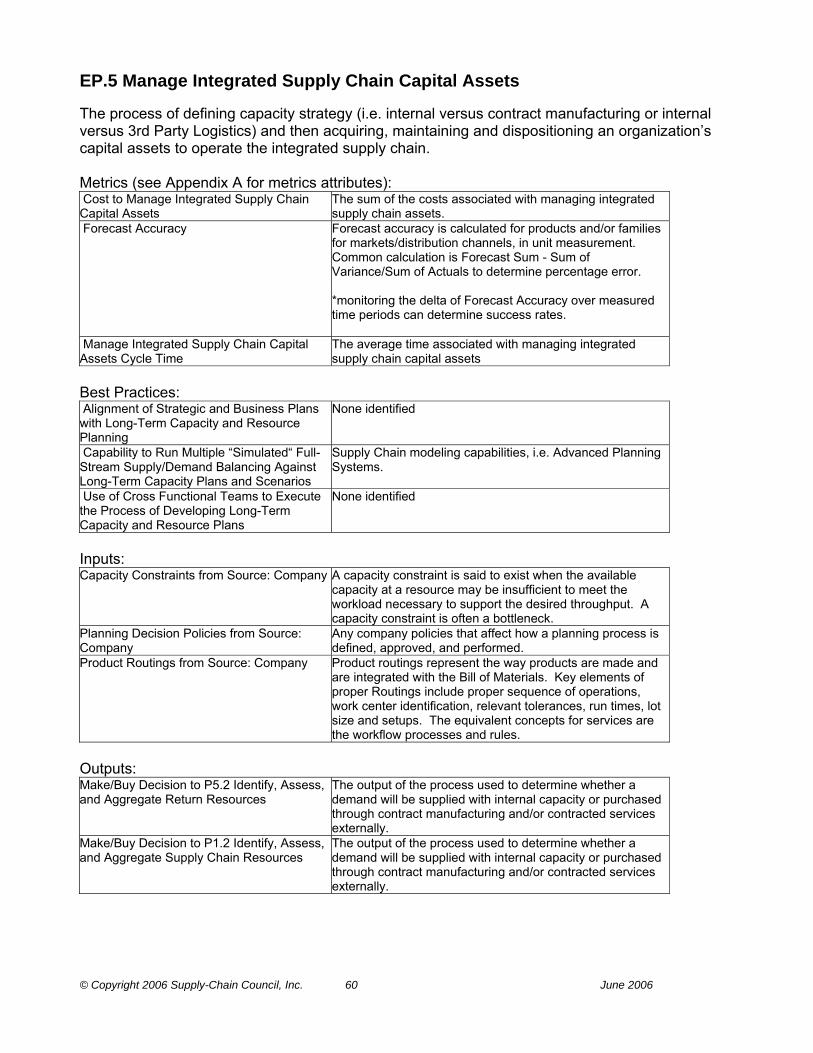
© Copyright 2006 Supply-Chain Council, Inc. 60 June 2006
EP.5 Manage Integrated Supply Chain Capital Assets The process of defining capacity strategy (i.e. internal versus contract manufacturing or internal versus 3rd Party Logistics) and then acquiring, maintaining and dispositioning an organization’s capital assets to operate the integrated supply chain. Metrics (see Appendix A for metrics attributes): Cost to Manage Integrated Supply Chain Capital Assets
The sum of the costs associated with managing integrated supply chain assets.
Forecast Accuracy Forecast accuracy is calculated for products and/or families for markets/distribution channels, in unit measurement. Common calculation is Forecast Sum - Sum of Variance/Sum of Actuals to determine percentage error. *monitoring the delta of Forecast Accuracy over measured time periods can determine success rates.
Manage Integrated Supply Chain Capital Assets Cycle Time
The average time associated with managing integrated supply chain capital assets
Best Practices: Alignment of Strategic and Business Plans with Long-Term Capacity and Resource Planning
None identified
Capability to Run Multiple “Simulated“ Full-Stream Supply/Demand Balancing Against Long-Term Capacity Plans and Scenarios
Supply Chain modeling capabilities, i.e. Advanced Planning Systems.
Use of Cross Functional Teams to Execute the Process of Developing Long-Term Capacity and Resource Plans
None identified
Inputs: Capacity Constraints from Source: Company A capacity constraint is said to exist when the available
capacity at a resource may be insufficient to meet the workload necessary to support the desired throughput. A capacity constraint is often a bottleneck.
Planning Decision Policies from Source: Company
Any company policies that affect how a planning process is defined, approved, and performed.
Product Routings from Source: Company Product routings represent the way products are made and are integrated with the Bill of Materials. Key elements of proper Routings include proper sequence of operations, work center identification, relevant tolerances, run times, lot size and setups. The equivalent concepts for services are the workflow processes and rules.
Outputs: Make/Buy Decision to P5.2 Identify, Assess, and Aggregate Return Resources
The output of the process used to determine whether a demand will be supplied with internal capacity or purchased through contract manufacturing and/or contracted services externally.
Make/Buy Decision to P1.2 Identify, Assess, and Aggregate Supply Chain Resources
The output of the process used to determine whether a demand will be supplied with internal capacity or purchased through contract manufacturing and/or contracted services externally.

© Copyright 2006 Supply-Chain Council, Inc. 61 June 2006
Outsource Plan to P1.2 Identify, Assess, and Aggregate Supply Chain Resources
A plan that describes how a company will utilize third party business partners to provide products and services which the company chooses not to provide with internal capacity. Outsource Plans can vary in detail from simple policy statements to highly detailed plans with specifics about the third party business partners, specifications for products and services, performance expectations, and contract considerations.
Production Capacity to EM.2 Manage Production Performance
The highest, sustainable output rate which can be achieved with the current product specifications, product mix, worker effort, plant, and equipment.
Production Capacity to EM.1 Manage Production Rules
The highest, sustainable output rate which can be achieved with the current product specifications, product mix, worker effort, plant, and equipment.
Projected Internal and External Capacity An estimate of the amount of product or service a particular part of the business (internal capacity) or a third party business partner (external capacity) is capable of producing over a particular period of time when all factors that control the production processes are working optimally.
Revised Business Assumptions to P5.1 Assess, and Aggregate Return Requirements
An update to the expected cause and effect statements that are the base for the Revised Aggregate Forecast and Projections. These are reviewed periodically with actual results to verify the linkage of actual cause and effect.
Revised Business Assumptions to P1.1 Identify, Prioritize, and Aggregate Supply Chain Requirements
An update to the expected cause and effect statements that are the base for the Revised Aggregate Forecast and Projections. These are reviewed periodically with actual results to verify the linkage of actual cause and effect.
Revised Capital Plan to P5.2 Identify, Assess, and Aggregate Return Resources
A revision to plan for capital expenditures necessitated by either changes in specific business plans or factors and assumptions affecting a business plan.
Revised Capital Plan to P1.2 Identify, Assess, and Aggregate Supply Chain Resources
A revision to plan for capital expenditures necessitated by either changes in specific business plans or factors and assumptions affecting a business plan.
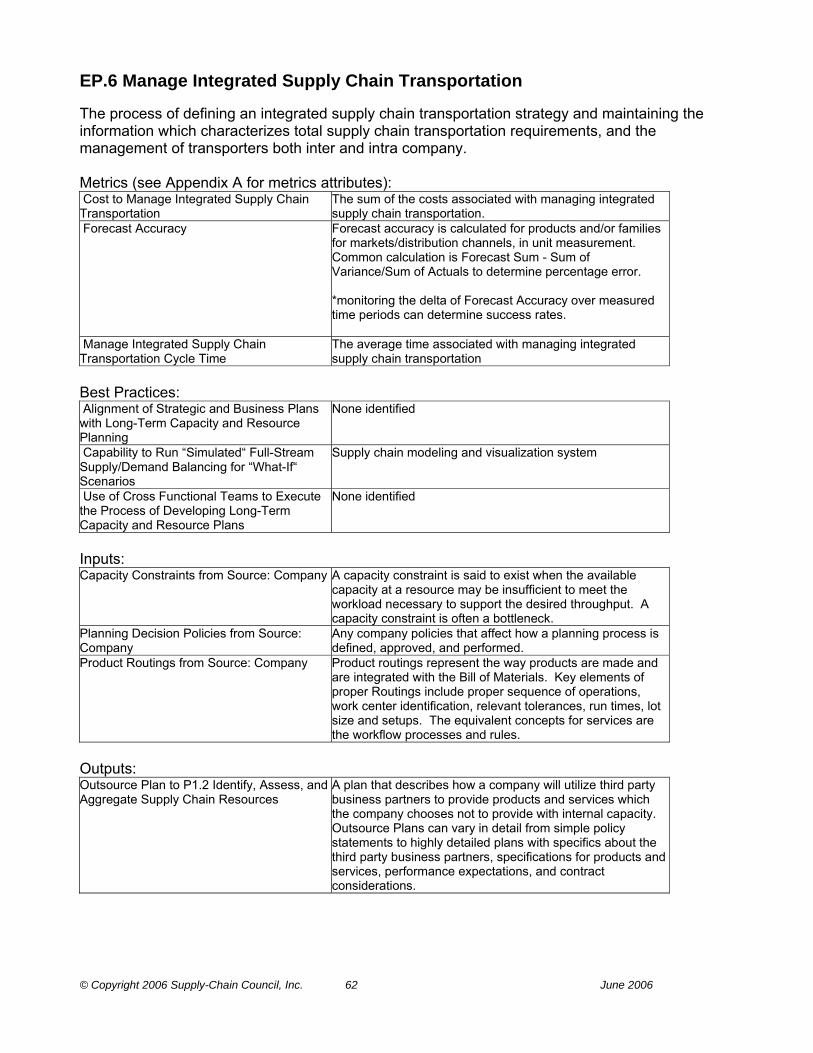
© Copyright 2006 Supply-Chain Council, Inc. 62 June 2006
EP.6 Manage Integrated Supply Chain Transportation The process of defining an integrated supply chain transportation strategy and maintaining the information which characterizes total supply chain transportation requirements, and the management of transporters both inter and intra company. Metrics (see Appendix A for metrics attributes): Cost to Manage Integrated Supply Chain Transportation
The sum of the costs associated with managing integrated supply chain transportation.
Forecast Accuracy Forecast accuracy is calculated for products and/or families for markets/distribution channels, in unit measurement. Common calculation is Forecast Sum - Sum of Variance/Sum of Actuals to determine percentage error. *monitoring the delta of Forecast Accuracy over measured time periods can determine success rates.
Manage Integrated Supply Chain Transportation Cycle Time
The average time associated with managing integrated supply chain transportation
Best Practices: Alignment of Strategic and Business Plans with Long-Term Capacity and Resource Planning
None identified
Capability to Run “Simulated“ Full-Stream Supply/Demand Balancing for “What-If“ Scenarios
Supply chain modeling and visualization system
Use of Cross Functional Teams to Execute the Process of Developing Long-Term Capacity and Resource Plans
None identified
Inputs: Capacity Constraints from Source: Company A capacity constraint is said to exist when the available
capacity at a resource may be insufficient to meet the workload necessary to support the desired throughput. A capacity constraint is often a bottleneck.
Planning Decision Policies from Source: Company
Any company policies that affect how a planning process is defined, approved, and performed.
Product Routings from Source: Company Product routings represent the way products are made and are integrated with the Bill of Materials. Key elements of proper Routings include proper sequence of operations, work center identification, relevant tolerances, run times, lot size and setups. The equivalent concepts for services are the workflow processes and rules.
Outputs: Outsource Plan to P1.2 Identify, Assess, and Aggregate Supply Chain Resources
A plan that describes how a company will utilize third party business partners to provide products and services which the company chooses not to provide with internal capacity. Outsource Plans can vary in detail from simple policy statements to highly detailed plans with specifics about the third party business partners, specifications for products and services, performance expectations, and contract considerations.
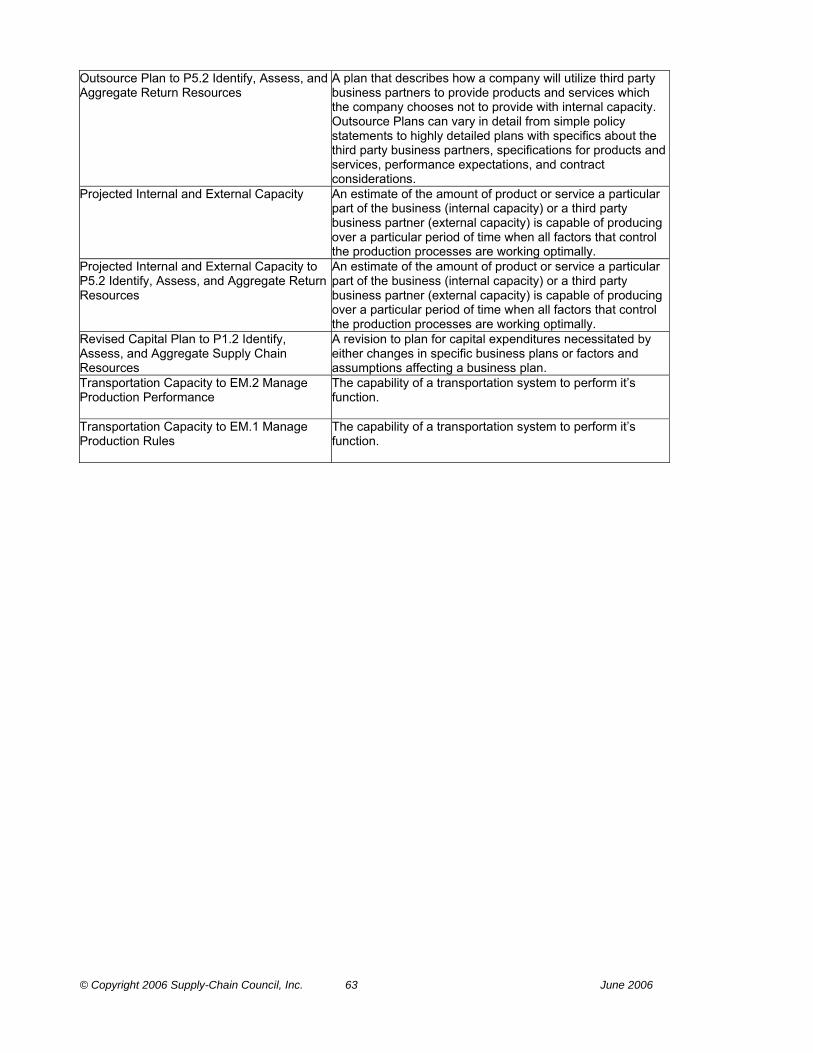
© Copyright 2006 Supply-Chain Council, Inc. 63 June 2006
Outsource Plan to P5.2 Identify, Assess, and Aggregate Return Resources
A plan that describes how a company will utilize third party business partners to provide products and services which the company chooses not to provide with internal capacity. Outsource Plans can vary in detail from simple policy statements to highly detailed plans with specifics about the third party business partners, specifications for products and services, performance expectations, and contract considerations.
Projected Internal and External Capacity An estimate of the amount of product or service a particular part of the business (internal capacity) or a third party business partner (external capacity) is capable of producing over a particular period of time when all factors that control the production processes are working optimally.
Projected Internal and External Capacity to P5.2 Identify, Assess, and Aggregate Return Resources
An estimate of the amount of product or service a particular part of the business (internal capacity) or a third party business partner (external capacity) is capable of producing over a particular period of time when all factors that control the production processes are working optimally.
Revised Capital Plan to P1.2 Identify, Assess, and Aggregate Supply Chain Resources
A revision to plan for capital expenditures necessitated by either changes in specific business plans or factors and assumptions affecting a business plan.
Transportation Capacity to EM.2 Manage Production Performance
The capability of a transportation system to perform it’s function.
Transportation Capacity to EM.1 Manage Production Rules
The capability of a transportation system to perform it’s function.
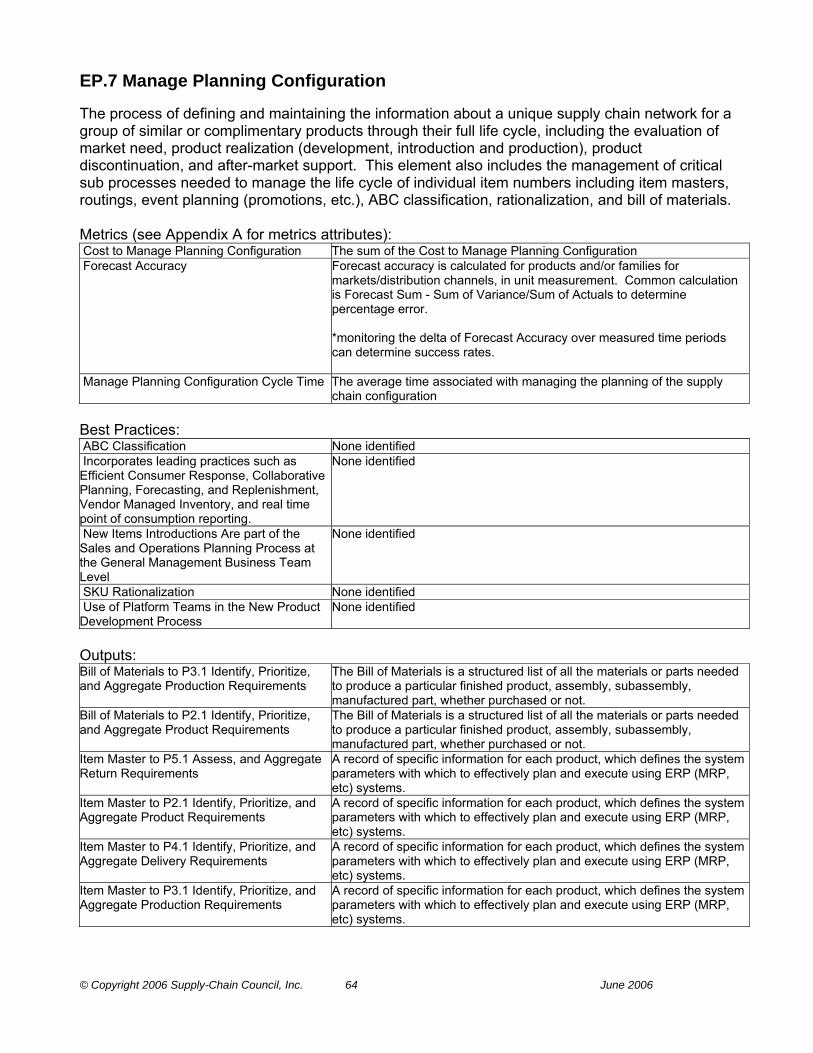
© Copyright 2006 Supply-Chain Council, Inc. 64 June 2006
EP.7 Manage Planning Configuration The process of defining and maintaining the information about a unique supply chain network for a group of similar or complimentary products through their full life cycle, including the evaluation of market need, product realization (development, introduction and production), product discontinuation, and after-market support. This element also includes the management of critical sub processes needed to manage the life cycle of individual item numbers including item masters, routings, event planning (promotions, etc.), ABC classification, rationalization, and bill of materials. Metrics (see Appendix A for metrics attributes): Cost to Manage Planning Configuration The sum of the Cost to Manage Planning Configuration Forecast Accuracy Forecast accuracy is calculated for products and/or families for
markets/distribution channels, in unit measurement. Common calculation is Forecast Sum - Sum of Variance/Sum of Actuals to determine percentage error. *monitoring the delta of Forecast Accuracy over measured time periods can determine success rates.
Manage Planning Configuration Cycle Time The average time associated with managing the planning of the supply chain configuration
Best Practices: ABC Classification None identified Incorporates leading practices such as Efficient Consumer Response, Collaborative Planning, Forecasting, and Replenishment, Vendor Managed Inventory, and real time point of consumption reporting.
None identified
New Items Introductions Are part of the Sales and Operations Planning Process at the General Management Business Team Level
None identified
SKU Rationalization None identified Use of Platform Teams in the New Product Development Process
None identified
Outputs: Bill of Materials to P3.1 Identify, Prioritize, and Aggregate Production Requirements
The Bill of Materials is a structured list of all the materials or parts needed to produce a particular finished product, assembly, subassembly, manufactured part, whether purchased or not.
Bill of Materials to P2.1 Identify, Prioritize, and Aggregate Product Requirements
The Bill of Materials is a structured list of all the materials or parts needed to produce a particular finished product, assembly, subassembly, manufactured part, whether purchased or not.
Item Master to P5.1 Assess, and Aggregate Return Requirements
A record of specific information for each product, which defines the system parameters with which to effectively plan and execute using ERP (MRP, etc) systems.
Item Master to P2.1 Identify, Prioritize, and Aggregate Product Requirements
A record of specific information for each product, which defines the system parameters with which to effectively plan and execute using ERP (MRP, etc) systems.
Item Master to P4.1 Identify, Prioritize, and Aggregate Delivery Requirements
A record of specific information for each product, which defines the system parameters with which to effectively plan and execute using ERP (MRP, etc) systems.
Item Master to P3.1 Identify, Prioritize, and Aggregate Production Requirements
A record of specific information for each product, which defines the system parameters with which to effectively plan and execute using ERP (MRP, etc) systems.
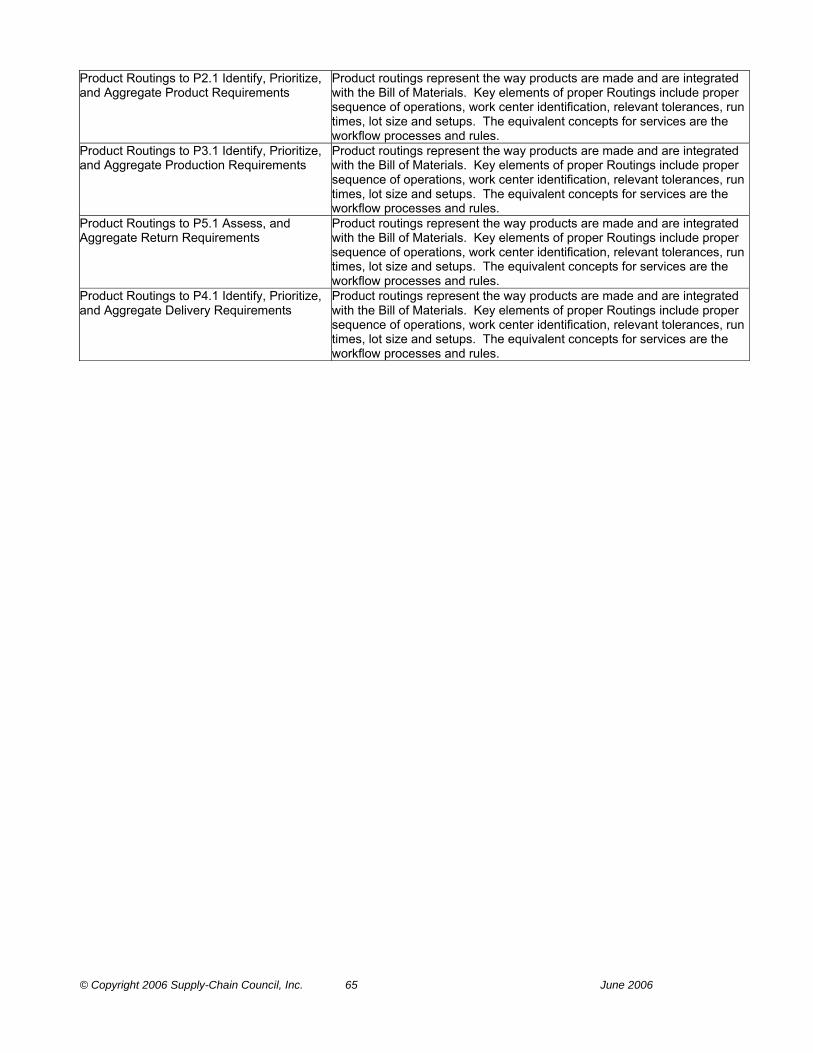
© Copyright 2006 Supply-Chain Council, Inc. 65 June 2006
Product Routings to P2.1 Identify, Prioritize, and Aggregate Product Requirements
Product routings represent the way products are made and are integrated with the Bill of Materials. Key elements of proper Routings include proper sequence of operations, work center identification, relevant tolerances, run times, lot size and setups. The equivalent concepts for services are the workflow processes and rules.
Product Routings to P3.1 Identify, Prioritize, and Aggregate Production Requirements
Product routings represent the way products are made and are integrated with the Bill of Materials. Key elements of proper Routings include proper sequence of operations, work center identification, relevant tolerances, run times, lot size and setups. The equivalent concepts for services are the workflow processes and rules.
Product Routings to P5.1 Assess, and Aggregate Return Requirements
Product routings represent the way products are made and are integrated with the Bill of Materials. Key elements of proper Routings include proper sequence of operations, work center identification, relevant tolerances, run times, lot size and setups. The equivalent concepts for services are the workflow processes and rules.
Product Routings to P4.1 Identify, Prioritize, and Aggregate Delivery Requirements
Product routings represent the way products are made and are integrated with the Bill of Materials. Key elements of proper Routings include proper sequence of operations, work center identification, relevant tolerances, run times, lot size and setups. The equivalent concepts for services are the workflow processes and rules.
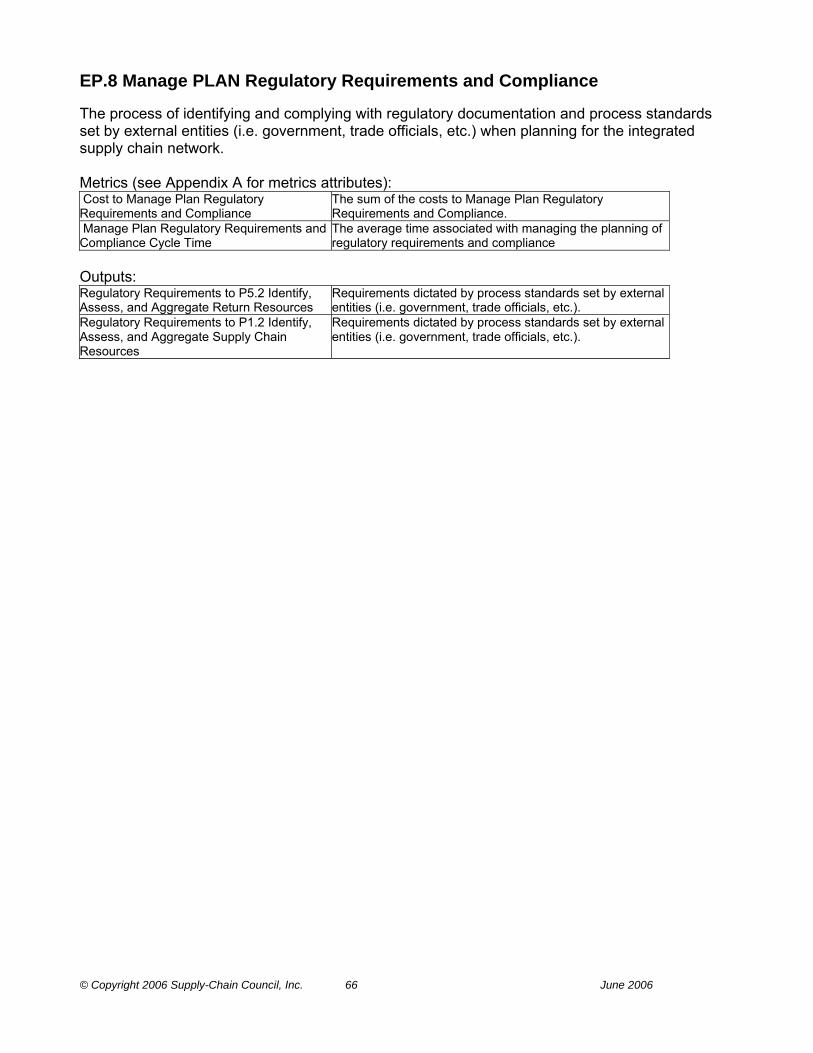
© Copyright 2006 Supply-Chain Council, Inc. 66 June 2006
EP.8 Manage PLAN Regulatory Requirements and Compliance The process of identifying and complying with regulatory documentation and process standards set by external entities (i.e. government, trade officials, etc.) when planning for the integrated supply chain network. Metrics (see Appendix A for metrics attributes): Cost to Manage Plan Regulatory Requirements and Compliance
The sum of the costs to Manage Plan Regulatory Requirements and Compliance.
Manage Plan Regulatory Requirements and Compliance Cycle Time
The average time associated with managing the planning of regulatory requirements and compliance
Outputs: Regulatory Requirements to P5.2 Identify, Assess, and Aggregate Return Resources
Requirements dictated by process standards set by external entities (i.e. government, trade officials, etc.).
Regulatory Requirements to P1.2 Identify, Assess, and Aggregate Supply Chain Resources
Requirements dictated by process standards set by external entities (i.e. government, trade officials, etc.).

© Copyright 2006 Supply-Chain Council, Inc. 67 June 2006
EP.9 Align Supply Chain Unit Plan with Financial Plan The process of revising the long-term supply chain capacity and resource plans, given the inputs from the strategic and business plans. This includes revision of not only aggregate forecast and projections related to supply chain, source, make, and delivery plans, but also business assumptions. Metrics (see Appendix A for metrics attributes): Align Supply Chain Unit Plan with Financial Plan Cycle Time
The average time associated with aligning the supply chain unit plan with the financial plan
Cost to Align Supply Chain Unit Plan with Financial Plan
The sum of the costs associated with aligning supply chain performance plans with financial plans.
Best Practices: Re-Planning Process Exists in Multi-Levels of the Supply-Chain between Business Enterprises
Business to business Internet capability to share common data.
Re-Planning Process Links the Supply Chain Operation with the Business Strategy and the Marketing Strategy
None identified
Strategic Sales and Operations Planning Process in Place and Managed at the Executive Level
None identified
Inputs: Business Plan from Source: Company A document resulting from a process of linking the long-range strategy with
projections of revenue, activity, cost and profit. This process develops objectives usually accompanied by budgets, projected balance sheet, and a cash flow statement.
Strategic Plan from Source: Company A longer range, high-level plan that describes how a company intends to conduct business. Improve its market and competitive position, and increase its earnings performance.
Outputs: Budget Constraints to P5.2 Identify, Assess, and Aggregate Return Resources
A plan that includes an estimate of future costs and revenues related to expected activities. The budget serves as pattern for and a control over future operations.
Revised Aggregate Forecast and Projections to P5.1 Assess, and Aggregate Return Requirements
An update to the aggregate Supply-Chain Forecasts of Demand by Product Family supporting the Market/Channel Plans. Corresponding Projections, supporting Make, Source, Deliver, Inventory and Response Time Plans through the Supply-Chain are produced from these Forecasts Together, they represent balanced Supply and Demand.
Revised Aggregate Forecast and Projections to P1.1 Identify, Prioritize, and Aggregate Supply Chain Requirements
An update to the aggregate Supply-Chain Forecasts of Demand by Product Family supporting the Market/Channel Plans. Corresponding Projections, supporting Make, Source, Deliver, Inventory and Response Time Plans through the Supply-Chain are produced from these Forecasts Together, they represent balanced Supply and Demand.
Revised Business Assumptions to P5.1 Assess, and Aggregate Return Requirements
An update to the expected cause and effect statements that are the base for the Revised Aggregate Forecast and Projections. These are reviewed periodically with actual results to verify the linkage of actual cause and effect.
Revised Business Assumptions to P1.1 Identify, Prioritize, and Aggregate Supply Chain Requirements
An update to the expected cause and effect statements that are the base for the Revised Aggregate Forecast and Projections. These are reviewed periodically with actual results to verify the linkage of actual cause and effect.

© Copyright 2006 Supply-Chain Council, Inc. 68 June 2006
S1 Source Stocked Product The procurement, delivery, receipt and transfer of raw material items, subassemblies, product and or services. The Category S1 includes five Level 3 Elements: S1.1 Schedule Product Deliveries Scheduling and managing the execution of the individual deliveries of
product against an existing contract or purchase order. The requirements for product releases are determined based on the detailed sourcing plan or other types of product pull signals.
S1.2 Receive Product The process and associated activities of receiving product to contract requirements.
S1.3 Verify Product The process and actions required determining product conformance to requirements and criteria.
S1.4 Transfer Product The transfer of accepted product to the appropriate stocking location within the supply chain. This includes all of the activities associated with repackaging, staging, transferring and stocking product. For service this is the transfer or application of service to the final customer or end user.
S1.5 Authorize Supplier Payment The process of authorizing payments and paying suppliers for product or services. This process includes invoice collection, invoice matching and the issuance of checks.
Metrics (see Appendix A for metrics attributes): Cost to Source The sum of the costs associated with Source. Inventory Days of Supply (Raw Material ) Value of raw materials ÷ (COGS ÷ 365). Order Fulfillment Cycle Time The average actual cycle time consistently achieved to fulfill customer
orders. Product Acquisition Costs Product acquisition costs include costs incurred for the production of
product: sum of product management and planning, supplier quality engineering, inbound freight and duties, receiving and product storage, incoming inspection, product process engineering and tooling costs.
Return on Supply Chain Fixed Assets Return on Supply Chain Fixed Assets measures the return an organization receives on its invested capital in supply chain fixed assets. This includes the fixed assets used in Plan, Source, Make, Deliver, and Return. The levels of aggregation can be at any element associated with a supply chain asset.
Return on Working Capital Return on working capital is a measurement which assesses the magnitude of investment relative to a company’s working capital position verses the revenue generated from a supply chain. Components include accounts receivable, accounts payable, inventory, supply chain revenue, cost of goods sold and supply chain management costs.
Source Cycle Time The average time associated with Source Processes Best Practices: Alliance and Leverage Agreements None identified Joint Service Agreements (JSA) Collaborative Planning Systems Postponement Postponement (delayed differentiation) is a supply chain concept where a
product is kept as long as possible in a generic state. Differentiation of the generic product into a specific end-product is shifted closer to the consumer by postponing identify changes, such as assembly or packaging, to the last possible supply chain location.

© Copyright 2006 Supply-Chain Council, Inc. 69 June 2006
S1.1 Schedule Product Deliveries Scheduling and managing the execution of the individual deliveries of product against an existing contract or purchase order. The requirements for product releases are determined based on the detailed sourcing plan or other types of product pull signals. Each occurrence consumes time: Metrics (see Appendix A for metrics attributes): % Schedules Changed within Supplier’s Lead Time
The number of schedules that are changed within the suppliers lead-time divided by the total number of schedules generated within the measurement period
Average Days per Engineering Change # of days each engineering change impacts the delivery date divided by the total # of changes.
Average Days per Schedule Change # of days each schedule change impacts the delivery date divided by the total # of changes.
Average Release Cycle of Changes Cycle time for implementing change notices divided by total number of changes.
Cost to Schedule Product Deliveries The sum of the costs associated with scheduling product deliveries. Schedule Product Deliveries Cycle Time The average time associated with scheduling the shipment of the return of
MRO product Best Practices: Advanced Ship Notices Allow for Tight Synchronization between Source and Make Processes
Blanket order support with scheduling interfaces to external supplier systems
Consignment Agreements Are Used to Reduce Assets and Cycle Time While Increasing the Availability of Critical Items
Consignment inventory management
Mechanical (Kanban) Pull Signals Are Used to Notify Suppliers of the Need to Deliver Product
Electronic Kanban support
Utilize EDI Transactions to Reduce Cycle Time and Costs
EDI interface for 830, 850, 856 & 862 transactions
Inputs: Logistics Selection from ES.6 Manage Incoming Product
Carrier selection and management for inbound or outbound shipments (linked to terms of delivery)
Production Schedule from M2.1 Schedule Production Activities
A plan that authorizes the factory to manufacture or repair a certain quantity of a specific item.
Production Schedule from M3.2 Schedule Production Activities
A plan that authorizes the factory to manufacture or repair a certain quantity of a specific item.
Production Schedule from M1.1 Schedule Production Activities
A plan that authorizes the factory to manufacture or repair a certain quantity of a specific item.
Replenishment Signal from M3.3 Issue Sourced/In-Process Product
Any signal that indicates when to produce or transport Items in a pull replenishment system.
Replenishment Signal from D1.3 Reserve Inventory & Determine Delivery Date
Any signal that indicates when to produce or transport Items in a pull replenishment system.
Replenishment Signal from M2.2 Issue Sourced/In-Process Product
Any signal that indicates when to produce or transport Items in a pull replenishment system.
Replenishment Signal from M1.2 Issue Material
Any signal that indicates when to produce or transport Items in a pull replenishment system.

© Copyright 2006 Supply-Chain Council, Inc. 70 June 2006
Return Inventory Transfer Data from DR3.4 Transfer Excess Product
The process of receipt and verification of the returned item against the return authorization and other documentation and prepares the item for transfer.
Return Inventory Transfer Data from DR2.4 Transfer MRO Product
The process of receipt and verification of the returned item against the return authorization and other documentation and prepares the item for transfer.
Return Inventory Transfer Data from DR1.4 Transfer Defective Product
The process of receipt and verification of the returned item against the return authorization and other documentation and prepares the item for transfer.
Sourcing Plans from P2.4 Establish Sourcing Plans
An aggregate material requirements plan used to schedule material deliveries to meet production plan.
Supplier Performance from ES.2 Assess Supplier Performance
The results of measuring the actual supplier performance on cost, quality, engineering, purchasing, and so on, based on an agreed set of measurements.
Outputs: Procurement Signal (Supplier) to Supplier Any signal that indicates when to produce or transport Items in a pull
replenishment system, or the signal that sends the estimated need of parts or services to the supplier.
Product On Order to P2.2 Identify, Assess, And Aggregate Product Resources
Product on order with a selected source.
Product On Order to ES.9 Manage Supplier Agreements
Product on order with a selected source.
Scheduled Receipts to D1.8 Receive Product from Source or Make
Product due to arrive.
Scheduled Receipts to M1.1 Schedule Production Activities
Product due to arrive.
Scheduled Receipts to S1.2 Receive Product Product due to arrive. Scheduled Receipts to D4.2 Receive Product at Store
Product due to arrive.
Scheduled Receipts to M2.1 Schedule Production Activities
Product due to arrive.
Scheduled Receipts to M3.2 Schedule Production Activities
Product due to arrive.

© Copyright 2006 Supply-Chain Council, Inc. 71 June 2006
S1.2 Receive Product The process and associated activities of receiving product to contract requirements. Each occurrence consumes time: Metrics (see Appendix A for metrics attributes): % Orders/ Lines Processed Complete The number of orders / lines that are processed complete divided by the
total orders / lines processed within the measurement period % Orders/ Lines Received On-Time To Demand Requirement
The number of orders / lines that are received on-time to the demand requirements divided by the total orders / lines for the demand requirements in the measurement period
% Orders/ Lines Received with Correct Shipping Documents
The number of orders / lines that are received on-time with correct shipping documents divided by the total orders / lines processed in the measurement period
Cost to Receive Product The sum of the costs associated with receiving product. Receiving Product Cycle Time Total elapsed time from time product is received to time it is passed to next
process Best Practices: Bar Coding is Used to Minimize Handling Time and Maximize Data Accuracy
- Bar code interface for data collection devices - Generate bar coded receiving documents - Product serial number used as identifier - RFID
Carrier Agreement Carrier agreements are agreements between a company and its domestic and global carriers (for both, inbound raw materials and outbound finished goods) specifying service levels, payment terms, and other conditions.
Deliveries Are Balanced Throughout Each Working Day and Throughout the Week
None identified
Supplier Certification Programs Are Used to Reduce (Skip Lot) or Eliminate Receiving Inspection
Skip lot/sampling inspection logic
Supplier Delivers Directly to Point of Use - (Dock to Line or End Destination)
Electronic Tag tracking to Point of Use (POU) destination
Vendor Managed Inventory VMI is a concept for planning and control of inventory, in which the supplier has access to the customer’s inventory data and is responsible for maintaining the inventory level required by the customer. Re-supply is performed by the vendor through regularly scheduled reviews of the on-site inventory. The on-site inventory is counted, damaged or outdated goods are removed, and the inventory is restocked to predefined levels.
Inputs: Defective Products from DR1.4 Transfer Defective Product
Maintenance, Repair and Overhaul spare parts used to support of operations and maintenance.
Excess Products from DR3.4 Transfer Excess Product
Material in excess of the current requirements.
MRO Products from DR2.4 Transfer MRO Product
Maintenance, Repair and Overhaul spare parts used to support of operations and maintenance.
Product from Source: Supplier The end object of a transformation process that includes physical objects, information or services.
Scheduled Receipts from S1.1 Schedule Product Deliveries
Product due to arrive.
Outputs:
© Copyright 2006 Supply-Chain Council, Inc. 72 June 2006
Receipt Verification to ES.2 Assess Supplier Performance
Acknowledgement that the product received conforms to specified requirements and criteria.
Receipt Verification to ES.8 Manage Import/Export Requirements
Acknowledgement that the product received conforms to specified requirements and criteria.
Receipt Verification to ES.1 Manage Sourcing Business Rules
Acknowledgement that the product received conforms to specified requirements and criteria.
Receipt Verification to S1.3 Verify Product Acknowledgement that the product received conforms to specified requirements and criteria.
Receipt Verification to ED.8 Manage Import/Export Requirements
Acknowledgement that the product received conforms to specified requirements and criteria.
Receipt Verification to ES.6 Manage Incoming Product
Acknowledgement that the product received conforms to specified requirements and criteria.
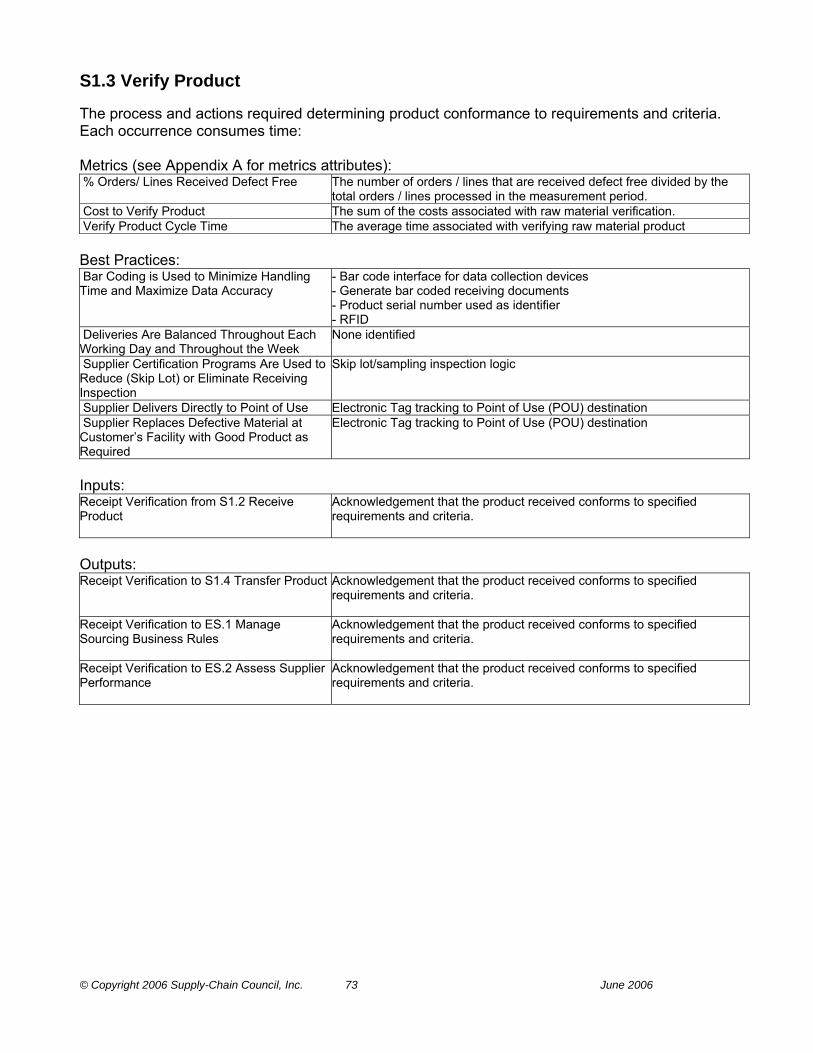
© Copyright 2006 Supply-Chain Council, Inc. 73 June 2006
S1.3 Verify Product The process and actions required determining product conformance to requirements and criteria. Each occurrence consumes time: Metrics (see Appendix A for metrics attributes): % Orders/ Lines Received Defect Free The number of orders / lines that are received defect free divided by the
total orders / lines processed in the measurement period. Cost to Verify Product The sum of the costs associated with raw material verification. Verify Product Cycle Time The average time associated with verifying raw material product Best Practices: Bar Coding is Used to Minimize Handling Time and Maximize Data Accuracy
- Bar code interface for data collection devices - Generate bar coded receiving documents - Product serial number used as identifier - RFID
Deliveries Are Balanced Throughout Each Working Day and Throughout the Week
None identified
Supplier Certification Programs Are Used to Reduce (Skip Lot) or Eliminate Receiving Inspection
Skip lot/sampling inspection logic
Supplier Delivers Directly to Point of Use Electronic Tag tracking to Point of Use (POU) destination Supplier Replaces Defective Material at Customer’s Facility with Good Product as Required
Electronic Tag tracking to Point of Use (POU) destination
Inputs: Receipt Verification from S1.2 Receive Product
Acknowledgement that the product received conforms to specified requirements and criteria.
Outputs: Receipt Verification to S1.4 Transfer Product Acknowledgement that the product received conforms to specified
requirements and criteria.
Receipt Verification to ES.1 Manage Sourcing Business Rules
Acknowledgement that the product received conforms to specified requirements and criteria.
Receipt Verification to ES.2 Assess Supplier Performance
Acknowledgement that the product received conforms to specified requirements and criteria.

© Copyright 2006 Supply-Chain Council, Inc. 74 June 2006
S1.4 Transfer Product The transfer of accepted product to the appropriate stocking location within the supply chain. This includes all of the activities associated with repackaging, staging, transferring and stocking product. For service this is the transfer or application of service to the final customer or end user. Metrics (see Appendix A for metrics attributes): % Product Transferred On-Time to Demand Requirement
The number of product orders / lines that are transferred on-time to demand requirements divided by the total orders / lines transferred in the measurement period
% Product Transferred without Transaction Errors
The number of transactions processed without error divided by the total transactions processed in the measurement period
Cost to Transfer Product The sum of the costs associated with transferring product to Make or Deliver processes
Inventory Days of Supply Five point annual average of the sum of all gross inventories (raw materials & WIP, plant FG, field FG, field samples, other) ÷ (COGS ÷ 365). Total gross value of inventory at standard cost before reserves for excess and obsolescence. Only includes inventory on company books, future liabilities should not be included
Transfer Product Cycle Time The average time associated transfer until product is moved to the next process.
Best Practices: Capability Transfer to Organization None identified Drive Deliveries Directly to Stock or Point-Of-Use in Manufacturing to Reduce Costs and Cycle Time
Pay on receipt Specify delivery location and time (to the minute) Specify delivery sequence
Inputs: Finished Goods Inventory Location from ED.4 Manage Finished Goods Inventories
The physical storage location where Finished Product inventory is held in stock prior to use or shipment.
Product Inventory Location from ES.4 Manage Product Inventory
The physical storage location where product inventory is held in stock prior to use or shipment.
Receipt Verification from S1.3 Verify Product Acknowledgement that the product received conforms to specified requirements and criteria.
Replenishment Signal from M2.2 Issue Sourced/In-Process Product
Any signal that indicates when to produce or transport Items in a pull replenishment system.
Replenishment Signal from M1.2 Issue Material
Any signal that indicates when to produce or transport Items in a pull replenishment system.
Replenishment Signal from M3.3 Issue Sourced/In-Process Product
Any signal that indicates when to produce or transport Items in a pull replenishment system.
Replenishment Signal from D1.3 Reserve Inventory & Determine Delivery Date
Any signal that indicates when to produce or transport Items in a pull replenishment system.
WIP Inventory Location from EM.6 Manage Transportation
Location of inventory that is specified as “work in progress“. This can be intermediate storage in a manufacturing facility prior to final packaging or can be a class of materials waiting final transformation to finished products.
Outputs: Daily Replenishment Requirements to D4.1 Generate Stocking Schedule
Resources needed to meet Item stocking schedule requirement.

© Copyright 2006 Supply-Chain Council, Inc. 75 June 2006
Existing Inventory Data to ES.4 Manage Product Inventory
Available data that characterizes and quantifies raw material, work in process, and finished goods inventories
Inventory Availability to P2.2 Identify, Assess, And Aggregate Product Resources
Those stocks or items on hand used to support production (raw materials and work in process items), supporting activities (maintenance, repairs and operating supplies), and customer service (finished goods and spare parts).
Inventory Availability to ES.4 Manage Product Inventory
Those stocks or items on hand used to support production (raw materials and work in process items), supporting activities (maintenance, repairs and operating supplies), and customer service (finished goods and spare parts).
Inventory Availability to D4.2 Receive Product at Store
Those stocks or items on hand used to support production (raw materials and work in process items), supporting activities (maintenance, repairs and operating supplies), and customer service (finished goods and spare parts).
Inventory Availability to D1.8 Receive Product from Source or Make
Those stocks or items on hand used to support production (raw materials and work in process items), supporting activities (maintenance, repairs and operating supplies), and customer service (finished goods and spare parts).
Inventory Availability to D1.3 Reserve Inventory & Determine Delivery Date
Those stocks or items on hand used to support production (raw materials and work in process items), supporting activities (maintenance, repairs and operating supplies), and customer service (finished goods and spare parts).
Inventory Availability to M3.3 Issue Sourced/In-Process Product
Those stocks or items on hand used to support production (raw materials and work in process items), supporting activities (maintenance, repairs and operating supplies), and customer service (finished goods and spare parts).
Inventory Availability to M1.2 Issue Material Those stocks or items on hand used to support production (raw materials and work in process items), supporting activities (maintenance, repairs and operating supplies), and customer service (finished goods and spare parts).
Inventory Availability to M2.2 Issue Sourced/In-Process Product
Those stocks or items on hand used to support production (raw materials and work in process items), supporting activities (maintenance, repairs and operating supplies), and customer service (finished goods and spare parts).
Loaded Retail Cart or Pallet to D4.4 Stock Shelf
Customer selected retail finished goods transferred to the point of sale.
Transferred Product to S1.5 Authorize Supplier Payment
Product being transferred to the appropriate stocking location within the supply chain.

© Copyright 2006 Supply-Chain Council, Inc. 76 June 2006
S1.5 Authorize Supplier Payment The process of authorizing payments and paying suppliers for product or services. This process includes invoice collection, invoice matching and the issuance of checks. Each occurrence consumes time: Metrics (see Appendix A for metrics attributes): Authorize Supplier Payment Cycle Time The average time associated with authorizing payment to suppliers. Cost to Authorize Supplier Payment The sum of the costs associated with authorizing supplier payment. Best Practices: Pay on Receipt Electronic Invoice Processing Inputs: Payment Terms from ES.9 Manage Supplier Agreements
The process of authorizing payments and paying suppliers for product or services. This process includes invoice collection, invoice matching and the issuance of checks.
Transferred Product from S1.4 Transfer Product
Product being transferred to the appropriate stocking location within the supply chain.

© Copyright 2006 Supply-Chain Council, Inc. 77 June 2006
S2 Source Make-to-Order Product The procurement and delivery of product that is built to a specific design or configured based on the requirements of a particular customer order. The Category S2 includes five Level 3 Elements: S2.1 Schedule Product Deliveries Scheduling and managing the execution of the individual deliveries of
product against the contract. The requirements for product deliveries are determined based on the detailed sourcing plan. This includes all aspects of managing the contract schedule including prototypes, qualifications or service deployment.
S2.2 Receive Product The process and associated activities of receiving product to contract requirements.
S2.3 Verify Product The process and actions required determining product conformance to requirements and criteria.
S2.4 Transfer Product The transfer of accepted product to the appropriate stocking location within the supply chain. This includes all of the activities associated with repackaging, staging, transferring, and stocking product and or application of service.
S2.5 Authorize Supplier Payment The process of authorizing payments and paying suppliers for product or services. This process includes invoice collection, invoice matching and the issuance of checks.
Metrics (see Appendix A for metrics attributes): Cost to Source The sum of the costs associated with Source. Inventory Days of Supply (Raw Material ) Value of raw materials ÷ (COGS ÷ 365). Order Fulfillment Cycle Time The average actual cycle time consistently achieved to fulfill customer
orders. Perfect Order Fulfillment The percentage of orders meeting delivery performance with complete and
accurate documentation and no delivery damage. Components include all items and quantities on-time using the customer’s definition of on-time, and documentation - packing slips, bills of lading, invoices, etc.
Product Acquisition Costs Product acquisition costs include costs incurred for the production of product: sum of product management and planning, supplier quality engineering, inbound freight and duties, receiving and product storage, incoming inspection, product process engineering and tooling costs.
Return on Supply Chain Fixed Assets Return on Supply Chain Fixed Assets measures the return an organization receives on its invested capital in supply chain fixed assets. This includes the fixed assets used in Plan, Source, Make, Deliver, and Return. The levels of aggregation can be at any element associated with a supply chain asset.
Return on Working Capital Return on working capital is a measurement which assesses the magnitude of investment relative to a company’s working capital position verses the revenue generated from a supply chain. Components include accounts receivable, accounts payable, inventory, supply chain revenue, cost of goods sold and supply chain management costs.
Source Cycle Time The average time associated with Source Processes Best Practices: Automated Statistical Process Control (SPC)None identified Joint Service Agreements (JSA) Collaborative Planning Systems Postponement Postponement (delayed differentiation) is a supply chain concept where a
product is kept as long as possible in a generic state. Differentiation of the generic product into a specific end-product is shifted closer to the consumer by postponing identify changes, such as assembly or packaging, to the last possible supply chain location.

© Copyright 2006 Supply-Chain Council, Inc. 78 June 2006
S2.1 Schedule Product Deliveries Scheduling and managing the execution of the individual deliveries of product against the contract. The requirements for product deliveries are determined based on the detailed sourcing plan. This includes all aspects of managing the contract schedule including prototypes, qualifications or service deployment. Metrics (see Appendix A for metrics attributes): % Schedules Changed within Supplier’s Lead Time
The number of schedules that are changed within the suppliers lead-time divided by the total number of schedules generated within the measurement period
Average Days per Engineering Change # of days each engineering change impacts the delivery date divided by the total # of changes.
Average Days per Schedule Change # of days each schedule change impacts the delivery date divided by the total # of changes.
Average Release Cycle of Changes Cycle time for implementing change notices divided by total number of changes.
Cost to Schedule Product Deliveries The sum of the costs associated with scheduling product deliveries. Schedule Product Deliveries Cycle Time The average time associated with scheduling the shipment of the return of
MRO product Best Practices: Advanced Ship Notices Allow for Tight Synchronization between Source and Make Processes
Blanket order support with scheduling interfaces to external supplier systems
Consignment Agreements Are Used to Reduce Assets and Cycle Time While Increasing the Availability of Critical Items
Consignment inventory management
Mechanical (Kanban) Pull Signals Are Used to Notify Suppliers of the Need to Deliver Product
Electronic Kanban support
Utilize EDI Transactions to Reduce Cycle Time and Costs
EDI interface for 830, 850, 856 & 862 transactions
Inputs: Logistics Selection from ES.6 Manage Incoming Product
Carrier selection and management for inbound or outbound shipments (linked to terms of delivery)
Production Schedule from M3.2 Schedule Production Activities
A plan that authorizes the factory to manufacture or repair a certain quantity of a specific item.
Production Schedule from M2.1 Schedule Production Activities
A plan that authorizes the factory to manufacture or repair a certain quantity of a specific item.
Production Schedule from M1.1 Schedule Production Activities
A plan that authorizes the factory to manufacture or repair a certain quantity of a specific item.
Replenishment Signal from M2.2 Issue Sourced/In-Process Product
Any signal that indicates when to produce or transport Items in a pull replenishment system.
Replenishment Signal from D2.3 Reserve Resources & Determine Delivery Date
Any signal that indicates when to produce or transport Items in a pull replenishment system.
Replenishment Signal from M3.3 Issue Sourced/In-Process Product
Any signal that indicates when to produce or transport Items in a pull replenishment system.

© Copyright 2006 Supply-Chain Council, Inc. 79 June 2006
Replenishment Signal from M1.2 Issue Material
Any signal that indicates when to produce or transport Items in a pull replenishment system.
Return Inventory Transfer Data from DR2.4 Transfer MRO Product
The process of receipt and verification of the returned item against the return authorization and other documentation and prepares the item for transfer.
Return Inventory Transfer Data from DR1.4 Transfer Defective Product
The process of receipt and verification of the returned item against the return authorization and other documentation and prepares the item for transfer.
Return Inventory Transfer Data from DR3.4 Transfer Excess Product
The process of receipt and verification of the returned item against the return authorization and other documentation and prepares the item for transfer.
Source Execution Data from M2.2 Issue Sourced/In-Process Product
Data which will provide measurement of actual supplier performance against internal and or external standards to provide feedback to achieve and maintain the performance required to meet the customer’s needs.
Sourcing Plans from P2.4 Establish Sourcing Plans
An aggregate material requirements plan used to schedule material deliveries to meet production plan.
Supplier Performance from ES.2 Assess Supplier Performance
The results of measuring the actual supplier performance on cost, quality, engineering, purchasing, and so on, based on an agreed set of measurements.
Outputs: Procurement Signal (Supplier) to Supplier Any signal that indicates when to produce or transport Items in a pull
replenishment system, or the signal that sends the estimated need of parts or services to the supplier.
Product On Order to P2.2 Identify, Assess, And Aggregate Product Resources
Product on order with a selected source.
Product On Order to ES.9 Manage Supplier Agreements
Product on order with a selected source.
Scheduled Receipts to S2.2 Receive Product Product due to arrive. Scheduled Receipts to M1.1 Schedule Production Activities
Product due to arrive.
Scheduled Receipts to M3.2 Schedule Production Activities
Product due to arrive.
Scheduled Receipts to M2.1 Schedule Production Activities
Product due to arrive.

© Copyright 2006 Supply-Chain Council, Inc. 80 June 2006
S2.2 Receive Product The process and associated activities of receiving product to contract requirements. Metrics (see Appendix A for metrics attributes): % Orders/ Lines Processed Complete The number of orders / lines that are processed complete divided by the
total orders / lines processed within the measurement period % Orders/ Lines Received On-Time To Demand Requirement
The number of orders / lines that are received on-time to the demand requirements divided by the total orders / lines for the demand requirements in the measurement period
% Orders/ Lines Received with Correct Shipping Documents
The number of orders / lines that are received on-time with correct shipping documents divided by the total orders / lines processed in the measurement period
Cost to Receive Product The sum of the costs associated with receiving product. Receiving Product Cycle Time Total elapsed time from time product is received to time it is passed to next
process Best Practices: Bar Coding is Used to Minimize Handling Time and Maximize Data Accuracy
- Bar code interface for data collection devices - Generate bar coded receiving documents - Product serial number used as identifier - RFID
Carrier Agreement Carrier agreements are agreements between a company and its domestic and global carriers (for both, inbound raw materials and outbound finished goods) specifying service levels, payment terms, and other conditions.
Deliveries Are Balanced Throughout Each Working Day and Throughout the Week
None identified
Supplier Certification Programs Are Used to Reduce (Skip Lot) or Eliminate Receiving Inspection
Skip lot/sampling inspection logic
Supplier Delivers Directly to Point of Use - (Dock to Line or End Destination)
Electronic Tag tracking to Point of Use (POU) destination
Vendor Managed Inventory VMI is a concept for planning and control of inventory, in which the supplier has access to the customer’s inventory data and is responsible for maintaining the inventory level required by the customer. Re-supply is performed by the vendor through regularly scheduled reviews of the on-site inventory. The on-site inventory is counted, damaged or outdated goods are removed, and the inventory is restocked to predefined levels.
Inputs: Defective Products from DR1.4 Transfer Defective Product
Maintenance, Repair and Overhaul spare parts used to support of operations and maintenance.
Excess Products from DR3.4 Transfer Excess Product
Material in excess of the current requirements.
MRO Products from DR2.4 Transfer MRO Product
Maintenance, Repair and Overhaul spare parts used to support of operations and maintenance.
Product from Source: Supplier The end object of a transformation process that includes physical objects, information or services.
Scheduled Receipts from S2.1 Schedule Product Deliveries
Product due to arrive.
Outputs: Receipt Verification to ES.2 Assess Supplier Performance
Acknowledgement that the product received conforms to specified requirements and criteria.

© Copyright 2006 Supply-Chain Council, Inc. 81 June 2006
Receipt Verification to ES.8 Manage Import/Export Requirements
Acknowledgement that the product received conforms to specified requirements and criteria.
Receipt Verification to ES.6 Manage Incoming Product
Acknowledgement that the product received conforms to specified requirements and criteria.
Receipt Verification to ES.1 Manage Sourcing Business Rules
Acknowledgement that the product received conforms to specified requirements and criteria.
Receipt Verification to ED.8 Manage Import/Export Requirements
Acknowledgement that the product received conforms to specified requirements and criteria.
Receipt Verification to S2.3 Verify Product Acknowledgement that the product received conforms to specified requirements and criteria.

© Copyright 2006 Supply-Chain Council, Inc. 82 June 2006
S2.3 Verify Product The process and actions required determining product conformance to requirements and criteria. Metrics (see Appendix A for metrics attributes): % Orders/ Lines Received Defect Free The number of orders / lines that are received defect free divided by the
total orders / lines processed in the measurement period. Cost to Verify Product The sum of the costs associated with raw material verification. Verify Product Cycle Time The average time associated with verifying raw material product Best Practices: Bar Coding is Used to Minimize Handling Time and Maximize Data Accuracy
- Bar code interface for data collection devices - Generate bar coded receiving documents - Product serial number used as identifier - RFID
Deliveries Are Balanced Throughout Each Working Day and Throughout the Week
None identified
Supplier Certification Programs Are Used to Reduce (Skip Lot) or Eliminate Receiving Inspection
Skip lot/sampling inspection logic
Supplier Delivers Directly to Point of Use Electronic Tag tracking to Point of Use (POU) destination Supplier Replaces Defective Material at Customer’s Facility with Good Product as Required
Electronic Tag tracking to Point of Use (POU) destination
Inputs: Receipt Verification from S2.2 Receive Product
Acknowledgement that the product received conforms to specified requirements and criteria.
Outputs: Receipt Verification to S2.4 Transfer Product Acknowledgement that the product received conforms to specified
requirements and criteria.
Receipt Verification to ES.2 Assess Supplier Performance
Acknowledgement that the product received conforms to specified requirements and criteria.
Receipt Verification to ES.1 Manage Sourcing Business Rules
Acknowledgement that the product received conforms to specified requirements and criteria.
© Copyright 2006 Supply-Chain Council, Inc. 83 June 2006
S2.4 Transfer Product The transfer of accepted product to the appropriate stocking location within the supply chain. This includes all of the activities associated with repackaging, staging, transferring, and stocking product and or application of service. Metrics (see Appendix A for metrics attributes): % Product Transferred On-Time to Demand Requirement
The number of product orders / lines that are transferred on-time to demand requirements divided by the total orders / lines transferred in the measurement period
% Product Transferred without Transaction Errors
The number of transactions processed without error divided by the total transactions processed in the measurement period
Cost to Transfer Product The sum of the costs associated with transferring product to Make or Deliver processes
Inventory Days of Supply Five point annual average of the sum of all gross inventories (raw materials & WIP, plant FG, field FG, field samples, other) ÷ (COGS ÷ 365). Total gross value of inventory at standard cost before reserves for excess and obsolescence. Only includes inventory on company books, future liabilities should not be included
Transfer Product Cycle Time The average time associated transfer until product is moved to the next process.
Best Practices: Capability Transfer to Customer None identified Drive Deliveries Directly to Stock or Point-Of-Use in Manufacturing to Reduce Costs and Cycle Time
Pay on receipt Specify delivery location and time (to the minute) Specify delivery sequence
Inputs: Finished Goods Inventory Location from ED.4 Manage Finished Goods Inventories
The physical storage location where Finished Product inventory is held in stock prior to use or shipment.
Product Inventory Location from ES.4 Manage Product Inventory
The physical storage location where product inventory is held in stock prior to use or shipment.
Receipt Verification from S2.3 Verify Product Acknowledgement that the product received conforms to specified requirements and criteria.
Replenishment Signal from M2.2 Issue Sourced/In-Process Product
Any signal that indicates when to produce or transport Items in a pull replenishment system.
Replenishment Signal from D1.3 Reserve Inventory & Determine Delivery Date
Any signal that indicates when to produce or transport Items in a pull replenishment system.
Replenishment Signal from M3.3 Issue Sourced/In-Process Product
Any signal that indicates when to produce or transport Items in a pull replenishment system.
Replenishment Signal from M1.2 Issue Material
Any signal that indicates when to produce or transport Items in a pull replenishment system.
WIP Inventory Location from EM.6 Manage Transportation
Location of inventory that is specified as “work in progress“. This can be intermediate storage in a manufacturing facility prior to final packaging or can be a class of materials waiting final transformation to finished products.

© Copyright 2006 Supply-Chain Council, Inc. 84 June 2006
Outputs: Existing Inventory Data to ES.4 Manage Product Inventory
Available data that characterizes and quantifies raw material, work in process, and finished goods inventories
Inventory Availability to M2.2 Issue Sourced/In-Process Product
Those stocks or items on hand used to support production (raw materials and work in process items), supporting activities (maintenance, repairs and operating supplies), and customer service (finished goods and spare parts).
Inventory Availability to D2.3 Reserve Resources & Determine Delivery Date
Those stocks or items on hand used to support production (raw materials and work in process items), supporting activities (maintenance, repairs and operating supplies), and customer service (finished goods and spare parts).
Inventory Availability to D2.9 Pick Product Those stocks or items on hand used to support production (raw materials and work in process items), supporting activities (maintenance, repairs and operating supplies), and customer service (finished goods and spare parts).
Inventory Availability to M1.2 Issue Material Those stocks or items on hand used to support production (raw materials and work in process items), supporting activities (maintenance, repairs and operating supplies), and customer service (finished goods and spare parts).
Inventory Availability to ES.4 Manage Product Inventory
Those stocks or items on hand used to support production (raw materials and work in process items), supporting activities (maintenance, repairs and operating supplies), and customer service (finished goods and spare parts).
Inventory Availability to M3.3 Issue Sourced/In-Process Product
Those stocks or items on hand used to support production (raw materials and work in process items), supporting activities (maintenance, repairs and operating supplies), and customer service (finished goods and spare parts).
Inventory Availability to P2.2 Identify, Assess, And Aggregate Product Resources
Those stocks or items on hand used to support production (raw materials and work in process items), supporting activities (maintenance, repairs and operating supplies), and customer service (finished goods and spare parts).
Transferred Product to S2.5 Authorize Supplier Payment
Product being tranferred to the appropriate stocking location within the supply chain.

© Copyright 2006 Supply-Chain Council, Inc. 85 June 2006
S2.5 Authorize Supplier Payment The process of authorizing payments and paying suppliers for product or services. This process includes invoice collection, invoice matching and the issuance of checks. Metrics (see Appendix A for metrics attributes): Authorize Supplier Payment Cycle Time The average time associated with authorizing payment to suppliers. Cost to Authorize Supplier Payment The sum of the costs associated with authorizing supplier payment. Best Practices: Pay on Receipt Electronic Invoice Processing Inputs: Payment Terms from ES.9 Manage Supplier Agreements
The process of authorizing payments and paying suppliers for product or services. This process includes invoice collection, invoice matching and the issuance of checks.
Transferred Product from S2.4 Transfer Product
Product being tranferred to the appropriate stocking location within the supply chain.
© Copyright 2006 Supply-Chain Council, Inc. 86 June 2006
S3 Source Engineer-to-Order Product The negotiation, procurement and delivery of engineer-to-order assemblies or specialized product or services that are designed and built based on the requirements or specifications of a particular customer order or contract. The Category S3 includes seven Level 3 Elements: S3.1 Identify Sources of Supply The identification and qualification of potential suppliers capable of
designing and delivering product that will meet all of the required product specifications.
S3.2 Select Final Supplier(s) and Negotiate The identification of the final supplier(s) based on the evaluation of RFQs, supplier qualifications and the generation of a contract defining the costs and terms and conditions of product availability.
S3.3 Schedule Product Deliveries Scheduling and managing the execution of the individual deliveries of product against the contract. The requirements for product deliveries are determined based on the detailed sourcing plan. This includes all aspects of managing the contract schedule including prototypes and qualifications.
S3.4 Receive Product The process and associated activities of receiving product to contract requirements.
S3.5 Verify Product The process and actions required determining product conformance to requirements and criteria.
S3.6 Transfer Product The transfer of accepted product to the appropriate stocking location within the supply chain. This includes all of the activities associated with repackaging, staging, transferring, and stocking product.
S3.7 Authorize Supplier Payment The process of authorizing payments and paying suppliers for product or services. This process includes invoice collection, invoice matching and the issuance of checks.
Metrics (see Appendix A for metrics attributes): Cost to Source The sum of the costs associated with Source. Inventory Days of Supply (Raw Material ) Value of raw materials ÷ (COGS ÷ 365). Order Fulfillment Cycle Time The average actual cycle time consistently achieved to fulfill customer
orders. Product Acquisition Costs Product acquisition costs include costs incurred for the production of
product: sum of product management and planning, supplier quality engineering, inbound freight and duties, receiving and product storage, incoming inspection, product process engineering and tooling costs.
Return on Supply Chain Fixed Assets Return on Supply Chain Fixed Assets measures the return an organization receives on its invested capital in supply chain fixed assets. This includes the fixed assets used in Plan, Source, Make, Deliver, and Return. The levels of aggregation can be at any element associated with a supply chain asset.
Return on Working Capital Return on working capital is a measurement which assesses the magnitude of investment relative to a company’s working capital position verses the revenue generated from a supply chain. Components include accounts receivable, accounts payable, inventory, supply chain revenue, cost of goods sold and supply chain management costs.
Source Cycle Time The average time associated with Source Processes Best Practices: Joint Service Agreements (JSA) Collaborative Planning Systems

© Copyright 2006 Supply-Chain Council, Inc. 87 June 2006
S3.1 Identify Sources of Supply The identification and qualification of potential suppliers capable of designing and delivering product that will meet all of the required product specifications. Metrics (see Appendix A for metrics attributes): . Cost to Identify Sources of Supply The sum of the costs associated with identifying sources of supply. . Identify Sources of Supply Cycle Time The average time associated with the identification of sources of
supply Best Practices: . Concurrent Engineering is Used to Tightly
Link Sourcing into the Product Development Process Make/Buy Decision Process (Outsourcing vs. In Sourcing)
None identified
. Electronic Data Interchange is Used to Send Technical Information to and from Potential Suppliers
None identified
. On Line RFQ Processes Linked into the Document Management Process Reduces Cycle Time and Product Management Costs
None identified
. Product Data Management & Electronic Document Management Are Used to Manage Technical Documents and Requirements for Engineer to Order Product
None identified
. Supplier Development Programs Are Used to Get Local Suppliers to Invest in Developing New Technologies
None identified
Inputs: . Business Rules for Source Processes from
ES.1 Manage Sourcing Business Rules Rules that are translated into guidelines and policies for conducting
business within the enterprise and other legal entities. Sourcing business rules include: supplier selection and negotiation processes, fulfillment and delivery performance and relationship definition for specific levels of collaboration and partnership.
. Current Inventory Source Data from ES.3 Maintain Source Data
Data which will provide measurement of actual supplier performance against internal and or external standards to provide feedback to achieve and maintain the performance required to meet the customer’s needs.
. ETO Spec or Design from Source: Company A clear, complete and accurate statement or drawing of the technical requirements of a material, item or service, and of the procedure to determine if the requirements are met.
. Sourcing Plans from P2.4 Establish Sourcing Plans
An aggregate material requirements plan used to schedule material deliveries to meet production plan.
. Supplier Data from ES.7 Manage Supplier Network
Data or information about the supplier. This data can be organizational, product, information, financial. Structured supplier data is needed to set up and implement ERP or similar systems.
Outputs: . Workflow to S3.2 Select Final Supplier(s) and Negotiate . ETO Request for Proposal to Supplier A document used to solicit vendor responses when the functional
requirements and features are known.

© Copyright 2006 Supply-Chain Council, Inc. 88 June 2006
S3.2 Select Final Supplier(s) and Negotiate The identification of the final supplier(s) based on the evaluation of RFQs, supplier qualifications and the generation of a contract defining the costs and terms and conditions of product availability. Metrics (see Appendix A for metrics attributes): . Cost to Select Final Supplier(s) and
Negotiate The sum of the costs associated with selecting final suppliers and
negotiating supplier agreements. . Select Final Supplier(s) and Negotiate Cycle
Time The average time associated with scheduling the shipment of the
return of MRO product Best Practices: . Electronic Data Interchange Can Be Used
To Send Rfqs and Technical Information to and from Potential Suppliers to Determine Supplier Capability to Fulfill Requirements So that They May Be Added to Supplier Network
Electronic Data Interchange
. On Line Document Management and Automated Supplier Approval Processes Can Reduce the Cycle Time and Costs Associated With Managing Supplier Evaluations and Get Them into the Supplier Network Faster
ERP
. On Line RFQ Processes Linked into the Document Management Process Reduces Cycle Time and Product Management Costs
None identified
. On-Line Availability to Supplier Financials to Determine Potential Supplier Viability to be Added to Supplier Network
Internet web sites for financial evaluation
. Supplier Certification Programs Can Reduce the Cycle Time for Certifying Existing Suppliers to Provide New Technologies
None identified
. Utilize Concurrent Engineering with Suppliers to Allow Them to Provide Engineering and Product Performance Test Data
None identified
Inputs: . Workflow from S3.1 Identify Sources of Supply . Business Rules for Source Processes from
ES.1 Manage Sourcing Business Rules Rules that are translated into guidelines and policies for conducting
business within the enterprise and other legal entities. Sourcing business rules include: supplier selection and negotiation processes, fulfillment and delivery performance and relationship definition for specific levels of collaboration and partnership.
. Current Inventory Source Data from ES.3 Maintain Source Data
Data which will provide measurement of actual supplier performance against internal and or external standards to provide feedback to achieve and maintain the performance required to meet the customer’s needs.
. ETO Proposal from Source: Supplier A proposal that may contain final drawings, specifications, formulas, part programs, etc., that describe requirements of a product
. Supplier Data from ES.7 Manage Supplier Network
Data or information about the supplier. This data can be organizational, product, information, financial. Structured supplier data is needed to set up and implement ERP or similar systems.

© Copyright 2006 Supply-Chain Council, Inc. 89 June 2006
Outputs: . Procurement Signal (Supplier) to Supplier Any signal that indicates when to produce or transport Items in a
pull replenishment system, or the signal that sends the estimated need of parts or services to the supplier.
. Supplier Agreement to ES.9 Manage Supplier Agreements
An agreement between supplier and purchaser to perform or not to perform specific acts or services or to deliver merchandise, such as purchase order or supplier contract.
. Supplier Agreement to EM.6 Manage Transportation
An agreement between supplier and purchaser to perform or not to perform specific acts or services or to deliver merchandise, such as purchase order or supplier contract.
. Supplier Agreement to S3.3 Schedule Product Deliveries
An agreement between supplier and purchaser to perform or not to perform specific acts or services or to deliver merchandise, such as purchase order or supplier contract.
© Copyright 2006 Supply-Chain Council, Inc. 90 June 2006
S3.3 Schedule Product Deliveries Scheduling and managing the execution of the individual deliveries of product against the contract. The requirements for product deliveries are determined based on the detailed sourcing plan. This includes all aspects of managing the contract schedule including prototypes and qualifications. Metrics (see Appendix A for metrics attributes): . % Schedules Changed within Supplier’s
Lead Time The number of schedules that are changed within the suppliers
lead-time divided by the total number of schedules generated within the measurement period
. Average Days per Engineering Change # of days each engineering change impacts the delivery date divided by the total # of changes.
. Average Days per Schedule Change # of days each schedule change impacts the delivery date divided by the total # of changes.
. Average Release Cycle of Changes Cycle time for implementing change notices divided by total number of changes.
. Cost to Schedule Product Deliveries The sum of the costs associated with scheduling product deliveries. . Schedule Product Deliveries Cycle Time The average time associated with scheduling the shipment of the
return of MRO product Best Practices: . Advanced Ship Notices Allow for Tight
Synchronization between Source and Make Processes
Blanket order support with scheduling interfaces to external supplier systems
. Consignment Agreements Are Used to Reduce Assets and Cycle Time While Increasing the Availability of Critical Items
Consignment inventory management
. Mechanical (Kanban) Pull Signals Are Used to Notify Suppliers of the Need to Deliver Product
Electronic Kanban support
. Utilize EDI Transactions to Reduce Cycle Time and Costs
EDI interface for 830, 850, 856 & 862 transactions
Inputs: . Logistics Selection from ES.6 Manage
Incoming Product Carrier selection and management for inbound or outbound
shipments (linked to terms of delivery)
. Production Schedule from M2.1 Schedule Production Activities
A plan that authorizes the factory to manufacture or repair a certain quantity of a specific item.
. Production Schedule from M1.1 Schedule Production Activities
A plan that authorizes the factory to manufacture or repair a certain quantity of a specific item.
. Production Schedule from M3.2 Schedule Production Activities
A plan that authorizes the factory to manufacture or repair a certain quantity of a specific item.
. Replenishment Signal from M1.2 Issue Material
Any signal that indicates when to produce or transport Items in a pull replenishment system.
. Replenishment Signal from M2.2 Issue Sourced/In-Process Product
Any signal that indicates when to produce or transport Items in a pull replenishment system.
. Replenishment Signal from M3.3 Issue Sourced/In-Process Product
Any signal that indicates when to produce or transport Items in a pull replenishment system.
. Replenishment Signal from D3.3 Enter Order, Commit Resources & Launch Program
Any signal that indicates when to produce or transport Items in a pull replenishment system.
. Return Inventory Transfer Data from DR3.4 The process of receipt and verification of the returned item against

© Copyright 2006 Supply-Chain Council, Inc. 91 June 2006
Transfer Excess Product the return authorization and other documentation and prepares the item for transfer.
. Return Inventory Transfer Data from DR1.4 Transfer Defective Product
The process of receipt and verification of the returned item against the return authorization and other documentation and prepares the item for transfer.
. Return Inventory Transfer Data from DR2.4 Transfer MRO Product
The process of receipt and verification of the returned item against the return authorization and other documentation and prepares the item for transfer.
. Sourcing Plans from P2.4 Establish Sourcing Plans
An aggregate material requirements plan used to schedule material deliveries to meet production plan.
. Supplier Agreement from S3.2 Select Final Supplier(s) and Negotiate
An agreement between supplier and purchaser to perform or not to perform specific acts or services or to deliver merchandise, such as purchase order or supplier contract.
. Supplier Performance from ES.2 Assess Supplier Performance
The results of measuring the actual supplier performance on cost, quality, engineering, purchasing, and so on, based on an agreed set of measurements.
Outputs: . Procurement Signal (Supplier) to Supplier Any signal that indicates when to produce or transport Items in a
pull replenishment system, or the signal that sends the estimated need of parts or services to the supplier.
. Product On Order to ES.9 Manage Supplier Agreements
Product on order with a selected source.
. Product On Order to P2.2 Identify, Assess, And Aggregate Product Resources
Product on order with a selected source.
. Scheduled Receipts to M1.1 Schedule Production Activities
Product due to arrive.
. Scheduled Receipts to M3.2 Schedule Production Activities
Product due to arrive.
. Scheduled Receipts to M2.1 Schedule Production Activities
Product due to arrive.
. Scheduled Receipts to S3.4 Receive Product Product due to arrive.
© Copyright 2006 Supply-Chain Council, Inc. 92 June 2006
S3.4 Receive Product The process and associated activities of receiving product to contract requirements. Metrics (see Appendix A for metrics attributes): . % Orders/ Lines Processed Complete The number of orders / lines that are processed complete divided
by the total orders / lines processed within the measurement period . % Orders/ Lines Received On-Time To
Demand Requirement The number of orders / lines that are received on-time to the
demand requirements divided by the total orders / lines for the demand requirements in the measurement period
. % Orders/ Lines Received with Correct Shipping Documents
The number of orders / lines that are received on-time with correct shipping documents divided by the total orders / lines processed in the measurement period
. Cost to Receive Product The sum of the costs associated with receiving product. . Receiving Product Cycle Time Total elapsed time from time product is received to time it is passed
to next process Best Practices: . Bar Coding is Used to Minimize Handling
Time and Maximize Data Accuracy - Bar code interface for data collection devices
- Generate bar coded receiving documents - Product serial number used as identifier - RFID
. Carrier Agreement Carrier agreements are agreements between a company and its domestic and global carriers (for both, inbound raw materials and outbound finished goods) specifying service levels, payment terms, and other conditions.
. Deliveries Are Balanced Throughout Each Working Day and Throughout the Week
None identified
. Supplier Certification Programs Are Used to Reduce (Skip Lot) or Eliminate Receiving Inspection
Skip lot/sampling inspection logic
. Supplier Delivers Directly to Point of Use - (Dock to Line or End Destination)
Electronic Tag tracking to Point of Use (POU) destination
. Vendor Managed Inventory VMI is a concept for planning and control of inventory, in which the supplier has access to the customer’s inventory data and is responsible for maintaining the inventory level required by the customer. Re-supply is performed by the vendor through regularly scheduled reviews of the on-site inventory. The on-site inventory is counted, damaged or outdated goods are removed, and the inventory is restocked to predefined levels.
Inputs: . Product from Source: Supplier The end object of a transformation process that includes physical
objects, information or services.
. Scheduled Receipts from S3.3 Schedule Product Deliveries
Product due to arrive.
Outputs: . Receipt Verification to ES.2 Assess Supplier
Performance Acknowledgement that the product received conforms to specified
requirements and criteria.
. Receipt Verification to ES.8 Manage Import/Export Requirements
Acknowledgement that the product received conforms to specified requirements and criteria.
. Receipt Verification to ES.1 Manage Sourcing Business Rules
Acknowledgement that the product received conforms to specified requirements and criteria.
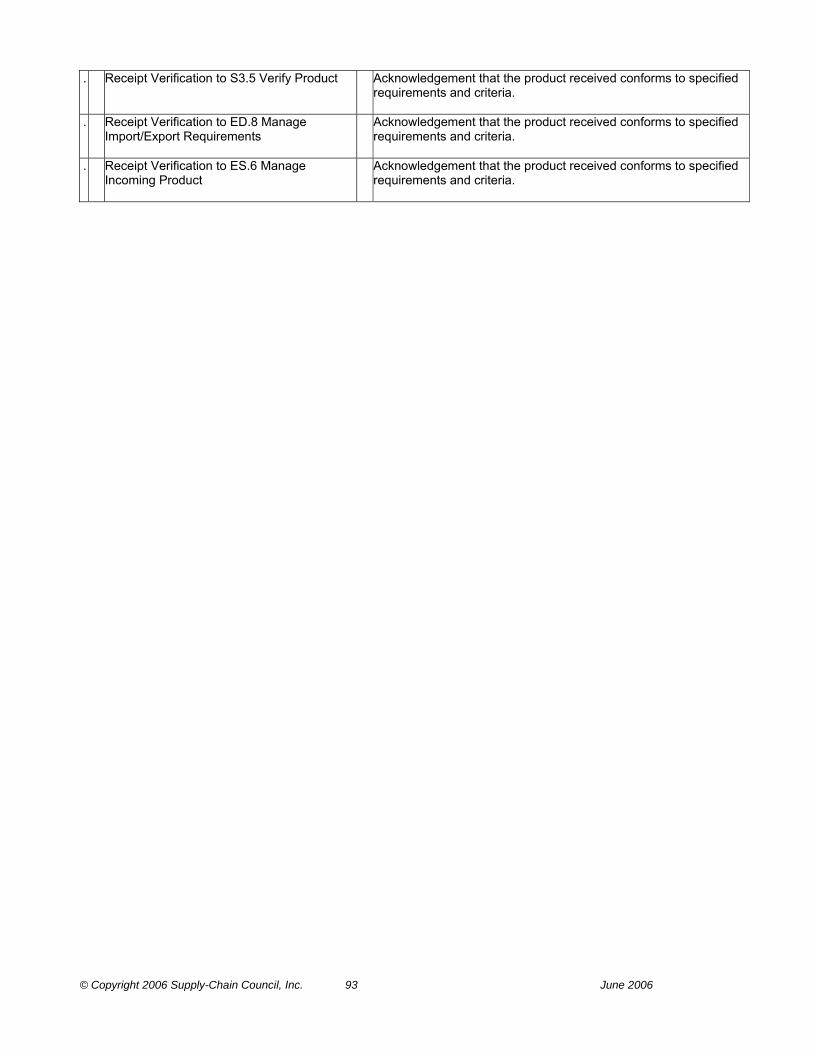
© Copyright 2006 Supply-Chain Council, Inc. 93 June 2006
. Receipt Verification to S3.5 Verify Product Acknowledgement that the product received conforms to specified requirements and criteria.
. Receipt Verification to ED.8 Manage Import/Export Requirements
Acknowledgement that the product received conforms to specified requirements and criteria.
. Receipt Verification to ES.6 Manage Incoming Product
Acknowledgement that the product received conforms to specified requirements and criteria.
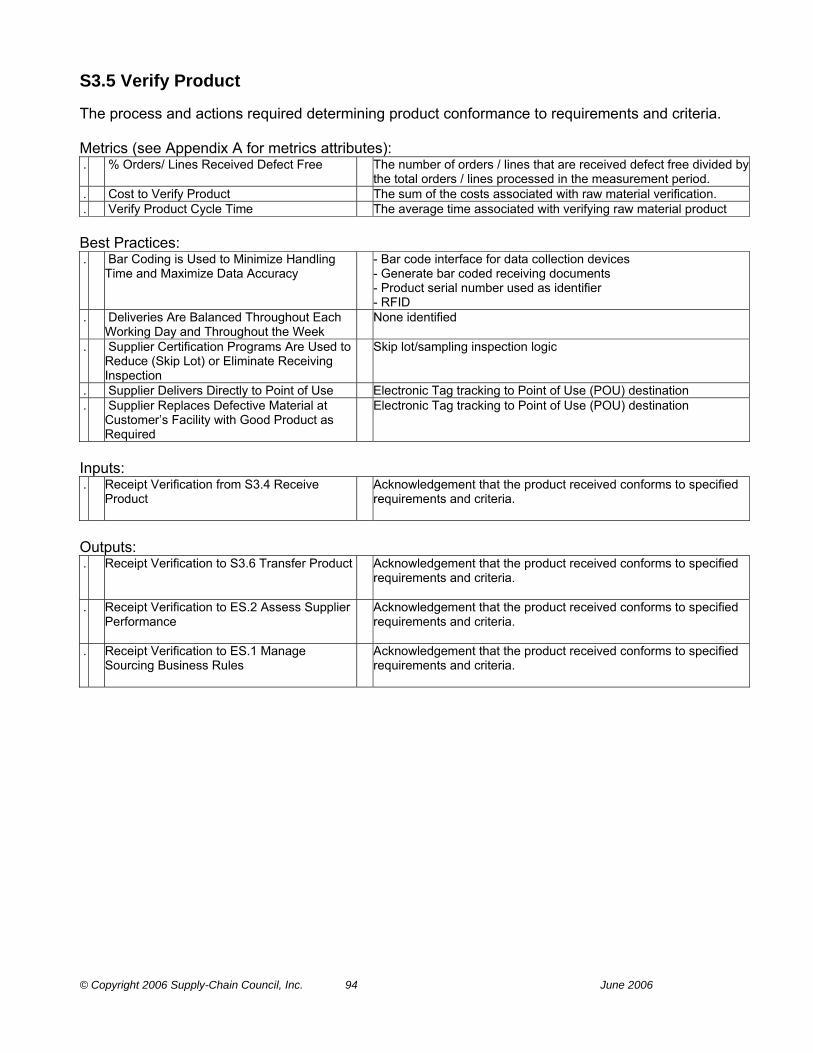
© Copyright 2006 Supply-Chain Council, Inc. 94 June 2006
S3.5 Verify Product The process and actions required determining product conformance to requirements and criteria. Metrics (see Appendix A for metrics attributes): . % Orders/ Lines Received Defect Free The number of orders / lines that are received defect free divided by
the total orders / lines processed in the measurement period. . Cost to Verify Product The sum of the costs associated with raw material verification. . Verify Product Cycle Time The average time associated with verifying raw material product Best Practices: . Bar Coding is Used to Minimize Handling
Time and Maximize Data Accuracy - Bar code interface for data collection devices
- Generate bar coded receiving documents - Product serial number used as identifier - RFID
. Deliveries Are Balanced Throughout Each Working Day and Throughout the Week
None identified
. Supplier Certification Programs Are Used to Reduce (Skip Lot) or Eliminate Receiving Inspection
Skip lot/sampling inspection logic
. Supplier Delivers Directly to Point of Use Electronic Tag tracking to Point of Use (POU) destination . Supplier Replaces Defective Material at
Customer’s Facility with Good Product as Required
Electronic Tag tracking to Point of Use (POU) destination
Inputs: . Receipt Verification from S3.4 Receive
Product Acknowledgement that the product received conforms to specified
requirements and criteria.
Outputs: . Receipt Verification to S3.6 Transfer Product Acknowledgement that the product received conforms to specified
requirements and criteria.
. Receipt Verification to ES.2 Assess Supplier Performance
Acknowledgement that the product received conforms to specified requirements and criteria.
. Receipt Verification to ES.1 Manage Sourcing Business Rules
Acknowledgement that the product received conforms to specified requirements and criteria.

© Copyright 2006 Supply-Chain Council, Inc. 95 June 2006
S3.6 Transfer Product The transfer of accepted product to the appropriate stocking location within the supply chain. This includes all of the activities associated with repackaging, staging, transferring, and stocking product. Metrics (see Appendix A for metrics attributes): . % Product Transferred On-Time to Demand
Requirement The number of product orders / lines that are transferred on-time to
demand requirements divided by the total orders / lines transferred in the measurement period
. % Product Transferred without Transaction Errors
The number of transactions processed without error divided by the total transactions processed in the measurement period
. Cost to Transfer Product The sum of the costs associated with transferring product to Make or Deliver processes
. Inventory Days of Supply Five point annual average of the sum of all gross inventories (raw materials & WIP, plant FG, field FG, field samples, other) ÷ (COGS ÷ 365). Total gross value of inventory at standard cost before reserves for excess and obsolescence. Only includes inventory on company books, future liabilities should not be included
. Transfer Product Cycle Time The average time associated transfer until product is moved to the next process.
Best Practices: . Capability Transfer to Organization None identified . Drive Deliveries Directly to Stock or Point-
Of-Use in Manufacturing to Reduce Costs and Cycle Time
Pay on receipt Specify delivery location and time (to the minute) Specify delivery sequence
Inputs: . Finished Goods Inventory Location from
ED.4 Manage Finished Goods Inventories The physical storage location where Finished Product inventory is
held in stock prior to use or shipment.
. Product Inventory Location from ES.4 Manage Product Inventory
The physical storage location where product inventory is held in stock prior to use or shipment.
. Receipt Verification from S3.5 Verify Product Acknowledgement that the product received conforms to specified requirements and criteria.
. Replenishment Signal from M3.3 Issue Sourced/In-Process Product
Any signal that indicates when to produce or transport Items in a pull replenishment system.
. Replenishment Signal from M2.2 Issue Sourced/In-Process Product
Any signal that indicates when to produce or transport Items in a pull replenishment system.
. Replenishment Signal from D1.3 Reserve Inventory & Determine Delivery Date
Any signal that indicates when to produce or transport Items in a pull replenishment system.
. Replenishment Signal from M1.2 Issue Material
Any signal that indicates when to produce or transport Items in a pull replenishment system.
. WIP Inventory Location from EM.6 Manage Transportation
Location of inventory that is specified as “work in progress“. This can be intermediate storage in a manufacturing facility prior to final packaging or can be a class of materials waiting final transformation to finished products.
Outputs:

© Copyright 2006 Supply-Chain Council, Inc. 96 June 2006
. Existing Inventory Data to ES.4 Manage Product Inventory
Available data that characterizes and quantifies raw material, work in process, and finished goods inventories
. Inventory Availability to D3.9 Pick Product Those stocks or items on hand used to support production (raw materials and work in process items), supporting activities (maintenance, repairs and operating supplies), and customer service (finished goods and spare parts).
. Inventory Availability to P2.2 Identify, Assess, And Aggregate Product Resources
Those stocks or items on hand used to support production (raw materials and work in process items), supporting activities (maintenance, repairs and operating supplies), and customer service (finished goods and spare parts).
. Inventory Availability to M2.2 Issue Sourced/In-Process Product
Those stocks or items on hand used to support production (raw materials and work in process items), supporting activities (maintenance, repairs and operating supplies), and customer service (finished goods and spare parts).
. Inventory Availability to M1.2 Issue Material Those stocks or items on hand used to support production (raw materials and work in process items), supporting activities (maintenance, repairs and operating supplies), and customer service (finished goods and spare parts).
. Inventory Availability to M3.3 Issue Sourced/In-Process Product
Those stocks or items on hand used to support production (raw materials and work in process items), supporting activities (maintenance, repairs and operating supplies), and customer service (finished goods and spare parts).
. Transferred Product to S3.7 Authorize Supplier Payment
Product being tranferred to the appropriate stocking location within the supply chain.
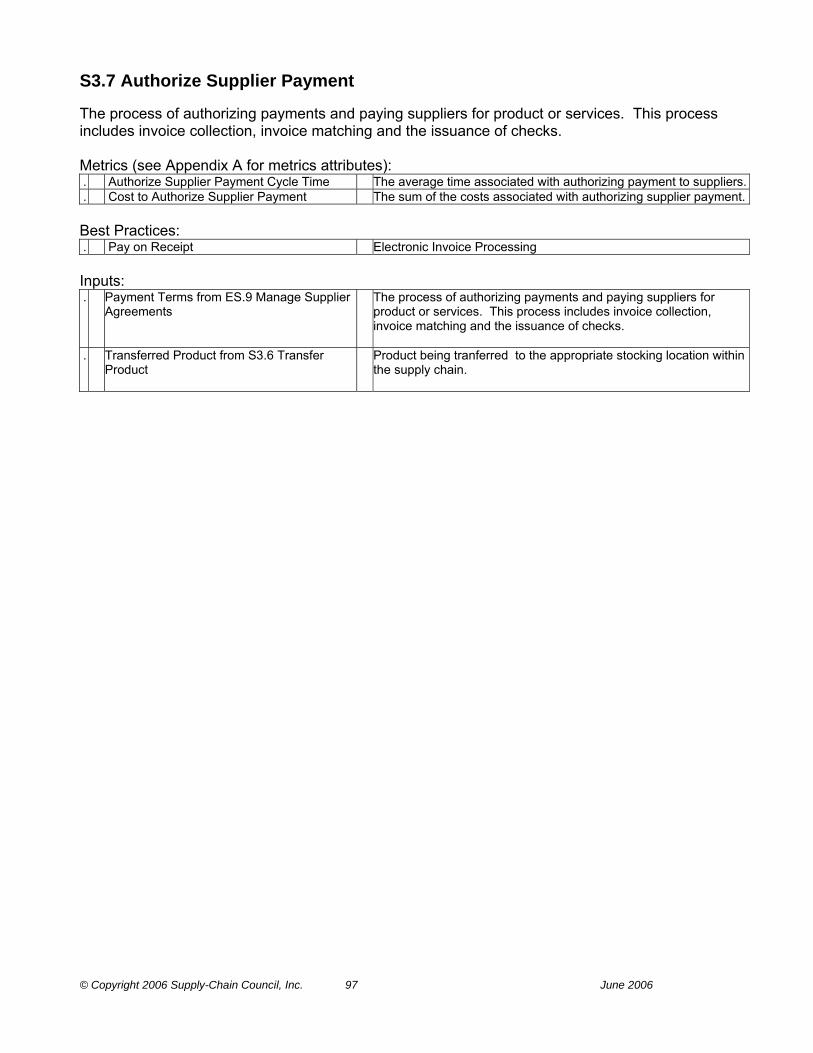
© Copyright 2006 Supply-Chain Council, Inc. 97 June 2006
S3.7 Authorize Supplier Payment The process of authorizing payments and paying suppliers for product or services. This process includes invoice collection, invoice matching and the issuance of checks. Metrics (see Appendix A for metrics attributes): . Authorize Supplier Payment Cycle Time The average time associated with authorizing payment to suppliers. . Cost to Authorize Supplier Payment The sum of the costs associated with authorizing supplier payment. Best Practices: . Pay on Receipt Electronic Invoice Processing Inputs: . Payment Terms from ES.9 Manage Supplier
Agreements The process of authorizing payments and paying suppliers for
product or services. This process includes invoice collection, invoice matching and the issuance of checks.
. Transferred Product from S3.6 Transfer Product
Product being tranferred to the appropriate stocking location within the supply chain.
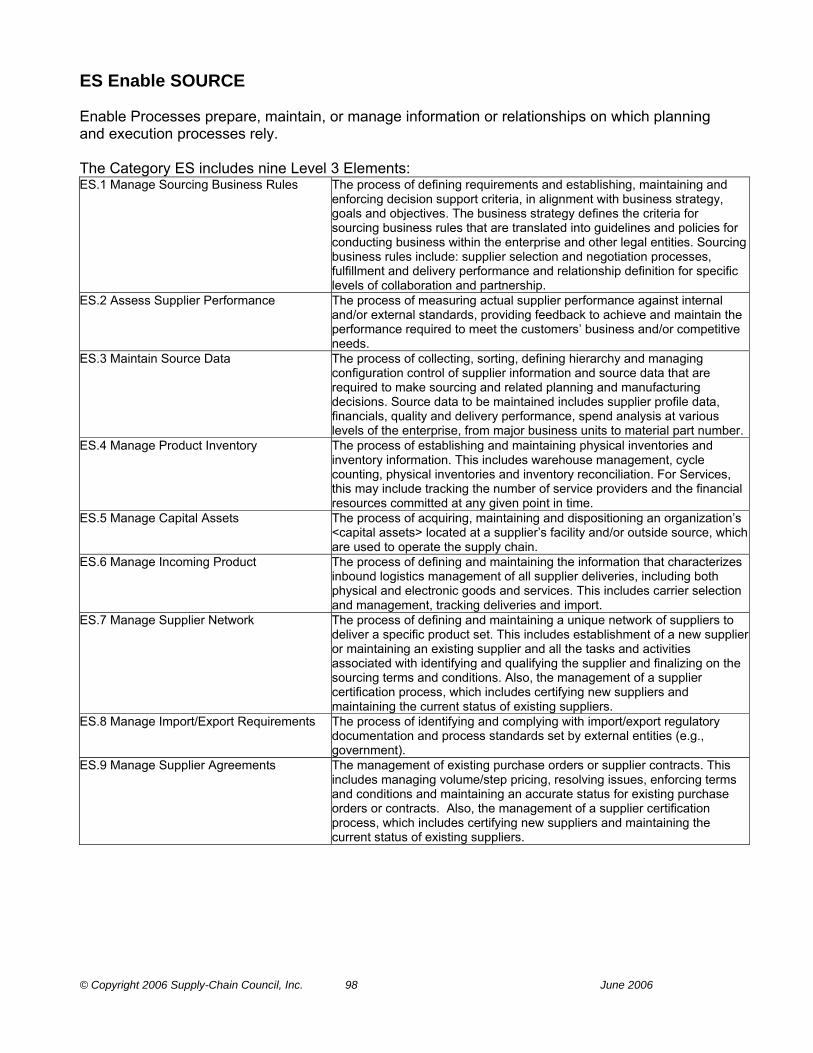
© Copyright 2006 Supply-Chain Council, Inc. 98 June 2006
ES Enable SOURCE Enable Processes prepare, maintain, or manage information or relationships on which planning and execution processes rely. The Category ES includes nine Level 3 Elements: ES.1 Manage Sourcing Business Rules The process of defining requirements and establishing, maintaining and
enforcing decision support criteria, in alignment with business strategy, goals and objectives. The business strategy defines the criteria for sourcing business rules that are translated into guidelines and policies for conducting business within the enterprise and other legal entities. Sourcing business rules include: supplier selection and negotiation processes, fulfillment and delivery performance and relationship definition for specific levels of collaboration and partnership.
ES.2 Assess Supplier Performance The process of measuring actual supplier performance against internal and/or external standards, providing feedback to achieve and maintain the performance required to meet the customers’ business and/or competitive needs.
ES.3 Maintain Source Data The process of collecting, sorting, defining hierarchy and managing configuration control of supplier information and source data that are required to make sourcing and related planning and manufacturing decisions. Source data to be maintained includes supplier profile data, financials, quality and delivery performance, spend analysis at various levels of the enterprise, from major business units to material part number.
ES.4 Manage Product Inventory The process of establishing and maintaining physical inventories and inventory information. This includes warehouse management, cycle counting, physical inventories and inventory reconciliation. For Services, this may include tracking the number of service providers and the financial resources committed at any given point in time.
ES.5 Manage Capital Assets The process of acquiring, maintaining and dispositioning an organization’s <capital assets> located at a supplier’s facility and/or outside source, which are used to operate the supply chain.
ES.6 Manage Incoming Product The process of defining and maintaining the information that characterizes inbound logistics management of all supplier deliveries, including both physical and electronic goods and services. This includes carrier selection and management, tracking deliveries and import.
ES.7 Manage Supplier Network The process of defining and maintaining a unique network of suppliers to deliver a specific product set. This includes establishment of a new supplier or maintaining an existing supplier and all the tasks and activities associated with identifying and qualifying the supplier and finalizing on the sourcing terms and conditions. Also, the management of a supplier certification process, which includes certifying new suppliers and maintaining the current status of existing suppliers.
ES.8 Manage Import/Export Requirements The process of identifying and complying with import/export regulatory documentation and process standards set by external entities (e.g., government).
ES.9 Manage Supplier Agreements The management of existing purchase orders or supplier contracts. This includes managing volume/step pricing, resolving issues, enforcing terms and conditions and maintaining an accurate status for existing purchase orders or contracts. Also, the management of a supplier certification process, which includes certifying new suppliers and maintaining the current status of existing suppliers.

© Copyright 2006 Supply-Chain Council, Inc. 99 June 2006
ES.1 Manage Sourcing Business Rules The process of defining requirements and establishing, maintaining and enforcing decision support criteria, in alignment with business strategy, goals and objectives. The business strategy defines the criteria for sourcing business rules that are translated into guidelines and policies for conducting business within the enterprise and other legal entities. Sourcing business rules include: supplier selection and negotiation processes, fulfillment and delivery performance and relationship definition for specific levels of collaboration and partnership. Metrics (see Appendix A for metrics attributes): . Cost to Manage Sourcing Business Rules The sum of the costs associated with Source business rules. . Manage Sourcing Business Rules Cycle
Time The average time associated with managing source business rules
Best Practices: . Collaborative Review and Agreement of
Business Rules Prior to Contract Execution Web based access to current spend data available from enterprise
to part level . Electronic Sourcing and Negotiation Business Rules for electronic sourcing process and hierarchy . Enterprise Level Policies/Rules with Local
Execution Web based access to enterprise level business rules
. Enterprise Level Spend Analysis None identified . Long Term Supplier
Agreements/Partnerships Electronic rules for business relationships and transactions:
Vendor-managed Inventory Agreements, Fab & Hold Agreements, Just-In-Time Agreements.
. Optimized Supply-Chain Processes, Optimized Supplier Count, Supplier and Part Rationalization
Web based access to preferred and recommended suppliers, supplier performance data & spend data stratified by commodity, business unit/site, supplier, part type, process type
Inputs: . Receipt Verification from S3.5 Verify Product Acknowledgement that the product received conforms to specified
requirements and criteria.
. Receipt Verification from S2.2 Receive Product
Acknowledgement that the product received conforms to specified requirements and criteria.
. Receipt Verification from S1.3 Verify Product Acknowledgement that the product received conforms to specified requirements and criteria.
. Receipt Verification from S2.3 Verify Product Acknowledgement that the product received conforms to specified requirements and criteria.
. Receipt Verification from S1.2 Receive Product
Acknowledgement that the product received conforms to specified requirements and criteria.
. Receipt Verification from S3.4 Receive Product
Acknowledgement that the product received conforms to specified requirements and criteria.
. Supplier Data from ES.7 Manage Supplier Network
Data or information about the supplier. This data can be organizational , product, information , financial. Structured supplier data is needed to set up and implement ERP or similar systems.

© Copyright 2006 Supply-Chain Council, Inc. 100 June 2006
Outputs: . Business Rules for Return Processes to
ES.7 Manage Supplier Network Rules for conducting business, i.e. developing and maintaining
customer and channel performance standards of an return processes such as service levels, given service requirements by supply chain stakeholders/trading partners. Business rules align Return process policies with business strategy, goals, and objectives.
. Business Rules for Source Processes to ES.4 Manage Product Inventory
Rules that are translated into guidelines and policies for conducting business within the enterprise and other legal entities. Sourcing business rules include: supplier selection and negotiation processes, fulfillment and delivery performance and relationship definition for specific levels of collaboration and partnership.
. Business Rules for Source Processes to S3.2 Select Final Supplier(s) and Negotiate
Rules that are translated into guidelines and policies for conducting business within the enterprise and other legal entities. Sourcing business rules include: supplier selection and negotiation processes, fulfillment and delivery performance and relationship definition for specific levels of collaboration and partnership.
. Business Rules for Source Processes to S3.1 Identify Sources of Supply
Rules that are translated into guidelines and policies for conducting business within the enterprise and other legal entities. Sourcing business rules include: supplier selection and negotiation processes, fulfillment and delivery performance and relationship definition for specific levels of collaboration and partnership.

© Copyright 2006 Supply-Chain Council, Inc. 101 June 2006
ES.2 Assess Supplier Performance The process of measuring actual supplier performance against internal and/or external standards, providing feedback to achieve and maintain the performance required to meet the customers’ business and/or competitive needs. Metrics (see Appendix A for metrics attributes): . Assess Supplier Performance Cycle Time The average time associated with assessing the performance of
supplier processes. . Cost to Assess Supplier Performance The sum of the costs associated with assessing supplier
performance. Best Practices: . Carrier Agreement Carrier agreements are agreements between a company and its
domestic and global carriers (for both, inbound raw materials and outbound finished goods) specifying service levels, payment terms, and other conditions.
. Comparative Analysis of Supplier Performance is Used in Sourcing Decisions
Software application with data analysis capability
. Continuous Improvement and Development is Driven and Measured through the Performance Review Process
None identified
. Cost Reduction and or Cost Avoidance Are Opportunities Are Identified, Implemented and Measured on a Periodic Basis
None identified
. Performance Expectations and Business Rules Are Clearly Communicated Prior to the Initiation of Business with the Supplier
Web based access / availability to business rules and performance criteria
. Supplier “Cost of Nonconformance“ Data is Collected, Analyzed and Used in Performance Reporting
Software application to automate data collection and reporting
. Supplier Performance Assessment System “Assess Supplier Performance” is the process of measuring actual supplier performance against internal and/or external standards, providing feedback to achieve and maintain the performance required to meet the customers’ business and/or competitive needs.
. Supplier Performance Data is Collected, Analyzed and Reported to Suppliers Online and Real-Time through Extranet Applications
Web based relational database / management application
. Suppliers Are Evaluated, Selected and Qualified with Criteria Matched to Business Requirements and Competitive Needs
None identified
Inputs: . Receipt Verification from S1.2 Receive
Product Acknowledgement that the product received conforms to specified
requirements and criteria.
. Receipt Verification from S3.5 Verify Product Acknowledgement that the product received conforms to specified requirements and criteria.
. Receipt Verification from S2.2 Receive Product
Acknowledgement that the product received conforms to specified requirements and criteria.
. Receipt Verification from S1.3 Verify Product Acknowledgement that the product received conforms to specified requirements and criteria.
. Receipt Verification from S3.4 Receive Product
Acknowledgement that the product received conforms to specified requirements and criteria.
© Copyright 2006 Supply-Chain Council, Inc. 102 June 2006
. Receipt Verification from S2.3 Verify Product Acknowledgement that the product received conforms to specified requirements and criteria.
. Supplier Data from ES.7 Manage Supplier Network
Data or information about the supplier. This data can be organizational , product, information , financial. Structured supplier data is needed to set up and implement ERP or similar systems.
Outputs: . Quality and Delivery Performance to ES.3
Maintain Source Data “The process of measuring actual supplier performance against
internal and/or external standards, providing feedback to achieve and maintain the performance required to meet the customers’ business and/or competitive needs. Or, the extent to which the supplier delivers according to quality specification (e.g. product quality, logistic quality) and to delivery specification (in time, correct packaging etc). Sometimes these two metrics are connected in one.“
. Supplier Performance to S3.3 Schedule Product Deliveries
The results of measuring the actual supplier performance on cost, quality, engineering, purchasing, and so on, based on an agreed set of measurements.
. Supplier Performance to ES.7 Manage Supplier Network
The results of measuring the actual supplier performance on cost, quality, engineering, purchasing, and so on, based on an agreed set of measurements.
. Supplier Performance to S1.1 Schedule Product Deliveries
The results of measuring the actual supplier performance on cost, quality, engineering, purchasing, and so on, based on an agreed set of measurements.
. Supplier Performance to S2.1 Schedule Product Deliveries
The results of measuring the actual supplier performance on cost, quality, engineering, purchasing, and so on, based on an agreed set of measurements.

© Copyright 2006 Supply-Chain Council, Inc. 103 June 2006
ES.3 Maintain Source Data The process of collecting, sorting, defining hierarchy and managing configuration control of supplier information and source data that are required to make sourcing and related planning and manufacturing decisions. Source data to be maintained includes supplier profile data, financials, quality and delivery performance, spend analysis at various levels of the enterprise, from major business units to material part number. Metrics (see Appendix A for metrics attributes): . Cost to Maintain Source Data The sum of the costs associated with maintaining supplier data. . Maintain Source Data Cycle Time The average time associated with maintaining source data Best Practices: . Automated Update of Supplier Performance
Information None identified
. Data Accessibility across the Enterprise for Visibility by Discrete Business Units
Web based access to various levels of enterprise data
. On Demand Access of Supplier/Source Data Web based access to current supplier/source data . Supplier and Material Rationalization Web based access to supplier/source data Inputs: . Quality and Delivery Performance from ES.2
Assess Supplier Performance “The process of measuring actual supplier performance against
internal and/or external standards, providing feedback to achieve and maintain the performance required to meet the customers’ business and/or competitive needs. Or, the extent to which the supplier delivers according to quality specification (e.g. product quality, logistic quality) and to delivery specification (in time, correct packaging etc). Sometimes these two metrics are connected in one.“
. Sourcing Plans from P2.4 Establish Sourcing Plans
An aggregate material requirements plan used to schedule material deliveries to meet production plan.
. Supplier Data from ES.7 Manage Supplier Network
Data or information about the supplier. This data can be organizational , product, information , financial. Structured supplier data is needed to set up and implement ERP or similar systems.
Outputs: . Current Inventory Source Data to ES.7
Manage Supplier Network Data which will provide measurement of actual supplier performance
against internal and or external standards to provide feedback to achieve and maintain the performance required to meet the customer’s needs.
. Current Inventory Source Data to S3.2 Select Final Supplier(s) and Negotiate
Data which will provide measurement of actual supplier performance against internal and or external standards to provide feedback to achieve and maintain the performance required to meet the customer’s needs.
. Current Inventory Source Data to S3.1 Identify Sources of Supply
Data which will provide measurement of actual supplier performance against internal and or external standards to provide feedback to achieve and maintain the performance required to meet the customer’s needs.
. Current Inventory Source Data to ED.7 Manage Product Life Cycle
Data which will provide measurement of actual supplier performance against internal and or external standards to provide feedback to achieve and maintain the performance required to meet the customer’s needs.

© Copyright 2006 Supply-Chain Council, Inc. 104 June 2006
ES.4 Manage Product Inventory The process of establishing and maintaining physical inventories and inventory information. This includes warehouse management, cycle counting, physical inventories and inventory reconciliation. For Services, this may include tracking the number of service providers and the financial resources committed at any given point in time. Metrics (see Appendix A for metrics attributes): . Cost to Manage Product Inventory The sum of the Cost to Manage Product Inventory . Inventory Days of Supply Five point annual average of the sum of all gross inventories (raw
materials & WIP, plant FG, field FG, field samples, other) ÷ (COGS ÷ 365). Total gross value of inventory at standard cost before reserves for excess and obsolescence. Only includes inventory on company books, future liabilities should not be included
. Manage Product Inventory Cycle Time The average time associated with managing raw material inventory Best Practices: . Periodic Review of Metrics and Strategy with
Comparisons to Industry Benchmarks Real time view of data.
. Real Time Data on Current Status Dynamic calculation of safety stock based on actual sales. . Statistical Test Count The Statistical Test Count (STC) process is a method of validating
inventory on-hand values by physically counting and reconciling a statistical sample of the entire inventory population. This sample is then extrapolated across the inventory population, which provides an indicative measure of entire inventory population. Furthermore, with extrapolation the net and gross percentage of error is determined.
. Vendor Managed Inventory VMI is a concept for planning and control of inventory, in which the supplier has access to the customer’s inventory data and is responsible for maintaining the inventory level required by the customer. Re-supply is performed by the vendor through regularly scheduled reviews of the on-site inventory. The on-site inventory is counted, damaged or outdated goods are removed, and the inventory is restocked to predefined levels.
Inputs: . Business Rules for Source Processes from
ES.1 Manage Sourcing Business Rules Rules that are translated into guidelines and policies for conducting
business within the enterprise and other legal entities. Sourcing business rules include: supplier selection and negotiation processes, fulfillment and delivery performance and relationship definition for specific levels of collaboration and partnership.
. Existing Inventory Data from S2.4 Transfer Product
Available data that characterizes and quantifies raw material, work in process, and finished goods inventories
. Existing Inventory Data from S3.6 Transfer Product
Available data that characterizes and quantifies raw material, work in process, and finished goods inventories
. Existing Inventory Data from S1.4 Transfer Product
Available data that characterizes and quantifies raw material, work in process, and finished goods inventories
. Inventory Availability from S1.4 Transfer Product
Those stocks or items on hand used to support production (raw materials and work in process items), supporting activities (maintenance, repairs and operating supplies), and customer service (finished goods and spare parts).
. Inventory Availability from S2.4 Transfer Product
Those stocks or items on hand used to support production (raw materials and work in process items), supporting activities (maintenance, repairs and operating supplies), and customer service (finished goods and spare parts).

© Copyright 2006 Supply-Chain Council, Inc. 105 June 2006
. Parts and Services Consumed from EM.5 Manage Equipment and Facilities
The items and services utilized to manufacture a product.
. Sourcing Plans from P2.4 Establish Sourcing Plans
An aggregate material requirements plan used to schedule material deliveries to meet production plan.
Outputs: . MRO Parts Availability to EM.5 Manage
Equipment and Facilities The on-hand MRO inventory balance minus allocations,
reservations, backorders, and (usually) quantities held for quality problems.
. Product Inventory Location to S2.4 Transfer Product
The physical storage location where product inventory is held in stock prior to use or shipment.
. Product Inventory Location to S1.4 Transfer Product
The physical storage location where product inventory is held in stock prior to use or shipment.
. Product Inventory Location to S3.6 Transfer Product
The physical storage location where product inventory is held in stock prior to use or shipment.
. Product Inventory Target Levels to P2.2 Identify, Assess, And Aggregate Product Resources
The target for the total product inventory, including e.g. raw material, work in progress and finished goods.
. Supply-Chain Performance Metrics to EP.2 Manage Performance of Supply Chain
Standard measures that indicate how well a supply chain performs within certain categories of performance known as Performance Attributes, e.g. delivery reliability, flexibility and responsiveness, cost, and asset management.
© Copyright 2006 Supply-Chain Council, Inc. 106 June 2006
ES.5 Manage Capital Assets The process of acquiring, maintaining and dispositioning an organization’s <capital assets> located at a supplier’s facility and/or outside source, which are used to operate the supply chain. Metrics (see Appendix A for metrics attributes): . Cost to Manage Source Capital Assets The sum of the Costs to Manage Source Capital Assets . Manage Capital Assets Cycle Time The average time associated with managing capital assets Best Practices: . Changeover Reduction / Continuous
Improvement Program Changeover process flow element identification, instructional
directions to conduct changeover, and measurement tool, which can be used to prioritize and track results of improvement efforts. Software to identify operational constraints to the MAKE processes to assist in directing resources toward bottleneck functional areas.
. Facility & Equipment Environmental / Safety Audit System
System software to list checklist items, report results of audit & forward actions to be taken
. Removal of Obsolete Capital Assets Automated Calculation of ABC Velocity Movement . Total Preventative Maintenance Program Automatically generated TPM repair schedules integrated with MRP
systems, electronic equipment repair history, parts listings, part stores inventory & reorder points, automatic store room parts purchases, Shop floor access to electronic data base of equipment line drawings, electrical wiring diagrams, parts listing reference guide and part cost lists.
Inputs: . Import/Export Requirements from ES.8
Manage Import/Export Requirements Requirements established by a government or trading areas (i.e EU,
NAFTA etc) which must be met before allowing the shipping or delivery of a product across national boundaries.
. Parts and Services Consumed from EM.5 Manage Equipment and Facilities
The items and services utilized to manufacture a product.
. Supplier Agreement from ES.9 Manage Supplier Agreements
An agreement between supplier and purchaser to perform or not to perform specific acts or services or to deliver merchandise, such as purchase order or supplier contract.
Outputs: . Capital Assets to ES.8 Manage
Import/Export Requirements Physical objects that are held by an organization for its production
potential and that costs more than some threshold value (APICS)

© Copyright 2006 Supply-Chain Council, Inc. 107 June 2006
ES.6 Manage Incoming Product The process of defining and maintaining the information that characterizes inbound logistics management of all supplier deliveries, including both physical and electronic goods and services. This includes carrier selection and management, tracking deliveries and import. Metrics (see Appendix A for metrics attributes): . Cost to Manage Incoming Product The sum of the costs associated with managing incoming product. . Manage Incoming Product Cycle Time The average time associated with managing inbound raw material Best Practices: . Appointment Scheduling for Pickup and
Delivery of Customer Shipments Transportation Management System (TMS) Maintenance
Management . Automated Documentation for International
Shipments Transportation Management System (TMS) Maintenance
Management . Backhaul Trading Exchange Pooling . Capture and Maintain Mode Specific Data Transportation Management System (TMS) Maintenance
Management . Electronic Manifest and Electronic Billing Transportation Management System (TMS) Maintenance
Management . Integrated Order Management, Warehouse
Management, and Transportation Management Systems View for analysis for all orders and shipments the following data: Logistics, Product, Cost, GL Charging
Transportation Management System (TMS) Maintenance Management
. Internet Pooling (Electronic Brokerage of Shipments)
Rating & Routing
. Manage Information Across 100% of Shipments
Transportation Management System (TMS) Maintenance Management
. Measurement of Carrier Performance for On-time Delivery and Completeness
Transportation Management System (TMS) Maintenance Management
. Real-Time Optimized Shipment Method Selection (Air Parcel, Ground Parcel, LTL, etc.) Based on Customer Service Requirements
Transportation Management System (TMS) Maintenance Management
. Real-Time Shipment Tracking, (via internet) Transportation Management System (TMS) Maintenance Management
Inputs: . Contract Carrier Rates from ES.8 Manage
Import/Export Requirements The rates charged by a carrier that does not serve the general
public, but provides transportation for hire for one or a limited number of shippers under a specific contract.
. Import/Export Requirements from ES.8 Manage Import/Export Requirements
Requirements established by a government or trading areas (i.e EU, NAFTA etc) which must be met before allowing the shipping or delivery of a product across national boundaries.
. Receipt Verification from S2.2 Receive Product
Acknowledgement that the product received conforms to specified requirements and criteria.
. Receipt Verification from S1.2 Receive Product
Acknowledgement that the product received conforms to specified requirements and criteria.
. Receipt Verification from S3.4 Receive Product
Acknowledgement that the product received conforms to specified requirements and criteria.
Outputs:

© Copyright 2006 Supply-Chain Council, Inc. 108 June 2006
. Logistics Selection to S2.1 Schedule Product Deliveries
Carrier selection and management for inbound or outbound shipments (linked to terms of delivery)
. Logistics Selection to S3.3 Schedule Product Deliveries
Carrier selection and management for inbound or outbound shipments (linked to terms of delivery)
. Logistics Selection to S1.1 Schedule Product Deliveries
Carrier selection and management for inbound or outbound shipments (linked to terms of delivery)
© Copyright 2006 Supply-Chain Council, Inc. 109 June 2006
ES.7 Manage Supplier Network The process of defining and maintaining a unique network of suppliers to deliver a specific product set. This includes establishment of a new supplier or maintaining an existing supplier and all the tasks and activities associated with identifying and qualifying the supplier and finalizing on the sourcing terms and conditions. Also, the management of a supplier certification process, which includes certifying new suppliers and maintaining the current status of existing suppliers. Metrics (see Appendix A for metrics attributes): Cost to Manage Supplier Network The sum of the costs associated with managing the supplier network. Manage Supplier Network Cycle Time The average time associated with managing the supplier network Best Practices: Carrier Agreement Carrier agreements are agreements between a company and its domestic
and global carriers (for both, inbound raw materials and outbound finished goods) specifying service levels, payment terms, and other conditions.
Create and Maintain Multiple Suppliers and Multiple Supplier Sites to Record Information about Individuals and Companies from Whom You Want to Purchase Catalogue Goods and Services
None Identified
Electronic Data Interchange Can Be Used To Send Rfqs and Technical Information to and from Potential Suppliers to Determine Supplier Capability to Fulfill Requirements So that They May Be Added to Supplier Network
Electronic Data Interchange
Establishment of Criteria to Rank Suppliers Utilize supplier delivery, quality, price performance as well as any other criteria such as terms and conditions
Evaluate Supplier Network for Duplicates Supplier Merge Programs for duplicates Identification of Suppliers Who Will Participate in Consignment Inventory Programs
Consignment Inventory Management
Identification of Suppliers Who Will Participate in Kanban Programs
Electronic Kanban Support
Identification of Suppliers Who Will Participate in Procurement Split (Two or More Suppliers Sharing Purchase Requirements) Programs
None identified
Identification of Suppliers Who Will Participate in Vendor Managed Inventory (VMI) Programs
Supplier managed inventories with scheduling interfaces to external supplier systems to replenish
Internet Exchanges Internet Exchanges are a hosted, business-to-business trading network. Exchanges are an open procurement network, accessible to any buyer and focused on new Internet-enabled purchasing models like spot buys or reverse, buyer-driven auctions. Exchanges will also support more traditional catalog-based sales.
On Line Document Management and Automated Supplier Approval Processes Can Reduce the Cycle Time and Costs Associated With Managing Supplier Evaluations and Get Them into the Supplier Network Faster
ERP
On-Line Availability to Supplier Financials to Determine Potential Supplier Viability to be Added to Supplier Network
Internet web sites for financial evaluation
Supplier Certification Programs Can Reduce the Cycle Time for Certifying Existing Suppliers to Provide New Technologies
None identified
© Copyright 2006 Supply-Chain Council, Inc. 110 June 2006
Supplier Certification Programs Can Reduce the Cycle Time for Initial Certification of New Suppliers or Certifying Existing Suppliers that Wish to Provide New Technologies
None identified
Utilize Concurrent Engineering with Suppliers to Allow Them to Provide Engineering and Product Performance Test Data to Qualify as Part of Potential Supplier Network
Internet, EDI, FAX
Inputs: Business Rules for Return Processes from ES.1 Manage Sourcing Business Rules
Rules for conducting business, i.e. developing and maintaining customer and channel performance standards of an return processes such as service levels, given service requirements by supply chain stakeholders/trading partners. Business rules align Return process policies with business strategy, goals, and objectives.
Current Inventory Source Data from ES.3 Maintain Source Data
Data which will provide measurement of actual supplier performance against internal and or external standards to provide feedback to achieve and maintain the performance required to meet the customer’s needs.
Supplier Agreement from ES.9 Manage Supplier Agreements
An agreement between supplier and purchaser to perform or not to perform specific acts or services or to deliver merchandise, such as purchase order or supplier contract.
Supplier Performance from ES.2 Assess Supplier Performance
The results of measuring the actual supplier performance on cost, quality, engineering, purchasing, and so on, based on an agreed set of measurements.
Outputs: Supplier Data to ES.1 Manage Sourcing Business Rules
Data or information about the supplier. This data can be organizational , product, information , financial. Structured supplier data is needed to set up and implement ERP or similar systems.
Supplier Data to S3.2 Select Final Supplier(s) and Negotiate
Data or information about the supplier. This data can be organizational , product, information , financial. Structured supplier data is needed to set up and implement ERP or similar systems.
Supplier Data to ES.3 Maintain Source Data Data or information about the supplier. This data can be organizational , product, information , financial. Structured supplier data is needed to set up and implement ERP or similar systems.
Supplier Data to ES.2 Assess Supplier Performance
Data or information about the supplier. This data can be organizational , product, information , financial. Structured supplier data is needed to set up and implement ERP or similar systems.
Supplier Data to ES.9 Manage Supplier Agreements
Data or information about the supplier. This data can be organizational , product, information , financial. Structured supplier data is needed to set up and implement ERP or similar systems.
Supplier Data to S3.1 Identify Sources of Supply
Data or information about the supplier. This data can be organizational , product, information , financial. Structured supplier data is needed to set up and implement ERP or similar systems.

© Copyright 2006 Supply-Chain Council, Inc. 111 June 2006
ES.8 Manage Import/Export Requirements The process of identifying and complying with import/export regulatory documentation and process standards set by external entities (e.g., government). Metrics (see Appendix A for metrics attributes): . Cost to Manage Import/Export
Requirements The sum of the costs associated with the management of
import/export requirements . Customs Clearance Cycle Time The average time associated with clearing an order through
customs . Manage Import/Export Requirements Cycle
Time The average time associated with managing import/export
requirements Best Practices: . Ability to Track Component/Sub-Component
Manufacturing Country of Origin Component/lot tracking (lot trace-ability)
. Assessing Export/Import Requirements during Time of Product Development/Manufacture
Multi-country Export/Import documentation compliance
. Direct Connection to Customs Clearance Electronic documentation submission via EDI and/or internet. . Direct Transfer of Documents to Recipient
and Forwarder Electronic documentation submission via EDI and/or internet.
. Documents Generated Automatically During Shipment Preparation.
Electronic documentation submission via EDI and/or internet.
Inputs: . Capital Assets from ES.5 Manage Capital
Assets Physical objects that are held by an organization for its production
potential and that costs more than some threshold value (APICS)
. Parts and Services Consumed from EM.5 Manage Equipment and Facilities
The items and services utilized to manufacture a product.
. Receipt Verification from S3.4 Receive Product
Acknowledgement that the product received conforms to specified requirements and criteria.
. Receipt Verification from S2.2 Receive Product
Acknowledgement that the product received conforms to specified requirements and criteria.
. Receipt Verification from S1.2 Receive Product
Acknowledgement that the product received conforms to specified requirements and criteria.
Outputs: . Contract Carrier Rates to ES.6 Manage
Incoming Product The rates charged by a carrier that does not serve the general
public, but provides transportation for hire for one or a limited number of shippers under a specific contract.
. Contract Carrier Rates to ED.6 Manage Transportation
The rates charged by a carrier that does not serve the general public, but provides transportation for hire for one or a limited number of shippers under a specific contract.
. Import/Export Requirements to ES.5 Manage Capital Assets
Requirements established by a government or trading areas (i.e EU, NAFTA etc) which must be met before allowing the shipping or delivery of a product across national boundaries.
. Import/Export Requirements to ES.9 Manage Supplier Agreements
Requirements established by a government or trading areas (i.e EU, NAFTA etc) which must be met before allowing the shipping or delivery of a product across national boundaries.

© Copyright 2006 Supply-Chain Council, Inc. 112 June 2006
. Import/Export Requirements to ES.6 Manage Incoming Product
Requirements established by a government or trading areas (i.e EU, NAFTA etc) which must be met before allowing the shipping or delivery of a product across national boundaries.

© Copyright 2006 Supply-Chain Council, Inc. 113 June 2006
ES.9 Manage Supplier Agreements The management of existing purchase orders or supplier contracts. This includes managing volume/step pricing, resolving issues, enforcing terms and conditions and maintaining an accurate status for existing purchase orders or contracts. Also, the management of a supplier certification process, which includes certifying new suppliers and maintaining the current status of existing suppliers. Metrics (see Appendix A for metrics attributes): . Cost to Manage Supplier Agreements The sum of the costs associated with managing supplier
agreements. . Manage Supplier Agreements Cycle Time The average time associated with managing supplier agreements Best Practices: . Carrier Agreement Carrier agreements are agreements between a company and its
domestic and global carriers (for both, inbound raw materials and outbound finished goods) specifying service levels, payment terms, and other conditions.
. Electronic Sourcing and Negotiation Business Rules for electronic sourcing process and hierarchy . Enterprise Level Policies/Rules with Local
Execution Web based access to enterprise level business rules
. Enterprise Level Spend Analysis None identified . Long Term Supplier
Agreements/Partnerships Electronic rules for business relationships and transactions:
Vendor-managed Inventory Agreements, Fab & Hold Agreements, Just-In-Time Agreements.
. Optimized Supply-Chain Processes, Optimized Supplier Count, Supplier and Part Rationalization
Web based access to preferred and recommended suppliers, supplier performance data & spend data stratified by commodity, business unit/site, supplier, part type, process type
Inputs: . Import/Export Requirements from ES.8
Manage Import/Export Requirements Requirements established by a government or trading areas (i.e
EU, NAFTA etc) which must be met before allowing the shipping or delivery of a product across national boundaries.
. Product On Order from S2.1 Schedule Product Deliveries
Product on order with a selected source.
. Product On Order from S3.3 Schedule Product Deliveries
Product on order with a selected source.
. Product On Order from S1.1 Schedule Product Deliveries
Product on order with a selected source.
. Supplier Agreement from S3.2 Select Final Supplier(s) and Negotiate
An agreement between supplier and purchaser to perform or not to perform specific acts or services or to deliver merchandise, such as purchase order or supplier contract.
. Supplier Data from ES.7 Manage Supplier Network
Data or information about the supplier. This data can be organizational , product, information , financial. Structured supplier data is needed to set up and implement ERP or similar systems.
Outputs: . Payment Terms to S2.5 Authorize Supplier
Payment The process of authorizing payments and paying suppliers for
product or services. This process includes invoice collection, invoice matching and the issuance of checks.
. Payment Terms to S3.7 Authorize Supplier Payment
The process of authorizing payments and paying suppliers for product or services. This process includes invoice collection, invoice matching and the issuance of checks.

© Copyright 2006 Supply-Chain Council, Inc. 114 June 2006
. Payment Terms to S1.5 Authorize Supplier Payment
The process of authorizing payments and paying suppliers for product or services. This process includes invoice collection, invoice matching and the issuance of checks.
. Supplier Agreement to ES.5 Manage Capital Assets
An agreement between supplier and purchaser to perform or not to perform specific acts or services or to deliver merchandise, such as purchase order or supplier contract.
. Supplier Agreement to ES.7 Manage Supplier Network
An agreement between supplier and purchaser to perform or not to perform specific acts or services or to deliver merchandise, such as purchase order or supplier contract.

© Copyright 2006 Supply-Chain Council, Inc. 115 June 2006
M1 Make-to-Stock The process of manufacturing in a make to stock environment adds value to products through mixing, separating, forming, machining, and chemical processes. Make to stock products are intended to be shipped from finished goods or “off the shelf,“ are completed prior to receipt of a customer order, and are generally produced in accordance with a sales forecast. The Category M1 includes six Level 3 Elements: M1.1 Schedule Production Activities Given plans for the production of specific parts, products, or formulations in
specified quantities and planned availability of required sourced products, the scheduling of the operations to be performed in accordance with these plans. Scheduling includes sequencing, and, depending on the factory layout, any standards for setup and run. In general, intermediate production activities are coordinated prior to the scheduling of the operations to be performed in producing a finished product.
M1.2 Issue Material The selection and physical movement of sourced/in-process product (e.g., raw materials, fabricated components, subassemblies, required ingredients or intermediate formulations) from a stocking location (e.g., stockroom, a location on the production floor, a supplier) to a specific point of use location. Issuing product includes the corresponding system transaction. The Bill of Materials/routing information or recipe/production instructions will determine the products to be issued to support the production operation(s).
M1.3 Produce and Test The series of activities performed upon sourced/in-process product to convert it from the raw or semi-finished state to a state of completion and greater value. The processes associated with the validation of product performance to ensure conformance to defined specifications and requirements.
M1.4 Package The series of activities that containerize completed products for storage or sale to end-users. Within certain industries, packaging may include cleaning or sterilization.
M1.5 Stage Product The movement of packaged products into a temporary holding location to await movement to a finished goods location. Products that are made to order may remain in the holding location to await shipment per the associated customer order. The movement to finished goods is part of the Deliver process.
M1.6 Release Product to Deliver Activities associated with post-production documentation, testing, or certification required prior to delivery of finished product to customer. Examples include assembly of batch records for regulatory agencies, laboratory tests for potency or purity, creating certificate of analysis, and sign-off by the quality organization.
Metrics (see Appendix A for metrics attributes): Cash-To-Cash Cycle Time [Inventory Days of Supply + Days Sales Outstanding - Days Payable
Outstanding] The time it takes for an investment made to flow back into a company after it has been spent for raw materials. For services, this represents the time from the point where a company pays for the resources consumed in the performance of a service to the time that the company received payment from the customer for those services.
Cost of Goods Sold The cost associated with buying raw materials and producing finished goods. This cost includes direct costs (labor, materials) and indirect costs (overhead).
Cost to Make The sum of the costs associated with make. Downside Make Adaptability The production reduction sustainable at 30 days prior to delivery with no
inventory or cost penalties. Make Cycle Time The average time associated with Make Processes
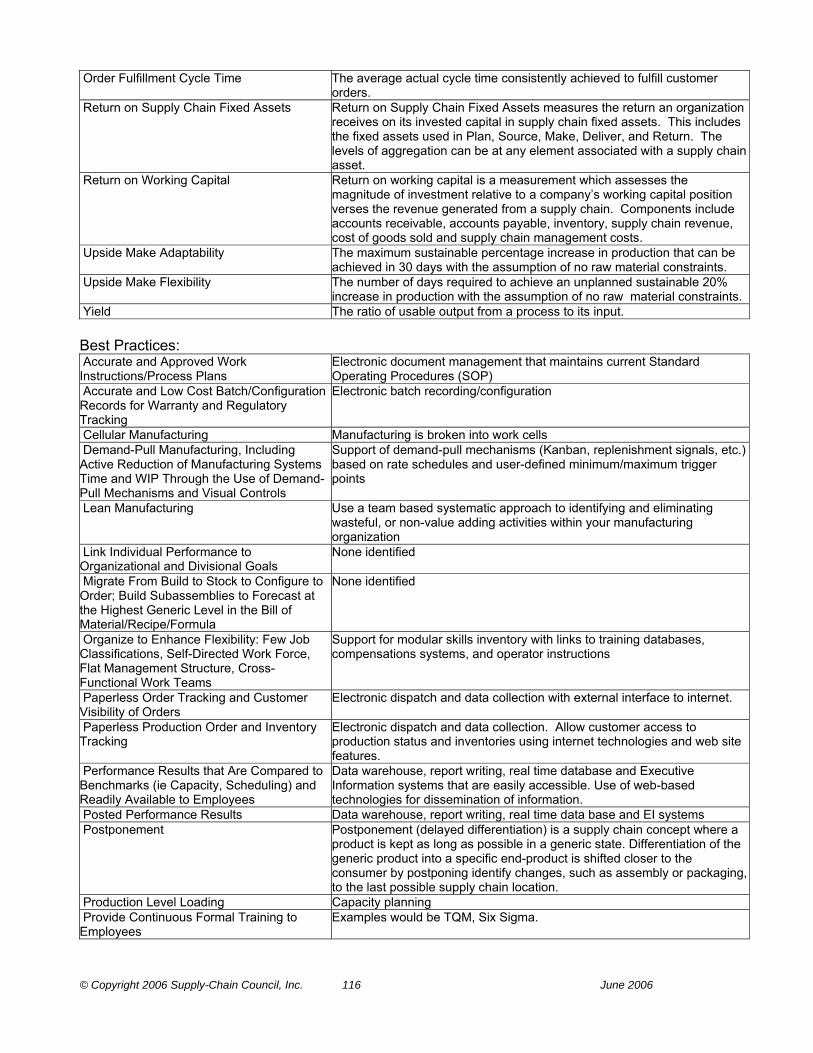
© Copyright 2006 Supply-Chain Council, Inc. 116 June 2006
Order Fulfillment Cycle Time The average actual cycle time consistently achieved to fulfill customer orders.
Return on Supply Chain Fixed Assets Return on Supply Chain Fixed Assets measures the return an organization receives on its invested capital in supply chain fixed assets. This includes the fixed assets used in Plan, Source, Make, Deliver, and Return. The levels of aggregation can be at any element associated with a supply chain asset.
Return on Working Capital Return on working capital is a measurement which assesses the magnitude of investment relative to a company’s working capital position verses the revenue generated from a supply chain. Components include accounts receivable, accounts payable, inventory, supply chain revenue, cost of goods sold and supply chain management costs.
Upside Make Adaptability The maximum sustainable percentage increase in production that can be achieved in 30 days with the assumption of no raw material constraints.
Upside Make Flexibility The number of days required to achieve an unplanned sustainable 20% increase in production with the assumption of no raw material constraints.
Yield The ratio of usable output from a process to its input. Best Practices: Accurate and Approved Work Instructions/Process Plans
Electronic document management that maintains current Standard Operating Procedures (SOP)
Accurate and Low Cost Batch/Configuration Records for Warranty and Regulatory Tracking
Electronic batch recording/configuration
Cellular Manufacturing Manufacturing is broken into work cells Demand-Pull Manufacturing, Including Active Reduction of Manufacturing Systems Time and WIP Through the Use of Demand-Pull Mechanisms and Visual Controls
Support of demand-pull mechanisms (Kanban, replenishment signals, etc.) based on rate schedules and user-defined minimum/maximum trigger points
Lean Manufacturing Use a team based systematic approach to identifying and eliminating wasteful, or non-value adding activities within your manufacturing organization
Link Individual Performance to Organizational and Divisional Goals
None identified
Migrate From Build to Stock to Configure to Order; Build Subassemblies to Forecast at the Highest Generic Level in the Bill of Material/Recipe/Formula
None identified
Organize to Enhance Flexibility: Few Job Classifications, Self-Directed Work Force, Flat Management Structure, Cross-Functional Work Teams
Support for modular skills inventory with links to training databases, compensations systems, and operator instructions
Paperless Order Tracking and Customer Visibility of Orders
Electronic dispatch and data collection with external interface to internet.
Paperless Production Order and Inventory Tracking
Electronic dispatch and data collection. Allow customer access to production status and inventories using internet technologies and web site features.
Performance Results that Are Compared to Benchmarks (ie Capacity, Scheduling) and Readily Available to Employees
Data warehouse, report writing, real time database and Executive Information systems that are easily accessible. Use of web-based technologies for dissemination of information.
Posted Performance Results Data warehouse, report writing, real time data base and EI systems Postponement Postponement (delayed differentiation) is a supply chain concept where a
product is kept as long as possible in a generic state. Differentiation of the generic product into a specific end-product is shifted closer to the consumer by postponing identify changes, such as assembly or packaging, to the last possible supply chain location.
Production Level Loading Capacity planning Provide Continuous Formal Training to Employees
Examples would be TQM, Six Sigma.

© Copyright 2006 Supply-Chain Council, Inc. 117 June 2006
Vendor Managed Inventory VMI is a concept for planning and control of inventory, in which the supplier has access to the customer’s inventory data and is responsible for maintaining the inventory level required by the customer. Re-supply is performed by the vendor through regularly scheduled reviews of the on-site inventory. The on-site inventory is counted, damaged or outdated goods are removed, and the inventory is restocked to predefined levels.

© Copyright 2006 Supply-Chain Council, Inc. 118 June 2006
M1.1 Schedule Production Activities Given plans for the production of specific parts, products, or formulations in specified quantities and planned availability of required sourced products, the scheduling of the operations to be performed in accordance with these plans. Scheduling includes sequencing, and, depending on the factory layout, any standards for setup and run. In general, intermediate production activities are coordinated prior to the scheduling of the operations to be performed in producing a finished product. Metrics (see Appendix A for metrics attributes): . Capacity Utilization A measure of how intensively a resource is being used to produce a
good or service. Some factors that should be considered are internal manufacturing capacity, constraining processes, direct labor availability and key components/materials availability.
. Cost to Schedule Production Activities The sum of the costs associated with scheduling production activities.
. Schedule Achievement The percentage of time that a plant achieves its production schedule. This calculation is based on the number of scheduled end-items or total volume for a specific period. Note: over-shipments do not make up for under-shipments.
. Schedule Production Activities Cycle Time The average time associated with scheduling production activities Best Practices: . Additional Capacity for Overflow Demand Outsource manufacturing and work force augmentation providers
connected to production schedules via the internet. . Cross Training/Certification HR/certification support . Demand-Pull Manufacturing, Including
Active Reduction of Manufacturing Systems Time and WIP Through the Use of Demand-Pull Mechanisms and Visual Controls
Support of demand-pull mechanisms (Kanban, replenishment signals, etc.) based on rate schedules and user-defined minimum/maximum trigger points
. Drum-Buffer-Rope Scheduling Technique (DBR, also referred to as Synchronous Manufacturing or Constraint Management) A technique used to manage resources to maximize throughput.
. Maintain Data and System Integrity by Ensuring Production Data, Inventory Levels, and Schedule Requirements Are 99+% Accurate
Detailed production model that synchronizes PLAN and MAKE activities in real time.
. Produce Products to Unique Customer Specification
Order entry, engineering, and product specifications linked to production order
. Provide Scheduling Output Back to Material and Labor Planning Systems
Allow dynamic re-synchronization of MAKE activities by tying in real time status information to scheduler
. Real Time Feedback from Production, Raw Materials, and Finished Goods Inventory and Test Activities
Allow dynamic re-synchronization of MAKE activities by tying in real time status information to scheduler.
. Schedule Includes Preventative Maintenance Program
Interface between maintenance management system and scheduling system
. Schedule Minimizes Changeover Costs Detailed production scheduling model and simulation capabilities . Schedule Optimizes Use of Shared
Resources Such as Tooling and Production Equipment
Scheduling utilizing optimization techniques. Required production resources included in routing/process instructions
. Schedule Reflects Current Plant Status (Equipment Availability, Other Jobs and Resource Availability) On Line
Schedule undated by on line reporting and status systems and re-sequence activities
Inputs:

© Copyright 2006 Supply-Chain Council, Inc. 119 June 2006
. Equipment and Facilities Schedules and Plans from EM.5 Manage Equipment and Facilities
Time-phased plans of present and future load (capacity required) on all resources (Equipment and Facilities) based on the planned and released supply authorizations (i.e., orders) and the planned capacity (capacity available) of these resources over a span of time.
. Information Feedback from M1.5 Stage Product
The flow of information back into the control system so that actual performance can be compared with planned performance.
. Information Feedback from M1.4 Package The flow of information back into the control system so that actual performance can be compared with planned performance.
. Information Feedback from M1.3 Produce and Test
The flow of information back into the control system so that actual performance can be compared with planned performance.
. Information Feedback from M1.2 Issue Material
The flow of information back into the control system so that actual performance can be compared with planned performance.
. Information Feedback from M1.6 Release Product to Deliver
The flow of information back into the control system so that actual performance can be compared with planned performance.
. Preventative Maintenance and Calibration Schedule from EM.5 Manage Equipment and Facilities
Planned and scheduled activities, including adjustments, replacements, and basic cleanliness, that forestall machine and facility breakdowns. Also, the established frequency to change and maintain parts, based on failure consequences, with frequency set per part or machine type. (Well cared for equipment and facilities will last longer and cause fewer problems.)
. Production Plans from P3.4 Establish Production Plans
A master production plan used to allocate capacity among manufacturing resources and schedule finite manufacturing activities or executing the performance of a service. Production Plan includes production capability.
. Scheduled Receipts from S1.1 Schedule Product Deliveries
Product due to arrive.
. Scheduled Receipts from S3.3 Schedule Product Deliveries
Product due to arrive.
. Scheduled Receipts from S2.1 Schedule Product Deliveries
Product due to arrive.
Outputs: . Production Schedule to P3.2 Identify,
Assess, and Aggregate Production Resources
A plan that authorizes the factory to manufacture or repair a certain quantity of a specific item.
. Production Schedule to S2.1 Schedule Product Deliveries
A plan that authorizes the factory to manufacture or repair a certain quantity of a specific item.
. Production Schedule to S3.3 Schedule Product Deliveries
A plan that authorizes the factory to manufacture or repair a certain quantity of a specific item.
. Production Schedule to S1.1 Schedule Product Deliveries
A plan that authorizes the factory to manufacture or repair a certain quantity of a specific item.
. Production Schedule to D4.2 Receive Product at Store
A plan that authorizes the factory to manufacture or repair a certain quantity of a specific item.
. Production Schedule to D1.3 Reserve Inventory & Determine Delivery Date
A plan that authorizes the factory to manufacture or repair a certain quantity of a specific item.
. Production Schedule to M1.2 Issue Material A plan that authorizes the factory to manufacture or repair a certain quantity of a specific item.
© Copyright 2006 Supply-Chain Council, Inc. 120 June 2006
. Production Schedule to D1.8 Receive
Product from Source or Make A plan that authorizes the factory to manufacture or repair a certain
quantity of a specific item.

© Copyright 2006 Supply-Chain Council, Inc. 121 June 2006
M1.2 Issue Material The selection and physical movement of sourced/in-process product (e.g., raw materials, fabricated components, subassemblies, required ingredients or intermediate formulations) from a stocking location (e.g., stockroom, a location on the production floor, a supplier) to a specific point of use location. Issuing product includes the corresponding system transaction. The Bill of Materials/routing information or recipe/production instructions will determine the products to be issued to support the production operation(s). Metrics (see Appendix A for metrics attributes): . Cost to Issue Material The sum of the costs associated with issuing material. . Issue Material Cycle Time The average time associated with the issuance of material to
production Best Practices: . Back Flush Material at Order Completion Flexible back flush logic . Complete Lot History Inventory by lot of sourced/in-process or discrete order /usage
reporting by lot or discrete order . Demand-Pull Mechanisms; Kanban
Replenishment Signals from Stockroom, Intermediate Products, or Subassembly Area
None identified
. Electronic Material Move Transactions Automated process control and/or barcode data collection . Strategic Safety Stock of Selected Materials,
Items, or Subassemblies to Decouple Sourced Product Issuance Cycle Time from Supplier Lead Time
Use of safety stock algorithms to minimize stock levels.
. Supplier Delivery to Production Process at Point of Use
EDI link to supplier’s sales order and inventory systems
Inputs: . Inventory Availability from S1.4 Transfer
Product Those stocks or items on hand used to support production (raw
materials and work in process items), supporting activities (maintenance, repairs and operating supplies), and customer service (finished goods and spare parts).
. Inventory Availability from S3.6 Transfer Product
Those stocks or items on hand used to support production (raw materials and work in process items), supporting activities (maintenance, repairs and operating supplies), and customer service (finished goods and spare parts).
. Inventory Availability from S2.4 Transfer Product
Those stocks or items on hand used to support production (raw materials and work in process items), supporting activities (maintenance, repairs and operating supplies), and customer service (finished goods and spare parts).
. Production Schedule from M1.1 Schedule Production Activities
A plan that authorizes the factory to manufacture or repair a certain quantity of a specific item.
. WIP Handling Rules, Move Information and Methods from EM.4 Manage In-Process Products (WIP)
The rules for handling WIP items in the production and repair process. These rules include the movement and accounting for in-process items between work locations, in inventory, and movement inventory.
. WIP Location Rules from EM.6 Manage Transportation
The process and rules for establishing and maintaining in-process item inventory ownership and stocking locations.
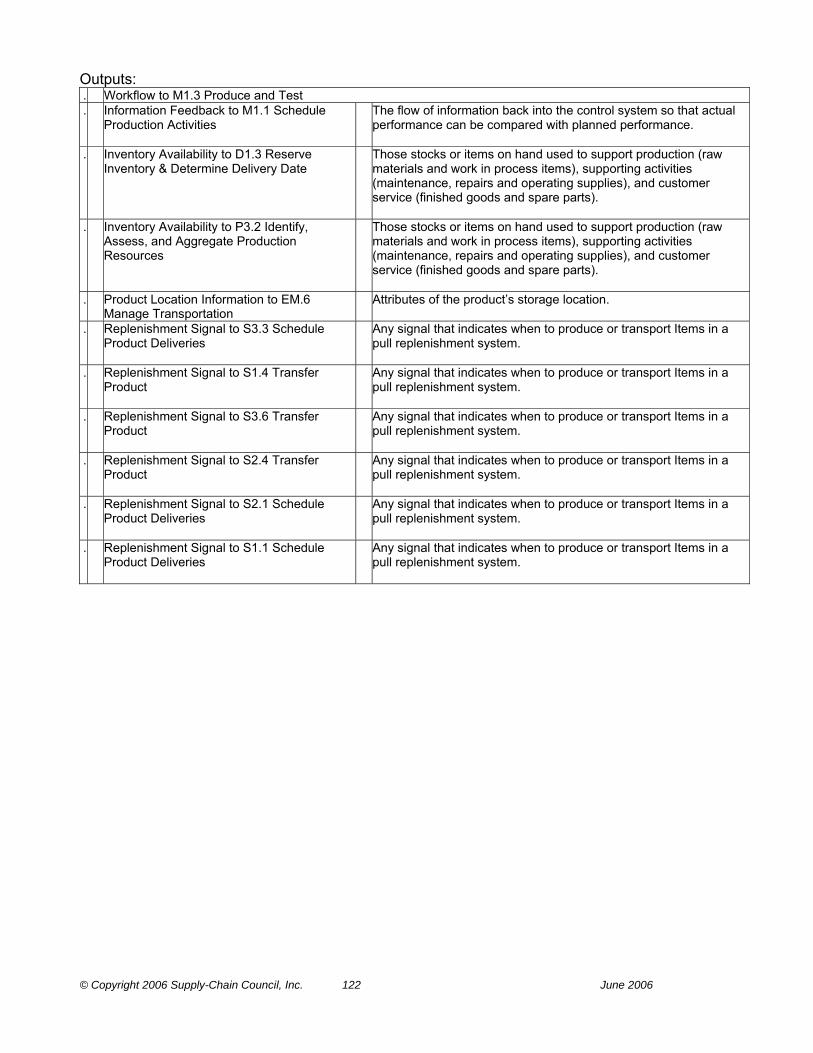
© Copyright 2006 Supply-Chain Council, Inc. 122 June 2006
Outputs: . Workflow to M1.3 Produce and Test . Information Feedback to M1.1 Schedule
Production Activities The flow of information back into the control system so that actual
performance can be compared with planned performance.
. Inventory Availability to D1.3 Reserve Inventory & Determine Delivery Date
Those stocks or items on hand used to support production (raw materials and work in process items), supporting activities (maintenance, repairs and operating supplies), and customer service (finished goods and spare parts).
. Inventory Availability to P3.2 Identify, Assess, and Aggregate Production Resources
Those stocks or items on hand used to support production (raw materials and work in process items), supporting activities (maintenance, repairs and operating supplies), and customer service (finished goods and spare parts).
. Product Location Information to EM.6 Manage Transportation
Attributes of the product’s storage location.
. Replenishment Signal to S3.3 Schedule Product Deliveries
Any signal that indicates when to produce or transport Items in a pull replenishment system.
. Replenishment Signal to S1.4 Transfer Product
Any signal that indicates when to produce or transport Items in a pull replenishment system.
. Replenishment Signal to S3.6 Transfer Product
Any signal that indicates when to produce or transport Items in a pull replenishment system.
. Replenishment Signal to S2.4 Transfer Product
Any signal that indicates when to produce or transport Items in a pull replenishment system.
. Replenishment Signal to S2.1 Schedule Product Deliveries
Any signal that indicates when to produce or transport Items in a pull replenishment system.
. Replenishment Signal to S1.1 Schedule Product Deliveries
Any signal that indicates when to produce or transport Items in a pull replenishment system.
© Copyright 2006 Supply-Chain Council, Inc. 123 June 2006
M1.3 Produce and Test The series of activities performed upon sourced/in-process product to convert it from the raw or semi-finished state to a state of completion and greater value. The processes associated with the validation of product performance to ensure conformance to defined specifications and requirements. Metrics (see Appendix A for metrics attributes): . Asset Turns Total gross product revenue ÷ Total net assets . Capacity Utilization A measure of how intensively a resource is being used to produce a
good or service. Some factors that should be considered are internal manufacturing capacity, constraining processes, direct labor availability and key components/materials availability.
. Cost to Produce and Test The sum of the costs associated with production and test. . Fill Rate The percentage of ship-from-stock orders shipped within 24 hours
of order receipt. For services, this metric is the proportion for services that are filled so that the service is completed within 24 hours
. Produce and Test Cycle Time The average time associated with production and test . Warranty and Returns Number of returns within the warranty period. Warranty is a
commitment, either expressed or implied, that a certain fact regarding the subject matter of a contract is presently true or will be true.
. Warranty Costs Warranty costs include materials, labor and problem diagnosis for product defects.
. Yield The ratio of usable output from a process to its input. . Yield Variability The condition that occurs when the output of a process is not
consistently repeatable either in quantity, quality, or combination of these.
Best Practices: . Accurate and Approved Process
Plans/Specifications Electronic document management
. Accurate and Low Cost Batch/Configuration Records for Warranty and Regulatory Tracking
Electronic batch recording/configuration
. Authorize Each Operation to Assess the Quality of the Previous Operations
None identified
. Design/Upgrade Production Equipment to Maximize Flexibility and Avoid Line Stoppages
Machine productivity and downtime monitoring
. Just-In-Time Demand Flow Techniques Demand-pull mechanisms . Maintain Accurate Lot/Batch History
Information Electronic data collection of employee actions and sourced/in-
process product lot used . Measuring Process Metrics and Feedback to
Operators Electronic data collection of completion, quality, scrap, labor and
equipment data and dissemination of information on factory floor . Paperless Production Control Electronic dispatch of operations . Provide Continuous Formal Training to
Employees Examples would be TQM, Six Sigma.
. Real Time quality control techniques Electronic collection of quality data and on-line SPC. . Real Time Statistical Control Techniques Electronic collection of defect data and on-line SPC. . Reduce Chances of Operator Error Automatic download of production equipment with batch
recipes/part programs . Reduce Non-Value Added Activities,
Including Queue, Move, and Set-Up Times Use principals of Lean Manufacturing.
. Reduce Non-Value Added Paperwork While Still Measuring Process Metrics
Electronic data collection of completion, quality, lot tractability, scrap, and labor data
. Up-to-Date Shop Packet/Specifications Electronic work instructions

© Copyright 2006 Supply-Chain Council, Inc. 124 June 2006

© Copyright 2006 Supply-Chain Council, Inc. 125 June 2006
Inputs: . Workflow from M1.2 Issue Material Outputs: . Workflow to M1.4 Package . Information Feedback to M1.1 Schedule
Production Activities The flow of information back into the control system so that actual
performance can be compared with planned performance.

© Copyright 2006 Supply-Chain Council, Inc. 126 June 2006
M1.4 Package The series of activities that containerize completed products for storage or sale to end-users. Within certain industries, packaging may include cleaning or sterilization. Metrics (see Appendix A for metrics attributes): . Asset Turns Total gross product revenue ÷ Total net assets . Capacity Utilization A measure of how intensively a resource is being used to produce a
good or service. Some factors that should be considered are internal manufacturing capacity, constraining processes, direct labor availability and key components/materials availability.
. Cost to Package The sum of the costs associated with product packaging. . Package Cycle Time . Warranty and Returns Number of returns within the warranty period. Warranty is a
commitment, either expressed or implied, that a certain fact regarding the subject matter of a contract is presently true or will be true.
. Warranty Costs Warranty costs include materials, labor and problem diagnosis for product defects.
Best Practices: . Accurate and Approved Process Plans,
Routings, Specifications and Procedures Electronic document management
. Accurate and Low Cost Batch/Configuration Records for Warranty and Regulatory Tracking
Electronic batch recording/configuration
. Automatic Label and Seal Verification Automatic interface to inspection systems . Design/Upgrade Production Equipment to
Maximize Flexibility and Avoid Line Stoppages
Machine productivity and downtime monitoring
. Minimize Operator Induced Errors Automatic download of production equipment with setup parameters Graphical display of setup, changeover, or layout
. Packaging Operation is an Integral Part of the Overall Production Process
None identified
. Paperless Production Control Electronic dispatch of operations . Postponement and Pre-Kitting Of
Accessories into Modular Packages that Allow Flexibility While Maintaining Control
None identified
. Reduce Non-Value Added Paperwork While Still Measuring Process Metrics
Electronic data collection of completion, quality, lot tractability, scrap, and labor data
. Up-to-Date Shop Packet/Specification for Each Unique Production Event/Demand
Electronic Work Instructions
Inputs: . Workflow from M1.3 Produce and Test Outputs: . Workflow to M1.5 Stage Product . Information Feedback to M1.1 Schedule
Production Activities The flow of information back into the control system so that actual
performance can be compared with planned performance.

© Copyright 2006 Supply-Chain Council, Inc. 127 June 2006
M1.5 Stage Product The movement of packaged products into a temporary holding location to await movement to a finished goods location. Products that are made to order may remain in the holding location to await shipment per the associated customer order. The movement to finished goods is part of the Deliver process. Metrics (see Appendix A for metrics attributes): . Cost to Stage Finished Product The sum of the costs associated with staging finished goods. . Stage Finished Product Cycle Time The average time associated with staging finished product Best Practices: . Direct Ship from Factory to
Customer/Channel Share production status with customers and transportation
providers via web-based tools. Auto-Tendering for direct ship utilizing EDI/XML protocols.
. Electronic Material Move Transactions Automated process control and/or barcode data collection Inputs: . Workflow from M1.4 Package . Delivery Plans from P4.4 Establish Delivery
Plans A plan for a course of action over specified time periods that
involves a projected appropriation of supply resources to meet delivery requirements.
. Production Plans from P3.4 Establish Production Plans
A master production plan used to allocate capacity among manufacturing resources and schedule finite manufacturing activities or executing the performance of a service. Production Plan includes production capability.
Outputs: . Workflow to M1.6 Release Product to Deliver . Information Feedback to M1.1 Schedule
Production Activities The flow of information back into the control system so that actual
performance can be compared with planned performance.

© Copyright 2006 Supply-Chain Council, Inc. 128 June 2006
M1.6 Release Product to Deliver Activities associated with post-production documentation, testing, or certification required prior to delivery of finished product to customer. Examples include assembly of batch records for regulatory agencies, laboratory tests for potency or purity, creating certificate of analysis, and sign-off by the quality organization. Metrics (see Appendix A for metrics attributes): . Cost to Release Finished Product to Deliver The sum of the costs associated with releasing finished goods to
deliver processes. . Release Finished Product to Deliver Cycle
Time The average time associated with releasing finished product to
deliver Best Practices: . Accurate and Low Cost Batch Records for
Regulatory Compliance Electronic batch records
. Automated Notification of Laboratory Regarding Sample Availability
Interface between production system and LIMS
. Review Batch Records by Exception Electronic batch records linked to process plans/recipes and exceptions flagged
Inputs: . Workflow from M1.5 Stage Product Outputs: . Finished Product Release to D4.2 Receive
Product at Store The authorization to ship a finished product that has been ordered.
. Finished Product Release to D1.8 Receive
Product from Source or Make The authorization to ship a finished product that has been ordered.
. Information Feedback to M1.1 Schedule
Production Activities The flow of information back into the control system so that actual
performance can be compared with planned performance.
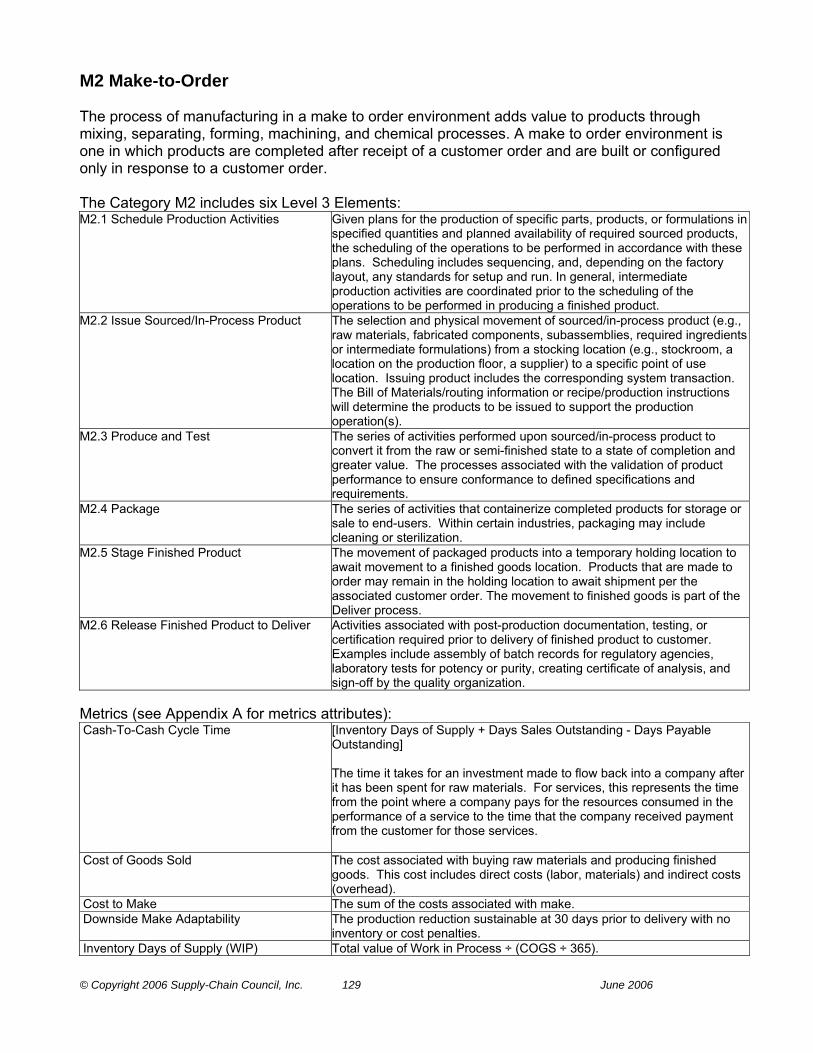
© Copyright 2006 Supply-Chain Council, Inc. 129 June 2006
M2 Make-to-Order The process of manufacturing in a make to order environment adds value to products through mixing, separating, forming, machining, and chemical processes. A make to order environment is one in which products are completed after receipt of a customer order and are built or configured only in response to a customer order. The Category M2 includes six Level 3 Elements: M2.1 Schedule Production Activities Given plans for the production of specific parts, products, or formulations in
specified quantities and planned availability of required sourced products, the scheduling of the operations to be performed in accordance with these plans. Scheduling includes sequencing, and, depending on the factory layout, any standards for setup and run. In general, intermediate production activities are coordinated prior to the scheduling of the operations to be performed in producing a finished product.
M2.2 Issue Sourced/In-Process Product The selection and physical movement of sourced/in-process product (e.g., raw materials, fabricated components, subassemblies, required ingredients or intermediate formulations) from a stocking location (e.g., stockroom, a location on the production floor, a supplier) to a specific point of use location. Issuing product includes the corresponding system transaction. The Bill of Materials/routing information or recipe/production instructions will determine the products to be issued to support the production operation(s).
M2.3 Produce and Test The series of activities performed upon sourced/in-process product to convert it from the raw or semi-finished state to a state of completion and greater value. The processes associated with the validation of product performance to ensure conformance to defined specifications and requirements.
M2.4 Package The series of activities that containerize completed products for storage or sale to end-users. Within certain industries, packaging may include cleaning or sterilization.
M2.5 Stage Finished Product The movement of packaged products into a temporary holding location to await movement to a finished goods location. Products that are made to order may remain in the holding location to await shipment per the associated customer order. The movement to finished goods is part of the Deliver process.
M2.6 Release Finished Product to Deliver Activities associated with post-production documentation, testing, or certification required prior to delivery of finished product to customer. Examples include assembly of batch records for regulatory agencies, laboratory tests for potency or purity, creating certificate of analysis, and sign-off by the quality organization.
Metrics (see Appendix A for metrics attributes): Cash-To-Cash Cycle Time [Inventory Days of Supply + Days Sales Outstanding - Days Payable
Outstanding] The time it takes for an investment made to flow back into a company after it has been spent for raw materials. For services, this represents the time from the point where a company pays for the resources consumed in the performance of a service to the time that the company received payment from the customer for those services.
Cost of Goods Sold The cost associated with buying raw materials and producing finished goods. This cost includes direct costs (labor, materials) and indirect costs (overhead).
Cost to Make The sum of the costs associated with make. Downside Make Adaptability The production reduction sustainable at 30 days prior to delivery with no
inventory or cost penalties. Inventory Days of Supply (WIP) Total value of Work in Process ÷ (COGS ÷ 365).
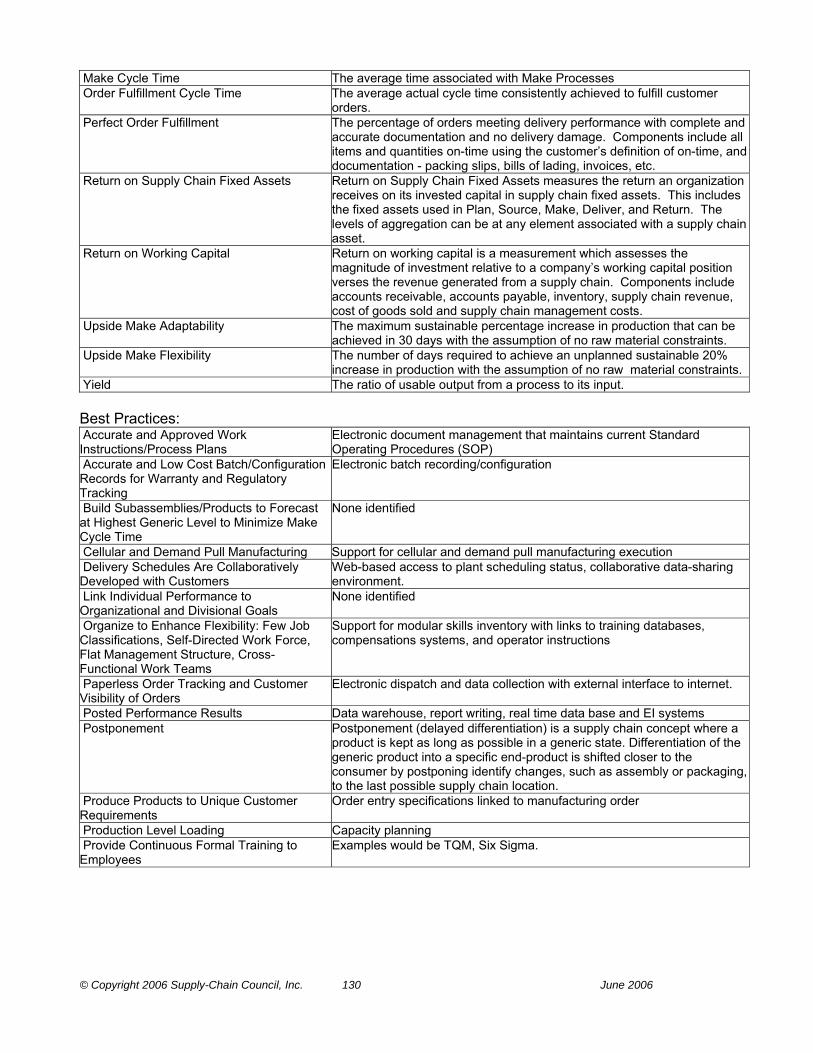
© Copyright 2006 Supply-Chain Council, Inc. 130 June 2006
Make Cycle Time The average time associated with Make Processes Order Fulfillment Cycle Time The average actual cycle time consistently achieved to fulfill customer
orders. Perfect Order Fulfillment The percentage of orders meeting delivery performance with complete and
accurate documentation and no delivery damage. Components include all items and quantities on-time using the customer’s definition of on-time, and documentation - packing slips, bills of lading, invoices, etc.
Return on Supply Chain Fixed Assets Return on Supply Chain Fixed Assets measures the return an organization receives on its invested capital in supply chain fixed assets. This includes the fixed assets used in Plan, Source, Make, Deliver, and Return. The levels of aggregation can be at any element associated with a supply chain asset.
Return on Working Capital Return on working capital is a measurement which assesses the magnitude of investment relative to a company’s working capital position verses the revenue generated from a supply chain. Components include accounts receivable, accounts payable, inventory, supply chain revenue, cost of goods sold and supply chain management costs.
Upside Make Adaptability The maximum sustainable percentage increase in production that can be achieved in 30 days with the assumption of no raw material constraints.
Upside Make Flexibility The number of days required to achieve an unplanned sustainable 20% increase in production with the assumption of no raw material constraints.
Yield The ratio of usable output from a process to its input. Best Practices: Accurate and Approved Work Instructions/Process Plans
Electronic document management that maintains current Standard Operating Procedures (SOP)
Accurate and Low Cost Batch/Configuration Records for Warranty and Regulatory Tracking
Electronic batch recording/configuration
Build Subassemblies/Products to Forecast at Highest Generic Level to Minimize Make Cycle Time
None identified
Cellular and Demand Pull Manufacturing Support for cellular and demand pull manufacturing execution Delivery Schedules Are Collaboratively Developed with Customers
Web-based access to plant scheduling status, collaborative data-sharing environment.
Link Individual Performance to Organizational and Divisional Goals
None identified
Organize to Enhance Flexibility: Few Job Classifications, Self-Directed Work Force, Flat Management Structure, Cross-Functional Work Teams
Support for modular skills inventory with links to training databases, compensations systems, and operator instructions
Paperless Order Tracking and Customer Visibility of Orders
Electronic dispatch and data collection with external interface to internet.
Posted Performance Results Data warehouse, report writing, real time data base and EI systems Postponement Postponement (delayed differentiation) is a supply chain concept where a
product is kept as long as possible in a generic state. Differentiation of the generic product into a specific end-product is shifted closer to the consumer by postponing identify changes, such as assembly or packaging, to the last possible supply chain location.
Produce Products to Unique Customer Requirements
Order entry specifications linked to manufacturing order
Production Level Loading Capacity planning Provide Continuous Formal Training to Employees
Examples would be TQM, Six Sigma.

© Copyright 2006 Supply-Chain Council, Inc. 131 June 2006
M2.1 Schedule Production Activities Given plans for the production of specific parts, products, or formulations in specified quantities and planned availability of required sourced products, the scheduling of the operations to be performed in accordance with these plans. Scheduling includes sequencing, and, depending on the factory layout, any standards for setup and run. In general, intermediate production activities are coordinated prior to the scheduling of the operations to be performed in producing a finished product. Metrics (see Appendix A for metrics attributes): . Capacity Utilization A measure of how intensively a resource is being used to produce a
good or service. Some factors that should be considered are internal manufacturing capacity, constraining processes, direct labor availability and key components/materials availability.
. Cost to Schedule Production Activities The sum of the costs associated with scheduling production activities.
. Schedule Achievement The percentage of time that a plant achieves its production schedule. This calculation is based on the number of scheduled end-items or total volume for a specific period. Note: over-shipments do not make up for under-shipments.
. Schedule Production Activities Cycle Time The average time associated with scheduling production activities Best Practices: . Additional Capacity for Overflow Demand Outsource manufacturing and work force augmentation providers
connected to production schedules via the internet. . Cross Training/Certification HR/certification support . Demand Pull Mechanisms Repetitive scheduling and sequencing . Demand-Pull Manufacturing, Including
Active Reduction of Manufacturing Systems Time and WIP Through the Use of Demand-Pull Mechanisms and Visual Controls
Support of demand-pull mechanisms (Kanban, replenishment signals, etc.) based on rate schedules and user-defined minimum/maximum trigger points
. Drum-Buffer-Rope Scheduling Technique (DBR, also referred to as Synchronous Manufacturing or Constraint Management) A technique used to manage resources to maximize throughput.
. Maintain Data and System Integrity by Ensuring Production Data, Inventory Levels, and Schedule Requirements Are 99+% Accurate
Detailed production model that synchronizes PLAN and MAKE activities in real time.
. Produce Products to Unique Customer Specification
Order entry, engineering, and product specifications linked to production order
. Schedule Includes Preventative Maintenance Program
Interface between maintenance management system and scheduling system
. Schedule Minimizes Changeover Costs Detailed production scheduling model and simulation capabilities . Schedule Optimizes Use of Shared
Resources Such as Tooling and Production Equipment
Scheduling utilizing optimization techniques. Required production resources included in routing/process instructions
. Schedule Reflects Current Plant Status (Equipment Availability, Other Jobs and Resource Availability) On Line
Schedule undated by on line reporting and status systems and re-sequence activities
Inputs: . Equipment and Facilities Schedules and
Plans from EM.5 Manage Equipment and Facilities
Time-phased plans of present and future load (capacity required) on all resources (Equipment and Facilities) based on the planned and released supply authorizations (i.e., orders) and the planned capacity (capacity available) of these resources over a span of time.
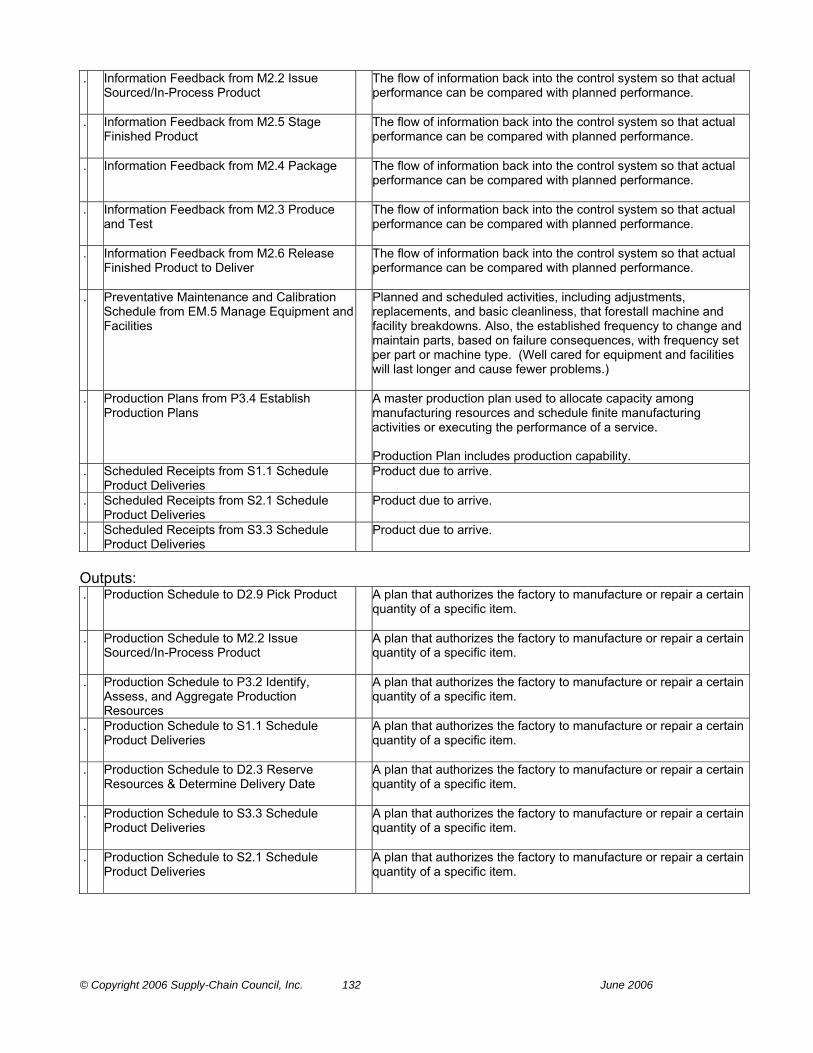
© Copyright 2006 Supply-Chain Council, Inc. 132 June 2006
. Information Feedback from M2.2 Issue Sourced/In-Process Product
The flow of information back into the control system so that actual performance can be compared with planned performance.
. Information Feedback from M2.5 Stage Finished Product
The flow of information back into the control system so that actual performance can be compared with planned performance.
. Information Feedback from M2.4 Package The flow of information back into the control system so that actual performance can be compared with planned performance.
. Information Feedback from M2.3 Produce and Test
The flow of information back into the control system so that actual performance can be compared with planned performance.
. Information Feedback from M2.6 Release Finished Product to Deliver
The flow of information back into the control system so that actual performance can be compared with planned performance.
. Preventative Maintenance and Calibration Schedule from EM.5 Manage Equipment and Facilities
Planned and scheduled activities, including adjustments, replacements, and basic cleanliness, that forestall machine and facility breakdowns. Also, the established frequency to change and maintain parts, based on failure consequences, with frequency set per part or machine type. (Well cared for equipment and facilities will last longer and cause fewer problems.)
. Production Plans from P3.4 Establish Production Plans
A master production plan used to allocate capacity among manufacturing resources and schedule finite manufacturing activities or executing the performance of a service. Production Plan includes production capability.
. Scheduled Receipts from S1.1 Schedule Product Deliveries
Product due to arrive.
. Scheduled Receipts from S2.1 Schedule Product Deliveries
Product due to arrive.
. Scheduled Receipts from S3.3 Schedule Product Deliveries
Product due to arrive.
Outputs: . Production Schedule to D2.9 Pick Product A plan that authorizes the factory to manufacture or repair a certain
quantity of a specific item.
. Production Schedule to M2.2 Issue Sourced/In-Process Product
A plan that authorizes the factory to manufacture or repair a certain quantity of a specific item.
. Production Schedule to P3.2 Identify, Assess, and Aggregate Production Resources
A plan that authorizes the factory to manufacture or repair a certain quantity of a specific item.
. Production Schedule to S1.1 Schedule Product Deliveries
A plan that authorizes the factory to manufacture or repair a certain quantity of a specific item.
. Production Schedule to D2.3 Reserve Resources & Determine Delivery Date
A plan that authorizes the factory to manufacture or repair a certain quantity of a specific item.
. Production Schedule to S3.3 Schedule Product Deliveries
A plan that authorizes the factory to manufacture or repair a certain quantity of a specific item.
. Production Schedule to S2.1 Schedule Product Deliveries
A plan that authorizes the factory to manufacture or repair a certain quantity of a specific item.

© Copyright 2006 Supply-Chain Council, Inc. 133 June 2006
M2.2 Issue Sourced/In-Process Product The selection and physical movement of sourced/in-process product (e.g., raw materials, fabricated components, subassemblies, required ingredients or intermediate formulations) from a stocking location (e.g., stockroom, a location on the production floor, a supplier) to a specific point of use location. Issuing product includes the corresponding system transaction. The Bill of Materials/routing information or recipe/production instructions will determine the products to be issued to support the production operation(s). Metrics (see Appendix A for metrics attributes): . Cost to Issue Sourced/In-Process Product The sum of the costs associated with issuing sourced or in-process
material. . Issue Sourced/In-Process Product Cycle
Time The average time associated with the issuance of material to
production Best Practices: . Back Flush Material at Order Completion Flexible back flush logic . Complete Lot History Inventory by lot of sourced/in-process or discrete order /usage
reporting by lot or discrete order . Demand-Pull Mechanisms; Kanban
Replenishment Signals from Stockroom, Intermediate Products, or Subassembly Area
None identified
. Electronic Material Move Transactions Automated process control and/or barcode data collection . Strategic Safety Stock of Selected Materials,
Items, or Subassemblies to Decouple Sourced Product Issuance Cycle Time from Supplier Lead Time
Use of safety stock algorithms to minimize stock levels.
. Supplier Delivery to Production Process at Point of Use
EDI link to supplier’s sales order and inventory systems
Inputs: . Inventory Availability from S1.4 Transfer
Product Those stocks or items on hand used to support production (raw
materials and work in process items), supporting activities (maintenance, repairs and operating supplies), and customer service (finished goods and spare parts).
. Inventory Availability from S2.4 Transfer Product
Those stocks or items on hand used to support production (raw materials and work in process items), supporting activities (maintenance, repairs and operating supplies), and customer service (finished goods and spare parts).
. Inventory Availability from S3.6 Transfer Product
Those stocks or items on hand used to support production (raw materials and work in process items), supporting activities (maintenance, repairs and operating supplies), and customer service (finished goods and spare parts).
. Production Schedule from M2.1 Schedule Production Activities
A plan that authorizes the factory to manufacture or repair a certain quantity of a specific item.
. WIP Handling Rules, Move Information and Methods from EM.4 Manage In-Process Products (WIP)
The rules for handling WIP items in the production and repair process. These rules include the movement and accounting for in-process items between work locations, in inventory, and movement inventory.
. WIP Location Rules from EM.6 Manage Transportation
The process and rules for establishing and maintaining in-process item inventory ownership and stocking locations.
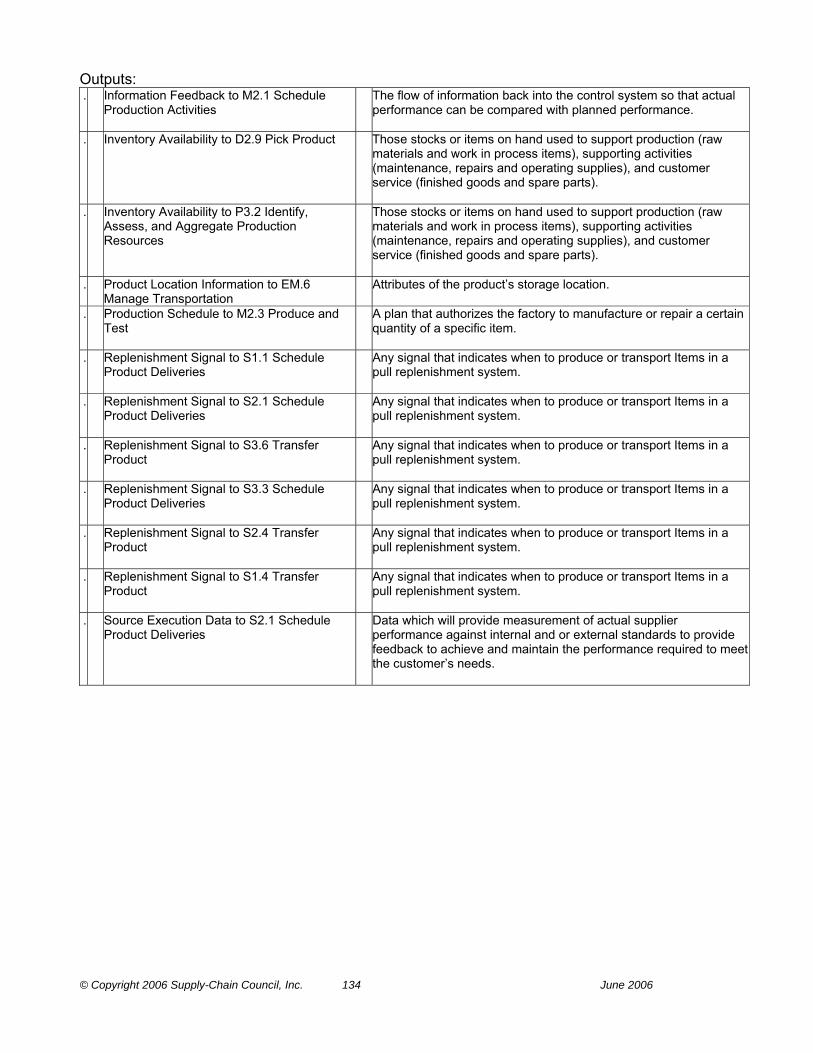
© Copyright 2006 Supply-Chain Council, Inc. 134 June 2006
Outputs: . Information Feedback to M2.1 Schedule
Production Activities The flow of information back into the control system so that actual
performance can be compared with planned performance.
. Inventory Availability to D2.9 Pick Product Those stocks or items on hand used to support production (raw materials and work in process items), supporting activities (maintenance, repairs and operating supplies), and customer service (finished goods and spare parts).
. Inventory Availability to P3.2 Identify, Assess, and Aggregate Production Resources
Those stocks or items on hand used to support production (raw materials and work in process items), supporting activities (maintenance, repairs and operating supplies), and customer service (finished goods and spare parts).
. Product Location Information to EM.6 Manage Transportation
Attributes of the product’s storage location.
. Production Schedule to M2.3 Produce and Test
A plan that authorizes the factory to manufacture or repair a certain quantity of a specific item.
. Replenishment Signal to S1.1 Schedule Product Deliveries
Any signal that indicates when to produce or transport Items in a pull replenishment system.
. Replenishment Signal to S2.1 Schedule Product Deliveries
Any signal that indicates when to produce or transport Items in a pull replenishment system.
. Replenishment Signal to S3.6 Transfer Product
Any signal that indicates when to produce or transport Items in a pull replenishment system.
. Replenishment Signal to S3.3 Schedule Product Deliveries
Any signal that indicates when to produce or transport Items in a pull replenishment system.
. Replenishment Signal to S2.4 Transfer Product
Any signal that indicates when to produce or transport Items in a pull replenishment system.
. Replenishment Signal to S1.4 Transfer Product
Any signal that indicates when to produce or transport Items in a pull replenishment system.
. Source Execution Data to S2.1 Schedule Product Deliveries
Data which will provide measurement of actual supplier performance against internal and or external standards to provide feedback to achieve and maintain the performance required to meet the customer’s needs.
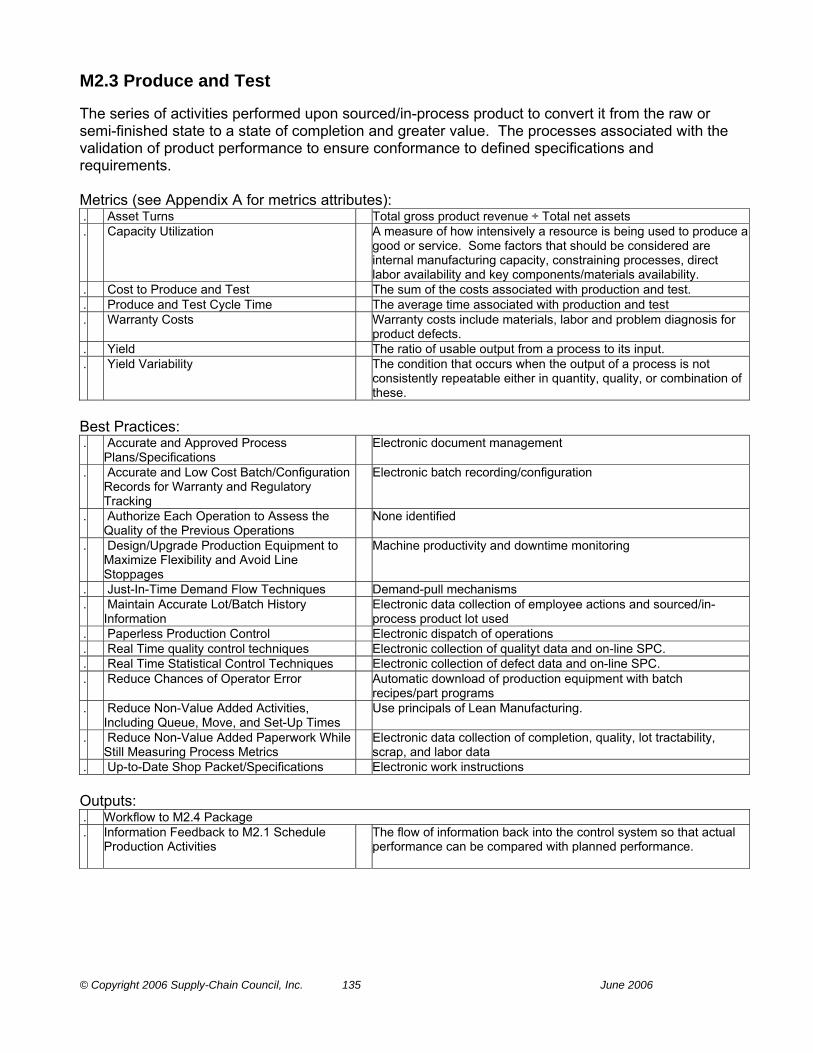
© Copyright 2006 Supply-Chain Council, Inc. 135 June 2006
M2.3 Produce and Test The series of activities performed upon sourced/in-process product to convert it from the raw or semi-finished state to a state of completion and greater value. The processes associated with the validation of product performance to ensure conformance to defined specifications and requirements. Metrics (see Appendix A for metrics attributes): . Asset Turns Total gross product revenue ÷ Total net assets . Capacity Utilization A measure of how intensively a resource is being used to produce a
good or service. Some factors that should be considered are internal manufacturing capacity, constraining processes, direct labor availability and key components/materials availability.
. Cost to Produce and Test The sum of the costs associated with production and test. . Produce and Test Cycle Time The average time associated with production and test . Warranty Costs Warranty costs include materials, labor and problem diagnosis for
product defects. . Yield The ratio of usable output from a process to its input. . Yield Variability The condition that occurs when the output of a process is not
consistently repeatable either in quantity, quality, or combination of these.
Best Practices: . Accurate and Approved Process
Plans/Specifications Electronic document management
. Accurate and Low Cost Batch/Configuration Records for Warranty and Regulatory Tracking
Electronic batch recording/configuration
. Authorize Each Operation to Assess the Quality of the Previous Operations
None identified
. Design/Upgrade Production Equipment to Maximize Flexibility and Avoid Line Stoppages
Machine productivity and downtime monitoring
. Just-In-Time Demand Flow Techniques Demand-pull mechanisms . Maintain Accurate Lot/Batch History
Information Electronic data collection of employee actions and sourced/in-
process product lot used . Paperless Production Control Electronic dispatch of operations . Real Time quality control techniques Electronic collection of qualityt data and on-line SPC. . Real Time Statistical Control Techniques Electronic collection of defect data and on-line SPC. . Reduce Chances of Operator Error Automatic download of production equipment with batch
recipes/part programs . Reduce Non-Value Added Activities,
Including Queue, Move, and Set-Up Times Use principals of Lean Manufacturing.
. Reduce Non-Value Added Paperwork While Still Measuring Process Metrics
Electronic data collection of completion, quality, lot tractability, scrap, and labor data
. Up-to-Date Shop Packet/Specifications Electronic work instructions Outputs: . Workflow to M2.4 Package . Information Feedback to M2.1 Schedule
Production Activities The flow of information back into the control system so that actual
performance can be compared with planned performance.
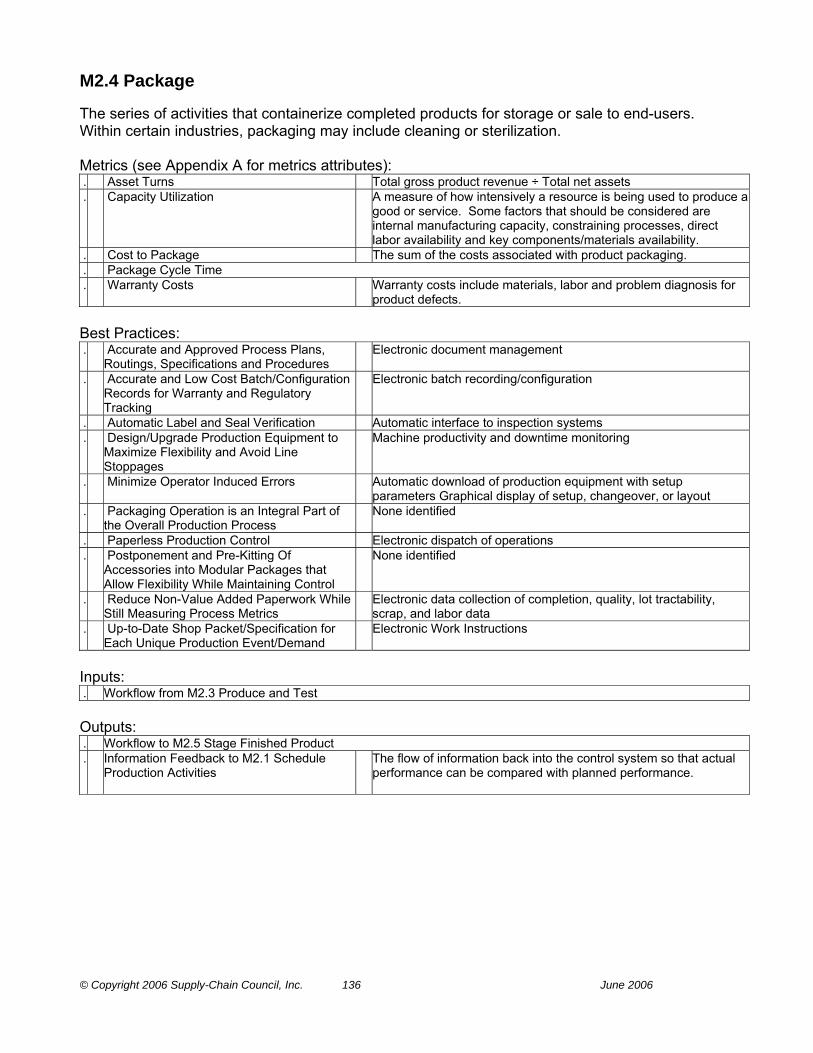
© Copyright 2006 Supply-Chain Council, Inc. 136 June 2006
M2.4 Package The series of activities that containerize completed products for storage or sale to end-users. Within certain industries, packaging may include cleaning or sterilization. Metrics (see Appendix A for metrics attributes): . Asset Turns Total gross product revenue ÷ Total net assets . Capacity Utilization A measure of how intensively a resource is being used to produce a
good or service. Some factors that should be considered are internal manufacturing capacity, constraining processes, direct labor availability and key components/materials availability.
. Cost to Package The sum of the costs associated with product packaging. . Package Cycle Time . Warranty Costs Warranty costs include materials, labor and problem diagnosis for
product defects. Best Practices: . Accurate and Approved Process Plans,
Routings, Specifications and Procedures Electronic document management
. Accurate and Low Cost Batch/Configuration Records for Warranty and Regulatory Tracking
Electronic batch recording/configuration
. Automatic Label and Seal Verification Automatic interface to inspection systems . Design/Upgrade Production Equipment to
Maximize Flexibility and Avoid Line Stoppages
Machine productivity and downtime monitoring
. Minimize Operator Induced Errors Automatic download of production equipment with setup parameters Graphical display of setup, changeover, or layout
. Packaging Operation is an Integral Part of the Overall Production Process
None identified
. Paperless Production Control Electronic dispatch of operations . Postponement and Pre-Kitting Of
Accessories into Modular Packages that Allow Flexibility While Maintaining Control
None identified
. Reduce Non-Value Added Paperwork While Still Measuring Process Metrics
Electronic data collection of completion, quality, lot tractability, scrap, and labor data
. Up-to-Date Shop Packet/Specification for Each Unique Production Event/Demand
Electronic Work Instructions
Inputs: . Workflow from M2.3 Produce and Test Outputs: . Workflow to M2.5 Stage Finished Product . Information Feedback to M2.1 Schedule
Production Activities The flow of information back into the control system so that actual
performance can be compared with planned performance.
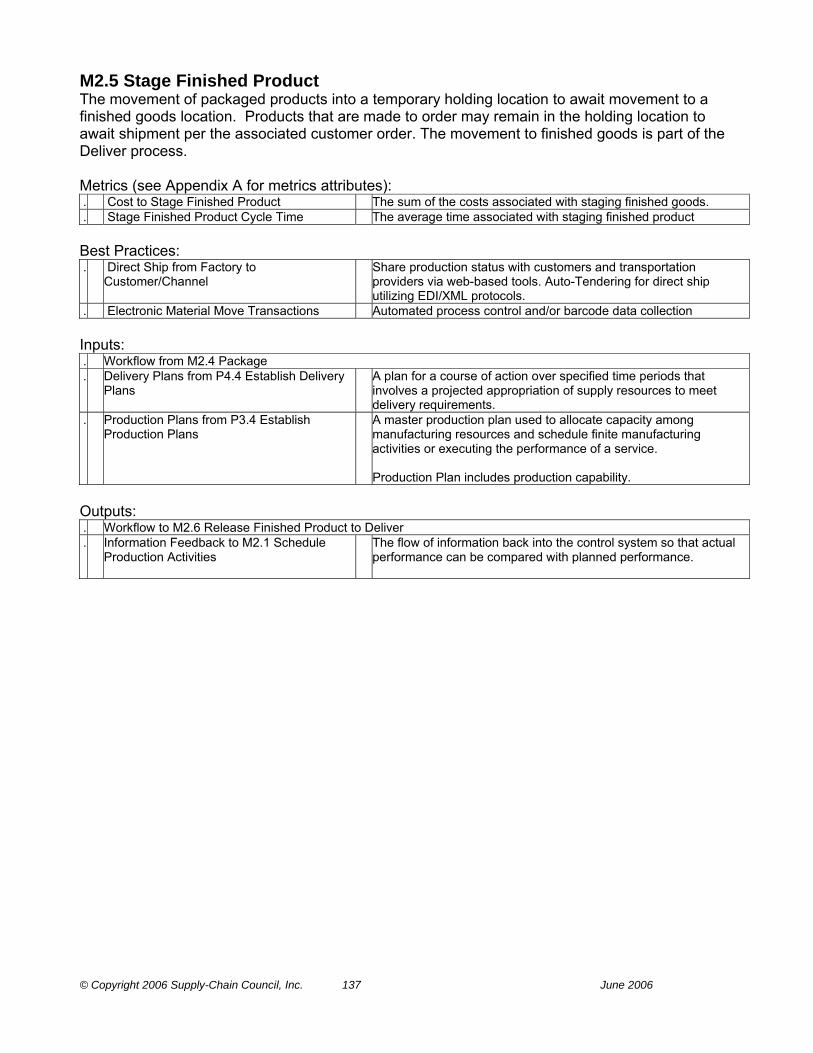
© Copyright 2006 Supply-Chain Council, Inc. 137 June 2006
M2.5 Stage Finished Product The movement of packaged products into a temporary holding location to await movement to a finished goods location. Products that are made to order may remain in the holding location to await shipment per the associated customer order. The movement to finished goods is part of the Deliver process. Metrics (see Appendix A for metrics attributes): . Cost to Stage Finished Product The sum of the costs associated with staging finished goods. . Stage Finished Product Cycle Time The average time associated with staging finished product Best Practices: . Direct Ship from Factory to
Customer/Channel Share production status with customers and transportation
providers via web-based tools. Auto-Tendering for direct ship utilizing EDI/XML protocols.
. Electronic Material Move Transactions Automated process control and/or barcode data collection Inputs: . Workflow from M2.4 Package . Delivery Plans from P4.4 Establish Delivery
Plans A plan for a course of action over specified time periods that
involves a projected appropriation of supply resources to meet delivery requirements.
. Production Plans from P3.4 Establish Production Plans
A master production plan used to allocate capacity among manufacturing resources and schedule finite manufacturing activities or executing the performance of a service. Production Plan includes production capability.
Outputs: . Workflow to M2.6 Release Finished Product to Deliver . Information Feedback to M2.1 Schedule
Production Activities The flow of information back into the control system so that actual
performance can be compared with planned performance.

© Copyright 2006 Supply-Chain Council, Inc. 138 June 2006
M2.6 Release Finished Product to Deliver Activities associated with post-production documentation, testing, or certification required prior to delivery of finished product to customer. Examples include assembly of batch records for regulatory agencies, laboratory tests for potency or purity, creating certificate of analysis, and sign-off by the quality organization. Metrics (see Appendix A for metrics attributes): . Cost to Release Finished Product to Deliver The sum of the costs associated with releasing finished goods to
deliver processes. . Release Finished Product to Deliver Cycle
Time The average time associated with releasing finished product to
deliver Best Practices: . Accurate and Low Cost Batch Records for
Regulatory Compliance Electronic batch records
. Automated Notification of Laboratory Regarding Sample Availability
Interface between production system and LIMS
. Review Batch Records by Exception Electronic batch records linked to process plans/recipes and exceptions flagged
Inputs: . Workflow from M2.5 Stage Finished Product Outputs: . Finished Product Release to D2.9 Pick
Product The authorization to ship a finished product that has been ordered.
. Information Feedback to M2.1 Schedule
Production Activities The flow of information back into the control system so that actual
performance can be compared with planned performance.
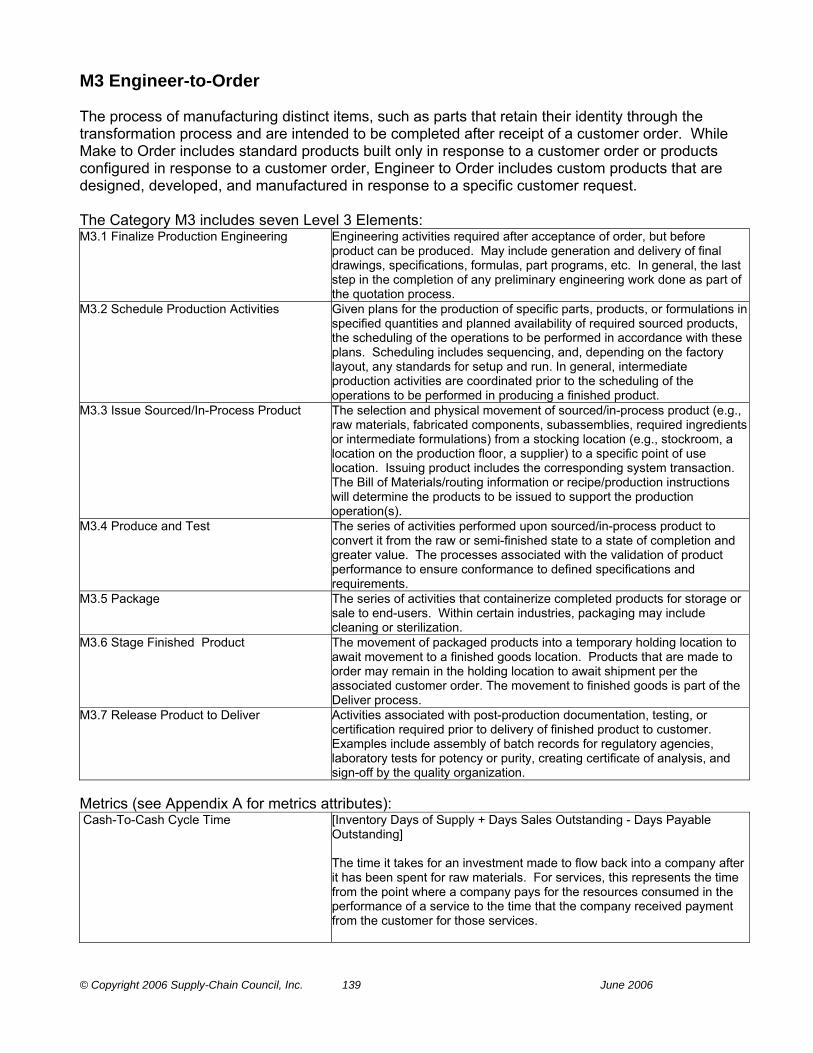
© Copyright 2006 Supply-Chain Council, Inc. 139 June 2006
M3 Engineer-to-Order The process of manufacturing distinct items, such as parts that retain their identity through the transformation process and are intended to be completed after receipt of a customer order. While Make to Order includes standard products built only in response to a customer order or products configured in response to a customer order, Engineer to Order includes custom products that are designed, developed, and manufactured in response to a specific customer request. The Category M3 includes seven Level 3 Elements: M3.1 Finalize Production Engineering Engineering activities required after acceptance of order, but before
product can be produced. May include generation and delivery of final drawings, specifications, formulas, part programs, etc. In general, the last step in the completion of any preliminary engineering work done as part of the quotation process.
M3.2 Schedule Production Activities Given plans for the production of specific parts, products, or formulations in specified quantities and planned availability of required sourced products, the scheduling of the operations to be performed in accordance with these plans. Scheduling includes sequencing, and, depending on the factory layout, any standards for setup and run. In general, intermediate production activities are coordinated prior to the scheduling of the operations to be performed in producing a finished product.
M3.3 Issue Sourced/In-Process Product The selection and physical movement of sourced/in-process product (e.g., raw materials, fabricated components, subassemblies, required ingredients or intermediate formulations) from a stocking location (e.g., stockroom, a location on the production floor, a supplier) to a specific point of use location. Issuing product includes the corresponding system transaction. The Bill of Materials/routing information or recipe/production instructions will determine the products to be issued to support the production operation(s).
M3.4 Produce and Test The series of activities performed upon sourced/in-process product to convert it from the raw or semi-finished state to a state of completion and greater value. The processes associated with the validation of product performance to ensure conformance to defined specifications and requirements.
M3.5 Package The series of activities that containerize completed products for storage or sale to end-users. Within certain industries, packaging may include cleaning or sterilization.
M3.6 Stage Finished Product The movement of packaged products into a temporary holding location to await movement to a finished goods location. Products that are made to order may remain in the holding location to await shipment per the associated customer order. The movement to finished goods is part of the Deliver process.
M3.7 Release Product to Deliver Activities associated with post-production documentation, testing, or certification required prior to delivery of finished product to customer. Examples include assembly of batch records for regulatory agencies, laboratory tests for potency or purity, creating certificate of analysis, and sign-off by the quality organization.
Metrics (see Appendix A for metrics attributes): Cash-To-Cash Cycle Time [Inventory Days of Supply + Days Sales Outstanding - Days Payable
Outstanding] The time it takes for an investment made to flow back into a company after it has been spent for raw materials. For services, this represents the time from the point where a company pays for the resources consumed in the performance of a service to the time that the company received payment from the customer for those services.
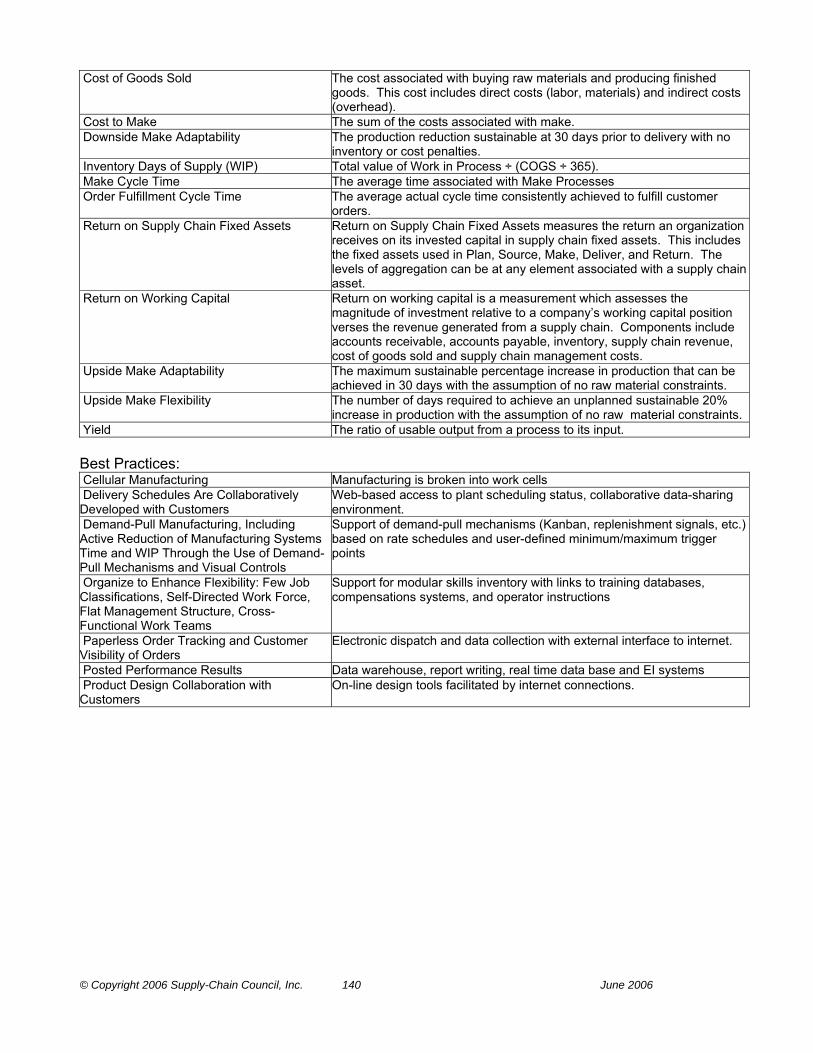
© Copyright 2006 Supply-Chain Council, Inc. 140 June 2006
Cost of Goods Sold The cost associated with buying raw materials and producing finished goods. This cost includes direct costs (labor, materials) and indirect costs (overhead).
Cost to Make The sum of the costs associated with make. Downside Make Adaptability The production reduction sustainable at 30 days prior to delivery with no
inventory or cost penalties. Inventory Days of Supply (WIP) Total value of Work in Process ÷ (COGS ÷ 365). Make Cycle Time The average time associated with Make Processes Order Fulfillment Cycle Time The average actual cycle time consistently achieved to fulfill customer
orders. Return on Supply Chain Fixed Assets Return on Supply Chain Fixed Assets measures the return an organization
receives on its invested capital in supply chain fixed assets. This includes the fixed assets used in Plan, Source, Make, Deliver, and Return. The levels of aggregation can be at any element associated with a supply chain asset.
Return on Working Capital Return on working capital is a measurement which assesses the magnitude of investment relative to a company’s working capital position verses the revenue generated from a supply chain. Components include accounts receivable, accounts payable, inventory, supply chain revenue, cost of goods sold and supply chain management costs.
Upside Make Adaptability The maximum sustainable percentage increase in production that can be achieved in 30 days with the assumption of no raw material constraints.
Upside Make Flexibility The number of days required to achieve an unplanned sustainable 20% increase in production with the assumption of no raw material constraints.
Yield The ratio of usable output from a process to its input. Best Practices: Cellular Manufacturing Manufacturing is broken into work cells Delivery Schedules Are Collaboratively Developed with Customers
Web-based access to plant scheduling status, collaborative data-sharing environment.
Demand-Pull Manufacturing, Including Active Reduction of Manufacturing Systems Time and WIP Through the Use of Demand-Pull Mechanisms and Visual Controls
Support of demand-pull mechanisms (Kanban, replenishment signals, etc.) based on rate schedules and user-defined minimum/maximum trigger points
Organize to Enhance Flexibility: Few Job Classifications, Self-Directed Work Force, Flat Management Structure, Cross-Functional Work Teams
Support for modular skills inventory with links to training databases, compensations systems, and operator instructions
Paperless Order Tracking and Customer Visibility of Orders
Electronic dispatch and data collection with external interface to internet.
Posted Performance Results Data warehouse, report writing, real time data base and EI systems Product Design Collaboration with Customers
On-line design tools facilitated by internet connections.
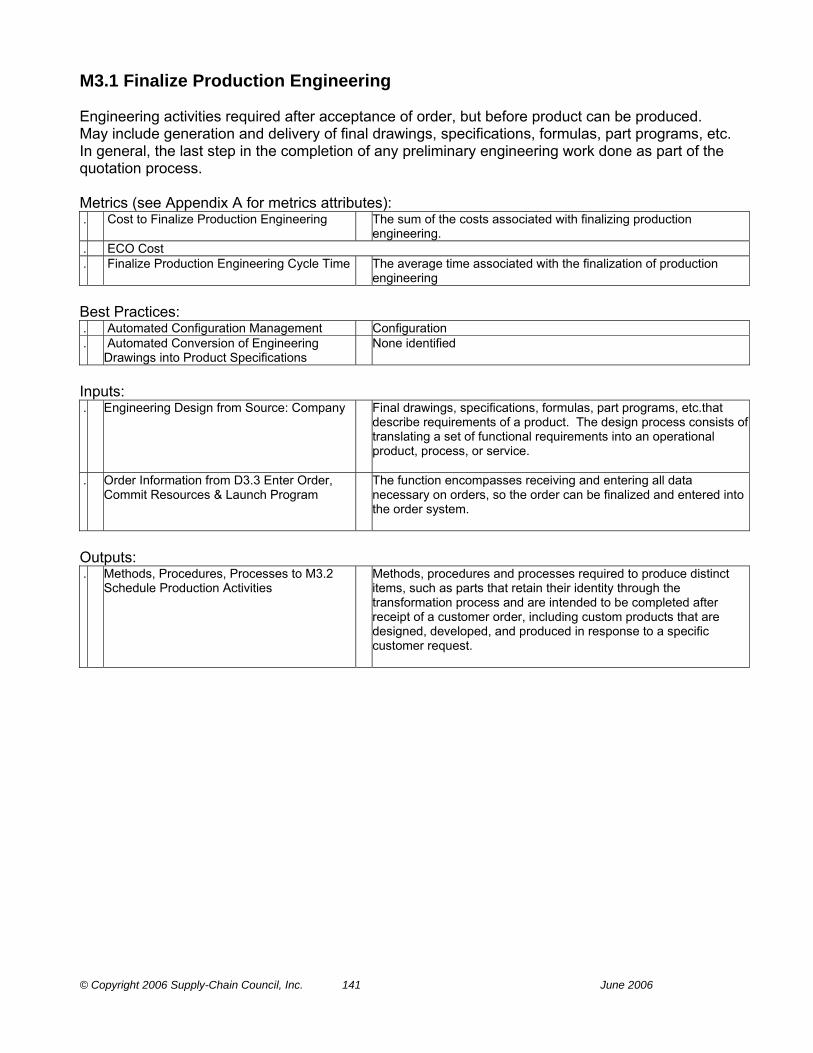
© Copyright 2006 Supply-Chain Council, Inc. 141 June 2006
M3.1 Finalize Production Engineering Engineering activities required after acceptance of order, but before product can be produced. May include generation and delivery of final drawings, specifications, formulas, part programs, etc. In general, the last step in the completion of any preliminary engineering work done as part of the quotation process. Metrics (see Appendix A for metrics attributes): . Cost to Finalize Production Engineering The sum of the costs associated with finalizing production
engineering. . ECO Cost . Finalize Production Engineering Cycle Time The average time associated with the finalization of production
engineering Best Practices: . Automated Configuration Management Configuration . Automated Conversion of Engineering
Drawings into Product Specifications None identified
Inputs: . Engineering Design from Source: Company Final drawings, specifications, formulas, part programs, etc.that
describe requirements of a product. The design process consists of translating a set of functional requirements into an operational product, process, or service.
. Order Information from D3.3 Enter Order, Commit Resources & Launch Program
The function encompasses receiving and entering all data necessary on orders, so the order can be finalized and entered into the order system.
Outputs: . Methods, Procedures, Processes to M3.2
Schedule Production Activities Methods, procedures and processes required to produce distinct
items, such as parts that retain their identity through the transformation process and are intended to be completed after receipt of a customer order, including custom products that are designed, developed, and produced in response to a specific customer request.
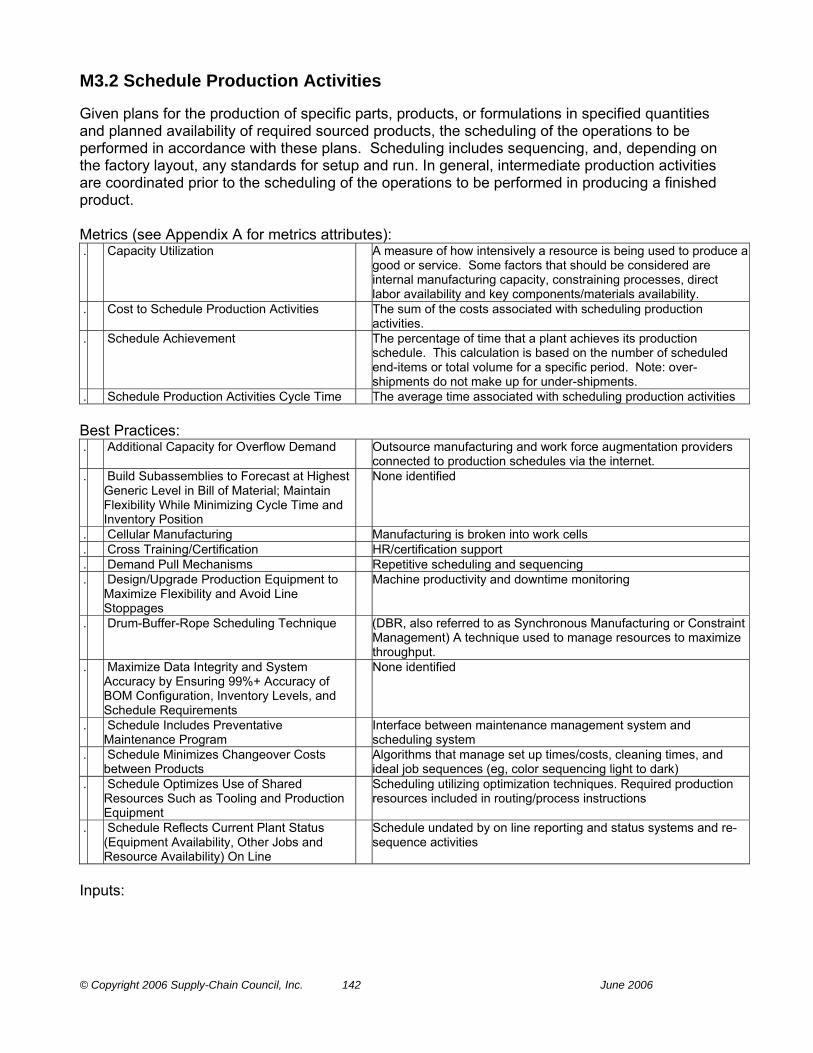
© Copyright 2006 Supply-Chain Council, Inc. 142 June 2006
M3.2 Schedule Production Activities Given plans for the production of specific parts, products, or formulations in specified quantities and planned availability of required sourced products, the scheduling of the operations to be performed in accordance with these plans. Scheduling includes sequencing, and, depending on the factory layout, any standards for setup and run. In general, intermediate production activities are coordinated prior to the scheduling of the operations to be performed in producing a finished product. Metrics (see Appendix A for metrics attributes): . Capacity Utilization A measure of how intensively a resource is being used to produce a
good or service. Some factors that should be considered are internal manufacturing capacity, constraining processes, direct labor availability and key components/materials availability.
. Cost to Schedule Production Activities The sum of the costs associated with scheduling production activities.
. Schedule Achievement The percentage of time that a plant achieves its production schedule. This calculation is based on the number of scheduled end-items or total volume for a specific period. Note: over-shipments do not make up for under-shipments.
. Schedule Production Activities Cycle Time The average time associated with scheduling production activities Best Practices: . Additional Capacity for Overflow Demand Outsource manufacturing and work force augmentation providers
connected to production schedules via the internet. . Build Subassemblies to Forecast at Highest
Generic Level in Bill of Material; Maintain Flexibility While Minimizing Cycle Time and Inventory Position
None identified
. Cellular Manufacturing Manufacturing is broken into work cells . Cross Training/Certification HR/certification support . Demand Pull Mechanisms Repetitive scheduling and sequencing . Design/Upgrade Production Equipment to
Maximize Flexibility and Avoid Line Stoppages
Machine productivity and downtime monitoring
. Drum-Buffer-Rope Scheduling Technique (DBR, also referred to as Synchronous Manufacturing or Constraint Management) A technique used to manage resources to maximize throughput.
. Maximize Data Integrity and System Accuracy by Ensuring 99%+ Accuracy of BOM Configuration, Inventory Levels, and Schedule Requirements
None identified
. Schedule Includes Preventative Maintenance Program
Interface between maintenance management system and scheduling system
. Schedule Minimizes Changeover Costs between Products
Algorithms that manage set up times/costs, cleaning times, and ideal job sequences (eg, color sequencing light to dark)
. Schedule Optimizes Use of Shared Resources Such as Tooling and Production Equipment
Scheduling utilizing optimization techniques. Required production resources included in routing/process instructions
. Schedule Reflects Current Plant Status (Equipment Availability, Other Jobs and Resource Availability) On Line
Schedule undated by on line reporting and status systems and re-sequence activities
Inputs:
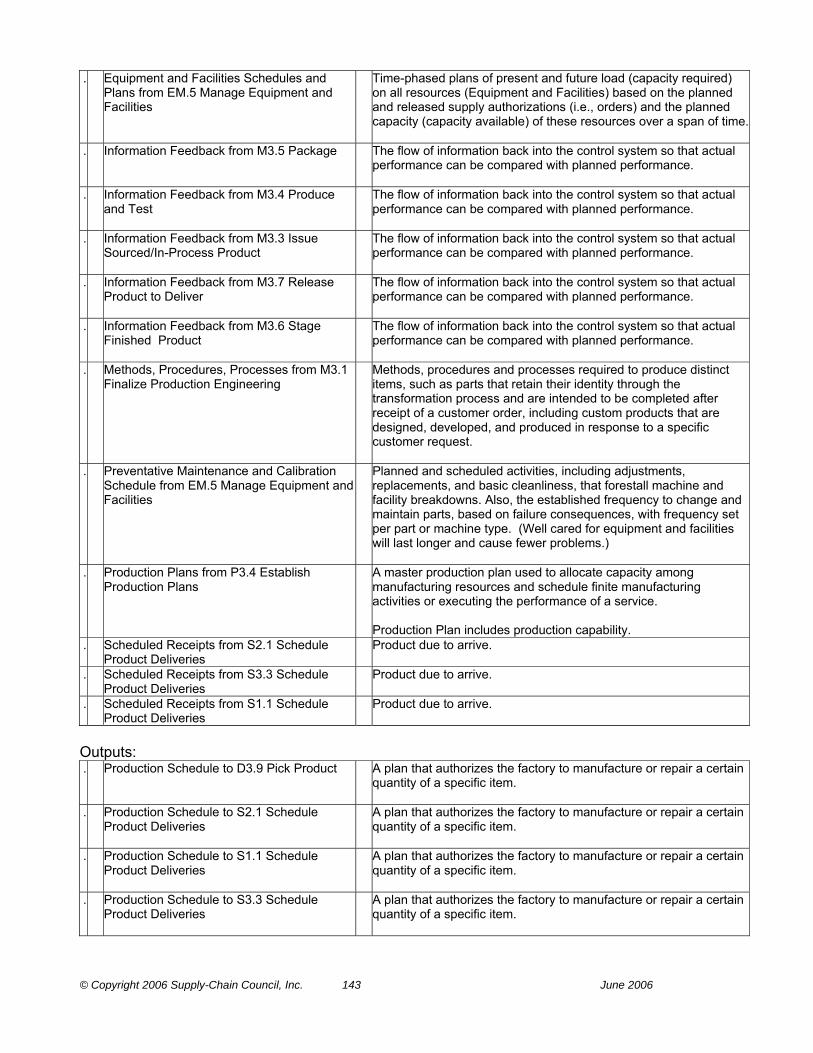
© Copyright 2006 Supply-Chain Council, Inc. 143 June 2006
. Equipment and Facilities Schedules and Plans from EM.5 Manage Equipment and Facilities
Time-phased plans of present and future load (capacity required) on all resources (Equipment and Facilities) based on the planned and released supply authorizations (i.e., orders) and the planned capacity (capacity available) of these resources over a span of time.
. Information Feedback from M3.5 Package The flow of information back into the control system so that actual performance can be compared with planned performance.
. Information Feedback from M3.4 Produce and Test
The flow of information back into the control system so that actual performance can be compared with planned performance.
. Information Feedback from M3.3 Issue Sourced/In-Process Product
The flow of information back into the control system so that actual performance can be compared with planned performance.
. Information Feedback from M3.7 Release Product to Deliver
The flow of information back into the control system so that actual performance can be compared with planned performance.
. Information Feedback from M3.6 Stage Finished Product
The flow of information back into the control system so that actual performance can be compared with planned performance.
. Methods, Procedures, Processes from M3.1 Finalize Production Engineering
Methods, procedures and processes required to produce distinct items, such as parts that retain their identity through the transformation process and are intended to be completed after receipt of a customer order, including custom products that are designed, developed, and produced in response to a specific customer request.
. Preventative Maintenance and Calibration Schedule from EM.5 Manage Equipment and Facilities
Planned and scheduled activities, including adjustments, replacements, and basic cleanliness, that forestall machine and facility breakdowns. Also, the established frequency to change and maintain parts, based on failure consequences, with frequency set per part or machine type. (Well cared for equipment and facilities will last longer and cause fewer problems.)
. Production Plans from P3.4 Establish Production Plans
A master production plan used to allocate capacity among manufacturing resources and schedule finite manufacturing activities or executing the performance of a service. Production Plan includes production capability.
. Scheduled Receipts from S2.1 Schedule Product Deliveries
Product due to arrive.
. Scheduled Receipts from S3.3 Schedule Product Deliveries
Product due to arrive.
. Scheduled Receipts from S1.1 Schedule Product Deliveries
Product due to arrive.
Outputs: . Production Schedule to D3.9 Pick Product A plan that authorizes the factory to manufacture or repair a certain
quantity of a specific item.
. Production Schedule to S2.1 Schedule Product Deliveries
A plan that authorizes the factory to manufacture or repair a certain quantity of a specific item.
. Production Schedule to S1.1 Schedule Product Deliveries
A plan that authorizes the factory to manufacture or repair a certain quantity of a specific item.
. Production Schedule to S3.3 Schedule Product Deliveries
A plan that authorizes the factory to manufacture or repair a certain quantity of a specific item.

© Copyright 2006 Supply-Chain Council, Inc. 144 June 2006
. Production Schedule to M3.3 Issue Sourced/In-Process Product
A plan that authorizes the factory to manufacture or repair a certain quantity of a specific item.
. Production Schedule to P3.2 Identify, Assess, and Aggregate Production Resources
A plan that authorizes the factory to manufacture or repair a certain quantity of a specific item.
. Production Schedule to D3.3 Enter Order, Commit Resources & Launch Program
A plan that authorizes the factory to manufacture or repair a certain quantity of a specific item.

© Copyright 2006 Supply-Chain Council, Inc. 145 June 2006
M3.3 Issue Sourced/In-Process Product The selection and physical movement of sourced/in-process product (e.g., raw materials, fabricated components, subassemblies, required ingredients or intermediate formulations) from a stocking location (e.g., stockroom, a location on the production floor, a supplier) to a specific point of use location. Issuing product includes the corresponding system transaction. The Bill of Materials/routing information or recipe/production instructions will determine the products to be issued to support the production operation(s). Activity Usage Type: Metrics (see Appendix A for metrics attributes): . Cost to Issue Sourced/In-Process Product The sum of the costs associated with issuing sourced or in-process
material. . Issue Sourced/In-Process Product Cycle
Time The average time associated with the issuance of material to
production Best Practices: . Back Flush Material at Order Completion Flexible back flush logic . Demand-Pull Mechanisms; Kanban
Replenishment Signals from Stockroom, Intermediate Products, or Subassembly Area
None identified
. Electronic Material Move Transactions Automated process control and/or barcode data collection . Strategic Safety Stock of Selected Materials,
Items, or Subassemblies to Decouple Sourced Product Issuance Cycle Time from Supplier Lead Time
Use of safety stock algorithms to minimize stock levels.
. Supplier Delivery to Production Process at Point of Use
EDI link to supplier’s sales order and inventory systems
. Two-Bin Floor Stock Located at Work Center for “B“ And “C“ Components - Controlled by Operators and Replenished When One Bin is Empty
None identified
Inputs: . Inventory Availability from S3.6 Transfer
Product Those stocks or items on hand used to support production (raw
materials and work in process items), supporting activities (maintenance, repairs and operating supplies), and customer service (finished goods and spare parts).
. Inventory Availability from S2.4 Transfer Product
Those stocks or items on hand used to support production (raw materials and work in process items), supporting activities (maintenance, repairs and operating supplies), and customer service (finished goods and spare parts).
. Inventory Availability from S1.4 Transfer Product
Those stocks or items on hand used to support production (raw materials and work in process items), supporting activities (maintenance, repairs and operating supplies), and customer service (finished goods and spare parts).
. Production Schedule from M3.2 Schedule Production Activities
A plan that authorizes the factory to manufacture or repair a certain quantity of a specific item.
. WIP Handling Rules, Move Information and Methods from EM.4 Manage In-Process Products (WIP)
The rules for handling WIP items in the production and repair process. These rules include the movement and accounting for in-process items between work locations, in inventory, and movement inventory.
. WIP Location Rules from EM.6 Manage Transportation
The process and rules for establishing and maintaining in-process item inventory ownership and stocking locations.

© Copyright 2006 Supply-Chain Council, Inc. 146 June 2006

© Copyright 2006 Supply-Chain Council, Inc. 147 June 2006
Outputs: . Workflow to M3.4 Produce and Test . Information Feedback to M3.2 Schedule
Production Activities The flow of information back into the control system so that actual
performance can be compared with planned performance.
. Inventory Availability to D3.9 Pick Product Those stocks or items on hand used to support production (raw materials and work in process items), supporting activities (maintenance, repairs and operating supplies), and customer service (finished goods and spare parts).
. Inventory Availability to P3.2 Identify, Assess, and Aggregate Production Resources
Those stocks or items on hand used to support production (raw materials and work in process items), supporting activities (maintenance, repairs and operating supplies), and customer service (finished goods and spare parts).
. Product Location Information to EM.6 Manage Transportation
Attributes of the product’s storage location.
. Replenishment Signal to S3.6 Transfer Product
Any signal that indicates when to produce or transport Items in a pull replenishment system.
. Replenishment Signal to S1.4 Transfer Product
Any signal that indicates when to produce or transport Items in a pull replenishment system.
. Replenishment Signal to S1.1 Schedule Product Deliveries
Any signal that indicates when to produce or transport Items in a pull replenishment system.
. Replenishment Signal to S2.4 Transfer Product
Any signal that indicates when to produce or transport Items in a pull replenishment system.
. Replenishment Signal to S3.3 Schedule Product Deliveries
Any signal that indicates when to produce or transport Items in a pull replenishment system.
. Replenishment Signal to S2.1 Schedule Product Deliveries
Any signal that indicates when to produce or transport Items in a pull replenishment system.

© Copyright 2006 Supply-Chain Council, Inc. 148 June 2006
M3.4 Produce and Test The series of activities performed upon sourced/in-process product to convert it from the raw or semi-finished state to a state of completion and greater value. The processes associated with the validation of product performance to ensure conformance to defined specifications and requirements. Metrics (see Appendix A for metrics attributes): . Asset Turns Total gross product revenue ÷ Total net assets . Capacity Utilization A measure of how intensively a resource is being used to produce a
good or service. Some factors that should be considered are internal manufacturing capacity, constraining processes, direct labor availability and key components/materials availability.
. Cost to Produce and Test The sum of the costs associated with production and test. . Produce and Test Cycle Time The average time associated with production and test . Warranty Costs Warranty costs include materials, labor and problem diagnosis for
product defects. . Yield The ratio of usable output from a process to its input. . Yield Variability The condition that occurs when the output of a process is not
consistently repeatable either in quantity, quality, or combination of these.
Best Practices: . Authorize Each Operation to Assess the
Quality of the Previous Operations None identified
. Design/Upgrade Production Equipment to Maximize Flexibility and Avoid Line Stoppages
Machine productivity and downtime monitoring
. Implement Employee Involvement Programs . Just-In-Time Demand Flow Techniques Demand-pull mechanisms . Link Individual Performance to
Organizational and Divisional Goals None identified
. Maintain Accurate Lot/Batch History Information
Electronic data collection of employee actions and sourced/in-process product lot used
. Paperless Production Control Electronic dispatch of operations . Provide Continuous Formal Training to
Employees Examples would be TQM, Six Sigma.
. Real Time quality control techniques Electronic collection of qualityt data and on-line SPC. . Real Time Statistical Control Techniques Electronic collection of defect data and on-line SPC. . Reduce Non-Value Added Activities,
Including Queue, Move, and Set-Up Times Use principals of Lean Manufacturing.
. Reduce Non-Value Added Paperwork While Still Measuring Process Metrics
Electronic data collection of completion, quality, lot tractability, scrap, and labor data
. Up-to-Date Shop Packet/Specifications Electronic work instructions Inputs: . Workflow from M3.3 Issue Sourced/In-Process Product Outputs: . Workflow to M3.5 Package . Information Feedback to M3.2 Schedule
Production Activities The flow of information back into the control system so that actual
performance can be compared with planned performance.
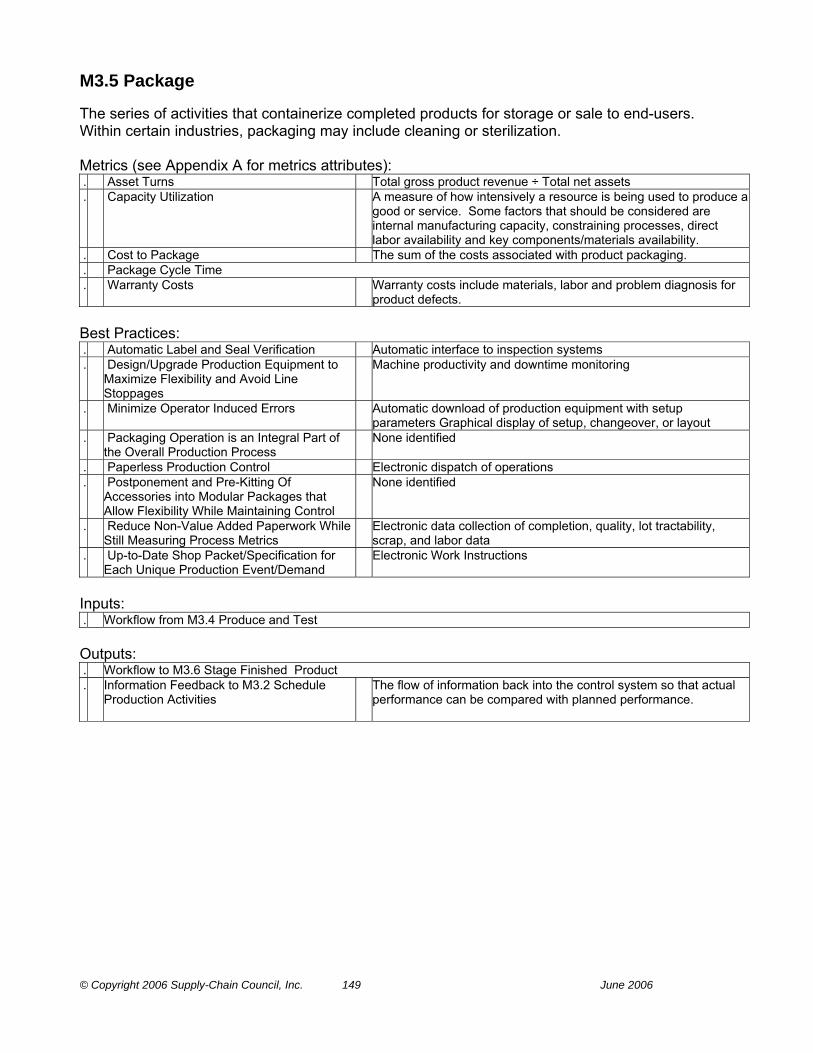
© Copyright 2006 Supply-Chain Council, Inc. 149 June 2006
M3.5 Package The series of activities that containerize completed products for storage or sale to end-users. Within certain industries, packaging may include cleaning or sterilization. Metrics (see Appendix A for metrics attributes): . Asset Turns Total gross product revenue ÷ Total net assets . Capacity Utilization A measure of how intensively a resource is being used to produce a
good or service. Some factors that should be considered are internal manufacturing capacity, constraining processes, direct labor availability and key components/materials availability.
. Cost to Package The sum of the costs associated with product packaging. . Package Cycle Time . Warranty Costs Warranty costs include materials, labor and problem diagnosis for
product defects. Best Practices: . Automatic Label and Seal Verification Automatic interface to inspection systems . Design/Upgrade Production Equipment to
Maximize Flexibility and Avoid Line Stoppages
Machine productivity and downtime monitoring
. Minimize Operator Induced Errors Automatic download of production equipment with setup parameters Graphical display of setup, changeover, or layout
. Packaging Operation is an Integral Part of the Overall Production Process
None identified
. Paperless Production Control Electronic dispatch of operations . Postponement and Pre-Kitting Of
Accessories into Modular Packages that Allow Flexibility While Maintaining Control
None identified
. Reduce Non-Value Added Paperwork While Still Measuring Process Metrics
Electronic data collection of completion, quality, lot tractability, scrap, and labor data
. Up-to-Date Shop Packet/Specification for Each Unique Production Event/Demand
Electronic Work Instructions
Inputs: . Workflow from M3.4 Produce and Test Outputs: . Workflow to M3.6 Stage Finished Product . Information Feedback to M3.2 Schedule
Production Activities The flow of information back into the control system so that actual
performance can be compared with planned performance.

© Copyright 2006 Supply-Chain Council, Inc. 150 June 2006
M3.6 Stage Finished Product The movement of packaged products into a temporary holding location to await movement to a finished goods location. Products that are made to order may remain in the holding location to await shipment per the associated customer order. The movement to finished goods is part of the Deliver process. Metrics (see Appendix A for metrics attributes): . Cost to Stage Finished Product The sum of the costs associated with staging finished goods. . Stage Finished Product Cycle Time The average time associated with staging finished product Best Practices: . Direct Ship from Factory to
Customer/Channel Share production status with customers and transportation
providers via web-based tools. Auto-Tendering for direct ship utilizing EDI/XML protocols.
. Electronic Material Move Transactions Automated process control and/or barcode data collection Inputs: . Workflow from M3.5 Package . Delivery Plans from P4.4 Establish Delivery
Plans A plan for a course of action over specified time periods that
involves a projected appropriation of supply resources to meet delivery requirements.
. Production Plans from P3.4 Establish Production Plans
A master production plan used to allocate capacity among manufacturing resources and schedule finite manufacturing activities or executing the performance of a service. Production Plan includes production capability.
Outputs: . Workflow to M3.7 Release Product to Deliver . Information Feedback to M3.2 Schedule
Production Activities The flow of information back into the control system so that actual
performance can be compared with planned performance.

© Copyright 2006 Supply-Chain Council, Inc. 151 June 2006
M3.7 Release Product to Deliver Activities associated with post-production documentation, testing, or certification required prior to delivery of finished product to customer. Examples include assembly of batch records for regulatory agencies, laboratory tests for potency or purity, creating certificate of analysis, and sign-off by the quality organization. Metrics (see Appendix A for metrics attributes): . Cost to Release Finished Product to Deliver The sum of the costs associated with releasing finished goods to
deliver processes. . Release Finished Product to Deliver Cycle
Time The average time associated with releasing finished product to
deliver Best Practices: . Accurate and Low Cost Batch Records for
Regulatory Compliance Electronic batch records
. Automated Notification of Laboratory Regarding Sample Availability
Interface between production system and LIMS
. Review Batch Records by Exception Electronic batch records linked to process plans/recipes and exceptions flagged
Inputs: . Workflow from M3.6 Stage Finished Product Outputs: . Finished Product Release to D3.9 Pick
Product The authorization to ship a finished product that has been ordered.
. Information Feedback to M3.2 Schedule
Production Activities The flow of information back into the control system so that actual
performance can be compared with planned performance.

© Copyright 2006 Supply-Chain Council, Inc. 152 June 2006
EM Enable MAKE Enable Processes prepare, maintain, or manage information or relationships on which planning and execution processes rely. The Category EM includes eight Level 3 Elements: EM.1 Manage Production Rules The process of establishing, maintaining, and enforcing rules for managing
production details in line with business strategy, goals, and objectives. Production details include part/item master, bills of materials/formulas, routings, processes, equipment requirements, tooling, and other information specifying the method of production for a particular product.
EM.2 Manage Production Performance The process of developing and maintaining performance standards and analysis methods to compare actual production performance against the established standards. This process allows the development and implementation of a course of action to achieve targeted performance.
EM.3 Manage MAKE Information The process of managing, collecting, maintaining, and communicating information to support MAKE planning and execution processes. The information to be managed includes production, order and process data.
EM.4 Manage In-Process Products (WIP) The process of establishing and maintaining limits or levels, replenishment models, ownership, product mix and stocking locations for In-Process Product (WIP). Management of the activities associated with handling/storage/movement of materials used to support production.
EM.5 Manage Equipment and Facilities The process of specifying maintaining and dispositioning MAKE’s capital assets to operate the supply chain production processes. This process element includes repairs, alterations, calibration and other miscellaneous items to maintain production capabilities of the manufacturing fixed asset base. The ongoing management of the activities associated with ensuring equipment and facilities are kept in proper order.
EM.6 Manage Transportation The process of transporting In-Process Product (WIP). This includes management of the activities associated with in transit handling and movement of In-Process Product (WIP).
EM.7 Manage Production Network The process of identifying and maintaining a network of intra-company production units that deliver specific semi-finished materials or product sets to the final production site.
EM.8 Manage Regulatory Compliance The process of identifying and complying with regulatory documentation and process standards set by external entities (e.g. government)
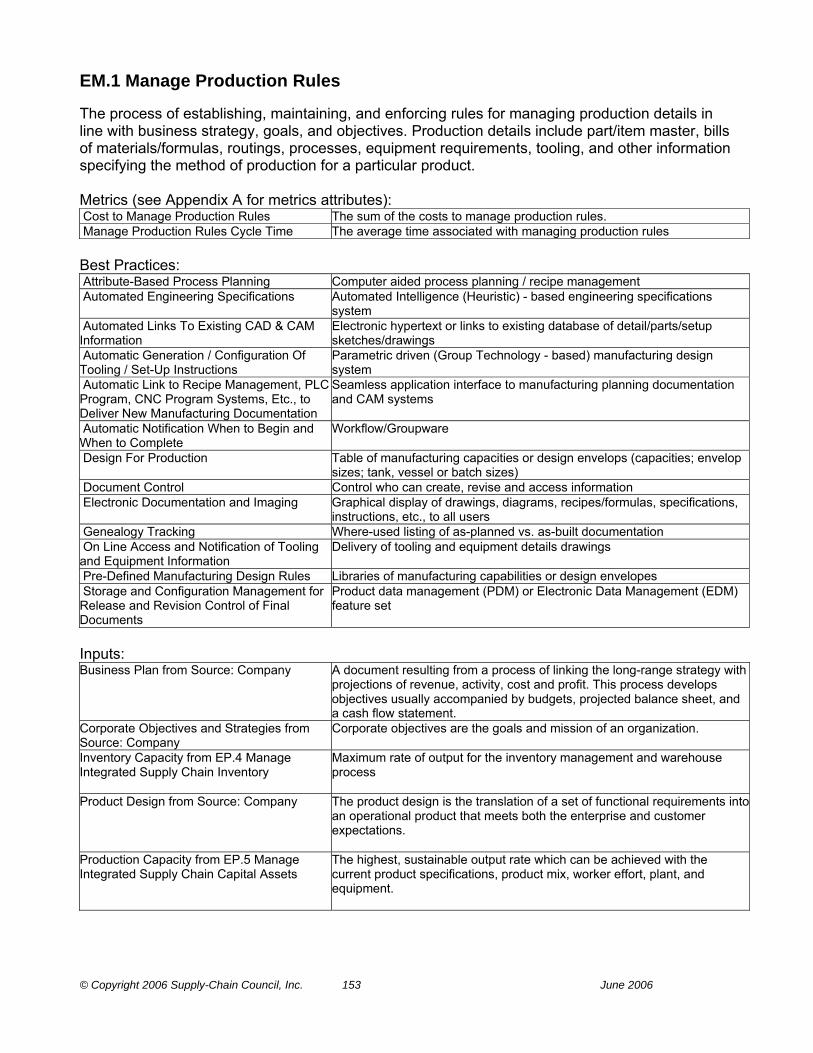
© Copyright 2006 Supply-Chain Council, Inc. 153 June 2006
EM.1 Manage Production Rules The process of establishing, maintaining, and enforcing rules for managing production details in line with business strategy, goals, and objectives. Production details include part/item master, bills of materials/formulas, routings, processes, equipment requirements, tooling, and other information specifying the method of production for a particular product. Metrics (see Appendix A for metrics attributes): Cost to Manage Production Rules The sum of the costs to manage production rules. Manage Production Rules Cycle Time The average time associated with managing production rules Best Practices: Attribute-Based Process Planning Computer aided process planning / recipe management Automated Engineering Specifications Automated Intelligence (Heuristic) - based engineering specifications
system Automated Links To Existing CAD & CAM Information
Electronic hypertext or links to existing database of detail/parts/setup sketches/drawings
Automatic Generation / Configuration Of Tooling / Set-Up Instructions
Parametric driven (Group Technology - based) manufacturing design system
Automatic Link to Recipe Management, PLC Program, CNC Program Systems, Etc., to Deliver New Manufacturing Documentation
Seamless application interface to manufacturing planning documentation and CAM systems
Automatic Notification When to Begin and When to Complete
Workflow/Groupware
Design For Production Table of manufacturing capacities or design envelops (capacities; envelop sizes; tank, vessel or batch sizes)
Document Control Control who can create, revise and access information Electronic Documentation and Imaging Graphical display of drawings, diagrams, recipes/formulas, specifications,
instructions, etc., to all users Genealogy Tracking Where-used listing of as-planned vs. as-built documentation On Line Access and Notification of Tooling and Equipment Information
Delivery of tooling and equipment details drawings
Pre-Defined Manufacturing Design Rules Libraries of manufacturing capabilities or design envelopes Storage and Configuration Management for Release and Revision Control of Final Documents
Product data management (PDM) or Electronic Data Management (EDM) feature set
Inputs: Business Plan from Source: Company A document resulting from a process of linking the long-range strategy with
projections of revenue, activity, cost and profit. This process develops objectives usually accompanied by budgets, projected balance sheet, and a cash flow statement.
Corporate Objectives and Strategies from Source: Company
Corporate objectives are the goals and mission of an organization.
Inventory Capacity from EP.4 Manage Integrated Supply Chain Inventory
Maximum rate of output for the inventory management and warehouse process
Product Design from Source: Company The product design is the translation of a set of functional requirements into an operational product that meets both the enterprise and customer expectations.
Production Capacity from EP.5 Manage Integrated Supply Chain Capital Assets
The highest, sustainable output rate which can be achieved with the current product specifications, product mix, worker effort, plant, and equipment.
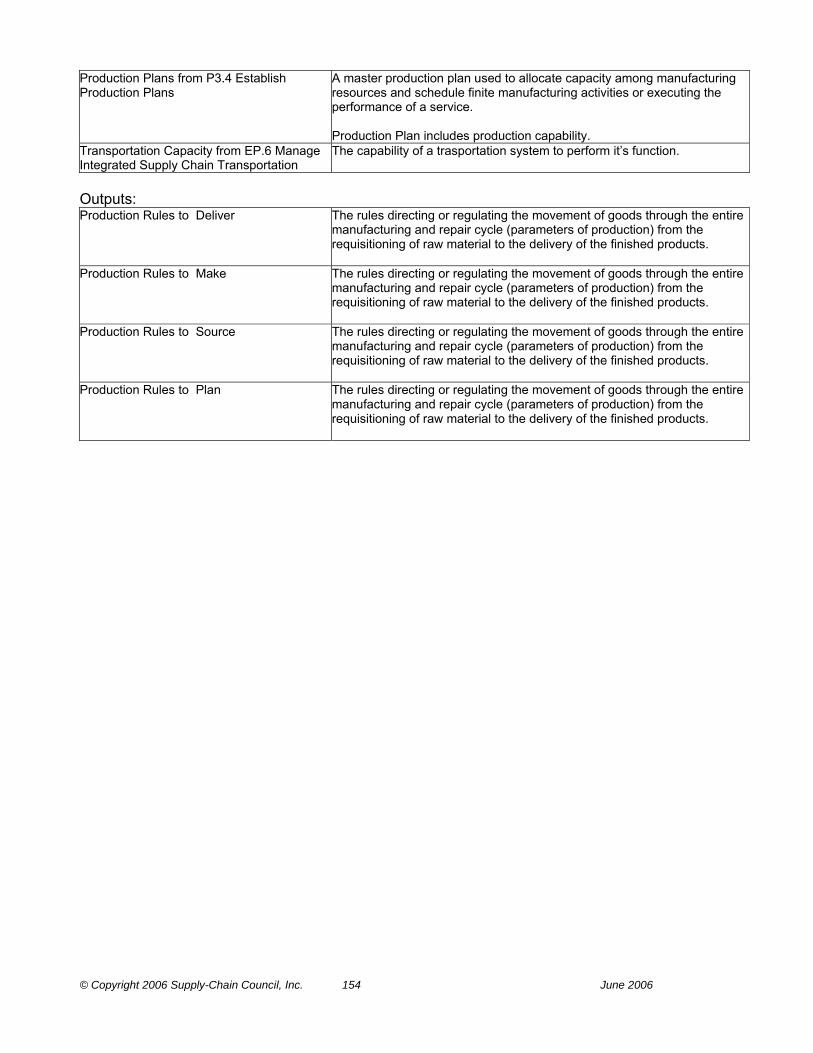
© Copyright 2006 Supply-Chain Council, Inc. 154 June 2006
Production Plans from P3.4 Establish Production Plans
A master production plan used to allocate capacity among manufacturing resources and schedule finite manufacturing activities or executing the performance of a service. Production Plan includes production capability.
Transportation Capacity from EP.6 Manage Integrated Supply Chain Transportation
The capability of a trasportation system to perform it’s function.
Outputs: Production Rules to Deliver The rules directing or regulating the movement of goods through the entire
manufacturing and repair cycle (parameters of production) from the requisitioning of raw material to the delivery of the finished products.
Production Rules to Make The rules directing or regulating the movement of goods through the entire manufacturing and repair cycle (parameters of production) from the requisitioning of raw material to the delivery of the finished products.
Production Rules to Source The rules directing or regulating the movement of goods through the entire manufacturing and repair cycle (parameters of production) from the requisitioning of raw material to the delivery of the finished products.
Production Rules to Plan The rules directing or regulating the movement of goods through the entire manufacturing and repair cycle (parameters of production) from the requisitioning of raw material to the delivery of the finished products.

© Copyright 2006 Supply-Chain Council, Inc. 155 June 2006
EM.2 Manage Production Performance The process of developing and maintaining performance standards and analysis methods to compare actual production performance against the established standards. This process allows the development and implementation of a course of action to achieve targeted performance. Metrics (see Appendix A for metrics attributes): Cost to Manage Production Performance The sum of the costs to manage production performance. Manage Production Performance Cycle Time
The average time associated with managing production performance
Best Practices: Periodic Review of Standards Process for establishing and maintaining review schedules Real Time Performance Measurement Reporting Systems
Systems to collect production information online generate reports upon request by operators, and track progress against schedule and standards.
Standards and Measurements Aligned to Maximize Supply Chain Performance
Internal/external benchmarking, industry standards, customer/supplier alignment agreements, visibility of key performance indicators
Inputs: Business Plan from Source: Company A document resulting from a process of linking the long-range strategy with
projections of revenue, activity, cost and profit. This process develops objectives usually accompanied by budgets, projected balance sheet, and a cash flow statement.
Corporate Objectives and Strategies from Source: Company
Corporate objectives are the goals and mission of an organization.
Inventory Capacity from EP.4 Manage Integrated Supply Chain Inventory
Maximum rate of output for the inventory management and warehouse process
Product Design/Quality from Source: Company
A product design approach that uses quality measures to capture the extent to which the design meets the needs of the target market (customer attributes), as well as its actual performance, aesthetics, and cost.
Production Capacity from EP.5 Manage Integrated Supply Chain Capital Assets
The highest, sustainable output rate which can be achieved with the current product specifications, product mix, worker effort, plant, and equipment.
Production Plans from P3.4 Establish Production Plans
A master production plan used to allocate capacity among manufacturing resources and schedule finite manufacturing activities or executing the performance of a service. Production Plan includes production capability.
Transportation Capacity from EP.6 Manage Integrated Supply Chain Transportation
The capability of a trasportation system to perform it’s function.
Outputs: Production Quality and Policies to EM.5 Manage Equipment and Facilities
The operational techniques and planned and systematic activities used to fulfill requirements for quality in the production process, or the quality of the production, as defined by the company. For example, a percentage of parts produced without a need for adjustment or repair. The production policy indicates standard rules on how the production quality should be secured.
Production Rules to Deliver The rules directing or regulating the movement of goods through the entire manufacturing and repair cycle (parameters of production) from the requisitioning of raw material to the delivery of the finished products.
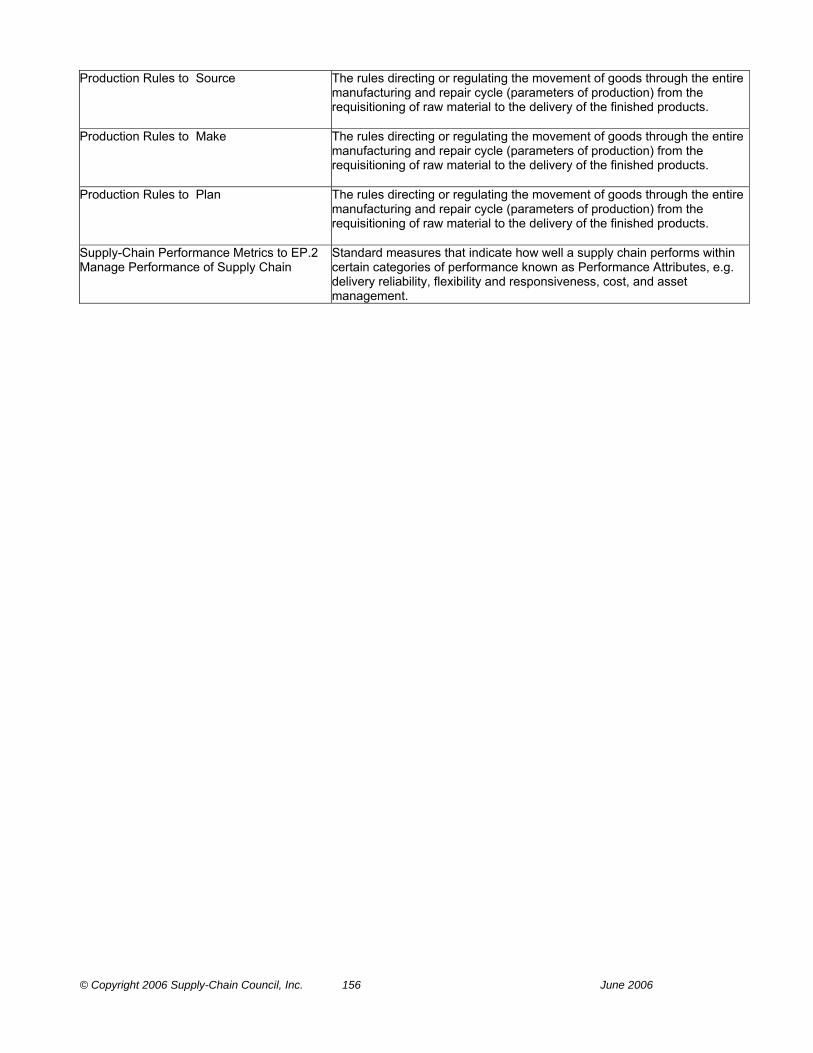
© Copyright 2006 Supply-Chain Council, Inc. 156 June 2006
Production Rules to Source The rules directing or regulating the movement of goods through the entire manufacturing and repair cycle (parameters of production) from the requisitioning of raw material to the delivery of the finished products.
Production Rules to Make The rules directing or regulating the movement of goods through the entire manufacturing and repair cycle (parameters of production) from the requisitioning of raw material to the delivery of the finished products.
Production Rules to Plan The rules directing or regulating the movement of goods through the entire manufacturing and repair cycle (parameters of production) from the requisitioning of raw material to the delivery of the finished products.
Supply-Chain Performance Metrics to EP.2 Manage Performance of Supply Chain
Standard measures that indicate how well a supply chain performs within certain categories of performance known as Performance Attributes, e.g. delivery reliability, flexibility and responsiveness, cost, and asset management.
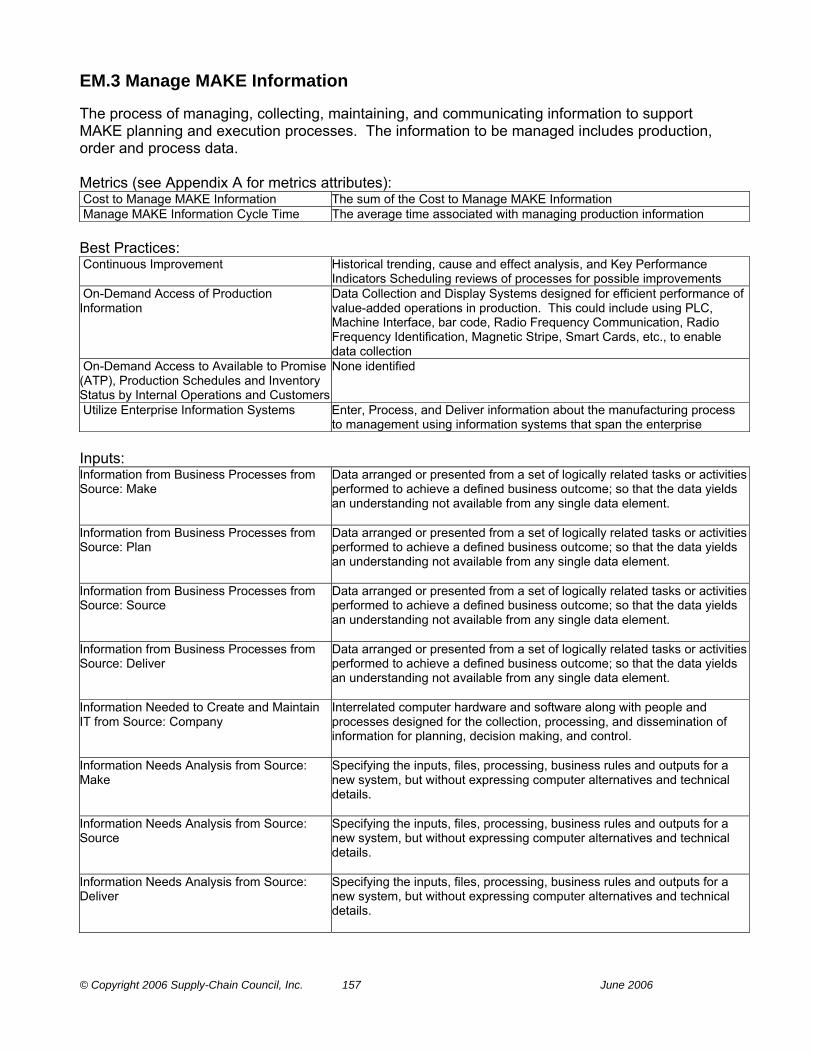
© Copyright 2006 Supply-Chain Council, Inc. 157 June 2006
EM.3 Manage MAKE Information The process of managing, collecting, maintaining, and communicating information to support MAKE planning and execution processes. The information to be managed includes production, order and process data. Metrics (see Appendix A for metrics attributes): Cost to Manage MAKE Information The sum of the Cost to Manage MAKE Information Manage MAKE Information Cycle Time The average time associated with managing production information Best Practices: Continuous Improvement Historical trending, cause and effect analysis, and Key Performance
Indicators Scheduling reviews of processes for possible improvements On-Demand Access of Production Information
Data Collection and Display Systems designed for efficient performance of value-added operations in production. This could include using PLC, Machine Interface, bar code, Radio Frequency Communication, Radio Frequency Identification, Magnetic Stripe, Smart Cards, etc., to enable data collection
On-Demand Access to Available to Promise (ATP), Production Schedules and Inventory Status by Internal Operations and Customers
None identified
Utilize Enterprise Information Systems Enter, Process, and Deliver information about the manufacturing process to management using information systems that span the enterprise
Inputs: Information from Business Processes from Source: Make
Data arranged or presented from a set of logically related tasks or activities performed to achieve a defined business outcome; so that the data yields an understanding not available from any single data element.
Information from Business Processes from Source: Plan
Data arranged or presented from a set of logically related tasks or activities performed to achieve a defined business outcome; so that the data yields an understanding not available from any single data element.
Information from Business Processes from Source: Source
Data arranged or presented from a set of logically related tasks or activities performed to achieve a defined business outcome; so that the data yields an understanding not available from any single data element.
Information from Business Processes from Source: Deliver
Data arranged or presented from a set of logically related tasks or activities performed to achieve a defined business outcome; so that the data yields an understanding not available from any single data element.
Information Needed to Create and Maintain IT from Source: Company
Interrelated computer hardware and software along with people and processes designed for the collection, processing, and dissemination of information for planning, decision making, and control.
Information Needs Analysis from Source: Make
Specifying the inputs, files, processing, business rules and outputs for a new system, but without expressing computer alternatives and technical details.
Information Needs Analysis from Source: Source
Specifying the inputs, files, processing, business rules and outputs for a new system, but without expressing computer alternatives and technical details.
Information Needs Analysis from Source: Deliver
Specifying the inputs, files, processing, business rules and outputs for a new system, but without expressing computer alternatives and technical details.
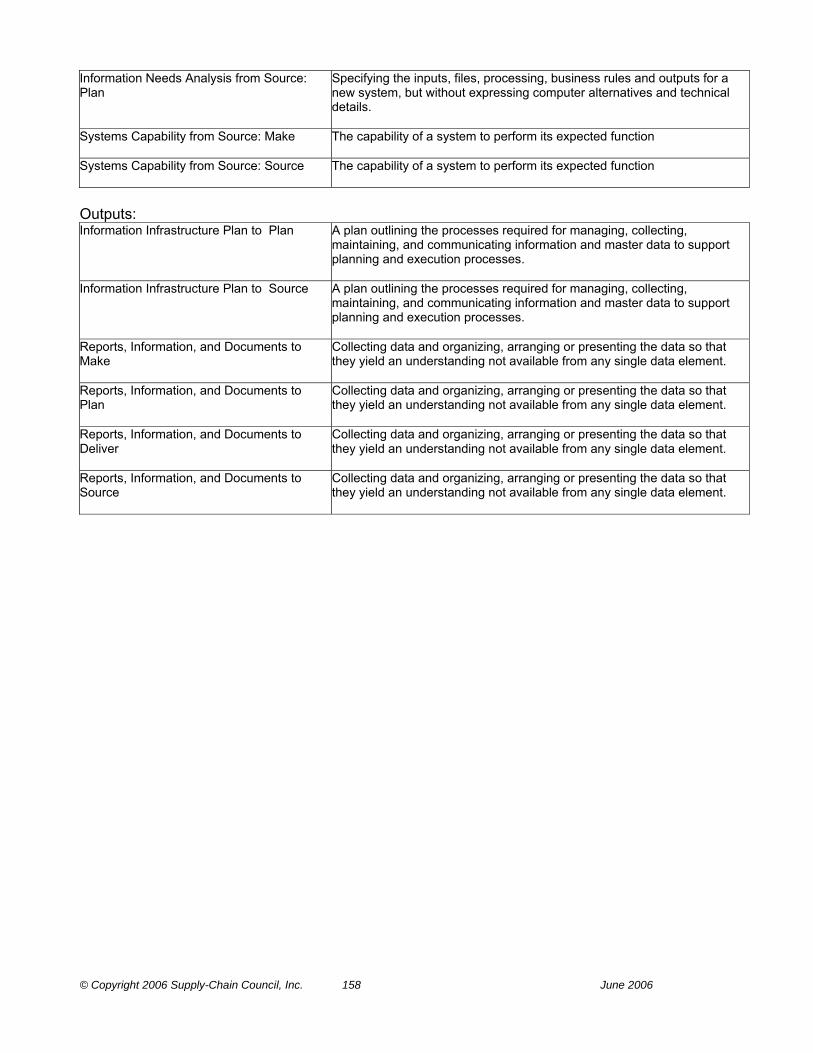
© Copyright 2006 Supply-Chain Council, Inc. 158 June 2006
Information Needs Analysis from Source: Plan
Specifying the inputs, files, processing, business rules and outputs for a new system, but without expressing computer alternatives and technical details.
Systems Capability from Source: Make The capability of a system to perform its expected function
Systems Capability from Source: Source The capability of a system to perform its expected function
Outputs: Information Infrastructure Plan to Plan A plan outlining the processes required for managing, collecting,
maintaining, and communicating information and master data to support planning and execution processes.
Information Infrastructure Plan to Source A plan outlining the processes required for managing, collecting, maintaining, and communicating information and master data to support planning and execution processes.
Reports, Information, and Documents to Make
Collecting data and organizing, arranging or presenting the data so that they yield an understanding not available from any single data element.
Reports, Information, and Documents to Plan
Collecting data and organizing, arranging or presenting the data so that they yield an understanding not available from any single data element.
Reports, Information, and Documents to Deliver
Collecting data and organizing, arranging or presenting the data so that they yield an understanding not available from any single data element.
Reports, Information, and Documents to Source
Collecting data and organizing, arranging or presenting the data so that they yield an understanding not available from any single data element.
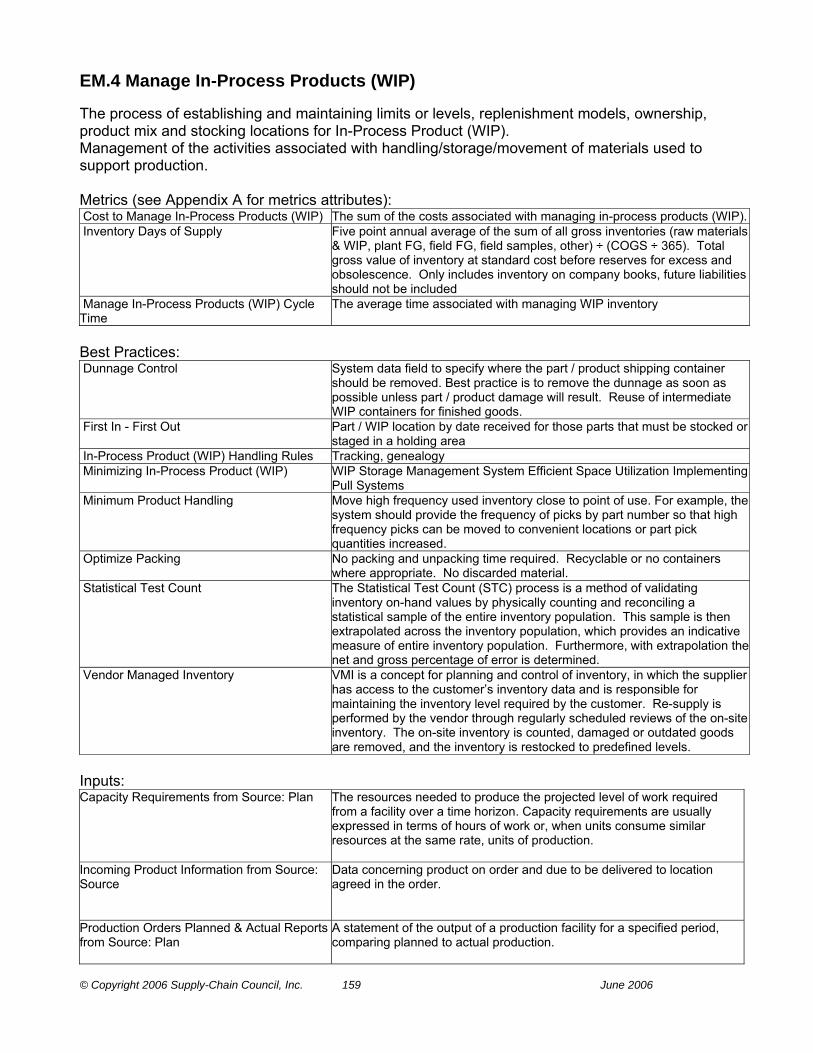
© Copyright 2006 Supply-Chain Council, Inc. 159 June 2006
EM.4 Manage In-Process Products (WIP) The process of establishing and maintaining limits or levels, replenishment models, ownership, product mix and stocking locations for In-Process Product (WIP). Management of the activities associated with handling/storage/movement of materials used to support production. Metrics (see Appendix A for metrics attributes): Cost to Manage In-Process Products (WIP) The sum of the costs associated with managing in-process products (WIP). Inventory Days of Supply Five point annual average of the sum of all gross inventories (raw materials
& WIP, plant FG, field FG, field samples, other) ÷ (COGS ÷ 365). Total gross value of inventory at standard cost before reserves for excess and obsolescence. Only includes inventory on company books, future liabilities should not be included
Manage In-Process Products (WIP) Cycle Time
The average time associated with managing WIP inventory
Best Practices: Dunnage Control System data field to specify where the part / product shipping container
should be removed. Best practice is to remove the dunnage as soon as possible unless part / product damage will result. Reuse of intermediate WIP containers for finished goods.
First In - First Out Part / WIP location by date received for those parts that must be stocked or staged in a holding area
In-Process Product (WIP) Handling Rules Tracking, genealogy Minimizing In-Process Product (WIP) WIP Storage Management System Efficient Space Utilization Implementing
Pull Systems Minimum Product Handling Move high frequency used inventory close to point of use. For example, the
system should provide the frequency of picks by part number so that high frequency picks can be moved to convenient locations or part pick quantities increased.
Optimize Packing No packing and unpacking time required. Recyclable or no containers where appropriate. No discarded material.
Statistical Test Count The Statistical Test Count (STC) process is a method of validating inventory on-hand values by physically counting and reconciling a statistical sample of the entire inventory population. This sample is then extrapolated across the inventory population, which provides an indicative measure of entire inventory population. Furthermore, with extrapolation the net and gross percentage of error is determined.
Vendor Managed Inventory VMI is a concept for planning and control of inventory, in which the supplier has access to the customer’s inventory data and is responsible for maintaining the inventory level required by the customer. Re-supply is performed by the vendor through regularly scheduled reviews of the on-site inventory. The on-site inventory is counted, damaged or outdated goods are removed, and the inventory is restocked to predefined levels.
Inputs: Capacity Requirements from Source: Plan The resources needed to produce the projected level of work required
from a facility over a time horizon. Capacity requirements are usually expressed in terms of hours of work or, when units consume similar resources at the same rate, units of production.
Incoming Product Information from Source: Source
Data concerning product on order and due to be delivered to location agreed in the order.
Production Orders Planned & Actual Reports from Source: Plan
A statement of the output of a production facility for a specified period, comparing planned to actual production.

© Copyright 2006 Supply-Chain Council, Inc. 160 June 2006
Returned Product Information from Source: Deliver
Data concerning the return and disposition of defective products, excess inventory and/or serviceable or obsolete products, or MRO product.
Outputs: WIP Handling Rules, Move Information and Methods to M1.2 Issue Material
The rules for handling WIP items in the production and repair process. These rules include the movement and accounting for in-process items between work locations, in inventory, and movement inventory.
WIP Handling Rules, Move Information and Methods to Deliver
The rules for handling WIP items in the production and repair process. These rules include the movement and accounting for in-process items between work locations, in inventory, and movement inventory.
WIP Handling Rules, Move Information and Methods to Source
The rules for handling WIP items in the production and repair process. These rules include the movement and accounting for in-process items between work locations, in inventory, and movement inventory.
WIP Handling Rules, Move Information and Methods to M2.2 Issue Sourced/In-Process Product
The rules for handling WIP items in the production and repair process. These rules include the movement and accounting for in-process items between work locations, in inventory, and movement inventory.
WIP Handling Rules, Move Information and Methods to M3.3 Issue Sourced/In-Process Product
The rules for handling WIP items in the production and repair process. These rules include the movement and accounting for in-process items between work locations, in inventory, and movement inventory.
WIP Handling Rules, Move Information and Methods to Plan
The rules for handling WIP items in the production and repair process. These rules include the movement and accounting for in-process items between work locations, in inventory, and movement inventory.
WIP Handling Rules, Move Information and Methods to EM.6 Manage Transportation
The rules for handling WIP items in the production and repair process. These rules include the movement and accounting for in-process items between work locations, in inventory, and movement inventory.

© Copyright 2006 Supply-Chain Council, Inc. 161 June 2006
EM.5 Manage Equipment and Facilities The process of specifying maintaining and dispositioning MAKE’s capital assets to operate the supply chain production processes. This process element includes repairs, alterations, calibration and other miscellaneous items to maintain production capabilities of the manufacturing fixed asset base. The ongoing management of the activities associated with ensuring equipment and facilities are kept in proper order. Metrics (see Appendix A for metrics attributes): Actual Asset Life Maintenance Cost as % of Replacement Value
Measure of total lifecycle maintenance cost of an asset compared to its replacement cost. This ratio is based maintenance cost to-date so that that replacement or upgrade cost can be evaluated as the asset ages on an on-going basis.
Cost to Manage MAKE Equipment and Facilities
The sum of the costs associated with managing Make equipment and facilities.
Manage MAKE Equipment and Facilities Cycle Time
The average time associated with managing production equipment and facilities
Best Practices: Changeover Reduction / Continuous Improvement Program
Changeover process flow element identification, instructional directions to conduct changeover, and measurement tool, which can be used to prioritize and track results of improvement efforts. Software to identify operational constraints to the MAKE processes to assist in directing resources toward bottleneck functional areas.
Facility & Equipment Environmental / Safety Audit System
System software to list checklist items, report results of audit & forward actions to be taken
Factory Floor Electronic Decision Making Information System
Software to capture actual performance history / costs of operations with capability of predicting “best cost action plans“ relating to maintaining equipment and facilities.
Minimize Capital Assets Required and Maintenance Costs
Outsourcing strategies including the use of Application Service Providers (ASPs), web-based maintenance/diagnostic assistance and MRO parts.
Predictive Maintenance Monitoring (Heat, Noise, Lubrication Composition & Vibration)
Database for equipment to contain expected results of analysis, allow entry of test readings, and have capability of generating desired reports, which could highlight suggested actions based upon readings obtained, track maintenance completed, contain a help-file to be consulted
Supplier Managed Inventory of Parts E.D.I. linkage of Inventory Information Systematic Disposition Of Equipment Rules for deciding appropriate disposition. Total Preventative Maintenance Program Automatically generated TPM repair schedules integrated with MRP
systems, electronic equipment repair history, parts listings, part stores inventory & reorder points, automatic store room parts purchases, Shop floor access to electronic data base of equipment line drawings, electrical wiring diagrams, parts listing reference guide and part cost lists.
Inputs: Budgets from Source: Make A plan that includes an estimate of future costs and revenues related to
expected activities. The budget serves as a pattern for and a control over future operations.
Equipment and Facilities Monitoring Information from Source: Company
Data gathered by measuring, examining, testing, or gauging one or more characteristics of equipment and facilities and comparing it to planned.
Manufacturer’s Recommended Maintenance Schedules & Specifications from Source: Company
The scheduled activities, including adjustments, replacements, and basic cleanliness, that are recommended by the manufacturer to forestall machine breakdowns.

© Copyright 2006 Supply-Chain Council, Inc. 162 June 2006
MRO Parts Availability from ES.4 Manage Product Inventory
The on-hand MRO inventory balance minus allocations, reservations, backorders, and (usually) quantities held for quality problems.
Production Plans from P3.4 Establish Production Plans
A master production plan used to allocate capacity among manufacturing resources and schedule finite manufacturing activities or executing the performance of a service. Production Plan includes production capability.
Production Quality and Policies from EM.2 Manage Production Performance
The operational techniques and planned and systematic activities used to fulfill requirements for quality in the production process, or the quality of the production, as defined by the company. For example, a percentage of parts produced without a need for adjustment or repair. The production policy indicates standard rules on how the production quality should be secured.
Outputs: Equipment and Facilities Maintenance History to Source
The process of documenting of the timing and maintenance of equipment and facilities including required repairs, alterations, calibration, servicing, replacement of parts and other miscellaneous items to maintain production capability of the manufacturing fixed asset base
Equipment and Facilities Maintenance History to Make
The process of documenting of the timing and maintenance of equipment and facilities including required repairs, alterations, calibration, servicing, replacement of parts and other miscellaneous items to maintain production capability of the manufacturing fixed asset base
Equipment and Facilities Replacement and Disposition Plans to P3.2 Identify, Assess, and Aggregate Production Resources
Actions relating to the planning, financing and disposition of capital outlays for such purposes as the purchase of new equipment, the introduction of new product lines, and the modernization of plant facilities
Equipment and Facilities Replacement and Disposition Plans to EM.6 Manage Transportation
Actions relating to the planning, financing and disposition of capital outlays for such purposes as the purchase of new equipment, the introduction of new product lines, and the modernization of plant facilities
Equipment and Facilities Schedules and Plans to M2.1 Schedule Production Activities
Time-phased plans of present and future load (capacity required) on all resources (Equipment and Facilities) based on the planned and released supply authorizations (i.e., orders) and the planned capacity (capacity available) of these resources over a span of time.
Equipment and Facilities Schedules and Plans to M3.2 Schedule Production Activities
Time-phased plans of present and future load (capacity required) on all resources (Equipment and Facilities) based on the planned and released supply authorizations (i.e., orders) and the planned capacity (capacity available) of these resources over a span of time.
Equipment and Facilities Schedules and Plans to M1.1 Schedule Production Activities
Time-phased plans of present and future load (capacity required) on all resources (Equipment and Facilities) based on the planned and released supply authorizations (i.e., orders) and the planned capacity (capacity available) of these resources over a span of time.
Parts and Services Consumed to ES.4 Manage Product Inventory
The items and services utilized to manufacture a product.
Parts and Services Consumed to ES.5 Manage Capital Assets
The items and services utilized to manufacture a product.
Parts and Services Consumed to ES.8 Manage Import/Export Requirements
The items and services utilized to manufacture a product.
Preventative Maintenance and Calibration Schedule to Source
Planned and scheduled activities, including adjustments, replacements, and basic cleanliness, that forestall machine and facility breakdowns. Also, the established frequency to change and maintain parts, based on failure consequences, with frequency set per part or machine type. (Well cared for equipment and facilities will last longer and cause fewer problems.)
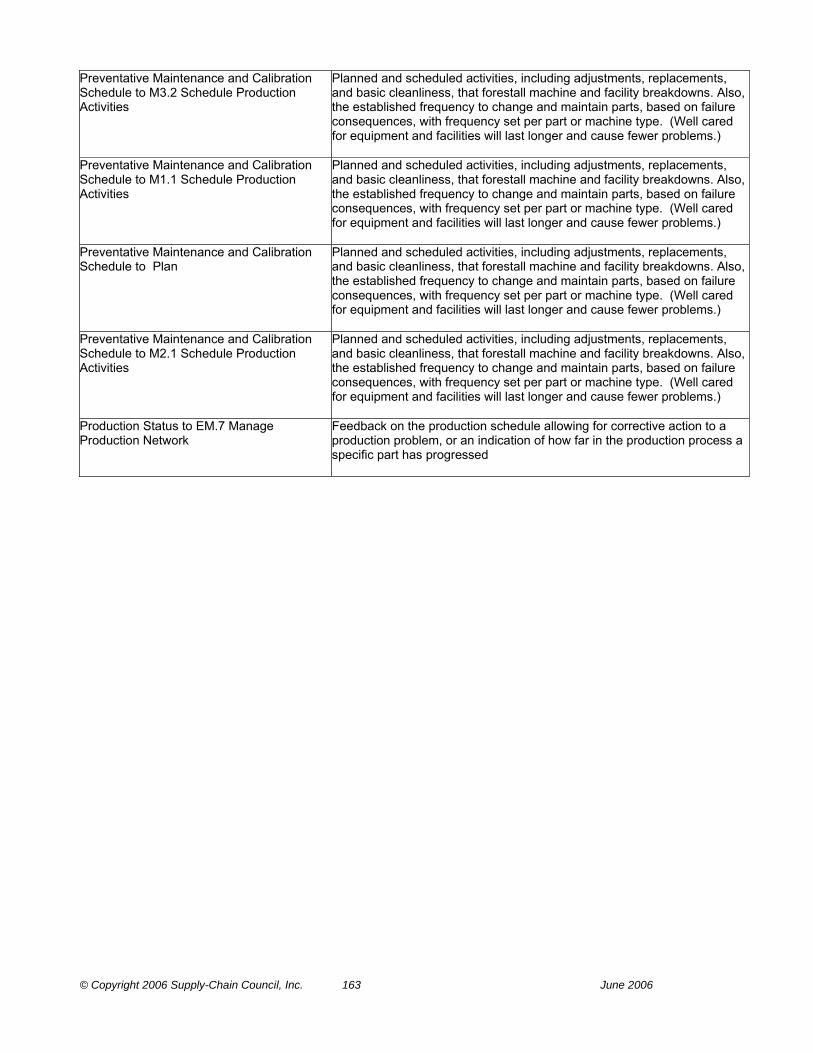
© Copyright 2006 Supply-Chain Council, Inc. 163 June 2006
Preventative Maintenance and Calibration Schedule to M3.2 Schedule Production Activities
Planned and scheduled activities, including adjustments, replacements, and basic cleanliness, that forestall machine and facility breakdowns. Also, the established frequency to change and maintain parts, based on failure consequences, with frequency set per part or machine type. (Well cared for equipment and facilities will last longer and cause fewer problems.)
Preventative Maintenance and Calibration Schedule to M1.1 Schedule Production Activities
Planned and scheduled activities, including adjustments, replacements, and basic cleanliness, that forestall machine and facility breakdowns. Also, the established frequency to change and maintain parts, based on failure consequences, with frequency set per part or machine type. (Well cared for equipment and facilities will last longer and cause fewer problems.)
Preventative Maintenance and Calibration Schedule to Plan
Planned and scheduled activities, including adjustments, replacements, and basic cleanliness, that forestall machine and facility breakdowns. Also, the established frequency to change and maintain parts, based on failure consequences, with frequency set per part or machine type. (Well cared for equipment and facilities will last longer and cause fewer problems.)
Preventative Maintenance and Calibration Schedule to M2.1 Schedule Production Activities
Planned and scheduled activities, including adjustments, replacements, and basic cleanliness, that forestall machine and facility breakdowns. Also, the established frequency to change and maintain parts, based on failure consequences, with frequency set per part or machine type. (Well cared for equipment and facilities will last longer and cause fewer problems.)
Production Status to EM.7 Manage Production Network
Feedback on the production schedule allowing for corrective action to a production problem, or an indication of how far in the production process a specific part has progressed
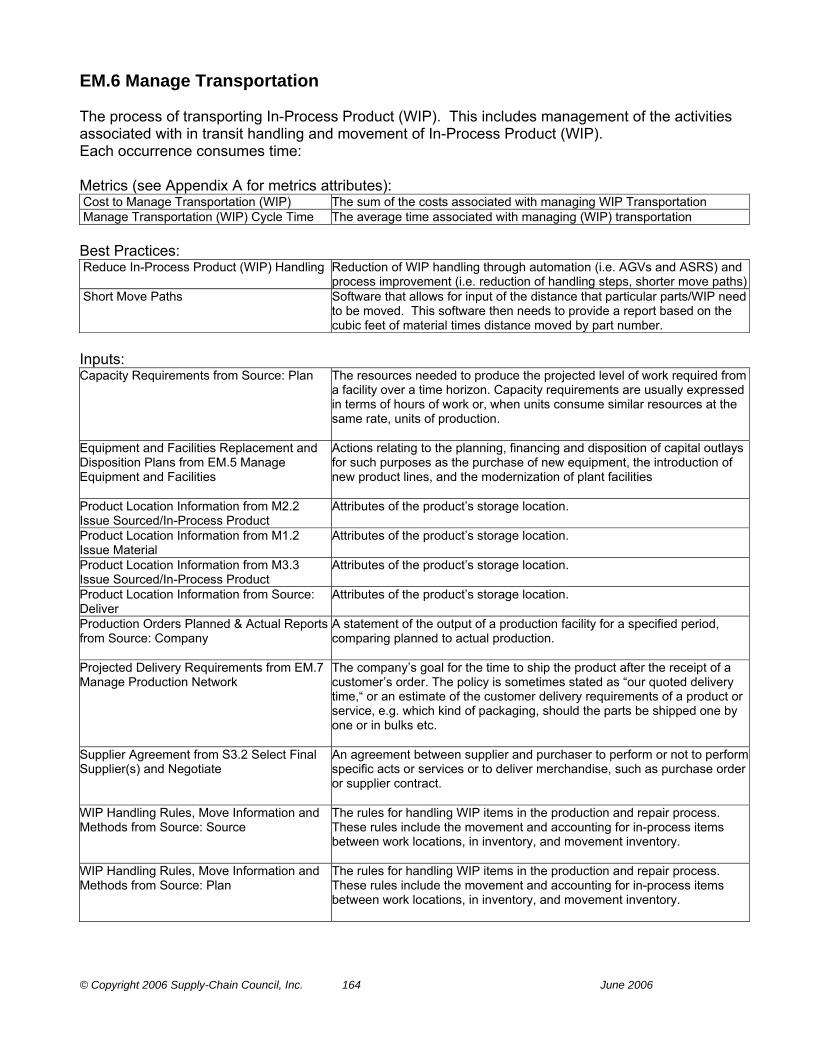
© Copyright 2006 Supply-Chain Council, Inc. 164 June 2006
EM.6 Manage Transportation The process of transporting In-Process Product (WIP). This includes management of the activities associated with in transit handling and movement of In-Process Product (WIP). Each occurrence consumes time: Metrics (see Appendix A for metrics attributes): Cost to Manage Transportation (WIP) The sum of the costs associated with managing WIP Transportation Manage Transportation (WIP) Cycle Time The average time associated with managing (WIP) transportation Best Practices: Reduce In-Process Product (WIP) Handling Reduction of WIP handling through automation (i.e. AGVs and ASRS) and
process improvement (i.e. reduction of handling steps, shorter move paths) Short Move Paths Software that allows for input of the distance that particular parts/WIP need
to be moved. This software then needs to provide a report based on the cubic feet of material times distance moved by part number.
Inputs: Capacity Requirements from Source: Plan The resources needed to produce the projected level of work required from
a facility over a time horizon. Capacity requirements are usually expressed in terms of hours of work or, when units consume similar resources at the same rate, units of production.
Equipment and Facilities Replacement and Disposition Plans from EM.5 Manage Equipment and Facilities
Actions relating to the planning, financing and disposition of capital outlays for such purposes as the purchase of new equipment, the introduction of new product lines, and the modernization of plant facilities
Product Location Information from M2.2 Issue Sourced/In-Process Product
Attributes of the product’s storage location.
Product Location Information from M1.2 Issue Material
Attributes of the product’s storage location.
Product Location Information from M3.3 Issue Sourced/In-Process Product
Attributes of the product’s storage location.
Product Location Information from Source: Deliver
Attributes of the product’s storage location.
Production Orders Planned & Actual Reports from Source: Company
A statement of the output of a production facility for a specified period, comparing planned to actual production.
Projected Delivery Requirements from EM.7 Manage Production Network
The company’s goal for the time to ship the product after the receipt of a customer’s order. The policy is sometimes stated as “our quoted delivery time,“ or an estimate of the customer delivery requirements of a product or service, e.g. which kind of packaging, should the parts be shipped one by one or in bulks etc.
Supplier Agreement from S3.2 Select Final Supplier(s) and Negotiate
An agreement between supplier and purchaser to perform or not to perform specific acts or services or to deliver merchandise, such as purchase order or supplier contract.
WIP Handling Rules, Move Information and Methods from Source: Source
The rules for handling WIP items in the production and repair process. These rules include the movement and accounting for in-process items between work locations, in inventory, and movement inventory.
WIP Handling Rules, Move Information and Methods from Source: Plan
The rules for handling WIP items in the production and repair process. These rules include the movement and accounting for in-process items between work locations, in inventory, and movement inventory.

© Copyright 2006 Supply-Chain Council, Inc. 165 June 2006
WIP Handling Rules, Move Information and Methods from Source: Deliver
The rules for handling WIP items in the production and repair process. These rules include the movement and accounting for in-process items between work locations, in inventory, and movement inventory.
WIP Handling Rules, Move Information and Methods from Source: Make
The rules for handling WIP items in the production and repair process. These rules include the movement and accounting for in-process items between work locations, in inventory, and movement inventory.
WIP Handling Rules, Move Information and Methods from EM.4 Manage In-Process Products (WIP)
The rules for handling WIP items in the production and repair process. These rules include the movement and accounting for in-process items between work locations, in inventory, and movement inventory.
Outputs: WIP Inventory Location to S2.4 Transfer Product
Location of inventory that is specified as “work in progress“. This can be intermediate storage in a manufacturing facility prior to final packaging or can be a class of materials waiting final transformation to finished products.
WIP Inventory Location to S1.4 Transfer Product
Location of inventory that is specified as “work in progress“. This can be intermediate storage in a manufacturing facility prior to final packaging or can be a class of materials waiting final transformation to finished products.
WIP Inventory Location to S3.6 Transfer Product
Location of inventory that is specified as “work in progress“. This can be intermediate storage in a manufacturing facility prior to final packaging or can be a class of materials waiting final transformation to finished products.
WIP Location Rules to D2.9 Pick Product The process and rules for establishing and maintaining in-process item inventory ownership and stocking locations.
WIP Location Rules to M3.3 Issue Sourced/In-Process Product
The process and rules for establishing and maintaining in-process item inventory ownership and stocking locations.
WIP Location Rules to M2.2 Issue Sourced/In-Process Product
The process and rules for establishing and maintaining in-process item inventory ownership and stocking locations.
WIP Location Rules to M1.2 Issue Material The process and rules for establishing and maintaining in-process item inventory ownership and stocking locations.
WIP Move Information and Methods to MakeThe process of recording and tracking the movement of WIP items through the production and repair process. This process includes item stocking and accounting requirements.
WIP Move Information and Methods to Source
The process of recording and tracking the movement of WIP items through the production and repair process. This process includes item stocking and accounting requirements.
WIP Move Information and Methods to Plan The process of recording and tracking the movement of WIP items through the production and repair process. This process includes item stocking and accounting requirements.
WIP Move Information and Methods to Deliver
The process of recording and tracking the movement of WIP items through the production and repair process. This process includes item stocking and accounting requirements.
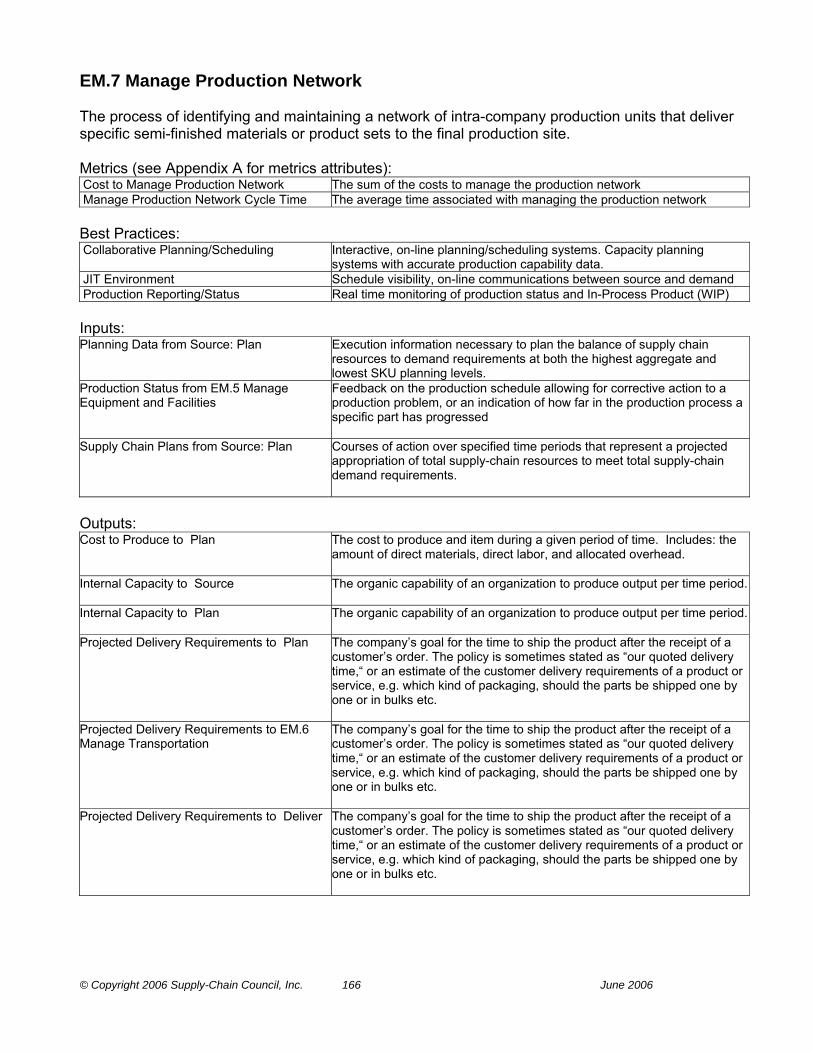
© Copyright 2006 Supply-Chain Council, Inc. 166 June 2006
EM.7 Manage Production Network The process of identifying and maintaining a network of intra-company production units that deliver specific semi-finished materials or product sets to the final production site. Metrics (see Appendix A for metrics attributes): Cost to Manage Production Network The sum of the costs to manage the production network Manage Production Network Cycle Time The average time associated with managing the production network Best Practices: Collaborative Planning/Scheduling Interactive, on-line planning/scheduling systems. Capacity planning
systems with accurate production capability data. JIT Environment Schedule visibility, on-line communications between source and demand Production Reporting/Status Real time monitoring of production status and In-Process Product (WIP) Inputs: Planning Data from Source: Plan Execution information necessary to plan the balance of supply chain
resources to demand requirements at both the highest aggregate and lowest SKU planning levels.
Production Status from EM.5 Manage Equipment and Facilities
Feedback on the production schedule allowing for corrective action to a production problem, or an indication of how far in the production process a specific part has progressed
Supply Chain Plans from Source: Plan Courses of action over specified time periods that represent a projected appropriation of total supply-chain resources to meet total supply-chain demand requirements.
Outputs: Cost to Produce to Plan The cost to produce and item during a given period of time. Includes: the
amount of direct materials, direct labor, and allocated overhead.
Internal Capacity to Source The organic capability of an organization to produce output per time period.
Internal Capacity to Plan The organic capability of an organization to produce output per time period.
Projected Delivery Requirements to Plan The company’s goal for the time to ship the product after the receipt of a customer’s order. The policy is sometimes stated as “our quoted delivery time,“ or an estimate of the customer delivery requirements of a product or service, e.g. which kind of packaging, should the parts be shipped one by one or in bulks etc.
Projected Delivery Requirements to EM.6 Manage Transportation
The company’s goal for the time to ship the product after the receipt of a customer’s order. The policy is sometimes stated as “our quoted delivery time,“ or an estimate of the customer delivery requirements of a product or service, e.g. which kind of packaging, should the parts be shipped one by one or in bulks etc.
Projected Delivery Requirements to Deliver The company’s goal for the time to ship the product after the receipt of a customer’s order. The policy is sometimes stated as “our quoted delivery time,“ or an estimate of the customer delivery requirements of a product or service, e.g. which kind of packaging, should the parts be shipped one by one or in bulks etc.

© Copyright 2006 Supply-Chain Council, Inc. 167 June 2006
EM.8 Manage Regulatory Compliance The process of identifying and complying with regulatory documentation and process standards set by external entities (e.g. government) Metrics (see Appendix A for metrics attributes): Cost to Manage MAKE Regulatory Compliance
The sum of the Cost to Manage MAKE Regulatory Compliance
Manage MAKE Regulatory Compliance Cycle Time
The average time associated with managing compliance to the make regulatory environment
Best Practices: Automated Conformance Monitoring And Control
Internal automatic notification of conformance, including holding of product until requirements are met
Automatic Generation And Submission Of Conformance Documents
Software specific to industry regulations and standards (e.g. may be software to produce MSDS documents, or FDA requirements, etc.)
Maintaining Repository of Current Regulatory Requirements
Electronic subscription and publication of conformance documentation. Electronic Document Management System features.
Inputs: Corporate Objectives and Strategies from Source: Company
Corporate objectives are the goals and mission of an organization.
Equipment and Facilities Characteristics from Source: Company
Equipment and facility traits and specifications required to meet external entities requirements.
External Regulatory Information from Source: Source
Documentation and process standards set by external entities (i.e. government, trade officials, etc.)
External Regulatory Information from Source: Plan
Documentation and process standards set by external entities (i.e. government, trade officials, etc.)
External Regulatory Information from Source: Make
Documentation and process standards set by external entities (i.e. government, trade officials, etc.)
Product Design/Claims from Source: Company
The product design is the translation of a set of functional requirements into an operational product that meets both the enterprise and customer expectations. Claims are marketing information provided as to performance, etc. Claims from the users of the product indicate a need to change the product design
Outputs: Conformance Plan to Source Courses of action and processes that are established to meet the
requirements placed on production by external entities.
Conformance Plan to Make Courses of action and processes that are established to meet the requirements placed on production by external entities.
Conformance Rules to Make An affirmative indication or judgment that a product or service has met criteria translated into rules for meeting external regulatory requirements
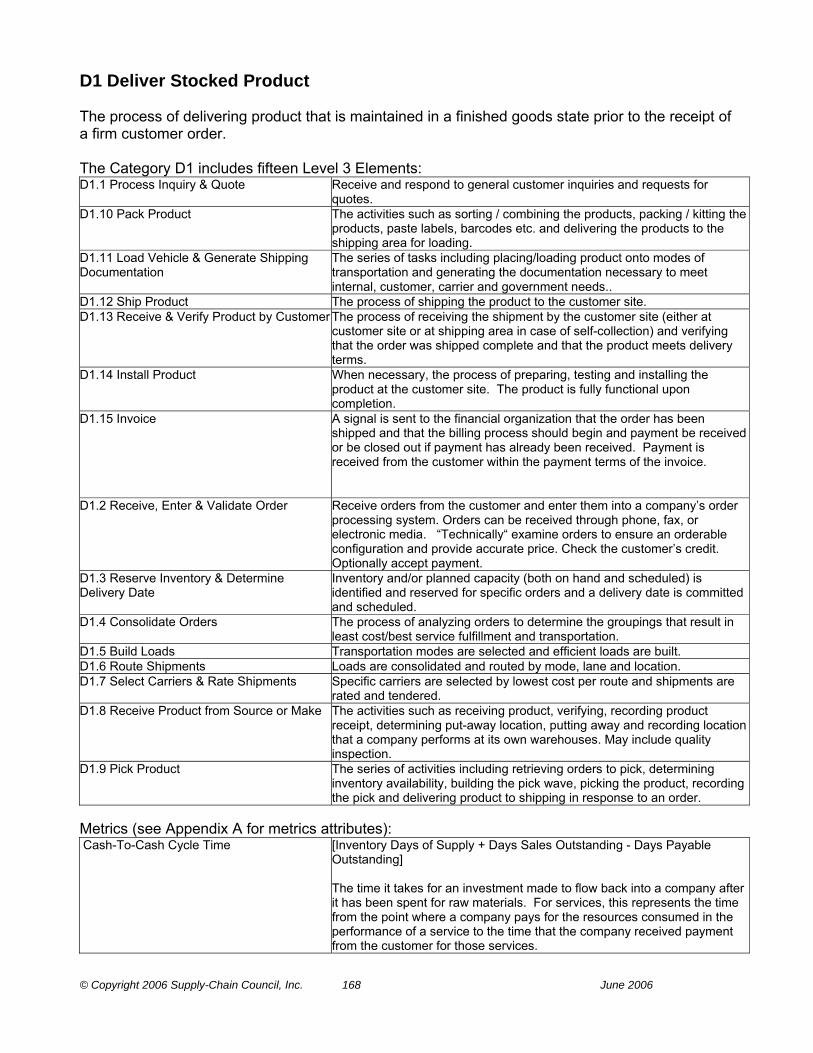
© Copyright 2006 Supply-Chain Council, Inc. 168 June 2006
D1 Deliver Stocked Product The process of delivering product that is maintained in a finished goods state prior to the receipt of a firm customer order. The Category D1 includes fifteen Level 3 Elements: D1.1 Process Inquiry & Quote Receive and respond to general customer inquiries and requests for
quotes. D1.10 Pack Product The activities such as sorting / combining the products, packing / kitting the
products, paste labels, barcodes etc. and delivering the products to the shipping area for loading.
D1.11 Load Vehicle & Generate Shipping Documentation
The series of tasks including placing/loading product onto modes of transportation and generating the documentation necessary to meet internal, customer, carrier and government needs..
D1.12 Ship Product The process of shipping the product to the customer site. D1.13 Receive & Verify Product by Customer The process of receiving the shipment by the customer site (either at
customer site or at shipping area in case of self-collection) and verifying that the order was shipped complete and that the product meets delivery terms.
D1.14 Install Product When necessary, the process of preparing, testing and installing the product at the customer site. The product is fully functional upon completion.
D1.15 Invoice A signal is sent to the financial organization that the order has been shipped and that the billing process should begin and payment be received or be closed out if payment has already been received. Payment is received from the customer within the payment terms of the invoice.
D1.2 Receive, Enter & Validate Order Receive orders from the customer and enter them into a company’s order processing system. Orders can be received through phone, fax, or electronic media. “Technically“ examine orders to ensure an orderable configuration and provide accurate price. Check the customer’s credit. Optionally accept payment.
D1.3 Reserve Inventory & Determine Delivery Date
Inventory and/or planned capacity (both on hand and scheduled) is identified and reserved for specific orders and a delivery date is committed and scheduled.
D1.4 Consolidate Orders The process of analyzing orders to determine the groupings that result in least cost/best service fulfillment and transportation.
D1.5 Build Loads Transportation modes are selected and efficient loads are built. D1.6 Route Shipments Loads are consolidated and routed by mode, lane and location. D1.7 Select Carriers & Rate Shipments Specific carriers are selected by lowest cost per route and shipments are
rated and tendered. D1.8 Receive Product from Source or Make The activities such as receiving product, verifying, recording product
receipt, determining put-away location, putting away and recording location that a company performs at its own warehouses. May include quality inspection.
D1.9 Pick Product The series of activities including retrieving orders to pick, determining inventory availability, building the pick wave, picking the product, recording the pick and delivering product to shipping in response to an order.
Metrics (see Appendix A for metrics attributes): Cash-To-Cash Cycle Time [Inventory Days of Supply + Days Sales Outstanding - Days Payable
Outstanding] The time it takes for an investment made to flow back into a company after it has been spent for raw materials. For services, this represents the time from the point where a company pays for the resources consumed in the performance of a service to the time that the company received payment from the customer for those services.
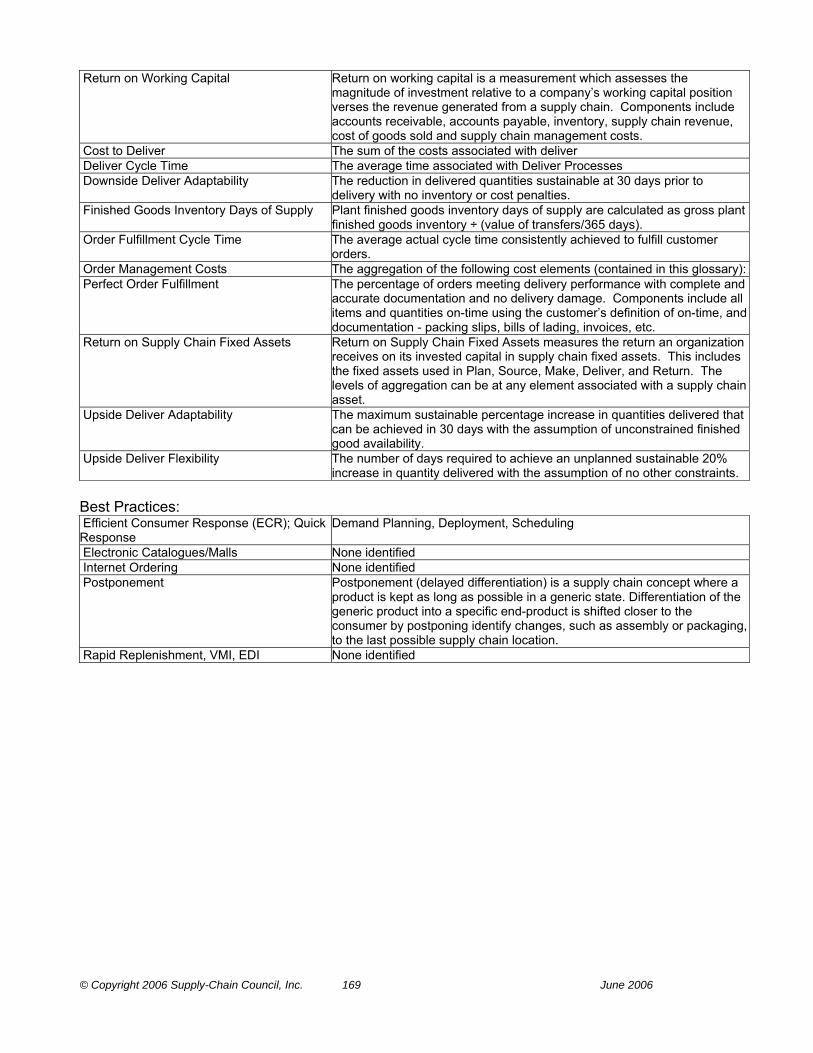
© Copyright 2006 Supply-Chain Council, Inc. 169 June 2006
Return on Working Capital Return on working capital is a measurement which assesses the magnitude of investment relative to a company’s working capital position verses the revenue generated from a supply chain. Components include accounts receivable, accounts payable, inventory, supply chain revenue, cost of goods sold and supply chain management costs.
Cost to Deliver The sum of the costs associated with deliver Deliver Cycle Time The average time associated with Deliver Processes Downside Deliver Adaptability The reduction in delivered quantities sustainable at 30 days prior to
delivery with no inventory or cost penalties. Finished Goods Inventory Days of Supply Plant finished goods inventory days of supply are calculated as gross plant
finished goods inventory ÷ (value of transfers/365 days). Order Fulfillment Cycle Time The average actual cycle time consistently achieved to fulfill customer
orders. Order Management Costs The aggregation of the following cost elements (contained in this glossary): Perfect Order Fulfillment The percentage of orders meeting delivery performance with complete and
accurate documentation and no delivery damage. Components include all items and quantities on-time using the customer’s definition of on-time, and documentation - packing slips, bills of lading, invoices, etc.
Return on Supply Chain Fixed Assets Return on Supply Chain Fixed Assets measures the return an organization receives on its invested capital in supply chain fixed assets. This includes the fixed assets used in Plan, Source, Make, Deliver, and Return. The levels of aggregation can be at any element associated with a supply chain asset.
Upside Deliver Adaptability The maximum sustainable percentage increase in quantities delivered that can be achieved in 30 days with the assumption of unconstrained finished good availability.
Upside Deliver Flexibility The number of days required to achieve an unplanned sustainable 20% increase in quantity delivered with the assumption of no other constraints.
Best Practices: Efficient Consumer Response (ECR); Quick Response
Demand Planning, Deployment, Scheduling
Electronic Catalogues/Malls None identified Internet Ordering None identified Postponement Postponement (delayed differentiation) is a supply chain concept where a
product is kept as long as possible in a generic state. Differentiation of the generic product into a specific end-product is shifted closer to the consumer by postponing identify changes, such as assembly or packaging, to the last possible supply chain location.
Rapid Replenishment, VMI, EDI None identified
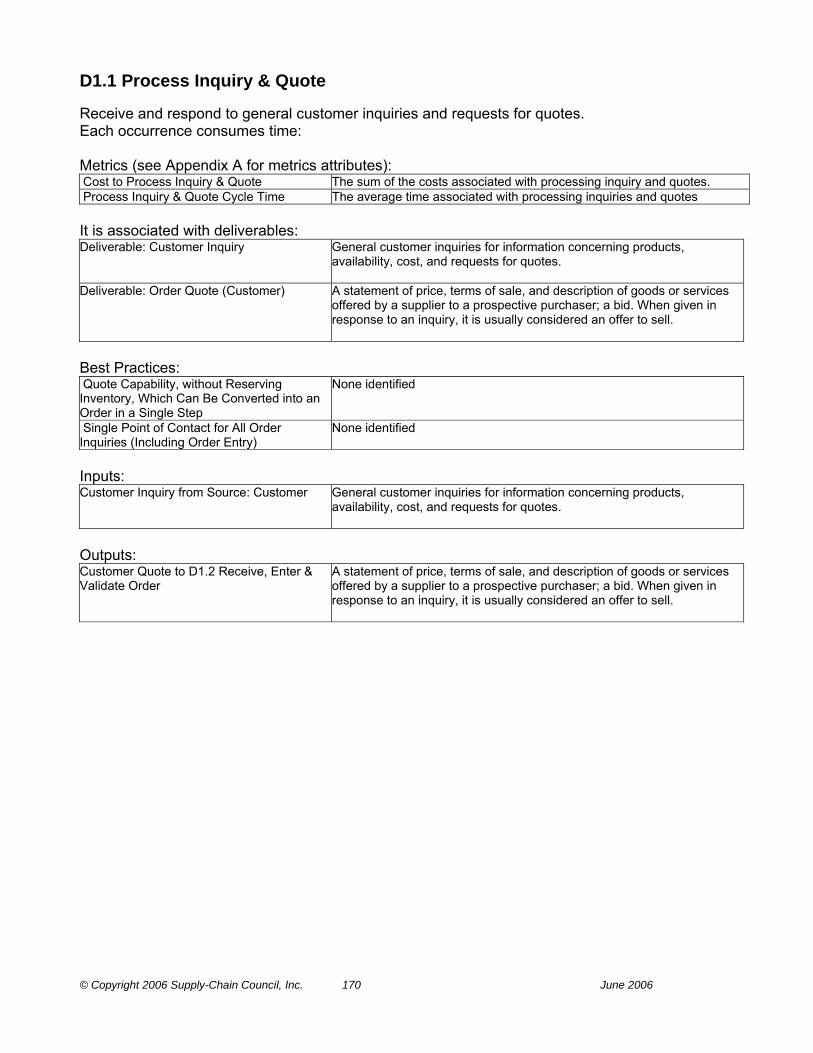
© Copyright 2006 Supply-Chain Council, Inc. 170 June 2006
D1.1 Process Inquiry & Quote Receive and respond to general customer inquiries and requests for quotes. Each occurrence consumes time: Metrics (see Appendix A for metrics attributes): Cost to Process Inquiry & Quote The sum of the costs associated with processing inquiry and quotes. Process Inquiry & Quote Cycle Time The average time associated with processing inquiries and quotes It is associated with deliverables: Deliverable: Customer Inquiry General customer inquiries for information concerning products,
availability, cost, and requests for quotes.
Deliverable: Order Quote (Customer) A statement of price, terms of sale, and description of goods or services offered by a supplier to a prospective purchaser; a bid. When given in response to an inquiry, it is usually considered an offer to sell.
Best Practices: Quote Capability, without Reserving Inventory, Which Can Be Converted into an Order in a Single Step
None identified
Single Point of Contact for All Order Inquiries (Including Order Entry)
None identified
Inputs: Customer Inquiry from Source: Customer General customer inquiries for information concerning products,
availability, cost, and requests for quotes.
Outputs: Customer Quote to D1.2 Receive, Enter & Validate Order
A statement of price, terms of sale, and description of goods or services offered by a supplier to a prospective purchaser; a bid. When given in response to an inquiry, it is usually considered an offer to sell.

© Copyright 2006 Supply-Chain Council, Inc. 171 June 2006
D1.2 Receive, Enter & Validate Order Receive orders from the customer and enter them into a company’s order processing system. Orders can be received through phone, fax, or electronic media. “Technically“ examine orders to ensure an orderable configuration and provide accurate price. Check the customer’s credit. Optionally accept payment. Metrics (see Appendix A for metrics attributes): Cost to Receive, Enter & Validate Order The sum of the costs associated with receiving, entering and validating a
customer order. Order Fulfillment Dwell Time Any lead time during the order fulfillment process where no activity takes
place, which is imposed by customer requirements. Note that this dwell time is different from ‘idle time’ or ‘non-value-add lead time’, which is caused by inefficiencies in the organization’s processes and therefore ultimately under responsibility of the organization. This kind of idle time should not be deducted from Order Fulfillment Cycle Time.
Receive, Enter & Validate Order Cycle Time The average time associated with receiving and verifying an order at the customer site
Best Practices: Automatic Multi-level Credit Checking: Dollar Limits; Days Sales Outstanding; Margin Testing
Integrated Order/Financial Management
Continuous Replenishment Programs; Vendor Managed Inventory, Telemetry to Automatically Communicate Replenishment of Chemicals
Integrated demand/deployment planning to customer location driven by POS; Customer movement data
Electronic Commerce (Customer Visibility of Stock Availability, Use of Hand-Held Terminals for Direct Order Entry, Confirmation, Credit Approval), On-Line Stock Check and Reservation of Inventory
EDI applications and integrated order management
Enable Real-Time Visibility into Backlog, Order Status, Shipments, Scheduled Material Receipts, Customer Credit History, and Current Inventory Positions
None identified
Remote (Sales, Customers) Order Entry Capability
None identified
Value Pricing Based on “Cost to Serve“; EDLP; Cost Plus Pricing
Activity Based Costing; Integrated Order Management by Customer by Line Item
Inputs: Customer Order from Source: Customer An order from a customer for a particular product or a number of products.
It is often referred to as an actual demand to distinguish it from a forecasted demand.
Customer Quote from D1.1 Process Inquiry & Quote
A statement of price, terms of sale, and description of goods or services offered by a supplier to a prospective purchaser; a bid. When given in response to an inquiry, it is usually considered an offer to sell.
Customer Replenish Signal from Source: Customer
A requirement for product from a distribution location to a source location.
Deliver Contract Terms from Source: Customer
The process of making a delivery commitment. For make-to-order products, this usually involves a check of uncommitted material and availability of capacity, often as represented by the master schedule available-to-promise.
Order Rules from ED.1 Manage Deliver Business Rules
Rules for the function that encompasses receiving, entering, and promising orders from customers, distribution centers, and interplant operations.

© Copyright 2006 Supply-Chain Council, Inc. 172 June 2006
Outputs: Actual Sales History to P5.1 Assess, and Aggregate Return Requirements
Amount of past sales spanning any specified period of time (weeks, months, years, etc.) and expressed in any specified increments (per day, week, month, year, etc.)
Contract Status to ED.3 Manage Deliver Information
Customer profile, which include address data, credit and purchase histories, customer preferences including shipping, status, and delivery requirements, etc.
Credit History to ED.3 Manage Deliver Information
Report that portrays a potential customer’s payment history and debt, indicating the ability to pay in a timely manner in the future.
Customer Address Data to ED.3 Manage Deliver Information
Customer profile, which include address data, credit and purchase histories, customer preferences including shipping, status, and delivery requirements, etc.
Customer Order to ED.2 Assess Delivery Performance
An order from a customer for a particular product or a number of products. It is often referred to as an actual demand to distinguish it from a forecasted demand.
Customer Order Size, Weight, and Freight Class to ED.6 Manage Transportation
Coupled with cube and route, these criteria determine type of carrier and cost of shipment
Location of Customers to ED.7 Manage Product Life Cycle
Customer profile, which includes address and location data, credit and purchase histories, customer preferences including shipping, status, and delivery requirements, etc.
Optional Payment to Company Payment at the time of order, maybe partial or in full. Purchase History to ED.3 Manage Deliver Information
The amount of purchased products for a certain time in history per specific intervals
Shipping Preferences to ED.3 Manage Deliver Information
Customer preferences including shipping, status, and delivery requirements, etc., and customer profile, which includes address data, credit and purchase histories,
Validated Order to D1.3 Reserve Inventory & Determine Delivery Date
An order that has had the instructions / requirements validated i.e. the information that the order contains is accurate , consistent with previous information and does not violate business policies or rules. Note 1 - this does not make the order ““committed““ there may be other tasks to be performed before a commitment can be made. Note 2 - this order could be customer, internal , purchase or production.
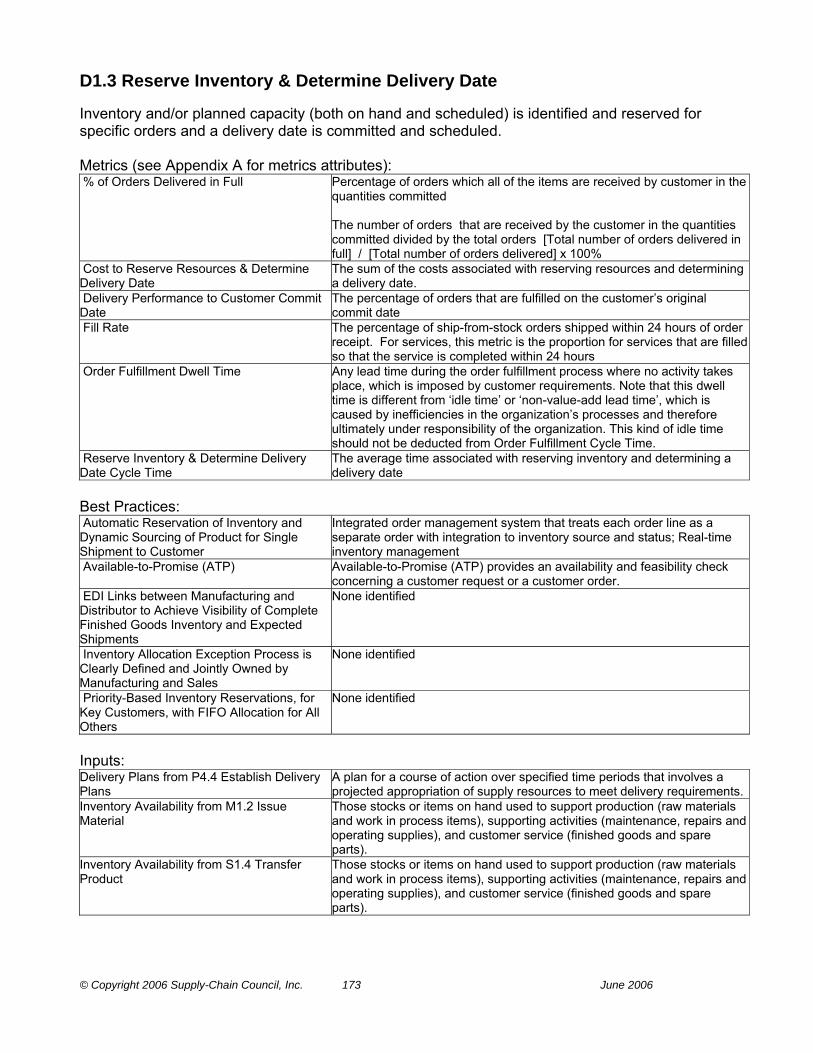
© Copyright 2006 Supply-Chain Council, Inc. 173 June 2006
D1.3 Reserve Inventory & Determine Delivery Date Inventory and/or planned capacity (both on hand and scheduled) is identified and reserved for specific orders and a delivery date is committed and scheduled. Metrics (see Appendix A for metrics attributes): % of Orders Delivered in Full Percentage of orders which all of the items are received by customer in the
quantities committed The number of orders that are received by the customer in the quantities committed divided by the total orders [Total number of orders delivered in full] / [Total number of orders delivered] x 100%
Cost to Reserve Resources & Determine Delivery Date
The sum of the costs associated with reserving resources and determining a delivery date.
Delivery Performance to Customer Commit Date
The percentage of orders that are fulfilled on the customer’s original commit date
Fill Rate The percentage of ship-from-stock orders shipped within 24 hours of order receipt. For services, this metric is the proportion for services that are filled so that the service is completed within 24 hours
Order Fulfillment Dwell Time Any lead time during the order fulfillment process where no activity takes place, which is imposed by customer requirements. Note that this dwell time is different from ‘idle time’ or ‘non-value-add lead time’, which is caused by inefficiencies in the organization’s processes and therefore ultimately under responsibility of the organization. This kind of idle time should not be deducted from Order Fulfillment Cycle Time.
Reserve Inventory & Determine Delivery Date Cycle Time
The average time associated with reserving inventory and determining a delivery date
Best Practices: Automatic Reservation of Inventory and Dynamic Sourcing of Product for Single Shipment to Customer
Integrated order management system that treats each order line as a separate order with integration to inventory source and status; Real-time inventory management
Available-to-Promise (ATP) Available-to-Promise (ATP) provides an availability and feasibility check concerning a customer request or a customer order.
EDI Links between Manufacturing and Distributor to Achieve Visibility of Complete Finished Goods Inventory and Expected Shipments
None identified
Inventory Allocation Exception Process is Clearly Defined and Jointly Owned by Manufacturing and Sales
None identified
Priority-Based Inventory Reservations, for Key Customers, with FIFO Allocation for All Others
None identified
Inputs: Delivery Plans from P4.4 Establish Delivery Plans
A plan for a course of action over specified time periods that involves a projected appropriation of supply resources to meet delivery requirements.
Inventory Availability from M1.2 Issue Material
Those stocks or items on hand used to support production (raw materials and work in process items), supporting activities (maintenance, repairs and operating supplies), and customer service (finished goods and spare parts).
Inventory Availability from S1.4 Transfer Product
Those stocks or items on hand used to support production (raw materials and work in process items), supporting activities (maintenance, repairs and operating supplies), and customer service (finished goods and spare parts).

© Copyright 2006 Supply-Chain Council, Inc. 174 June 2006
Production Plans from P3.4 Establish Production Plans
A master production plan used to allocate capacity among manufacturing resources and schedule finite manufacturing activities or executing the performance of a service. Production Plan includes production capability.
Production Schedule from M1.1 Schedule Production Activities
A plan that authorizes the factory to manufacture or repair a certain quantity of a specific item.
Sourcing Plans from P2.4 Establish Sourcing Plans
An aggregate material requirements plan used to schedule material deliveries to meet production plan.
Validated Order from D1.2 Receive, Enter & Validate Order
An order that has had the instructions / requirements validated i.e. the information that the order contains is accurate , consistent with previous information and does not violate business policies or rules. Note 1 - this does not make the order ““committed““ there may be other tasks to be performed before a commitment can be made. Note 2 - this order could be customer, internal , purchase or production.
Outputs: Delivery Date to D1.4 Consolidate Orders Those stocks or items on hand used to support production (raw materials
and work in process items), supporting activities (maintenance, repairs and operating supplies), and customer service (finished goods and spare parts). Determination of the time required from the receipt of the order until the item should be delivered.
Inventory Availability/Delivery Date to P4.2 Identify, Assess, and Aggregate Delivery Resources and Capabilities
Those stocks or items on hand used to support production (raw materials and work in process items), supporting activities (maintenance, repairs and operating supplies), and customer service (finished goods and spare parts). Determination of the time required from the receipt of the order until the item should be delivered.
Order Backlog to P1.1 Identify, Prioritize, and Aggregate Supply Chain Requirements
Orders that have been received and entered into the order processing system and are in a queue waiting to be processed and shipped.
Order Backlog to P4.1 Identify, Prioritize, and Aggregate Delivery Requirements
Orders that have been received and entered into the order processing system and are in a queue waiting to be processed and shipped.
Replenishment Signal to S1.1 Schedule Product Deliveries
Any signal that indicates when to produce or transport Items in a pull replenishment system.
Replenishment Signal to S2.4 Transfer Product
Any signal that indicates when to produce or transport Items in a pull replenishment system.
Replenishment Signal to S3.6 Transfer Product
Any signal that indicates when to produce or transport Items in a pull replenishment system.
Replenishment Signal to S1.4 Transfer Product
Any signal that indicates when to produce or transport Items in a pull replenishment system.
Shipments to P1.1 Identify, Prioritize, and Aggregate Supply Chain Requirements
Transactions related to sending the product to the customer.

© Copyright 2006 Supply-Chain Council, Inc. 175 June 2006
D1.4 Consolidate Orders The process of analyzing orders to determine the groupings that result in least cost/best service fulfillment and transportation. Metrics (see Appendix A for metrics attributes): Consolidate Orders Cycle Time The average time required for customer order consolidation. Cost to Consolidate Orders The sum of the costs associated with consolidating customer orders. Best Practices: Combine Consolidation Needs with Other Products/Divisions/Companies
None identified
Consolidate Orders by Customer, Source, Traffic Lane, Carrier, Etc.
Integrated load planning and building with warehouse management
Inputs: Delivery Date from D1.3 Reserve Inventory & Determine Delivery Date
Those stocks or items on hand used to support production (raw materials and work in process items), supporting activities (maintenance, repairs and operating supplies), and customer service (finished goods and spare parts). Determination of the time required from the receipt of the order until the item should be delivered.
Outputs: Daily Shipment Volume to Carrier Daily Shipment Volume categorized by customer, source, traffic lane,
carrier, etc. Daily Shipment Volume to D1.5 Build Loads Daily Shipment Volume categorized by customer, source, traffic lane,
carrier, etc.
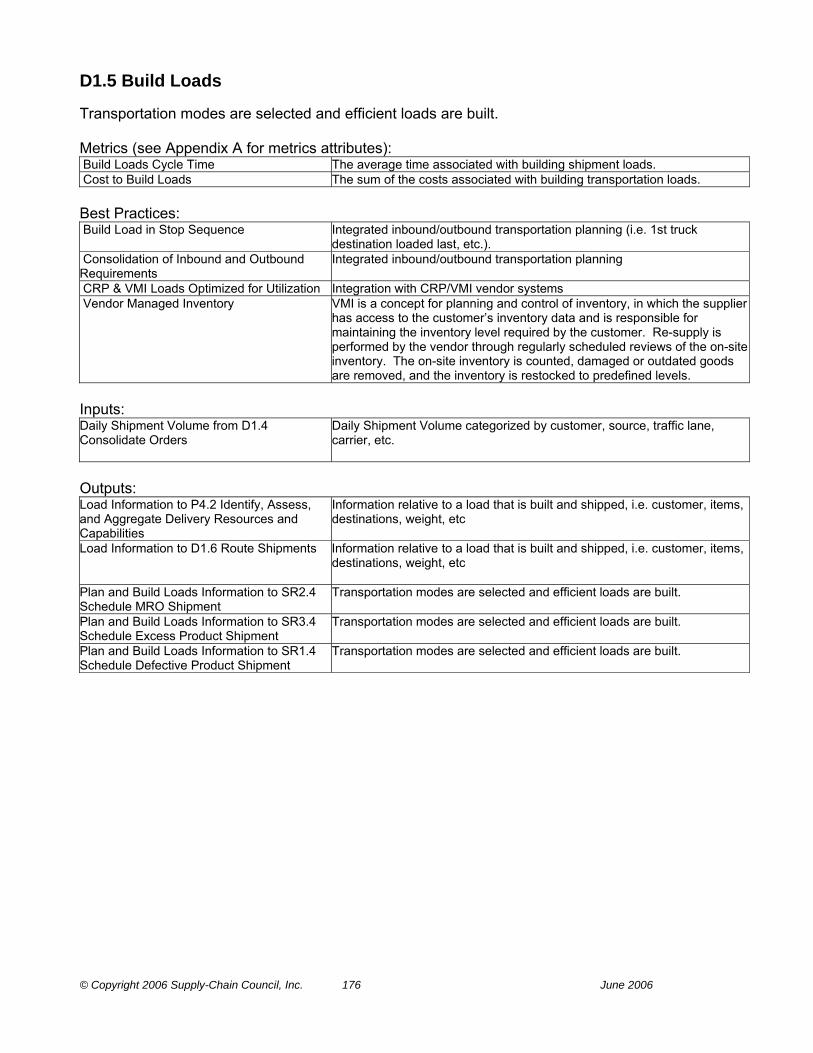
© Copyright 2006 Supply-Chain Council, Inc. 176 June 2006
D1.5 Build Loads Transportation modes are selected and efficient loads are built. Metrics (see Appendix A for metrics attributes): Build Loads Cycle Time The average time associated with building shipment loads. Cost to Build Loads The sum of the costs associated with building transportation loads. Best Practices: Build Load in Stop Sequence Integrated inbound/outbound transportation planning (i.e. 1st truck
destination loaded last, etc.). Consolidation of Inbound and Outbound Requirements
Integrated inbound/outbound transportation planning
CRP & VMI Loads Optimized for Utilization Integration with CRP/VMI vendor systems Vendor Managed Inventory VMI is a concept for planning and control of inventory, in which the supplier
has access to the customer’s inventory data and is responsible for maintaining the inventory level required by the customer. Re-supply is performed by the vendor through regularly scheduled reviews of the on-site inventory. The on-site inventory is counted, damaged or outdated goods are removed, and the inventory is restocked to predefined levels.
Inputs: Daily Shipment Volume from D1.4 Consolidate Orders
Daily Shipment Volume categorized by customer, source, traffic lane, carrier, etc.
Outputs: Load Information to P4.2 Identify, Assess, and Aggregate Delivery Resources and Capabilities
Information relative to a load that is built and shipped, i.e. customer, items, destinations, weight, etc
Load Information to D1.6 Route Shipments Information relative to a load that is built and shipped, i.e. customer, items, destinations, weight, etc
Plan and Build Loads Information to SR2.4 Schedule MRO Shipment
Transportation modes are selected and efficient loads are built.
Plan and Build Loads Information to SR3.4 Schedule Excess Product Shipment
Transportation modes are selected and efficient loads are built.
Plan and Build Loads Information to SR1.4 Schedule Defective Product Shipment
Transportation modes are selected and efficient loads are built.
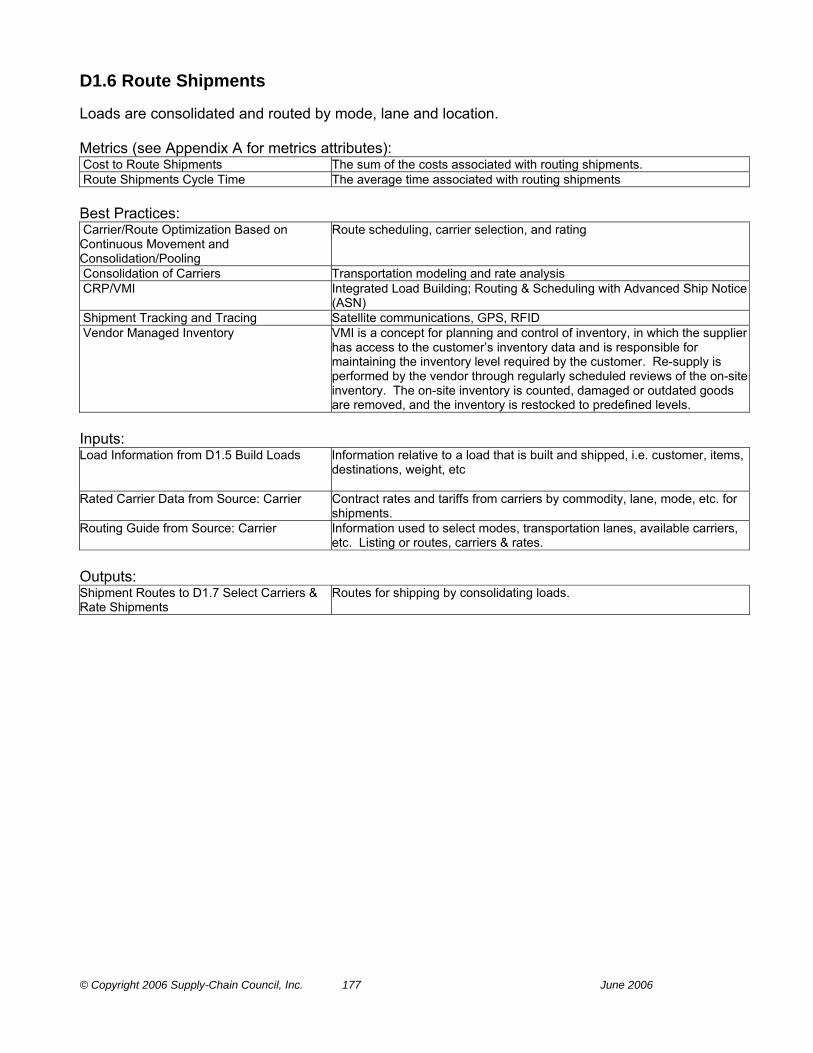
© Copyright 2006 Supply-Chain Council, Inc. 177 June 2006
D1.6 Route Shipments Loads are consolidated and routed by mode, lane and location. Metrics (see Appendix A for metrics attributes): Cost to Route Shipments The sum of the costs associated with routing shipments. Route Shipments Cycle Time The average time associated with routing shipments Best Practices: Carrier/Route Optimization Based on Continuous Movement and Consolidation/Pooling
Route scheduling, carrier selection, and rating
Consolidation of Carriers Transportation modeling and rate analysis CRP/VMI Integrated Load Building; Routing & Scheduling with Advanced Ship Notice
(ASN) Shipment Tracking and Tracing Satellite communications, GPS, RFID Vendor Managed Inventory VMI is a concept for planning and control of inventory, in which the supplier
has access to the customer’s inventory data and is responsible for maintaining the inventory level required by the customer. Re-supply is performed by the vendor through regularly scheduled reviews of the on-site inventory. The on-site inventory is counted, damaged or outdated goods are removed, and the inventory is restocked to predefined levels.
Inputs: Load Information from D1.5 Build Loads Information relative to a load that is built and shipped, i.e. customer, items,
destinations, weight, etc
Rated Carrier Data from Source: Carrier Contract rates and tariffs from carriers by commodity, lane, mode, etc. for shipments.
Routing Guide from Source: Carrier Information used to select modes, transportation lanes, available carriers, etc. Listing or routes, carriers & rates.
Outputs: Shipment Routes to D1.7 Select Carriers & Rate Shipments
Routes for shipping by consolidating loads.
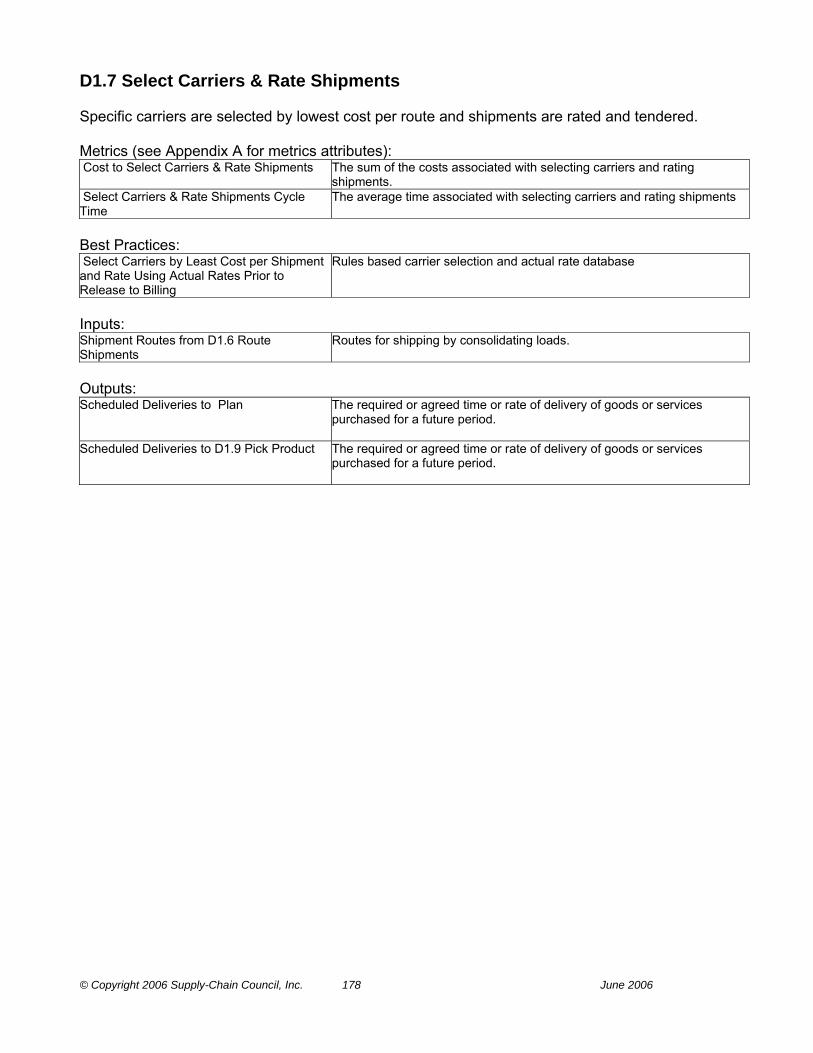
© Copyright 2006 Supply-Chain Council, Inc. 178 June 2006
D1.7 Select Carriers & Rate Shipments Specific carriers are selected by lowest cost per route and shipments are rated and tendered. Metrics (see Appendix A for metrics attributes): Cost to Select Carriers & Rate Shipments The sum of the costs associated with selecting carriers and rating
shipments. Select Carriers & Rate Shipments Cycle Time
The average time associated with selecting carriers and rating shipments
Best Practices: Select Carriers by Least Cost per Shipment and Rate Using Actual Rates Prior to Release to Billing
Rules based carrier selection and actual rate database
Inputs: Shipment Routes from D1.6 Route Shipments
Routes for shipping by consolidating loads.
Outputs: Scheduled Deliveries to Plan The required or agreed time or rate of delivery of goods or services
purchased for a future period.
Scheduled Deliveries to D1.9 Pick Product The required or agreed time or rate of delivery of goods or services purchased for a future period.

© Copyright 2006 Supply-Chain Council, Inc. 179 June 2006
D1.8 Receive Product from Source or Make The activities such as receiving product, verifying, recording product receipt, determining put-away location, putting away and recording location that a company performs at its own warehouses. May include quality inspection. Metrics (see Appendix A for metrics attributes): Cost to Receive Product from Source or Make
The sum of the costs associated with transferring product from source or make activities.
Receive Product from Source or Make Cycle Time
The average time associated with receiving a transfer of product to deliver processes from source or make
Best Practices: Automatic Identification Bar Coding & Radio Frequency Communications Cross-Docking Used in many distribution centers (DC) to increase inventory velocity while
maintaining shipping efficiency. In a traditional DC, the receiving process is disjointed from the shipping process and storage acts as an intermediary between the two processes. Cross docking actively links the receiving and shipping processes. In a DC, both cross docking (no storage) and traditional (with storage) operations might take place.
Download P.O. & Advanced Ship Notices for Automated Receiving and Put Away
Integration with Procurement Systems & Electronic Commerce with Vendors
Dynamic Location Assignment Including Lot Control, Zoned Put Away, Quality Assurance, ABC Frequency of Access
Real time inventory control, stock locator, and rules based put away logic
Merge-in-Transit Merge-in-Transit is a practice to combine items from multiple sources into a single customer shipment. This includes items on stock in the distribution center, from which the shipment is sent, items on stock in other distribution centers, items on stock elsewhere (e.g. at a plant or a supplier) as well as make-to-order items. The items to be merged are cross-docked from inbound receipt to outbound shipping. Merging is usually performed in a shipper’s distribution center (DC) or in a carrier’s terminal.
Inputs: Authorization to Return to Service from SR2.2 Disposition MRO Product
Permission to return to service an item that has been repaired and found to be within specifications and operable.
Authorization to Return to Service from SR1.2 Disposition Defective Product
Permission to return to service an item that has been repaired and found to be within specifications and operable.
Authorization to Return to Service from SR3.2 Disposition Excess Product
Permission to return to service an item that has been repaired and found to be within specifications and operable.
Authorization to Scrap from SR3.2 Disposition Excess Product
Permission to scrap material or item outside of specifications and possessing characteristics that make rework impractical.
Authorization to Scrap from SR1.2 Disposition Defective Product
Permission to scrap material or item outside of specifications and possessing characteristics that make rework impractical.
Authorization to Scrap from SR2.2 Disposition MRO Product
Permission to scrap material or item outside of specifications and possessing characteristics that make rework impractical.
Finished Product Release from M1.6 Release Product to Deliver
The authorization to ship a finished product that has been ordered.

© Copyright 2006 Supply-Chain Council, Inc. 180 June 2006
Inventory Availability from S1.4 Transfer Product
Those stocks or items on hand used to support production (raw materials and work in process items), supporting activities (maintenance, repairs and operating supplies), and customer service (finished goods and spare parts).
Production Schedule from M1.1 Schedule Production Activities
A plan that authorizes the factory to manufacture or repair a certain quantity of a specific item.
Scheduled Receipts from S1.1 Schedule Product Deliveries
Product due to arrive.
Outputs: Existing Inventory Data to ED.4 Manage Finished Goods Inventories
Available data that characterizes and quantifies raw material, work in process, and finished goods inventories
Inventory Availability to D1.9 Pick Product Those stocks or items on hand used to support production (raw materials and work in process items), supporting activities (maintenance, repairs and operating supplies), and customer service (finished goods and spare parts).

© Copyright 2006 Supply-Chain Council, Inc. 181 June 2006
D1.9 Pick Product The series of activities including retrieving orders to pick, determining inventory availability, building the pick wave, picking the product, recording the pick and delivering product to shipping in response to an order. Metrics (see Appendix A for metrics attributes): Cost to Pick Product The sum of the costs associated with picking product. Fill Rate The percentage of ship-from-stock orders shipped within 24 hours of order
receipt. For services, this metric is the proportion for services that are filled so that the service is completed within 24 hours
Pick Product Cycle Time The average time associated with product pick Best Practices: Dynamic Location Assignment Including Lot Control, Zoned Picking, Quality Assurance
Real time inventory control, stock locator, and rules based picking logic
Dynamic Simulation of Picking Requirements Optimized for Labor, Cost, and Time
Rules based picking logic and simulation
Merge-in-Transit Merge-in-Transit is a practice to combine items from multiple sources into a single customer shipment. This includes items on stock in the distribution center, from which the shipment is sent, items on stock in other distribution centers, items on stock elsewhere (e.g. at a plant or a supplier) as well as make-to-order items. The items to be merged are cross-docked from inbound receipt to outbound shipping. Merging is usually performed in a shipper’s distribution center (DC) or in a carrier’s terminal.
Use of Speed Racks for Automated Material Handling
None identified
Wave picking A practice used in many DC operations to increase labor picking productivity and reduce the labor cost per pick. In some DC’s, orders are scheduled to be picked when they are received. Wave picking consolidates orders into “waves“ where multiple orders with similar characteristics are picked at one time. Orders can be consolidated by customer, geography, or any other criteria that makes sense for the DC operation.
Inputs: Scheduled Deliveries from D1.7 Select Carriers & Rate Shipments
The required or agreed time or rate of delivery of goods or services purchased for a future period.
Inventory Availability from D1.8 Receive Product from Source or Make
Those stocks or items on hand used to support production (raw materials and work in process items), supporting activities (maintenance, repairs and operating supplies), and customer service (finished goods and spare parts).
Outputs: Workflow to D1.10 Pack Product

© Copyright 2006 Supply-Chain Council, Inc. 182 June 2006
D1.10 Pack Product The activities such as sorting / combining the products, packing / kitting the products, paste labels, barcodes etc. and delivering the products to the shipping area for loading. Metrics (see Appendix A for metrics attributes): Cost to Pack Product The sum of the costs associated with product packaging. Pack Product Cycle Time The average time associated with packing a product for shipment. Inputs: Workflow from D1.9 Pick Product Outputs: Workflow to D1.11 Load Vehicle & Generate Shipping Documentation

© Copyright 2006 Supply-Chain Council, Inc. 183 June 2006
D1.11 Load Vehicle & Generate Shipping Documentation The series of tasks including placing/loading product onto modes of transportation and generating the documentation necessary to meet internal, customer, carrier and government needs. Metrics (see Appendix A for metrics attributes): Cost to Load Product & Generate Shipping Documentation
The sum of the costs associated with loading product & generating shipping documentation.
Delivery Performance to Customer Commit Date
The percentage of orders that are fulfilled on the customer’s original commit date
Documentation Accuracy Percentage of orders with on time and accurate documentation supporting the order, including packing slips, bills of lading, invoices, etc. [Total number of orders delivered with correct and timely documentation] / [Total number of orders delivered] x 100%
Load Product & Generate Shipping Documentation Cycle Time
The average time associated with product loading and the generation of shipping documentation
Best Practices: Advanced Shipping Notices & UCC128 Container Labeling
Bar coding; EDI; integrated transportation/warehouse management
Carrier Agreement Carrier agreements are agreements between a company and its domestic and global carriers (for both, inbound raw materials and outbound finished goods) specifying service levels, payment terms, and other conditions.
Cross-Docking Used in many distribution centers (DC) to increase inventory velocity while maintaining shipping efficiency. In a traditional DC, the receiving process is disjointed from the shipping process and storage acts as an intermediary between the two processes. Cross docking actively links the receiving and shipping processes. In a DC, both cross docking (no storage) and traditional (with storage) operations might take place.
Electronic Generation and Download of Shipping Documents
None identified
Full Visibility of Credit History by Shipping Personnel
None identified
Integrated Credit Checking Interface to supplier’s shipping system to financials Shipment Tracking None identified Inputs: Shipping Export Parameters and Documentation from ED.8 Manage Import/Export Requirements
Shipping and documentation requirements established by a government which must be met before allowing the shipping or delivery of a product across national boundaries.
Shipping Parameters and Documentation from ED.6 Manage Transportation
Shipping parameters, such as weight, size, cube and route decide carrier and cost. Legal documentation of the contents of a shipment (e.g. way bill, bill of lading, export papers, etc.) are required.
Outputs: Delivered End Items to Customer Products that have been acknowledged as received by the customer. Load, Shipping, Verify, and Credit Information to SR1.5 Return Defective Product
The function that performs tasks for the outgoing shipment of parts, components, and products. It includes packaging, marking, weighing, and loading for shipment. Also, verify the shipment and customer credit information.
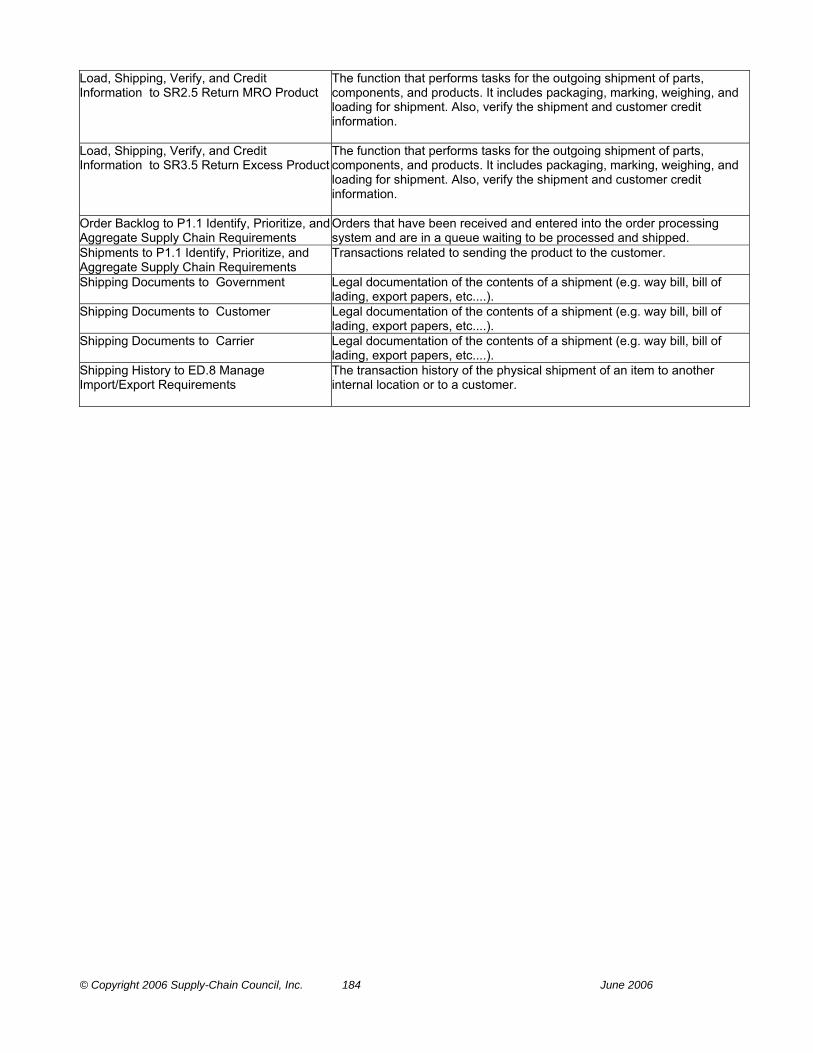
© Copyright 2006 Supply-Chain Council, Inc. 184 June 2006
Load, Shipping, Verify, and Credit Information to SR2.5 Return MRO Product
The function that performs tasks for the outgoing shipment of parts, components, and products. It includes packaging, marking, weighing, and loading for shipment. Also, verify the shipment and customer credit information.
Load, Shipping, Verify, and Credit Information to SR3.5 Return Excess Product
The function that performs tasks for the outgoing shipment of parts, components, and products. It includes packaging, marking, weighing, and loading for shipment. Also, verify the shipment and customer credit information.
Order Backlog to P1.1 Identify, Prioritize, and Aggregate Supply Chain Requirements
Orders that have been received and entered into the order processing system and are in a queue waiting to be processed and shipped.
Shipments to P1.1 Identify, Prioritize, and Aggregate Supply Chain Requirements
Transactions related to sending the product to the customer.
Shipping Documents to Government Legal documentation of the contents of a shipment (e.g. way bill, bill of lading, export papers, etc....).
Shipping Documents to Customer Legal documentation of the contents of a shipment (e.g. way bill, bill of lading, export papers, etc....).
Shipping Documents to Carrier Legal documentation of the contents of a shipment (e.g. way bill, bill of lading, export papers, etc....).
Shipping History to ED.8 Manage Import/Export Requirements
The transaction history of the physical shipment of an item to another internal location or to a customer.

© Copyright 2006 Supply-Chain Council, Inc. 185 June 2006
D1.12 Ship Product The process of shipping the product to the customer site. Metrics (see Appendix A for metrics attributes): % of Orders Delivered in Full Percentage of orders which all of the items are received by customer in the
quantities committed The number of orders that are received by the customer in the quantities committed divided by the total orders [Total number of orders delivered in full] / [Total number of orders delivered] x 100%
Cost to Ship Product The sum of the costs associated with shipping products. Delivery Performance to Customer Commit Date
The percentage of orders that are fulfilled on the customer’s original commit date
Ship Product Cycle Time The average time associated with shipping product Best Practices: Cross-Docking Used in many distribution centers (DC) to increase inventory velocity while
maintaining shipping efficiency. In a traditional DC, the receiving process is disjointed from the shipping process and storage acts as an intermediary between the two processes. Cross docking actively links the receiving and shipping processes. In a DC, both cross docking (no storage) and traditional (with storage) operations might take place.
Shipment Tracking None identified Inputs: Workflow from D1.11 Load Vehicle & Generate Shipping Documentation Outputs: Workflow to D1.13 Receive & Verify Product by Customer

© Copyright 2006 Supply-Chain Council, Inc. 186 June 2006
D1.13 Receive & Verify Product by Customer The process of receiving the shipment by the customer site (either at customer site or at shipping area in case of self-collection) and verifying that the order was shipped complete and that the product meets delivery terms. Metrics (see Appendix A for metrics attributes): % of Orders Delivered in Full Percentage of orders which all of the items are received by customer in the
quantities committed The number of orders that are received by the customer in the quantities committed divided by the total orders [Total number of orders delivered in full] / [Total number of orders delivered] x 100%
Cost to Receive & Verify Product by Customer
The sum of the costs associated with receipt and verification at customer site.
Delivery Performance to Customer Commit Date
The percentage of orders that are fulfilled on the customer’s original commit date
Perfect Condition Percentage of orders delivered in an undamaged state that meet specification, have the correct configuration, are faultlessly installed (as applicable), and accepted by the customer [ Number of orders delivered in Perfect Condition ] / [Number of orders delivered ] x 100%
Receive & Verify Product by Customer Cycle Time
The average time associated with receiving and verifying an order at the customer site
Best Practices: Advanced Shipping Notices & UCC128 Container Labeling
Bar coding; EDI; integrated transportation/warehouse management
Inputs: Workflow from D1.12 Ship Product Outputs: Product to D1.14 Install Product The end object of a transformation process that includes physical objects,
information or services.

© Copyright 2006 Supply-Chain Council, Inc. 187 June 2006
D1.14 Install Product When necessary, the process of preparing, testing and installing the product at the customer site. The product is fully functional upon completion. Each occurrence consumes time: Metrics (see Appendix A for metrics attributes): % of Faultless Installations Number of Faultless Installations divided by Total Number of Units
Installed. Cost to Install Product The sum of the costs associated with product installation. Install Product Cycle Time The average time associated with product installation Perfect Condition Percentage of orders delivered in an undamaged state that meet
specification, have the correct configuration, are faultlessly installed (as applicable), and accepted by the customer [ Number of orders delivered in Perfect Condition ] / [Number of orders delivered ] x 100%
Best Practices: Joint Service Agreements to Document Acceptable Service Levels in Terms of Installation Costs, Installation Cycle Time, Etc.
Collaborative planning tools with the Source suppliers (This would be effective between customer and supplier, and between internal functions such as Field Service, Manufacturing, Marketing and Order Management)
Inputs: Product from D1.13 Receive & Verify Product by Customer
The end object of a transformation process that includes physical objects, information or services.
Outputs: Installed Product to D1.15 Invoice The process of preparing, testing and installing the product at the customer
site. The standalone product is fully functional upon completion, but there may be requirement for subsequent integration.
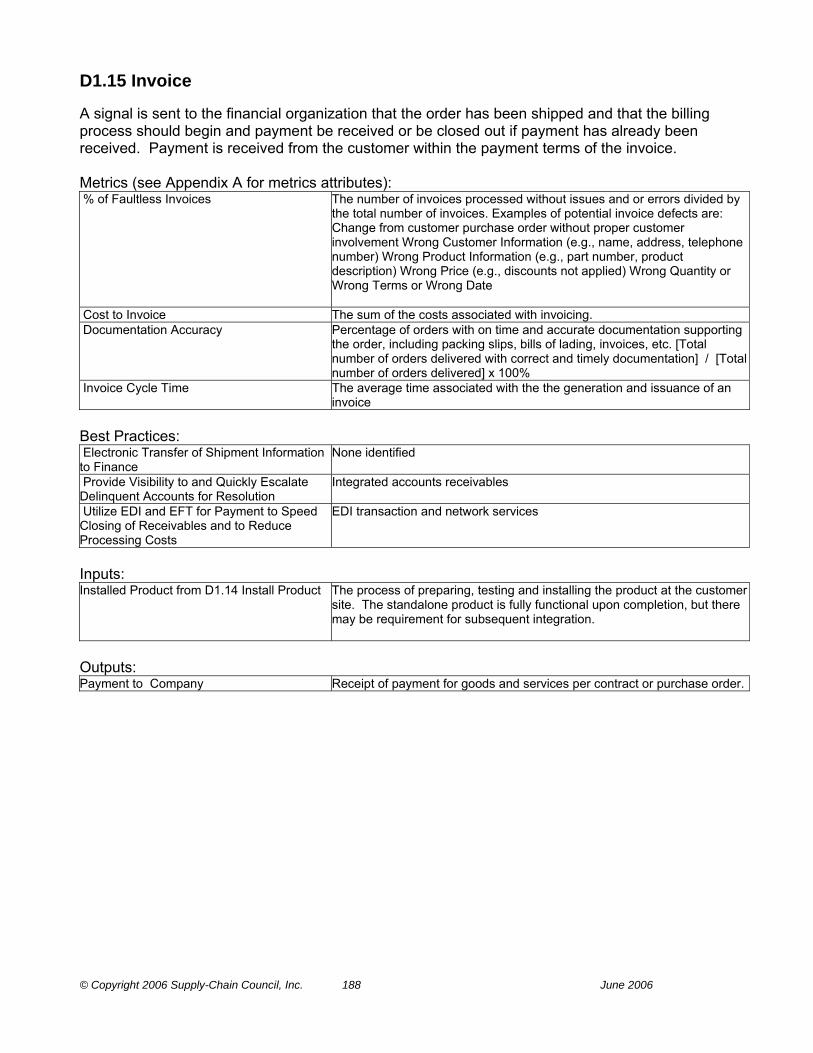
© Copyright 2006 Supply-Chain Council, Inc. 188 June 2006
D1.15 Invoice A signal is sent to the financial organization that the order has been shipped and that the billing process should begin and payment be received or be closed out if payment has already been received. Payment is received from the customer within the payment terms of the invoice. Metrics (see Appendix A for metrics attributes): % of Faultless Invoices The number of invoices processed without issues and or errors divided by
the total number of invoices. Examples of potential invoice defects are: Change from customer purchase order without proper customer involvement Wrong Customer Information (e.g., name, address, telephone number) Wrong Product Information (e.g., part number, product description) Wrong Price (e.g., discounts not applied) Wrong Quantity or Wrong Terms or Wrong Date
Cost to Invoice The sum of the costs associated with invoicing. Documentation Accuracy Percentage of orders with on time and accurate documentation supporting
the order, including packing slips, bills of lading, invoices, etc. [Total number of orders delivered with correct and timely documentation] / [Total number of orders delivered] x 100%
Invoice Cycle Time The average time associated with the the generation and issuance of an invoice
Best Practices: Electronic Transfer of Shipment Information to Finance
None identified
Provide Visibility to and Quickly Escalate Delinquent Accounts for Resolution
Integrated accounts receivables
Utilize EDI and EFT for Payment to Speed Closing of Receivables and to Reduce Processing Costs
EDI transaction and network services
Inputs: Installed Product from D1.14 Install Product The process of preparing, testing and installing the product at the customer
site. The standalone product is fully functional upon completion, but there may be requirement for subsequent integration.
Outputs: Payment to Company Receipt of payment for goods and services per contract or purchase order.
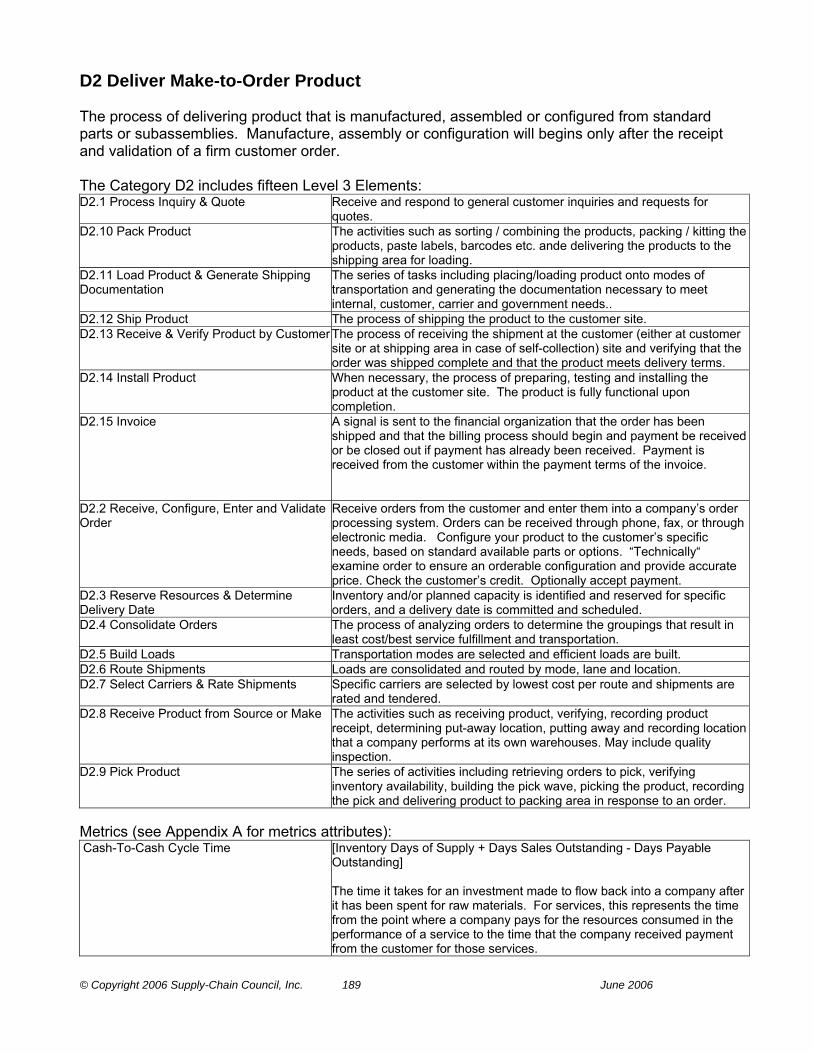
© Copyright 2006 Supply-Chain Council, Inc. 189 June 2006
D2 Deliver Make-to-Order Product The process of delivering product that is manufactured, assembled or configured from standard parts or subassemblies. Manufacture, assembly or configuration will begins only after the receipt and validation of a firm customer order. The Category D2 includes fifteen Level 3 Elements: D2.1 Process Inquiry & Quote Receive and respond to general customer inquiries and requests for
quotes. D2.10 Pack Product The activities such as sorting / combining the products, packing / kitting the
products, paste labels, barcodes etc. ande delivering the products to the shipping area for loading.
D2.11 Load Product & Generate Shipping Documentation
The series of tasks including placing/loading product onto modes of transportation and generating the documentation necessary to meet internal, customer, carrier and government needs..
D2.12 Ship Product The process of shipping the product to the customer site. D2.13 Receive & Verify Product by Customer The process of receiving the shipment at the customer (either at customer
site or at shipping area in case of self-collection) site and verifying that the order was shipped complete and that the product meets delivery terms.
D2.14 Install Product When necessary, the process of preparing, testing and installing the product at the customer site. The product is fully functional upon completion.
D2.15 Invoice A signal is sent to the financial organization that the order has been shipped and that the billing process should begin and payment be received or be closed out if payment has already been received. Payment is received from the customer within the payment terms of the invoice.
D2.2 Receive, Configure, Enter and Validate Order
Receive orders from the customer and enter them into a company’s order processing system. Orders can be received through phone, fax, or through electronic media. Configure your product to the customer’s specific needs, based on standard available parts or options. “Technically“ examine order to ensure an orderable configuration and provide accurate price. Check the customer’s credit. Optionally accept payment.
D2.3 Reserve Resources & Determine Delivery Date
Inventory and/or planned capacity is identified and reserved for specific orders, and a delivery date is committed and scheduled.
D2.4 Consolidate Orders The process of analyzing orders to determine the groupings that result in least cost/best service fulfillment and transportation.
D2.5 Build Loads Transportation modes are selected and efficient loads are built. D2.6 Route Shipments Loads are consolidated and routed by mode, lane and location. D2.7 Select Carriers & Rate Shipments Specific carriers are selected by lowest cost per route and shipments are
rated and tendered. D2.8 Receive Product from Source or Make The activities such as receiving product, verifying, recording product
receipt, determining put-away location, putting away and recording location that a company performs at its own warehouses. May include quality inspection.
D2.9 Pick Product The series of activities including retrieving orders to pick, verifying inventory availability, building the pick wave, picking the product, recording the pick and delivering product to packing area in response to an order.
Metrics (see Appendix A for metrics attributes): Cash-To-Cash Cycle Time [Inventory Days of Supply + Days Sales Outstanding - Days Payable
Outstanding] The time it takes for an investment made to flow back into a company after it has been spent for raw materials. For services, this represents the time from the point where a company pays for the resources consumed in the performance of a service to the time that the company received payment from the customer for those services.

© Copyright 2006 Supply-Chain Council, Inc. 190 June 2006
Cost to Deliver The sum of the costs associated with deliver Deliver Cycle Time The average time associated with Deliver Processes Downside Deliver Adaptability The reduction in delivered quantities sustainable at 30 days prior to
delivery with no inventory or cost penalties. Finished Goods Inventory Days of Supply Plant finished goods inventory days of supply are calculated as gross plant
finished goods inventory ÷ (value of transfers/365 days). Order Fulfillment Cycle Time The average actual cycle time consistently achieved to fulfill customer
orders. Perfect Order Fulfillment The percentage of orders meeting delivery performance with complete and
accurate documentation and no delivery damage. Components include all items and quantities on-time using the customer’s definition of on-time, and documentation - packing slips, bills of lading, invoices, etc.
Return on Supply Chain Fixed Assets Return on Supply Chain Fixed Assets measures the return an organization receives on its invested capital in supply chain fixed assets. This includes the fixed assets used in Plan, Source, Make, Deliver, and Return. The levels of aggregation can be at any element associated with a supply chain asset.
Return on Working Capital Return on working capital is a measurement which assesses the magnitude of investment relative to a company’s working capital position verses the revenue generated from a supply chain. Components include accounts receivable, accounts payable, inventory, supply chain revenue, cost of goods sold and supply chain management costs.
Upside Deliver Adaptability The maximum sustainable percentage increase in quantities delivered that can be achieved in 30 days with the assumption of unconstrained finished good availability.
Upside Deliver Flexibility The number of days required to achieve an unplanned sustainable 20% increase in quantity delivered with the assumption of no other constraints.
Best Practices: Postponement Postponement (delayed differentiation) is a supply chain concept where a
product is kept as long as possible in a generic state. Differentiation of the generic product into a specific end-product is shifted closer to the consumer by postponing identify changes, such as assembly or packaging, to the last possible supply chain location.
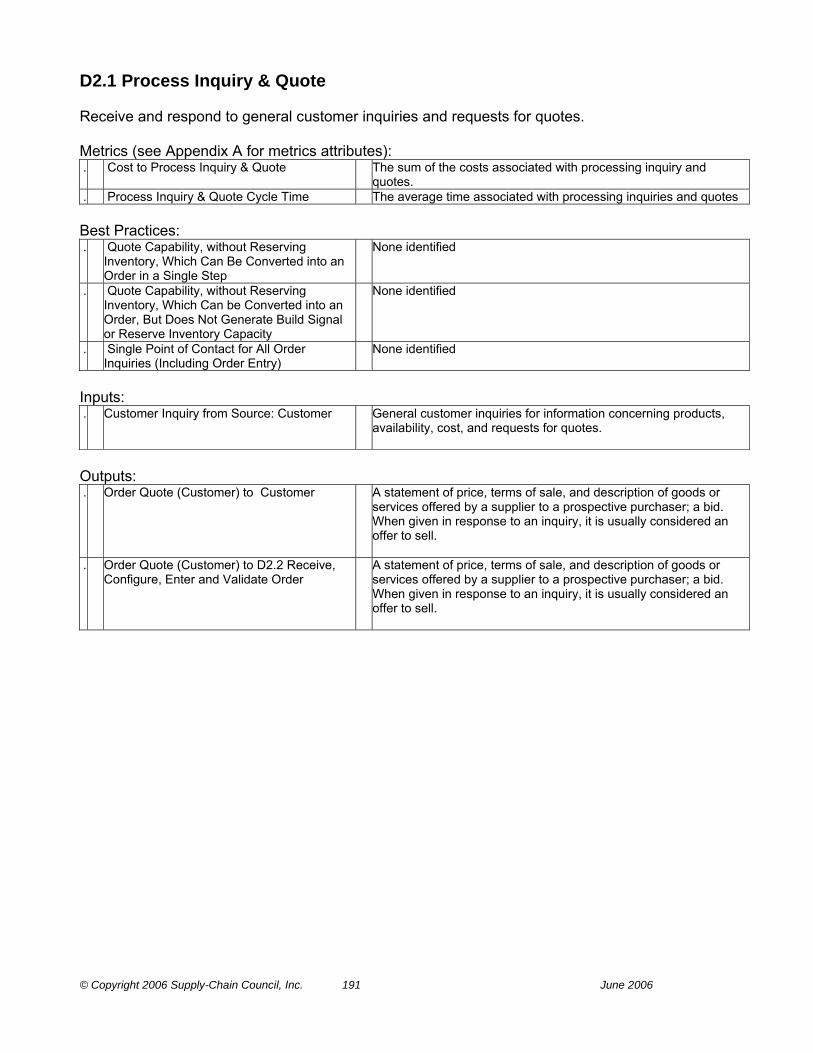
© Copyright 2006 Supply-Chain Council, Inc. 191 June 2006
D2.1 Process Inquiry & Quote Receive and respond to general customer inquiries and requests for quotes. Metrics (see Appendix A for metrics attributes): . Cost to Process Inquiry & Quote The sum of the costs associated with processing inquiry and
quotes. . Process Inquiry & Quote Cycle Time The average time associated with processing inquiries and quotes Best Practices: . Quote Capability, without Reserving
Inventory, Which Can Be Converted into an Order in a Single Step
None identified
. Quote Capability, without Reserving Inventory, Which Can be Converted into an Order, But Does Not Generate Build Signal or Reserve Inventory Capacity
None identified
. Single Point of Contact for All Order Inquiries (Including Order Entry)
None identified
Inputs: . Customer Inquiry from Source: Customer General customer inquiries for information concerning products,
availability, cost, and requests for quotes.
Outputs: . Order Quote (Customer) to Customer A statement of price, terms of sale, and description of goods or
services offered by a supplier to a prospective purchaser; a bid. When given in response to an inquiry, it is usually considered an offer to sell.
. Order Quote (Customer) to D2.2 Receive, Configure, Enter and Validate Order
A statement of price, terms of sale, and description of goods or services offered by a supplier to a prospective purchaser; a bid. When given in response to an inquiry, it is usually considered an offer to sell.

© Copyright 2006 Supply-Chain Council, Inc. 192 June 2006
D2.2 Receive, Configure, Enter and Validate Order Receive orders from the customer and enter them into a company’s order processing system. Orders can be received through phone, fax, or through electronic media. Configure your product to the customer’s specific needs, based on standard available parts or options. “Technically“ examine order to ensure an orderable configuration and provide accurate price. Check the customer’s credit. Optionally accept payment. Metrics (see Appendix A for metrics attributes): . Cost to Receive, Enter & Validate Order The sum of the costs associated with receiving, entering and
validating a customer order. . Order Fulfillment Dwell Time Any lead time during the order fulfillment process where no activity
takes place, which is imposed by customer requirements. Note that this dwell time is different from ‘idle time’ or ‘non-value-add lead time’, which is caused by inefficiencies in the organization’s processes and therefore ultimately under responsibility of the organization. This kind of idle time should not be deducted from Order Fulfillment Cycle Time.
. Receive, Configure, Enter & Validate Order Cycle Time
The average time associated with receiving and verifying an order at the customer site
Best Practices: . Automated Configuration Management Configuration . Automatic Multi-level Credit Checking: Dollar
Limits; Days Sales Outstanding; Margin Testing
Integrated Order/Financial Management
. Continuous Replenishment Programs; Vendor Managed Inventory, Telemetry to Automatically Communicate Replenishment of Chemicals
Integrated demand/deployment planning to customer location driven by POS; Customer movement data
. Electronic Commerce (Customer Visibility of Stock Availability, Use of Hand-Held Terminals for Direct Order Entry, Confirmation, Credit Approval), On-Line Stock Check and Reservation of Inventory
EDI applications and integrated order management
. Enable Real-Time Visibility into Backlog, Order Status, Shipments, Scheduled Material Receipts, Customer Credit History, and Current Inventory Positions
None identified
. Order Entry is Organized by Customer Segment Customers Receive Differentiated Service Based on Volume of Business Customer Team is Empowered to Fully Service Customer Requests, Including Formal Orders and Ad Hoc Requests Customers Have One Point of Contact for All Products
None identified
. Remote (Sales, Customers) Order Entry Capability
None identified
. Value Pricing Based on “Cost to Serve“; EDLP; Cost Plus Pricing
Activity Based Costing; Integrated Order Management by Customer by Line Item
Inputs: . Configuration Rules from ED.1 Manage
Deliver Business Rules The rules for the management of product configuration, which
includes the management of critical sub processes needed to manage the life cycle of individual item numbers including item masters, routings, rationalization, and bill of materials.
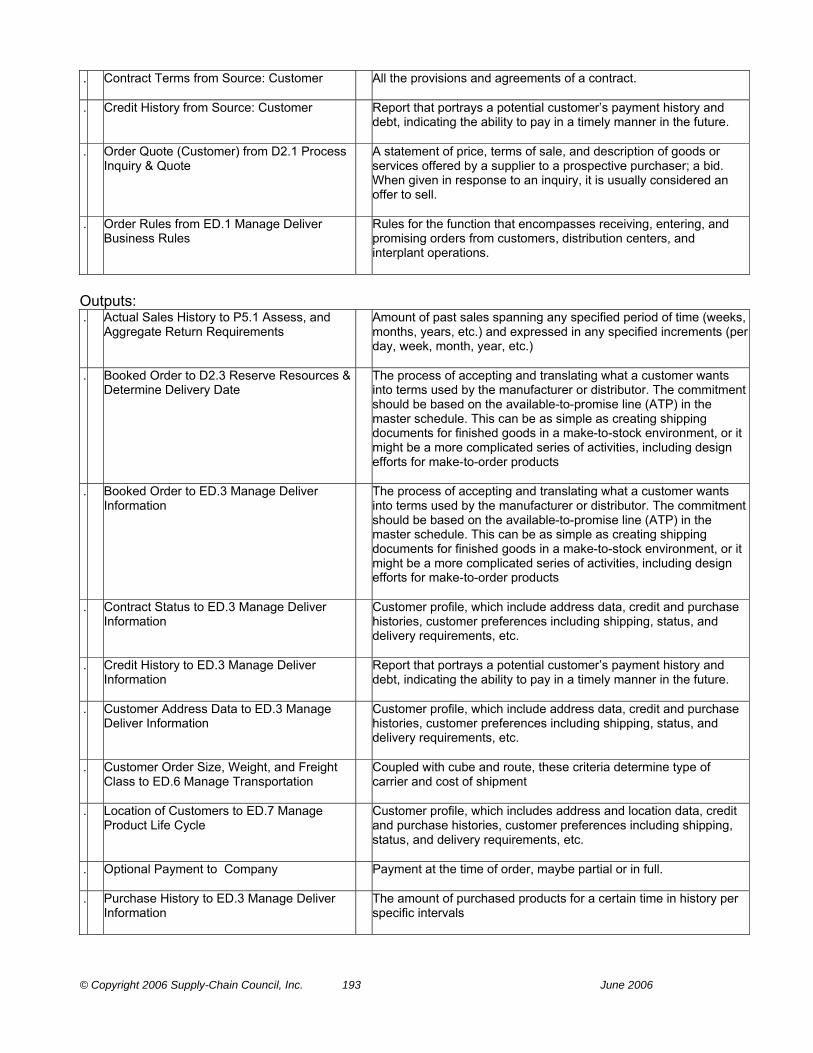
© Copyright 2006 Supply-Chain Council, Inc. 193 June 2006
. Contract Terms from Source: Customer All the provisions and agreements of a contract.
. Credit History from Source: Customer Report that portrays a potential customer’s payment history and debt, indicating the ability to pay in a timely manner in the future.
. Order Quote (Customer) from D2.1 Process Inquiry & Quote
A statement of price, terms of sale, and description of goods or services offered by a supplier to a prospective purchaser; a bid. When given in response to an inquiry, it is usually considered an offer to sell.
. Order Rules from ED.1 Manage Deliver Business Rules
Rules for the function that encompasses receiving, entering, and promising orders from customers, distribution centers, and interplant operations.
Outputs: . Actual Sales History to P5.1 Assess, and
Aggregate Return Requirements Amount of past sales spanning any specified period of time (weeks,
months, years, etc.) and expressed in any specified increments (per day, week, month, year, etc.)
. Booked Order to D2.3 Reserve Resources & Determine Delivery Date
The process of accepting and translating what a customer wants into terms used by the manufacturer or distributor. The commitment should be based on the available-to-promise line (ATP) in the master schedule. This can be as simple as creating shipping documents for finished goods in a make-to-stock environment, or it might be a more complicated series of activities, including design efforts for make-to-order products
. Booked Order to ED.3 Manage Deliver Information
The process of accepting and translating what a customer wants into terms used by the manufacturer or distributor. The commitment should be based on the available-to-promise line (ATP) in the master schedule. This can be as simple as creating shipping documents for finished goods in a make-to-stock environment, or it might be a more complicated series of activities, including design efforts for make-to-order products
. Contract Status to ED.3 Manage Deliver Information
Customer profile, which include address data, credit and purchase histories, customer preferences including shipping, status, and delivery requirements, etc.
. Credit History to ED.3 Manage Deliver Information
Report that portrays a potential customer’s payment history and debt, indicating the ability to pay in a timely manner in the future.
. Customer Address Data to ED.3 Manage Deliver Information
Customer profile, which include address data, credit and purchase histories, customer preferences including shipping, status, and delivery requirements, etc.
. Customer Order Size, Weight, and Freight Class to ED.6 Manage Transportation
Coupled with cube and route, these criteria determine type of carrier and cost of shipment
. Location of Customers to ED.7 Manage Product Life Cycle
Customer profile, which includes address and location data, credit and purchase histories, customer preferences including shipping, status, and delivery requirements, etc.
. Optional Payment to Company Payment at the time of order, maybe partial or in full.
. Purchase History to ED.3 Manage Deliver Information
The amount of purchased products for a certain time in history per specific intervals
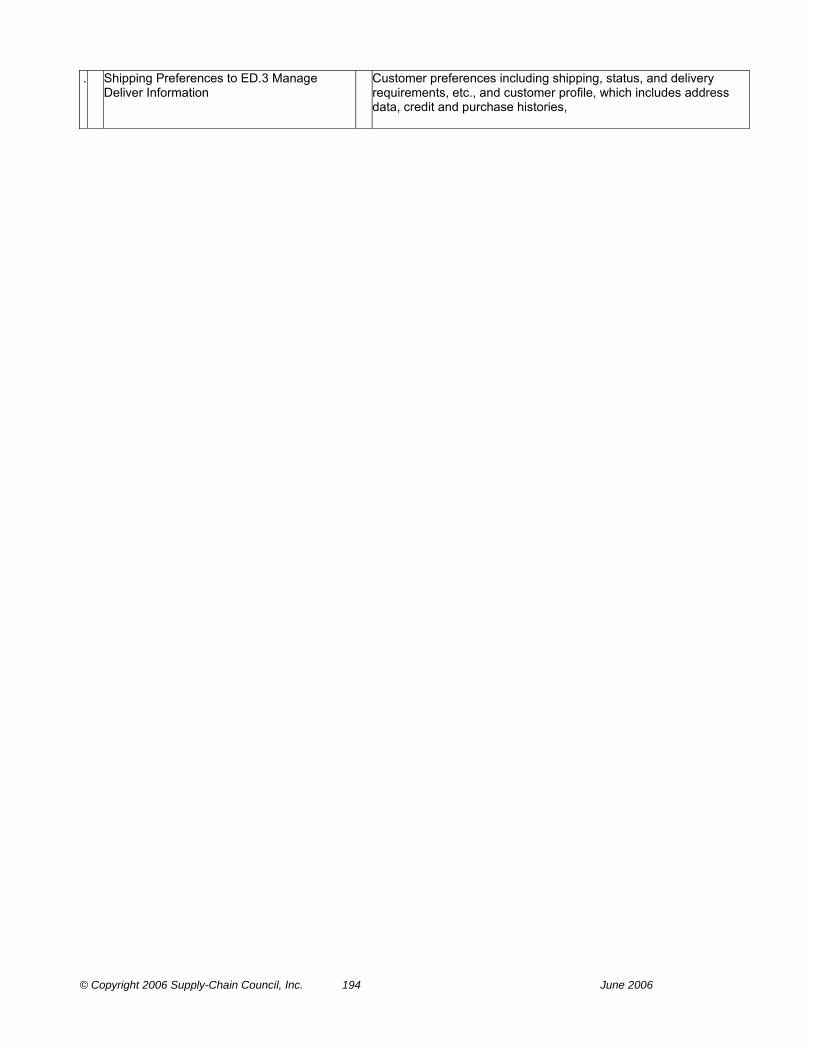
© Copyright 2006 Supply-Chain Council, Inc. 194 June 2006
. Shipping Preferences to ED.3 Manage Deliver Information
Customer preferences including shipping, status, and delivery requirements, etc., and customer profile, which includes address data, credit and purchase histories,
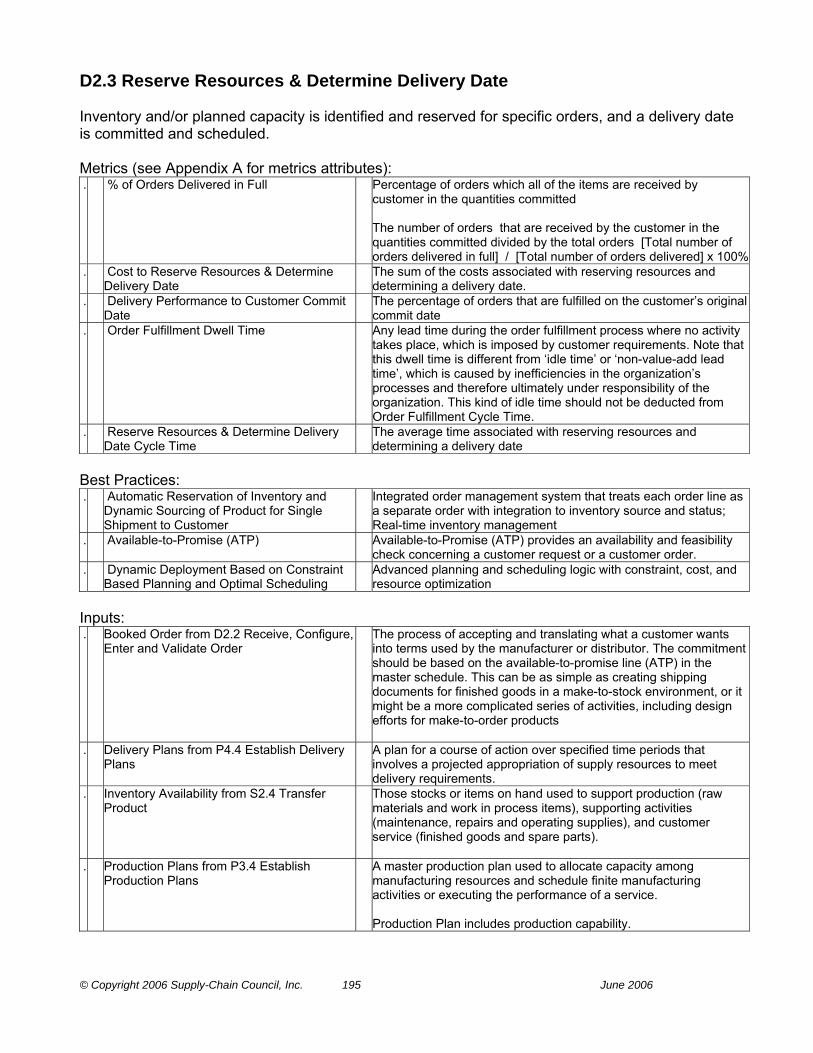
© Copyright 2006 Supply-Chain Council, Inc. 195 June 2006
D2.3 Reserve Resources & Determine Delivery Date Inventory and/or planned capacity is identified and reserved for specific orders, and a delivery date is committed and scheduled. Metrics (see Appendix A for metrics attributes): . % of Orders Delivered in Full Percentage of orders which all of the items are received by
customer in the quantities committed The number of orders that are received by the customer in the quantities committed divided by the total orders [Total number of orders delivered in full] / [Total number of orders delivered] x 100%
. Cost to Reserve Resources & Determine Delivery Date
The sum of the costs associated with reserving resources and determining a delivery date.
. Delivery Performance to Customer Commit Date
The percentage of orders that are fulfilled on the customer’s original commit date
. Order Fulfillment Dwell Time Any lead time during the order fulfillment process where no activity takes place, which is imposed by customer requirements. Note that this dwell time is different from ‘idle time’ or ‘non-value-add lead time’, which is caused by inefficiencies in the organization’s processes and therefore ultimately under responsibility of the organization. This kind of idle time should not be deducted from Order Fulfillment Cycle Time.
. Reserve Resources & Determine Delivery Date Cycle Time
The average time associated with reserving resources and determining a delivery date
Best Practices: . Automatic Reservation of Inventory and
Dynamic Sourcing of Product for Single Shipment to Customer
Integrated order management system that treats each order line as a separate order with integration to inventory source and status; Real-time inventory management
. Available-to-Promise (ATP) Available-to-Promise (ATP) provides an availability and feasibility check concerning a customer request or a customer order.
. Dynamic Deployment Based on Constraint Based Planning and Optimal Scheduling
Advanced planning and scheduling logic with constraint, cost, and resource optimization
Inputs: . Booked Order from D2.2 Receive, Configure,
Enter and Validate Order The process of accepting and translating what a customer wants
into terms used by the manufacturer or distributor. The commitment should be based on the available-to-promise line (ATP) in the master schedule. This can be as simple as creating shipping documents for finished goods in a make-to-stock environment, or it might be a more complicated series of activities, including design efforts for make-to-order products
. Delivery Plans from P4.4 Establish Delivery Plans
A plan for a course of action over specified time periods that involves a projected appropriation of supply resources to meet delivery requirements.
. Inventory Availability from S2.4 Transfer Product
Those stocks or items on hand used to support production (raw materials and work in process items), supporting activities (maintenance, repairs and operating supplies), and customer service (finished goods and spare parts).
. Production Plans from P3.4 Establish Production Plans
A master production plan used to allocate capacity among manufacturing resources and schedule finite manufacturing activities or executing the performance of a service. Production Plan includes production capability.

© Copyright 2006 Supply-Chain Council, Inc. 196 June 2006
. Production Schedule from M2.1 Schedule Production Activities
A plan that authorizes the factory to manufacture or repair a certain quantity of a specific item.
. Sourcing Plans from P2.4 Establish Sourcing Plans
An aggregate material requirements plan used to schedule material deliveries to meet production plan.
Outputs: . Available to Promise Date to Make The uncommitted portion of a company’s inventory and planned
production maintained in the master schedule to support customer-order promising. The ATP quantity is the uncommitted inventory balance in the first period and is normally calculated for each period in which an MPS receipt is scheduled. In the first period, ATP includes on-hand inventory less customer orders that are due and overdue
. Customer Order to ED.2 Assess Delivery Performance
An order from a customer for a particular product or a number of products. It is often referred to as an actual demand to distinguish it from a forecasted demand.
. Delivery Date to D2.4 Consolidate Orders Those stocks or items on hand used to support production (raw materials and work in process items), supporting activities (maintenance, repairs and operating supplies), and customer service (finished goods and spare parts). Determination of the time required from the receipt of the order until the item should be delivered.
. Inventory Availability/Delivery Date to P4.2 Identify, Assess, and Aggregate Delivery Resources and Capabilities
Those stocks or items on hand used to support production (raw materials and work in process items), supporting activities (maintenance, repairs and operating supplies), and customer service (finished goods and spare parts). Determination of the time required from the receipt of the order until the item should be delivered.
. Inventory Status to Deliver A periodic report showing the inventory on hand and usually showing the inventory on order and some sales or usage history for the products that are covered in the stock status report.
. Inventory Status to Plan A periodic report showing the inventory on hand and usually showing the inventory on order and some sales or usage history for the products that are covered in the stock status report.
. Inventory Status to Make A periodic report showing the inventory on hand and usually showing the inventory on order and some sales or usage history for the products that are covered in the stock status report.
. Inventory Status to Source A periodic report showing the inventory on hand and usually showing the inventory on order and some sales or usage history for the products that are covered in the stock status report.
. Order Backlog to P4.1 Identify, Prioritize, and Aggregate Delivery Requirements
Orders that have been received and entered into the order processing system and are in a queue waiting to be processed and shipped.
. Order Signal to P3.1 Identify, Prioritize, and Aggregate Production Requirements
Reserved inventory and/or planned capacity and delivery date for a specific order.
. Order Signal to P2.1 Identify, Prioritize, and Aggregate Product Requirements
Reserved inventory and/or planned capacity and delivery date for a specific order.
. Replenishment Signal to S2.1 Schedule Product Deliveries
Any signal that indicates when to produce or transport Items in a pull replenishment system.
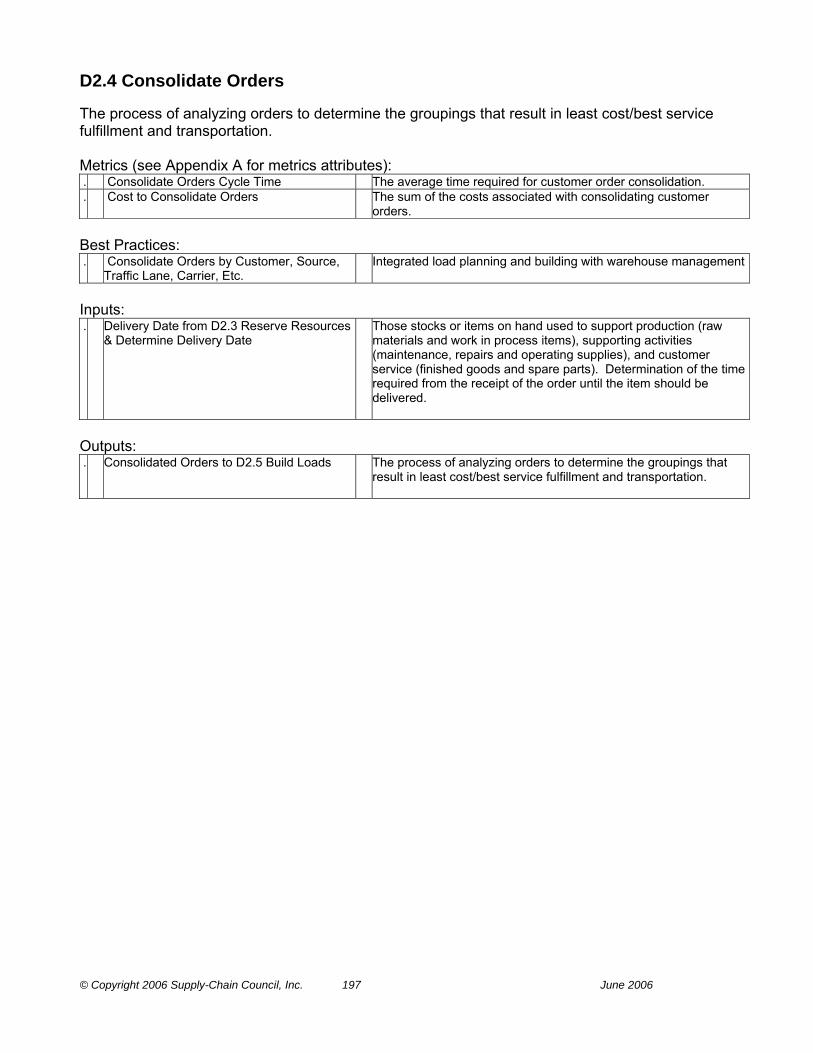
© Copyright 2006 Supply-Chain Council, Inc. 197 June 2006
D2.4 Consolidate Orders The process of analyzing orders to determine the groupings that result in least cost/best service fulfillment and transportation. Metrics (see Appendix A for metrics attributes): . Consolidate Orders Cycle Time The average time required for customer order consolidation. . Cost to Consolidate Orders The sum of the costs associated with consolidating customer
orders. Best Practices: . Consolidate Orders by Customer, Source,
Traffic Lane, Carrier, Etc. Integrated load planning and building with warehouse management
Inputs: . Delivery Date from D2.3 Reserve Resources
& Determine Delivery Date Those stocks or items on hand used to support production (raw
materials and work in process items), supporting activities (maintenance, repairs and operating supplies), and customer service (finished goods and spare parts). Determination of the time required from the receipt of the order until the item should be delivered.
Outputs: . Consolidated Orders to D2.5 Build Loads The process of analyzing orders to determine the groupings that
result in least cost/best service fulfillment and transportation.

© Copyright 2006 Supply-Chain Council, Inc. 198 June 2006
D2.5 Build Loads Transportation modes are selected and efficient loads are built. Metrics (see Appendix A for metrics attributes): . Build Loads Cycle Time The average time associated with building shipment loads. . Cost to Build Loads The sum of the costs associated with building transportation loads. Best Practices: . Build Load in Stop Sequence Integrated inbound/outbound transportation planning (i.e. 1st truck
destination loaded last, etc.). . Consolidation of Inbound and Outbound
Requirements Integrated inbound/outbound transportation planning
. CRP & VMI Loads Optimized for Utilization Integration with CRP/VMI vendor systems Inputs: . Consolidated Orders from D2.4 Consolidate
Orders The process of analyzing orders to determine the groupings that
result in least cost/best service fulfillment and transportation.
Outputs: . Load Information to D2.6 Route Shipments Information relative to a load that is built and shipped, i.e. customer,
items, destinations, weight, etc

© Copyright 2006 Supply-Chain Council, Inc. 199 June 2006
D2.6 Route Shipments Loads are consolidated and routed by mode, lane and location. Metrics (see Appendix A for metrics attributes): . Cost to Route Shipments The sum of the costs associated with routing shipments. . Route Shipments Cycle Time The average time associated with routing shipments Best Practices: . Carrier/Route Optimization Based on
Continuous Movement and Consolidation/Pooling
Route scheduling, carrier selection, and rating
. Consolidation of Carriers Transportation modeling and rate analysis . CRP/VMI Integrated Load Building; Routing & Scheduling with Advanced Ship
Notice (ASN) . Shipment Tracking and Tracing Satellite communications, GPS, RFID . Vendor Managed Inventory VMI is a concept for planning and control of inventory, in which the
supplier has access to the customer’s inventory data and is responsible for maintaining the inventory level required by the customer. Re-supply is performed by the vendor through regularly scheduled reviews of the on-site inventory. The on-site inventory is counted, damaged or outdated goods are removed, and the inventory is restocked to predefined levels.
Inputs: . Load Information from D2.5 Build Loads Information relative to a load that is built and shipped, i.e. customer,
items, destinations, weight, etc
. Rated Carrier Data from Source: Company Contract rates and tariffs from carriers by commodity, lane, mode, etc. for shipments.
. Routing Guide from Source: Company Information used to select modes, transportation lanes, available carriers, etc. Listing or routes, carriers & rates.
Outputs: . Scheduled Deliveries to Plan The required or agreed time or rate of delivery of goods or services
purchased for a future period.
. Shipment Routes to D2.7 Select Carriers & Rate Shipments
Routes for shipping by consolidating loads.
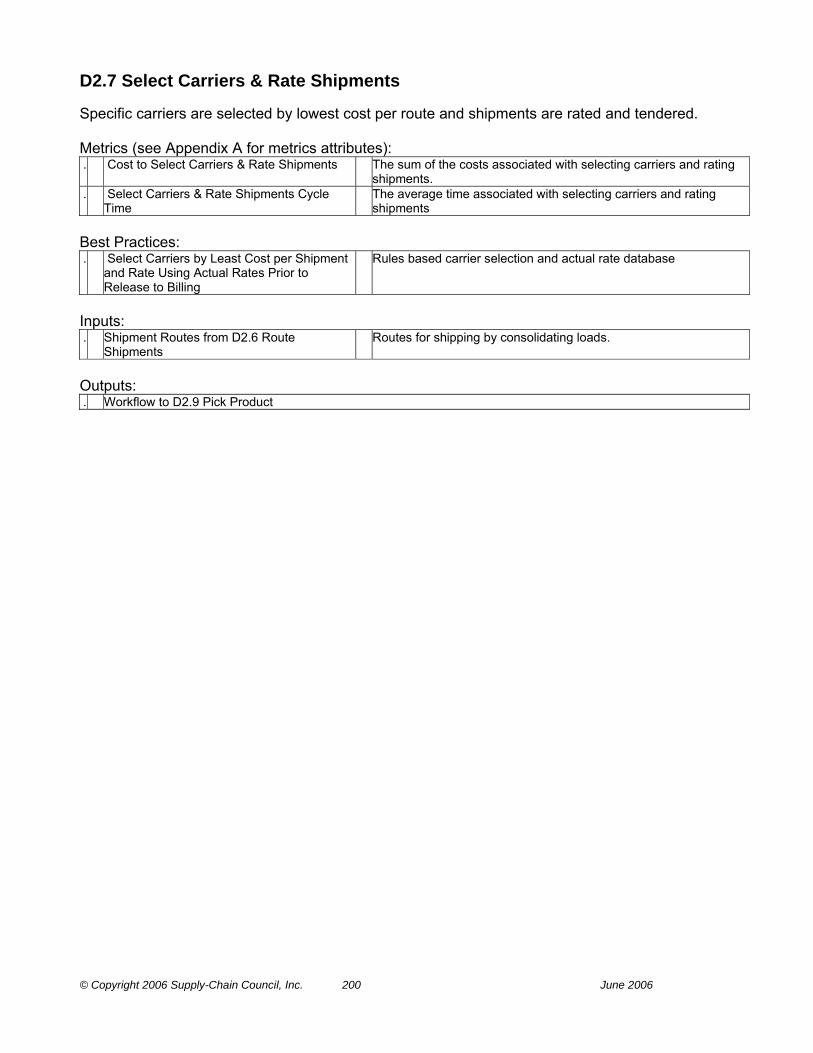
© Copyright 2006 Supply-Chain Council, Inc. 200 June 2006
D2.7 Select Carriers & Rate Shipments Specific carriers are selected by lowest cost per route and shipments are rated and tendered. Metrics (see Appendix A for metrics attributes): . Cost to Select Carriers & Rate Shipments The sum of the costs associated with selecting carriers and rating
shipments. . Select Carriers & Rate Shipments Cycle
Time The average time associated with selecting carriers and rating
shipments Best Practices: . Select Carriers by Least Cost per Shipment
and Rate Using Actual Rates Prior to Release to Billing
Rules based carrier selection and actual rate database
Inputs: . Shipment Routes from D2.6 Route
Shipments Routes for shipping by consolidating loads.
Outputs: . Workflow to D2.9 Pick Product

© Copyright 2006 Supply-Chain Council, Inc. 201 June 2006
D2.8 Receive Product from Source or Make The activities such as receiving product, verifying, recording product receipt, determining put-away location, putting away and recording location that a company performs at its own warehouses. May include quality inspection. Metrics (see Appendix A for metrics attributes): . Cost to Receive Product from Source or
Make The sum of the costs associated with transferring product from
source or make activities. . Receive Product from Source or Make Cycle
Time The average time associated with receiving a transfer of product to
deliver processes from source or make Best Practices: . Automatic Identification Bar Coding & Radio Frequency Communications . Cross-Docking Used in many distribution centers (DC) to increase inventory
velocity while maintaining shipping efficiency. In a traditional DC, the receiving process is disjointed from the shipping process and storage acts as an intermediary between the two processes. Cross docking actively links the receiving and shipping processes. In a DC, both cross docking (no storage) and traditional (with storage) operations might take place.
. Download P.O. & Advanced Ship Notices for Automated Receiving and Put Away
Integration with Procurement Systems & Electronic Commerce with Vendors
. Dynamic Location Assignment Including Lot Control, Zoned Picking, Quality Assurance
Real time inventory control, stock locator, and rules based picking logic
Outputs: . Workflow to D2.9 Pick Product

© Copyright 2006 Supply-Chain Council, Inc. 202 June 2006
D2.9 Pick Product The series of activities including retrieving orders to pick, verifying inventory availability, building the pick wave, picking the product, recording the pick and delivering product to packing area in response to an order. Metrics (see Appendix A for metrics attributes): . Cost to Pick Product The sum of the costs associated with picking product. . Pick Product Cycle Time The average time associated with product pick Best Practices: . Dynamic Location Assignment Including Lot
Control, Zoned Picking, Quality Assurance Real time inventory control, stock locator, and rules based picking
logic . Dynamic Simulation of Picking
Requirements Optimized for Labor, Cost, and Time
Rules based picking logic and simulation
. Use of Speed Racks for Automated Material Handling
None identified
Inputs: . Workflow from D2.7 Select Carriers & Rate Shipments . Workflow from D2.8 Receive Product from Source or Make . Finished Product Release from M2.6
Release Finished Product to Deliver The authorization to ship a finished product that has been ordered.
. Inventory Availability from S2.4 Transfer
Product Those stocks or items on hand used to support production (raw
materials and work in process items), supporting activities (maintenance, repairs and operating supplies), and customer service (finished goods and spare parts).
. Inventory Availability from M2.2 Issue Sourced/In-Process Product
Those stocks or items on hand used to support production (raw materials and work in process items), supporting activities (maintenance, repairs and operating supplies), and customer service (finished goods and spare parts).
. Production Schedule from M2.1 Schedule Production Activities
A plan that authorizes the factory to manufacture or repair a certain quantity of a specific item.
. WIP Location Rules from EM.6 Manage Transportation
The process and rules for establishing and maintaining in-process item inventory ownership and stocking locations.
Outputs: . Workflow to D2.10 Pack Product
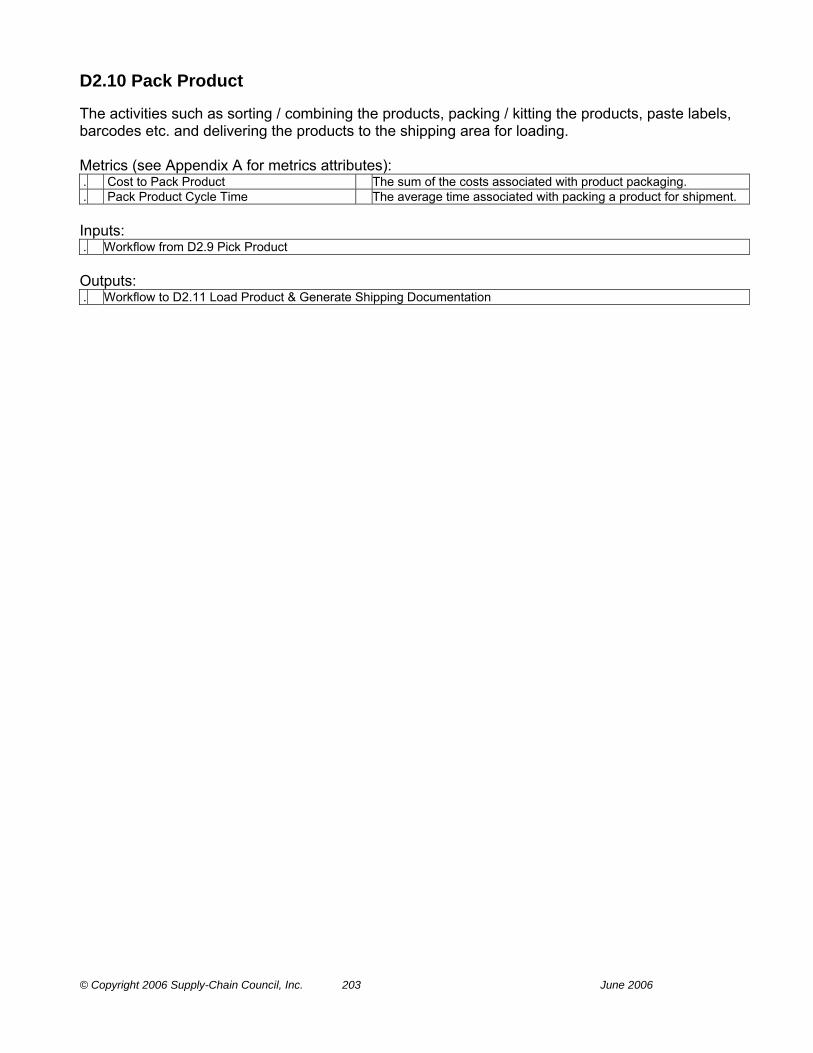
© Copyright 2006 Supply-Chain Council, Inc. 203 June 2006
D2.10 Pack Product The activities such as sorting / combining the products, packing / kitting the products, paste labels, barcodes etc. and delivering the products to the shipping area for loading. Metrics (see Appendix A for metrics attributes): . Cost to Pack Product The sum of the costs associated with product packaging. . Pack Product Cycle Time The average time associated with packing a product for shipment. Inputs: . Workflow from D2.9 Pick Product Outputs: . Workflow to D2.11 Load Product & Generate Shipping Documentation

© Copyright 2006 Supply-Chain Council, Inc. 204 June 2006
D2.11 Load Product & Generate Shipping Documentation The series of tasks including placing/loading product onto modes of transportation and generating the documentation necessary to meet internal, customer, carrier and government needs. Metrics (see Appendix A for metrics attributes): . Cost to Load Product & Generate Shipping
Documentation The sum of the costs associated with loading product & generating
shipping documentation. . Delivery Performance to Customer Commit
Date The percentage of orders that are fulfilled on the customer’s original
commit date . Documentation Accuracy Percentage of orders with on time and accurate documentation
supporting the order, including packing slips, bills of lading, invoices, etc. [Total number of orders delivered with correct and timely documentation] / [Total number of orders delivered] x 100%
. Load Product & Generate Shipping Documentation Cycle Time
The average time associated with product loading and the generation of shipping documentation
Best Practices: . Advanced Shipping Notices & UCC128
Container Labeling Bar coding; EDI; integrated transportation/warehouse management
. Carrier Agreement Carrier agreements are agreements between a company and its domestic and global carriers (for both, inbound raw materials and outbound finished goods) specifying service levels, payment terms, and other conditions.
. Cross-Docking Used in many distribution centers (DC) to increase inventory velocity while maintaining shipping efficiency. In a traditional DC, the receiving process is disjointed from the shipping process and storage acts as an intermediary between the two processes. Cross docking actively links the receiving and shipping processes. In a DC, both cross docking (no storage) and traditional (with storage) operations might take place.
. Electronic Generation and Download of Shipping Documents
None identified
. Full Visibility of Credit History by Shipping Personnel
None identified
. Integrated Credit Checking Interface to supplier’s shipping system to financials Inputs: . Workflow from D2.10 Pack Product . Shipping Export Parameters and
Documentation from ED.8 Manage Import/Export Requirements
Shipping and documentation requirements established by a government which must be met before allowing the shipping or delivery of a product across national boundaries.
. Shipping Parameters and Documentation from ED.6 Manage Transportation
Shipping parameters, such as weight, size, cube and route decide carrier and cost. Legal documentation of the contents of a shipment (e.g. way bill, bill of lading, export papers, etc.) are required.
Outputs: . Workflow to D2.12 Ship Product . Advanced Ship Notice to D2.13 Receive &
Verify Product by Customer An EDI notification of shipment of product.
. Delivered End Items to Customer Products that have been acknowledged as received by the
customer.
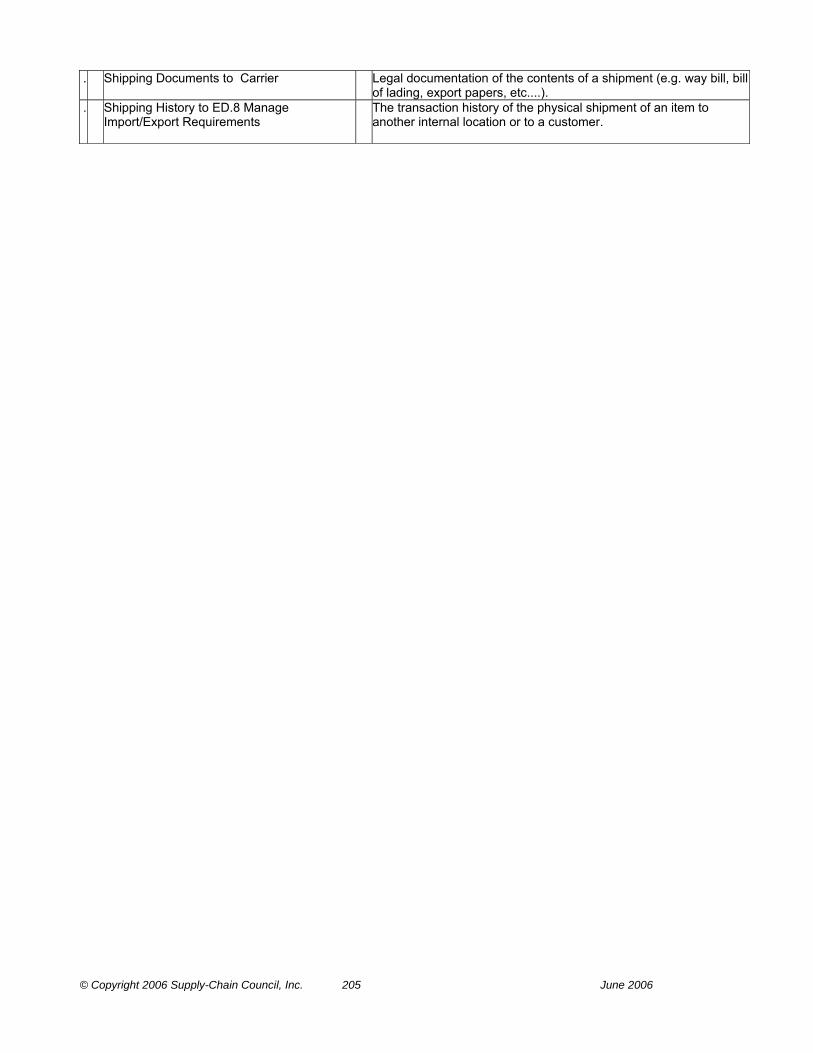
© Copyright 2006 Supply-Chain Council, Inc. 205 June 2006
. Shipping Documents to Carrier Legal documentation of the contents of a shipment (e.g. way bill, bill of lading, export papers, etc....).
. Shipping History to ED.8 Manage Import/Export Requirements
The transaction history of the physical shipment of an item to another internal location or to a customer.
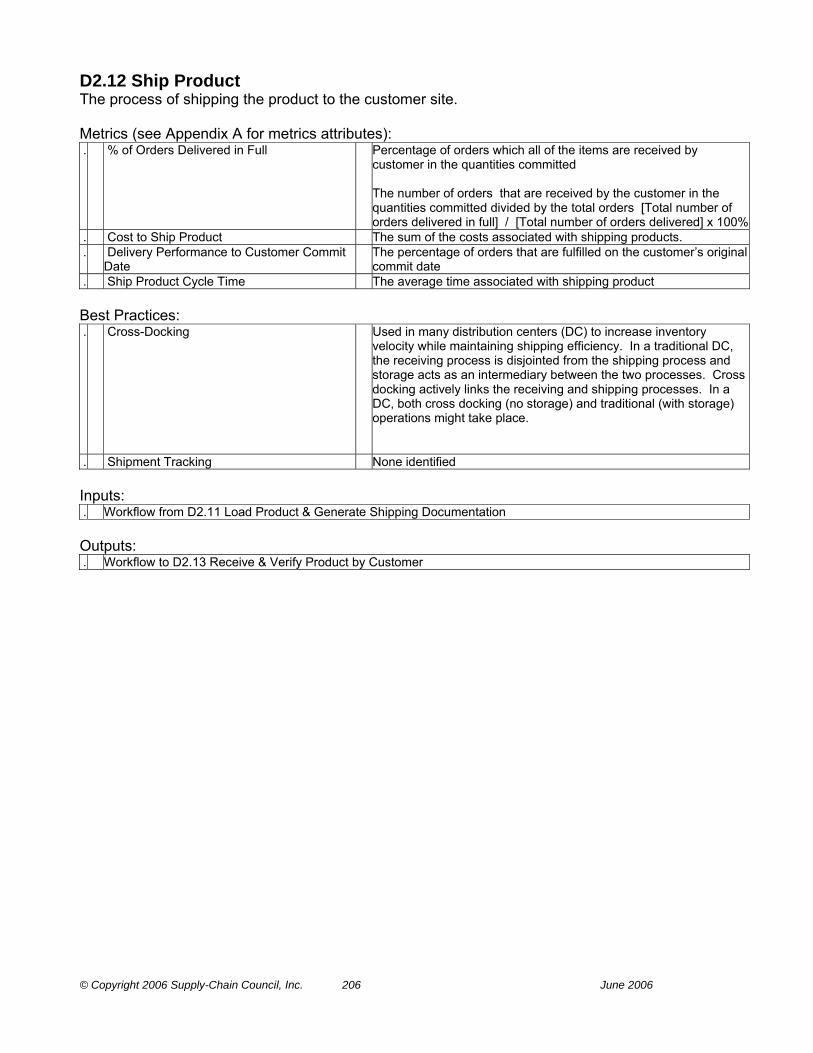
© Copyright 2006 Supply-Chain Council, Inc. 206 June 2006
D2.12 Ship Product The process of shipping the product to the customer site. Metrics (see Appendix A for metrics attributes): . % of Orders Delivered in Full Percentage of orders which all of the items are received by
customer in the quantities committed The number of orders that are received by the customer in the quantities committed divided by the total orders [Total number of orders delivered in full] / [Total number of orders delivered] x 100%
. Cost to Ship Product The sum of the costs associated with shipping products. . Delivery Performance to Customer Commit
Date The percentage of orders that are fulfilled on the customer’s original
commit date . Ship Product Cycle Time The average time associated with shipping product Best Practices: . Cross-Docking Used in many distribution centers (DC) to increase inventory
velocity while maintaining shipping efficiency. In a traditional DC, the receiving process is disjointed from the shipping process and storage acts as an intermediary between the two processes. Cross docking actively links the receiving and shipping processes. In a DC, both cross docking (no storage) and traditional (with storage) operations might take place.
. Shipment Tracking None identified Inputs: . Workflow from D2.11 Load Product & Generate Shipping Documentation Outputs: . Workflow to D2.13 Receive & Verify Product by Customer

© Copyright 2006 Supply-Chain Council, Inc. 207 June 2006
D2.13 Receive & Verify Product by Customer The process of receiving the shipment at the customer (either at customer site or at shipping area in case of self-collection) site and verifying that the order was shipped complete and that the product meets delivery terms. Metrics (see Appendix A for metrics attributes): . Cost to Receive & Verify Product by
Customer The sum of the costs associated with receipt and verification at
customer site. . Delivery Performance to Customer Commit
Date The percentage of orders that are fulfilled on the customer’s original
commit date . Perfect Condition Percentage of orders delivered in an undamaged state that meet
specification, have the correct configuration, are faultlessly installed (as applicable), and accepted by the customer [ Number of orders delivered in Perfect Condition ] / [Number of orders delivered ] x 100%
. Receive & Verify Product by Customer Cycle Time
The average time associated with receiving and verifying an order at the customer site
Best Practices: . Advanced Shipping Notices & UCC128
Container Labeling Bar coding; EDI; integrated transportation/warehouse management
. Shipment Tracking None identified Inputs: . Workflow from D2.12 Ship Product . Advanced Ship Notice from D2.11 Load
Product & Generate Shipping Documentation An EDI notification of shipment of product.
Outputs: . Product to D2.14 Install Product The end object of a transformation process that includes physical
objects, information or services.

© Copyright 2006 Supply-Chain Council, Inc. 208 June 2006
D2.14 Install Product When necessary, the process of preparing, testing and installing the product at the customer site. The product is fully functional upon completion. Metrics (see Appendix A for metrics attributes): . % of Faultless Installations Number of Faultless Installations divided by Total Number of Units
Installed. . Cost to Install Product The sum of the costs associated with product installation. . Install Product Cycle Time The average time associated with product installation . Perfect Condition Percentage of orders delivered in an undamaged state that meet
specification, have the correct configuration, are faultlessly installed (as applicable), and accepted by the customer [ Number of orders delivered in Perfect Condition ] / [Number of orders delivered ] x 100%
Best Practices: . Joint Service Agreements to Document
Acceptable Service Levels in Terms of Installation Costs, Installation Cycle Time, Etc.
Collaborative planning tools with the Source suppliers (This would be effective between customer and supplier, and between internal functions such as Field Service, Manufacturing, Marketing and Order Management)
Inputs: . Product from D2.13 Receive & Verify Product
by Customer The end object of a transformation process that includes physical
objects, information or services.
Outputs: . Installed Product to D2.15 Invoice The process of preparing, testing and installing the product at the
customer site. The standalone product is fully functional upon completion, but there may be requirement for subsequent integration.
. Installed Product to Customer The process of preparing, testing and installing the product at the customer site. The standalone product is fully functional upon completion, but there may be requirement for subsequent integration.
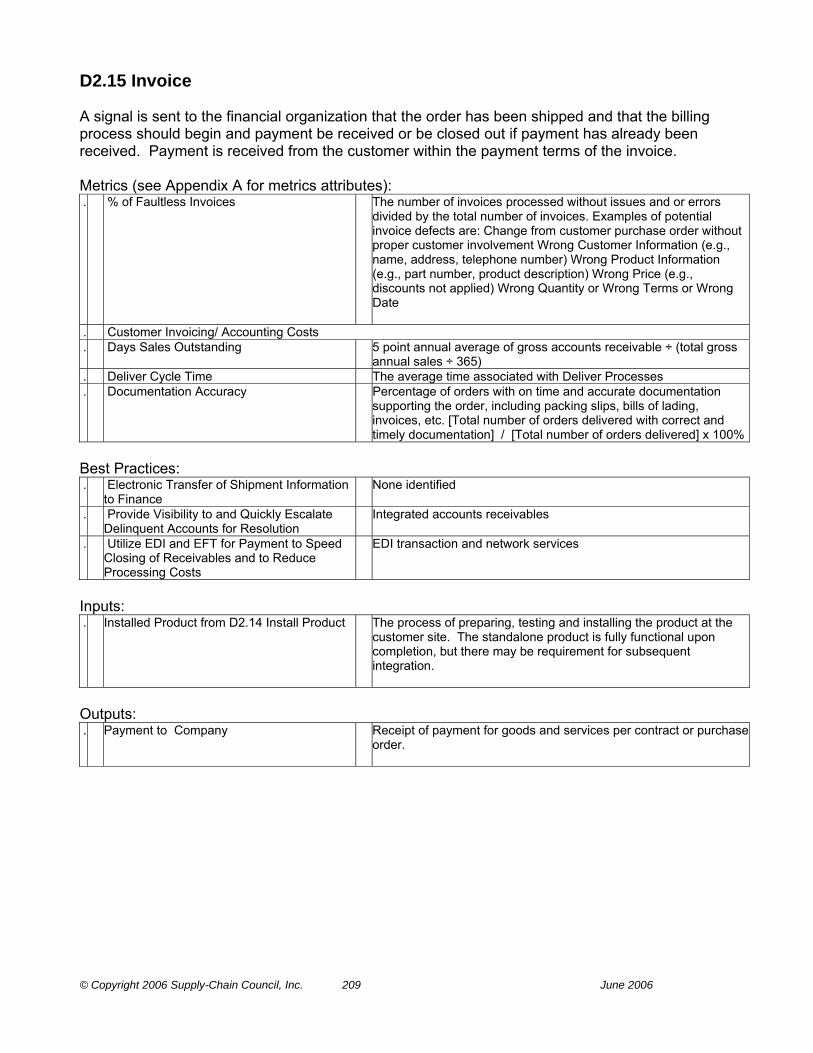
© Copyright 2006 Supply-Chain Council, Inc. 209 June 2006
D2.15 Invoice A signal is sent to the financial organization that the order has been shipped and that the billing process should begin and payment be received or be closed out if payment has already been received. Payment is received from the customer within the payment terms of the invoice. Metrics (see Appendix A for metrics attributes): . % of Faultless Invoices The number of invoices processed without issues and or errors
divided by the total number of invoices. Examples of potential invoice defects are: Change from customer purchase order without proper customer involvement Wrong Customer Information (e.g., name, address, telephone number) Wrong Product Information (e.g., part number, product description) Wrong Price (e.g., discounts not applied) Wrong Quantity or Wrong Terms or Wrong Date
. Customer Invoicing/ Accounting Costs . Days Sales Outstanding 5 point annual average of gross accounts receivable ÷ (total gross
annual sales ÷ 365) . Deliver Cycle Time The average time associated with Deliver Processes . Documentation Accuracy Percentage of orders with on time and accurate documentation
supporting the order, including packing slips, bills of lading, invoices, etc. [Total number of orders delivered with correct and timely documentation] / [Total number of orders delivered] x 100%
Best Practices: . Electronic Transfer of Shipment Information
to Finance None identified
. Provide Visibility to and Quickly Escalate Delinquent Accounts for Resolution
Integrated accounts receivables
. Utilize EDI and EFT for Payment to Speed Closing of Receivables and to Reduce Processing Costs
EDI transaction and network services
Inputs: . Installed Product from D2.14 Install Product The process of preparing, testing and installing the product at the
customer site. The standalone product is fully functional upon completion, but there may be requirement for subsequent integration.
Outputs: . Payment to Company Receipt of payment for goods and services per contract or purchase
order.

© Copyright 2006 Supply-Chain Council, Inc. 210 June 2006
D3 Deliver Engineer-to-Order Product The process of delivering a product that is designed, manufactured, and assembled from a bill of materials that includes one or more custom parts. Design will begin only after the receipt and validation of a firm customer order. The Category D3 includes fifteen Level 3 Elements: . D3.1 Obtain and Respond to RFP/RFQ The process of receiving a request for proposal or request for
quote, evaluating the request (estimating the schedule, developing costs estimates, establishing price), and responding to the potential customer.
. D3.10 Pack Product The activities such as sorting / combining the products, packing / kitting the products, paste labels, barcodes etc. ande delivering the products to the shipping area for loading.
. D3.11 Load Product & Generate Ship Documents
The series of tasks including placing product onto vehicles, generating the documentation necessary to meet internal, customer, carrier and government needs.
. D3.12 Ship Product The process of shipping the product to the customer site . D3.13 Receive & Verify Product by Customer The process of receiving the shipment (either at customer site or at
shipping area in case of self-collection) and verifying that the order was shipped complete and that the product meets delivery terms.
. D3.14 Install Product When necessary, the process of preparing, testing and installing the product at the customer site. The product is fully functional upon completion.
. D3.15 Invoice A signal is sent to the financial organization that the order has been shipped and that the billing process should begin and payment be received or be closed out if payment has already been received. Payment is received from the customer within the payment terms of the invoice.
. D3.2 Negotiate & Receive Contract The process of negotiating order details with customer (e.g., price, schedule, product performance) and finalizing the contract. Optionally accept payment.
. D3.3 Enter Order, Commit Resources & Launch Program
The process of entering/finalizing the customers order, approving the planned resources (e.g., engineering, manufacturing, etc.) and officially launching the program.
. D3.4 Schedule Installation The process of evaluating the design and build schedules relative to customer requested installation date to determine installation schedule.
. D3.5 Build Loads Transportation loads are selected and efficient loads are built. . D3.6 Route Shipments The process of consolidating and routing shipments by mode, lane,
and location. . D3.7 Select Carriers and Rate Shipments Specific carriers are selected by lowest cost per route and
shipments are rated and tendered. . D3.8 Receive Product from Source or Make The activities such as receiving product, verifying, recording product
receipt, determining put-away location, putting away and recording location that a company performs at its own warehouses. May include quality inspection.
. D3.9 Pick Product The series of activities including retrieving orders to pick, verifying inventory availability, building the pick wave, picking the product, recording the pick and delivering product to packing area in response to an order.

© Copyright 2006 Supply-Chain Council, Inc. 211 June 2006
Metrics (see Appendix A for metrics attributes): . Cash-To-Cash Cycle Time [Inventory Days of Supply + Days Sales Outstanding - Days
Payable Outstanding] The time it takes for an investment made to flow back into a company after it has been spent for raw materials. For services, this represents the time from the point where a company pays for the resources consumed in the performance of a service to the time that the company received payment from the customer for those services.
Cost to Deliver The sum of the costs associated with deliver . Deliver Cycle Time The average time associated with Deliver Processes . Downside Deliver Adaptability The reduction in delivered quantities sustainable at 30 days prior to
delivery with no inventory or cost penalties. . Finished Goods Inventory Days of Supply Plant finished goods inventory days of supply are calculated as
gross plant finished goods inventory ÷ (value of transfers/365 days). . Order Fulfillment Cycle Time The average actual cycle time consistently achieved to fulfill
customer orders. . Order Management Costs The aggregation of the following cost elements (contained in this
glossary): . Perfect Order Fulfillment The percentage of orders meeting delivery performance with
complete and accurate documentation and no delivery damage. Components include all items and quantities on-time using the customer’s definition of on-time, and documentation - packing slips, bills of lading, invoices, etc.
. Return on Supply Chain Fixed Assets Return on Supply Chain Fixed Assets measures the return an organization receives on its invested capital in supply chain fixed assets. This includes the fixed assets used in Plan, Source, Make, Deliver, and Return. The levels of aggregation can be at any element associated with a supply chain asset.
. Return on Working Capital Return on working capital is a measurement which assesses the magnitude of investment relative to a company’s working capital position verses the revenue generated from a supply chain. Components include accounts receivable, accounts payable, inventory, supply chain revenue, cost of goods sold and supply chain management costs.
. Upside Deliver Adaptability The maximum sustainable percentage increase in quantities delivered that can be achieved in 30 days with the assumption of unconstrained finished good availability.
. Upside Deliver Flexibility The number of days required to achieve an unplanned sustainable 20% increase in quantity delivered with the assumption of no other constraints.

© Copyright 2006 Supply-Chain Council, Inc. 212 June 2006
D3.1 Obtain and Respond to RFP/RFQ The process of receiving a request for proposal or request for quote, evaluating the request (estimating the schedule, developing costs estimates, establishing price), and responding to the potential customer. Metrics (see Appendix A for metrics attributes): . Cost to Obtain & Respond to Request for
Quote (RFQ) / Request for Proposal (RFP) The sum of the costs associated with obtaining and responding to
Request for Quote (RFQ) / Request for Proposal (RFP). . Obtain & Respond to Request for Quote
(RFQ) / Request for Proposal (RFP) Cycle Time
The average time associated with obtaining and responding to RFQs/RFPs
Best Practices: . Partnership with Outside Design Firms to
Provide Skills and Capacity, as Needed None identified
. Use of CAD/CAE Applications to Simulate Design, Cost and Manufacturing Process
None identified
Inputs: . RFQ/RFP from Source: Customer Request for Quote - A document used to solicit vendor responses
when a product has been selected and price quotations are needed from several vendors. Request for Proposal - A document used to solicit vendor responses when the functional requirements and features are known but no specific product is in mind.
Outputs: . Completed Proposal to Customer A document submitted in response to the a request for proposal
from a customer with all the terms and conditions of sale of a product or service
. Completed Proposal to D3.2 Negotiate & Receive Contract
A document submitted in response to the a request for proposal from a customer with all the terms and conditions of sale of a product or service
. Contract Status to ED.3 Manage Deliver Information
Customer profile, which include address data, credit and purchase histories, customer preferences including shipping, status, and delivery requirements, etc.
. Credit History to ED.3 Manage Deliver Information
Report that portrays a potential customer’s payment history and debt, indicating the ability to pay in a timely manner in the future.
. Customer Address Data to ED.3 Manage Deliver Information
Customer profile, which include address data, credit and purchase histories, customer preferences including shipping, status, and delivery requirements, etc.
. Purchase History to ED.3 Manage Deliver Information
The amount of purchased products for a certain time in history per specific intervals
. Shipping Preferences to ED.3 Manage Deliver Information
Customer preferences including shipping, status, and delivery requirements, etc., and customer profile, which includes address data, credit and purchase histories,

© Copyright 2006 Supply-Chain Council, Inc. 213 June 2006
D3.2 Negotiate & Receive Contract The process of negotiating order details with customer (e.g., price, schedule, product performance) and finalizing the contract. Optionally accept payment. Metrics (see Appendix A for metrics attributes): . Cost to Negotiate & Receive Contract The sum of the costs associated with negotiating and receiving
contracts . Negotiate & Receive Contract Cycle Time The average time associated with negotiating and receiving a
contract Inputs: . Completed Proposal from D3.1 Obtain and
Respond to RFP/RFQ A document submitted in response to the a request for proposal
from a customer with all the terms and conditions of sale of a product or service
. Order Rules from ED.1 Manage Deliver Business Rules
Rules for the function that encompasses receiving, entering, and promising orders from customers, distribution centers, and interplant operations.
Outputs: . Approved Contract to D3.3 Enter Order,
Commit Resources & Launch Program Acceptance of an agreement between two or more competent
persons or companies to perform or not to perform specific acts or services or to deliver merchandise. A contract may be oral or written.
. Customer Order to ED.2 Assess Delivery Performance
An order from a customer for a particular product or a number of products. It is often referred to as an actual demand to distinguish it from a forecasted demand.
. Customer Order Size, Weight, and Freight Class to ED.6 Manage Transportation
Coupled with cube and route, these criteria determine type of carrier and cost of shipment
. Location of Customers to ED.7 Manage Product Life Cycle
Customer profile, which includes address and location data, credit and purchase histories, customer preferences including shipping, status, and delivery requirements, etc.
. Optional Payment to Company Payment at the time of order, maybe partial or in full.

© Copyright 2006 Supply-Chain Council, Inc. 214 June 2006
D3.3 Enter Order, Commit Resources & Launch Program The process of entering/finalizing the customers order, approving the planned resources (e.g., engineering, manufacturing, etc.) and officially launching the program. Metrics (see Appendix A for metrics attributes): . % of Orders Delivered in Full Percentage of orders which all of the items are received by
customer in the quantities committed The number of orders that are received by the customer in the quantities committed divided by the total orders [Total number of orders delivered in full] / [Total number of orders delivered] x 100%
. Cost to Enter Order, Commit Resources & Launch Program
The sum of the costs associated with entering the order, committing resources & launching a program.
. Delivery Performance to Customer Commit Date
The percentage of orders that are fulfilled on the customer’s original commit date
. Enter Order, Commit Resources & Launch Program Cycle Time
The average time associated with entering an order, committing resources and program launch
. Order Fulfillment Dwell Time Any lead time during the order fulfillment process where no activity takes place, which is imposed by customer requirements. Note that this dwell time is different from ‘idle time’ or ‘non-value-add lead time’, which is caused by inefficiencies in the organization’s processes and therefore ultimately under responsibility of the organization. This kind of idle time should not be deducted from Order Fulfillment Cycle Time.
Inputs: . Approved Contract from D3.2 Negotiate &
Receive Contract Acceptance of an agreement between two or more competent
persons or companies to perform or not to perform specific acts or services or to deliver merchandise. A contract may be oral or written.
. Delivery Plans from P4.4 Establish Delivery Plans
A plan for a course of action over specified time periods that involves a projected appropriation of supply resources to meet delivery requirements.
. Production Plans from P3.4 Establish Production Plans
A master production plan used to allocate capacity among manufacturing resources and schedule finite manufacturing activities or executing the performance of a service. Production Plan includes production capability.
. Production Schedule from M3.2 Schedule Production Activities
A plan that authorizes the factory to manufacture or repair a certain quantity of a specific item.
. Sourcing Plans from P2.4 Establish Sourcing Plans
An aggregate material requirements plan used to schedule material deliveries to meet production plan.
Outputs: . Actual Sales History to P5.1 Assess, and
Aggregate Return Requirements Amount of past sales spanning any specified period of time (weeks,
months, years, etc.) and expressed in any specified increments (per day, week, month, year, etc.)
. Customer Order to D3.4 Schedule Installation
An order from a customer for a particular product or a number of products. It is often referred to as an actual demand to distinguish it from a forecasted demand.
. Order Backlog to P4.1 Identify, Prioritize, and Aggregate Delivery Requirements
Orders that have been received and entered into the order processing system and are in a queue waiting to be processed and shipped.

© Copyright 2006 Supply-Chain Council, Inc. 215 June 2006
. Order Information to M3.1 Finalize Production Engineering
The function encompasses receiving and entering all data necessary on orders, so the order can be finalized and entered into the order system.
. Order Signal to P2.1 Identify, Prioritize, and Aggregate Product Requirements
Reserved inventory and/or planned capacity and delivery date for a specific order.
. Order Signal to P3.1 Identify, Prioritize, and Aggregate Production Requirements
Reserved inventory and/or planned capacity and delivery date for a specific order.
. Replenishment Signal to S3.3 Schedule Product Deliveries
Any signal that indicates when to produce or transport Items in a pull replenishment system.
. Resource Availability to P4.2 Identify, Assess, and Aggregate Delivery Resources and Capabilities
The capability of a system or resource to produce a quantity of output in a particular time period, or the available resources at a point in time able to generate an output.
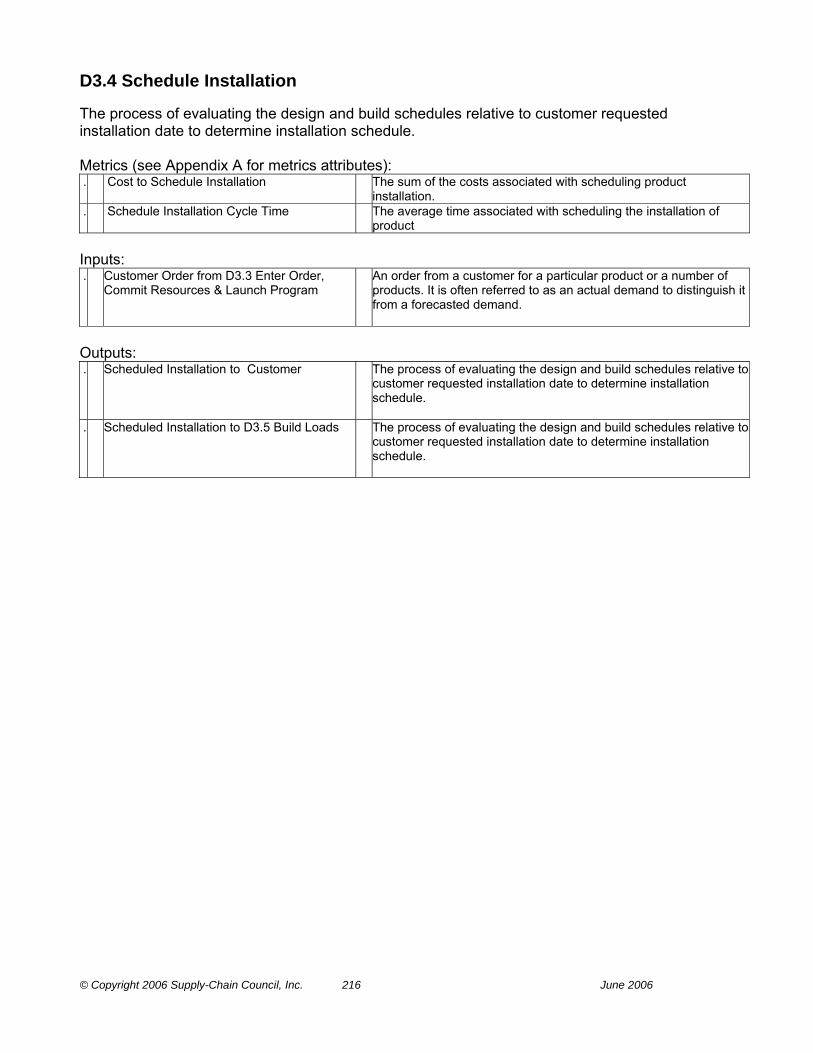
© Copyright 2006 Supply-Chain Council, Inc. 216 June 2006
D3.4 Schedule Installation The process of evaluating the design and build schedules relative to customer requested installation date to determine installation schedule. Metrics (see Appendix A for metrics attributes): . Cost to Schedule Installation The sum of the costs associated with scheduling product
installation. . Schedule Installation Cycle Time The average time associated with scheduling the installation of
product Inputs: . Customer Order from D3.3 Enter Order,
Commit Resources & Launch Program An order from a customer for a particular product or a number of
products. It is often referred to as an actual demand to distinguish it from a forecasted demand.
Outputs: . Scheduled Installation to Customer The process of evaluating the design and build schedules relative to
customer requested installation date to determine installation schedule.
. Scheduled Installation to D3.5 Build Loads The process of evaluating the design and build schedules relative to customer requested installation date to determine installation schedule.

© Copyright 2006 Supply-Chain Council, Inc. 217 June 2006
D3.5 Build Loads Transportation loads are selected and efficient loads are built. Metrics (see Appendix A for metrics attributes): . Build Loads Cycle Time The average time associated with building shipment loads. . Cost to Build Loads The sum of the costs associated with building transportation loads. Best Practices: . Build Load in Stop Sequence Integrated inbound/outbound transportation planning (i.e. 1st truck
destination loaded last, etc.). . Consolidation of Inbound and Outbound
Requirements Integrated inbound/outbound transportation planning
. CRP & VMI Loads Optimized for Utilization Integration with CRP/VMI vendor systems . Vendor Managed Inventory VMI is a concept for planning and control of inventory, in which the
supplier has access to the customer’s inventory data and is responsible for maintaining the inventory level required by the customer. Re-supply is performed by the vendor through regularly scheduled reviews of the on-site inventory. The on-site inventory is counted, damaged or outdated goods are removed, and the inventory is restocked to predefined levels.
Inputs: . Scheduled Installation from D3.4 Schedule
Installation The process of evaluating the design and build schedules relative to
customer requested installation date to determine installation schedule.
Outputs: . Load Information to D3.6 Route Shipments Information relative to a load that is built and shipped, i.e. customer,
items, destinations, weight, etc
. Scheduled Deliveries to Plan The required or agreed time or rate of delivery of goods or services purchased for a future period.
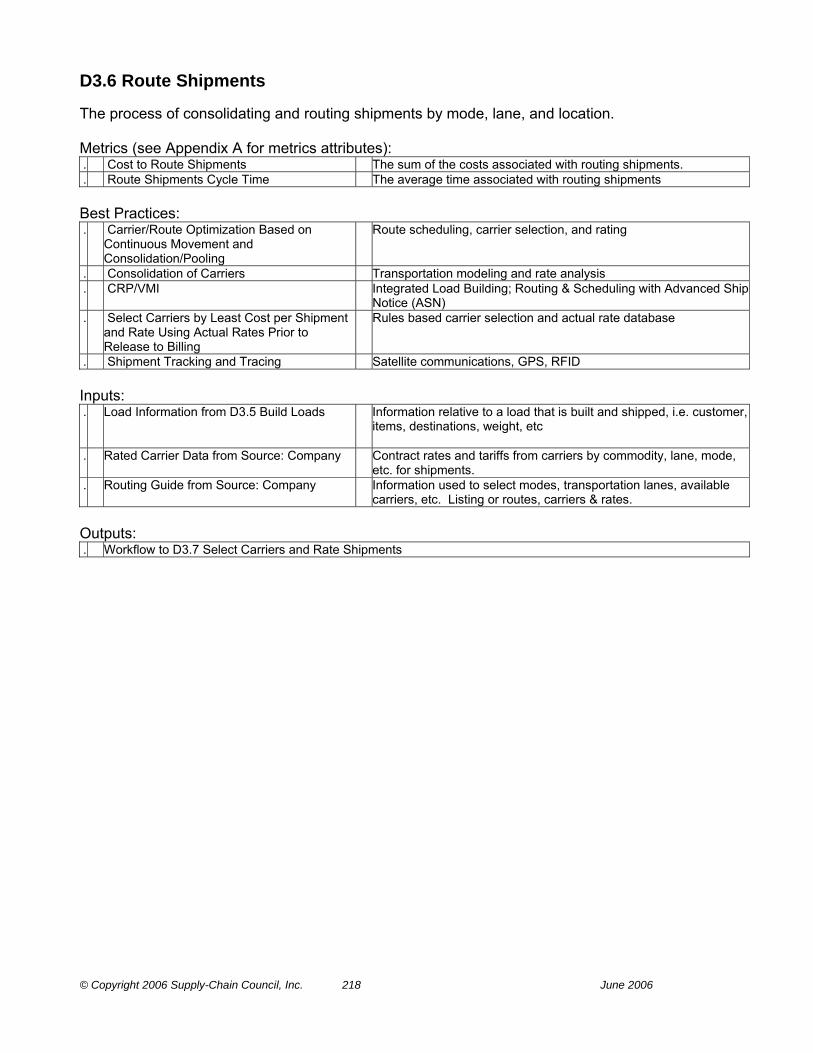
© Copyright 2006 Supply-Chain Council, Inc. 218 June 2006
D3.6 Route Shipments The process of consolidating and routing shipments by mode, lane, and location. Metrics (see Appendix A for metrics attributes): . Cost to Route Shipments The sum of the costs associated with routing shipments. . Route Shipments Cycle Time The average time associated with routing shipments Best Practices: . Carrier/Route Optimization Based on
Continuous Movement and Consolidation/Pooling
Route scheduling, carrier selection, and rating
. Consolidation of Carriers Transportation modeling and rate analysis . CRP/VMI Integrated Load Building; Routing & Scheduling with Advanced Ship
Notice (ASN) . Select Carriers by Least Cost per Shipment
and Rate Using Actual Rates Prior to Release to Billing
Rules based carrier selection and actual rate database
. Shipment Tracking and Tracing Satellite communications, GPS, RFID Inputs: . Load Information from D3.5 Build Loads Information relative to a load that is built and shipped, i.e. customer,
items, destinations, weight, etc
. Rated Carrier Data from Source: Company Contract rates and tariffs from carriers by commodity, lane, mode, etc. for shipments.
. Routing Guide from Source: Company Information used to select modes, transportation lanes, available carriers, etc. Listing or routes, carriers & rates.
Outputs: . Workflow to D3.7 Select Carriers and Rate Shipments

© Copyright 2006 Supply-Chain Council, Inc. 219 June 2006
D3.7 Select Carriers and Rate Shipments Specific carriers are selected by lowest cost per route and shipments are rated and tendered. Metrics (see Appendix A for metrics attributes): . Cost to Select Carriers & Rate Shipments The sum of the costs associated with selecting carriers and rating
shipments. . Select Carriers & Rate Shipments Cycle
Time The average time associated with selecting carriers and rating
shipments Best Practices: . Select Carriers by Least Cost per Shipment
and Rate Using Actual Rates Prior to Release to Billing
Rules based carrier selection and actual rate database
Inputs: . Workflow from D3.6 Route Shipments Outputs: . Workflow to D3.9 Pick Product

© Copyright 2006 Supply-Chain Council, Inc. 220 June 2006
D3.8 Receive Product from Source or Make The activities such as receiving product, verifying, recording product receipt, determining put-away location, putting away and recording location that a company performs at its own warehouses. May include quality inspection. Metrics (see Appendix A for metrics attributes): . Cost to Receive Product from Source or
Make The sum of the costs associated with transferring product from
source or make activities. . Receive Product from Source or Make Cycle
Time The average time associated with receiving a transfer of product to
deliver processes from source or make Best Practices: . Automatic Identification Bar Coding & Radio Frequency Communications . Cross-Docking Used in many distribution centers (DC) to increase inventory
velocity while maintaining shipping efficiency. In a traditional DC, the receiving process is disjointed from the shipping process and storage acts as an intermediary between the two processes. Cross docking actively links the receiving and shipping processes. In a DC, both cross docking (no storage) and traditional (with storage) operations might take place.
. Download P.O. & Advanced Ship Notices for Automated Receiving and Put Away
Integration with Procurement Systems & Electronic Commerce with Vendors
. Dynamic Location Assignment Including Lot Control, Zoned Put Away, Quality Assurance, ABC Frequency of Access
Real time inventory control, stock locator, and rules based put away logic
Outputs: . Workflow to D3.9 Pick Product

© Copyright 2006 Supply-Chain Council, Inc. 221 June 2006
D3.9 Pick Product The series of activities including retrieving orders to pick, verifying inventory availability, building the pick wave, picking the product, recording the pick and delivering product to packing area in response to an order. Metrics (see Appendix A for metrics attributes): . Cost to Pick Product The sum of the costs associated with picking product. . Pick Product Cycle Time The average time associated with product pick Best Practices: . Dynamic Location Assignment Including Lot
Control, Zoned Picking, Quality Assurance Real time inventory control, stock locator, and rules based picking
logic . Dynamic Simulation of Picking
Requirements Optimized for Labor, Cost, and Time
Rules based picking logic and simulation
Inputs: . Workflow from D3.7 Select Carriers and Rate Shipments . Workflow from D3.8 Receive Product from Source or Make . Finished Product Release from M3.7
Release Product to Deliver The authorization to ship a finished product that has been ordered.
. Inventory Availability from M3.3 Issue
Sourced/In-Process Product Those stocks or items on hand used to support production (raw
materials and work in process items), supporting activities (maintenance, repairs and operating supplies), and customer service (finished goods and spare parts).
. Inventory Availability from S3.6 Transfer Product
Those stocks or items on hand used to support production (raw materials and work in process items), supporting activities (maintenance, repairs and operating supplies), and customer service (finished goods and spare parts).
. Production Schedule from M3.2 Schedule Production Activities
A plan that authorizes the factory to manufacture or repair a certain quantity of a specific item.
Outputs: . Workflow to D3.10 Pack Product

© Copyright 2006 Supply-Chain Council, Inc. 222 June 2006
D3.10 Pack Product The activities such as sorting / combining the products, packing / kitting the products, paste labels, barcodes etc. ande delivering the products to the shipping area for loading. Metrics (see Appendix A for metrics attributes): . Cost to Pack Product The sum of the costs associated with product packaging. . Pack Product Cycle Time The average time associated with packing a product for shipment. Inputs: . Workflow from D3.9 Pick Product Outputs: . Workflow to D3.11 Load Product & Generate Ship Documents
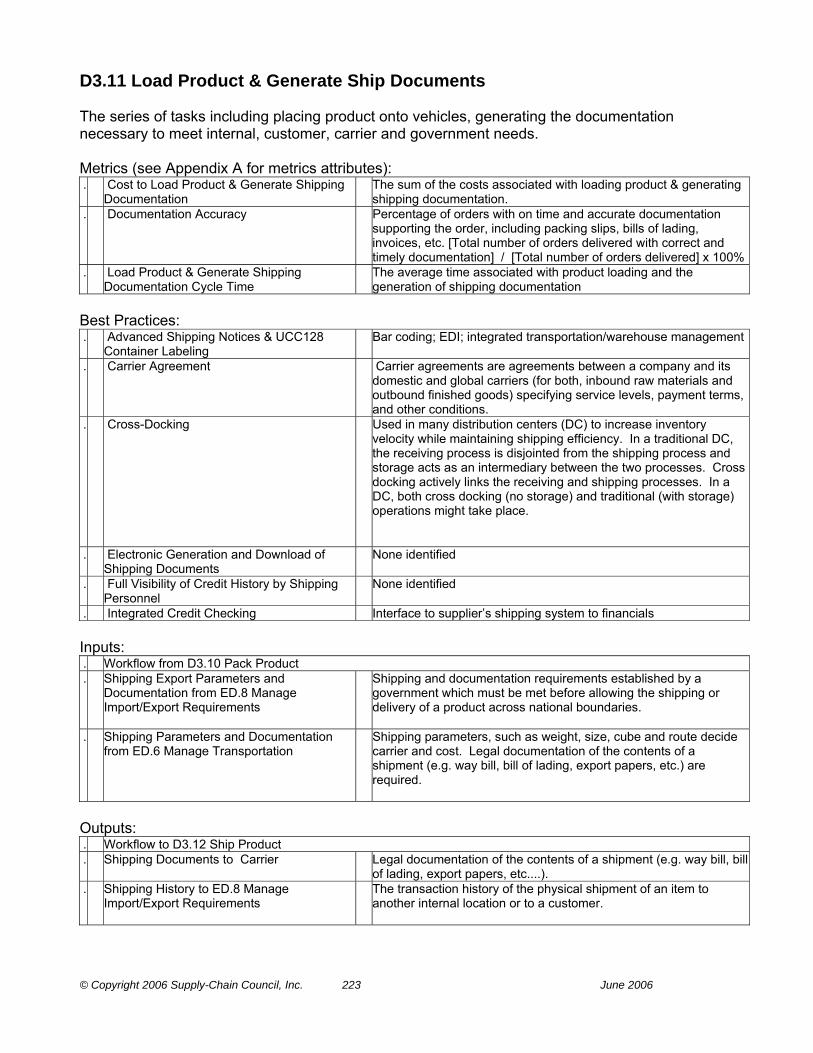
© Copyright 2006 Supply-Chain Council, Inc. 223 June 2006
D3.11 Load Product & Generate Ship Documents The series of tasks including placing product onto vehicles, generating the documentation necessary to meet internal, customer, carrier and government needs. Metrics (see Appendix A for metrics attributes): . Cost to Load Product & Generate Shipping
Documentation The sum of the costs associated with loading product & generating
shipping documentation. . Documentation Accuracy Percentage of orders with on time and accurate documentation
supporting the order, including packing slips, bills of lading, invoices, etc. [Total number of orders delivered with correct and timely documentation] / [Total number of orders delivered] x 100%
. Load Product & Generate Shipping Documentation Cycle Time
The average time associated with product loading and the generation of shipping documentation
Best Practices: . Advanced Shipping Notices & UCC128
Container Labeling Bar coding; EDI; integrated transportation/warehouse management
. Carrier Agreement Carrier agreements are agreements between a company and its domestic and global carriers (for both, inbound raw materials and outbound finished goods) specifying service levels, payment terms, and other conditions.
. Cross-Docking Used in many distribution centers (DC) to increase inventory velocity while maintaining shipping efficiency. In a traditional DC, the receiving process is disjointed from the shipping process and storage acts as an intermediary between the two processes. Cross docking actively links the receiving and shipping processes. In a DC, both cross docking (no storage) and traditional (with storage) operations might take place.
. Electronic Generation and Download of Shipping Documents
None identified
. Full Visibility of Credit History by Shipping Personnel
None identified
. Integrated Credit Checking Interface to supplier’s shipping system to financials Inputs: . Workflow from D3.10 Pack Product . Shipping Export Parameters and
Documentation from ED.8 Manage Import/Export Requirements
Shipping and documentation requirements established by a government which must be met before allowing the shipping or delivery of a product across national boundaries.
. Shipping Parameters and Documentation from ED.6 Manage Transportation
Shipping parameters, such as weight, size, cube and route decide carrier and cost. Legal documentation of the contents of a shipment (e.g. way bill, bill of lading, export papers, etc.) are required.
Outputs: . Workflow to D3.12 Ship Product . Shipping Documents to Carrier Legal documentation of the contents of a shipment (e.g. way bill, bill
of lading, export papers, etc....). . Shipping History to ED.8 Manage
Import/Export Requirements The transaction history of the physical shipment of an item to
another internal location or to a customer.
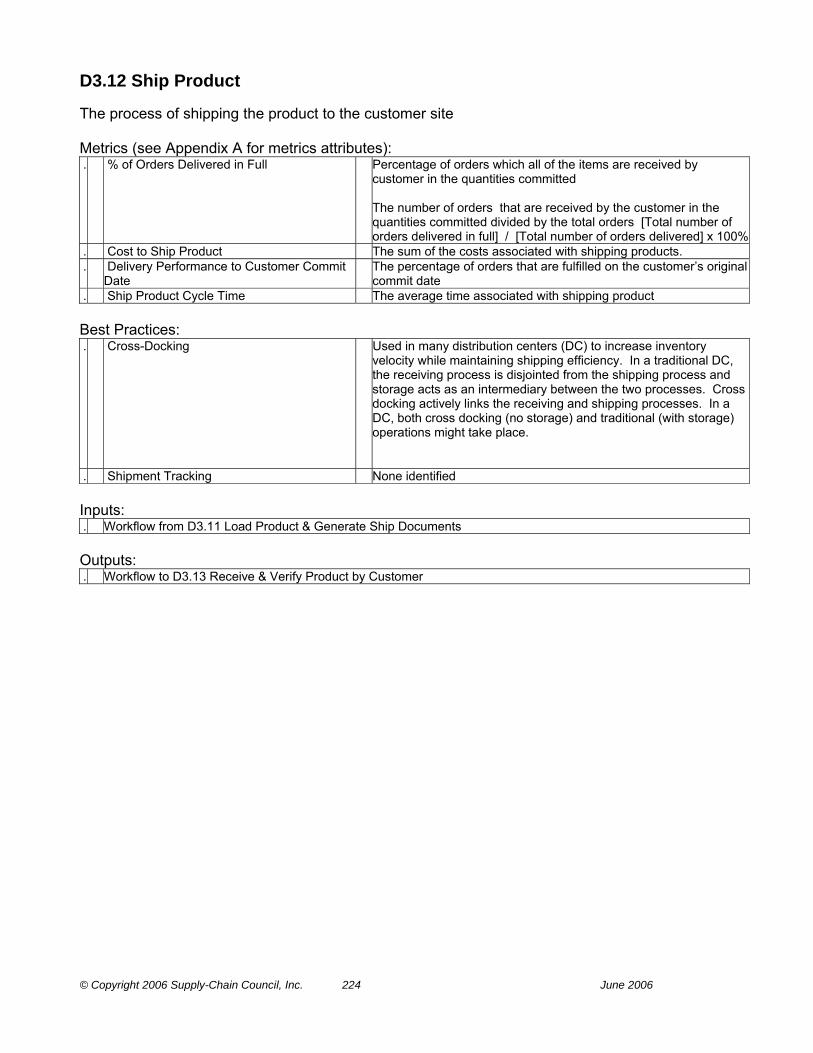
© Copyright 2006 Supply-Chain Council, Inc. 224 June 2006
D3.12 Ship Product The process of shipping the product to the customer site Metrics (see Appendix A for metrics attributes): . % of Orders Delivered in Full Percentage of orders which all of the items are received by
customer in the quantities committed The number of orders that are received by the customer in the quantities committed divided by the total orders [Total number of orders delivered in full] / [Total number of orders delivered] x 100%
. Cost to Ship Product The sum of the costs associated with shipping products. . Delivery Performance to Customer Commit
Date The percentage of orders that are fulfilled on the customer’s original
commit date . Ship Product Cycle Time The average time associated with shipping product Best Practices: . Cross-Docking Used in many distribution centers (DC) to increase inventory
velocity while maintaining shipping efficiency. In a traditional DC, the receiving process is disjointed from the shipping process and storage acts as an intermediary between the two processes. Cross docking actively links the receiving and shipping processes. In a DC, both cross docking (no storage) and traditional (with storage) operations might take place.
. Shipment Tracking None identified Inputs: . Workflow from D3.11 Load Product & Generate Ship Documents Outputs: . Workflow to D3.13 Receive & Verify Product by Customer
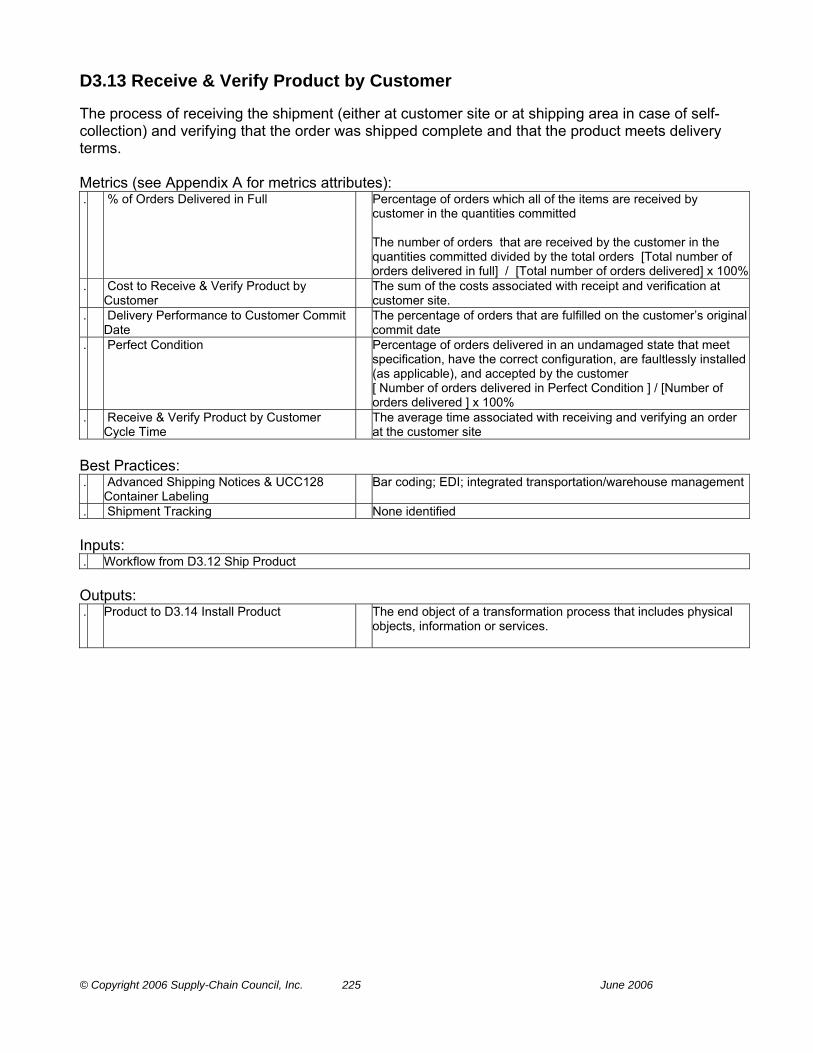
© Copyright 2006 Supply-Chain Council, Inc. 225 June 2006
D3.13 Receive & Verify Product by Customer The process of receiving the shipment (either at customer site or at shipping area in case of self-collection) and verifying that the order was shipped complete and that the product meets delivery terms. Metrics (see Appendix A for metrics attributes): . % of Orders Delivered in Full Percentage of orders which all of the items are received by
customer in the quantities committed The number of orders that are received by the customer in the quantities committed divided by the total orders [Total number of orders delivered in full] / [Total number of orders delivered] x 100%
. Cost to Receive & Verify Product by Customer
The sum of the costs associated with receipt and verification at customer site.
. Delivery Performance to Customer Commit Date
The percentage of orders that are fulfilled on the customer’s original commit date
. Perfect Condition Percentage of orders delivered in an undamaged state that meet specification, have the correct configuration, are faultlessly installed (as applicable), and accepted by the customer [ Number of orders delivered in Perfect Condition ] / [Number of orders delivered ] x 100%
. Receive & Verify Product by Customer Cycle Time
The average time associated with receiving and verifying an order at the customer site
Best Practices: . Advanced Shipping Notices & UCC128
Container Labeling Bar coding; EDI; integrated transportation/warehouse management
. Shipment Tracking None identified Inputs: . Workflow from D3.12 Ship Product Outputs: . Product to D3.14 Install Product The end object of a transformation process that includes physical
objects, information or services.
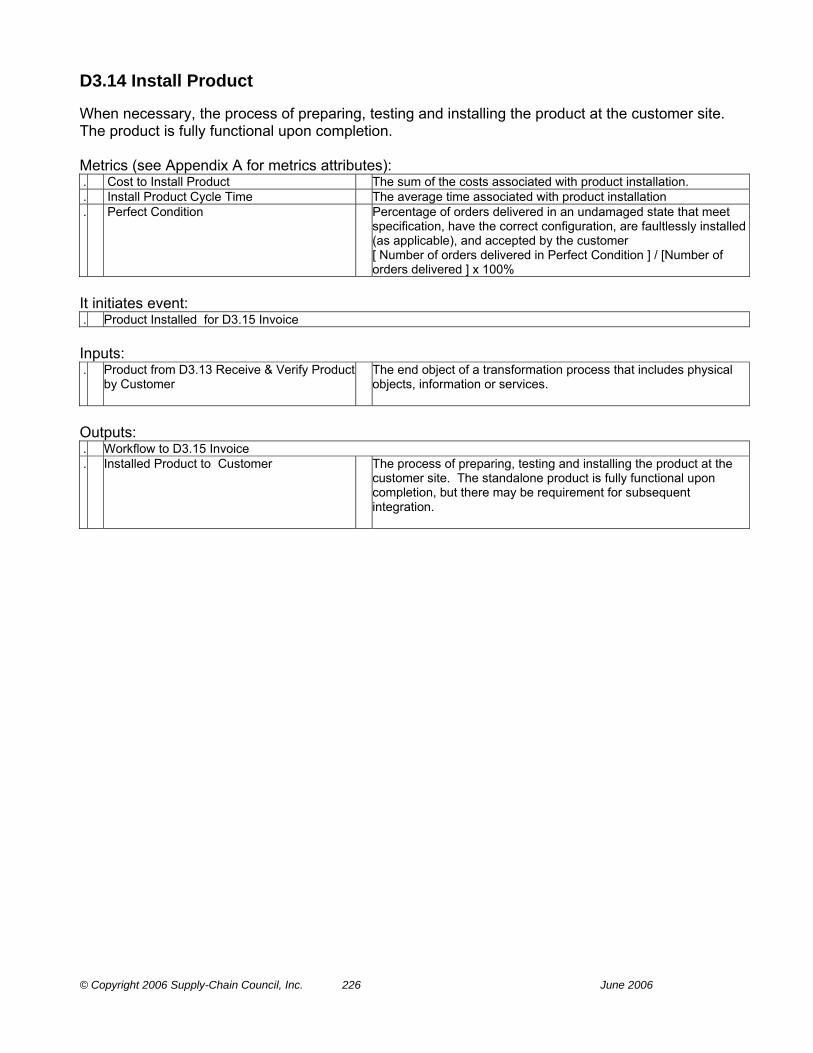
© Copyright 2006 Supply-Chain Council, Inc. 226 June 2006
D3.14 Install Product When necessary, the process of preparing, testing and installing the product at the customer site. The product is fully functional upon completion. Metrics (see Appendix A for metrics attributes): . Cost to Install Product The sum of the costs associated with product installation. . Install Product Cycle Time The average time associated with product installation . Perfect Condition Percentage of orders delivered in an undamaged state that meet
specification, have the correct configuration, are faultlessly installed (as applicable), and accepted by the customer [ Number of orders delivered in Perfect Condition ] / [Number of orders delivered ] x 100%
It initiates event: . Product Installed for D3.15 Invoice Inputs: . Product from D3.13 Receive & Verify Product
by Customer The end object of a transformation process that includes physical
objects, information or services.
Outputs: . Workflow to D3.15 Invoice . Installed Product to Customer The process of preparing, testing and installing the product at the
customer site. The standalone product is fully functional upon completion, but there may be requirement for subsequent integration.
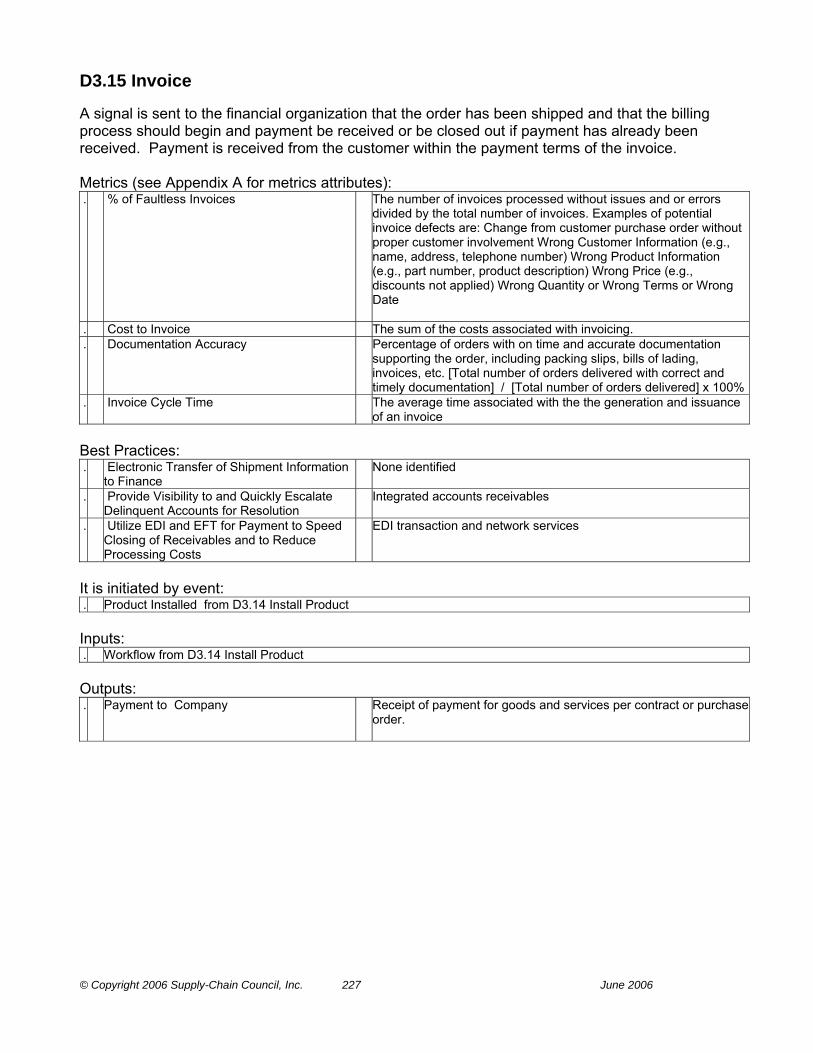
© Copyright 2006 Supply-Chain Council, Inc. 227 June 2006
D3.15 Invoice A signal is sent to the financial organization that the order has been shipped and that the billing process should begin and payment be received or be closed out if payment has already been received. Payment is received from the customer within the payment terms of the invoice. Metrics (see Appendix A for metrics attributes): . % of Faultless Invoices The number of invoices processed without issues and or errors
divided by the total number of invoices. Examples of potential invoice defects are: Change from customer purchase order without proper customer involvement Wrong Customer Information (e.g., name, address, telephone number) Wrong Product Information (e.g., part number, product description) Wrong Price (e.g., discounts not applied) Wrong Quantity or Wrong Terms or Wrong Date
. Cost to Invoice The sum of the costs associated with invoicing. . Documentation Accuracy Percentage of orders with on time and accurate documentation
supporting the order, including packing slips, bills of lading, invoices, etc. [Total number of orders delivered with correct and timely documentation] / [Total number of orders delivered] x 100%
. Invoice Cycle Time The average time associated with the the generation and issuance of an invoice
Best Practices: . Electronic Transfer of Shipment Information
to Finance None identified
. Provide Visibility to and Quickly Escalate Delinquent Accounts for Resolution
Integrated accounts receivables
. Utilize EDI and EFT for Payment to Speed Closing of Receivables and to Reduce Processing Costs
EDI transaction and network services
It is initiated by event: . Product Installed from D3.14 Install Product Inputs: . Workflow from D3.14 Install Product Outputs: . Payment to Company Receipt of payment for goods and services per contract or purchase
order.

© Copyright 2006 Supply-Chain Council, Inc. 228 June 2006
D4 Deliver Retail Product Deliver Retail Products are the processes used to acquire, merchandise, and sell finished goods at a retail store. A retail store is a physical location that sells products (and services) direct to the consumer using a point of sale process (manual or automated) to collect payment. Merchandising at a store level is the stocking and restocking of products in designated storage locations to generate sales in a retail store. The Category D4 includes seven Level 3 Elements: D4.1 Generate Stocking Schedule The process of scheduling resources to support item-stocking
requirements. D4.2 Receive Product at Store The activities such as receiving product, verifying, recording product
receipt, determining put-away location, putting away and recording location that a company performs at its own stores. May include quality inspection.
D4.3 Pick Product from Backroom The process of retrieving restocking orders to pick, determining inventory availability, building a pick wave, picking item and quantity from a designated backroom warehouse location, recording the resulting inventory transaction, and delivering the product to point of stock
D4.4 Stock Shelf For restocks, the tasks associated with identifying the item location, stocking the shelf according to merchandise plans, and recording the appropriate inventory transaction. For promotional items and stock repositioning the tasks associated with shelf and point of sale preparation, stock placement, and end of sale activities.
D4.5 Fill Shopping Cart Typical set of tasks associated with product selection, storage and movement through to checkout.
D4.6 Checkout The processes and tasks associated with product checkout including scanning, method of payment, credit application and approval, service agreement, order confirmation, and/or invoice or receipt.
D4.7 Deliver and/or Install The process of preparing and installing the product at the customer site. The product is fully functional upon completion.
Metrics (see Appendix A for metrics attributes): Cash-To-Cash Cycle Time [Inventory Days of Supply + Days Sales Outstanding - Days Payable
Outstanding] The time it takes for an investment made to flow back into a company after it has been spent for raw materials. For services, this represents the time from the point where a company pays for the resources consumed in the performance of a service to the time that the company received payment from the customer for those services.
Cost to Deliver The sum of the costs associated with deliver Deliver Cycle Time The average time associated with Deliver Processes Downside Deliver Adaptability The reduction in delivered quantities sustainable at 30 days prior to
delivery with no inventory or cost penalties. Order Fulfillment Cycle Time The average actual cycle time consistently achieved to fulfill customer
orders. Return on Supply Chain Fixed Assets Return on Supply Chain Fixed Assets measures the return an organization
receives on its invested capital in supply chain fixed assets. This includes the fixed assets used in Plan, Source, Make, Deliver, and Return. The levels of aggregation can be at any element associated with a supply chain asset.
Return on Working Capital Return on working capital is a measurement which assesses the magnitude of investment relative to a company’s working capital position verses the revenue generated from a supply chain. Components include accounts receivable, accounts payable, inventory, supply chain revenue, cost of goods sold and supply chain management costs.

© Copyright 2006 Supply-Chain Council, Inc. 229 June 2006
Upside Deliver Adaptability The maximum sustainable percentage increase in quantities delivered that can be achieved in 30 days with the assumption of unconstrained finished good availability.
Upside Deliver Flexibility The number of days required to achieve an unplanned sustainable 20% increase in quantity delivered with the assumption of no other constraints.

© Copyright 2006 Supply-Chain Council, Inc. 230 June 2006
D4.1 Generate Stocking Schedule The process of scheduling resources to support item-stocking requirements. Metrics (see Appendix A for metrics attributes): Cost to Generate Stocking Schedule The sum of the costs associated with generating a stocking schedule. Generate Stocking Schedule Cycle Time The average time associated with the generating a stocking schedule Best Practices: . Automated Pick List System generated pick-lists based on picking / batching rules. . Labor Scheduling that Matches Product
Flow Workforce management solution with flexible rules.
. Push Product on Trailer Arrival System prioritization of items coming off trucks vs. picked from back room.
It initiates event: . Item Stocking Resources Scheduled for D4.2 Receive Product at Store Inputs: . Daily Replenishment Requirements from
S1.4 Transfer Product Resources needed to meet Item stocking schedule requirement.
. On-demand Replenishment Requirements
from Source: Company Requirements for the triggering of material movement to a work
center only when that work center is ready to begin the next job.
. Resource Availability from Source: Company The capability of a system or resource to produce a quantity of output in a particular time period, or the available resources at a point in time able to generate an output.
. Shipping Schedules (internal or 3PL) from Source: Company
Scheduling of direct deliveries of material to a specified location on a plant floor near the operation where it is to be used.
. Stocking Requirements from P4.4 Establish Delivery Plans
The activities and techniques of determining the desired levels of items, whether raw materials, work in process, or finished products. Demand for inventory may be dependant or independent. Inventory functions are anticipation, hedge, cycle (lot size), fluctuation (safety, buffer or reserve), transportation (pipeline), and service parts.
. Store Allocation Instructions from P4.1 Identify, Prioritize, and Aggregate Delivery Requirements . Vendor/DC inventory availability from
Source: Company Vendor/DC inventory available to a customer to supply demands.
(Where the customer has access to the supplier’s inventory and the supplier has access to the customer’s requirements and inventory or vendor managed inventory).
Outputs: . Workflow to D4.2 Receive Product at Store . Stocking Schedule to D4.4 Stock Shelf A timetable for the planned movement of material from a bulk
storage area to an order pick storage area.

© Copyright 2006 Supply-Chain Council, Inc. 231 June 2006
D4.2 Receive Product at Store The activities such as receiving product, verifying, recording product receipt, determining put-away location, putting away and recording location that a company performs at its own stores. May include quality inspection. Metrics (see Appendix A for metrics attributes): . Cost to Receive Product at Store The sum of the costs associated with receiving product at the store. . Receive Product at Store Cycle Time The average time associated with receiving product at the customer
store Best Practices: . Automated Pick List System generated pick-lists based on picking / batching rules. . Labor Scheduling that Matches Product
Flow Workforce management solution with flexible rules.
. Push Product on Trailer Arrival System prioritization of items coming off trucks vs. picked from back room.
It is initiated by event: . Item Stocking Resources Scheduled from D4.1 Generate Stocking Schedule Inputs: . Workflow from D4.1 Generate Stocking Schedule . Finished Product Release from M1.6
Release Product to Deliver The authorization to ship a finished product that has been ordered.
. Inventory Availability from S1.4 Transfer
Product Those stocks or items on hand used to support production (raw
materials and work in process items), supporting activities (maintenance, repairs and operating supplies), and customer service (finished goods and spare parts).
. Item Stocking Requirements from P4.1 Identify, Prioritize, and Aggregate Delivery Requirements
The activities and techniques of determining the desired levels of items, whether raw materials, work in process, or finished products. Demand for inventory maybe dependant or independent. Inventory functions are anticipation, hedge, cycle (lot size), fluctuation (safety, buffer or reserve), transportation (pipeline), an service parts.
. Production Schedule from M1.1 Schedule Production Activities
A plan that authorizes the factory to manufacture or repair a certain quantity of a specific item.
. Scheduled Receipts from S1.1 Schedule Product Deliveries
Product due to arrive.
Outputs: . Inventory Availability to D4.3 Pick Product
from Backroom Those stocks or items on hand used to support production (raw
materials and work in process items), supporting activities (maintenance, repairs and operating supplies), and customer service (finished goods and spare parts).
. Item Pick Sheet for Stocking Schedule to D4.3 Pick Product from Backroom
A document that lists the material to be picked to meet the schedule for the planned movement of material from a bulk storage area to an order pick storage area.
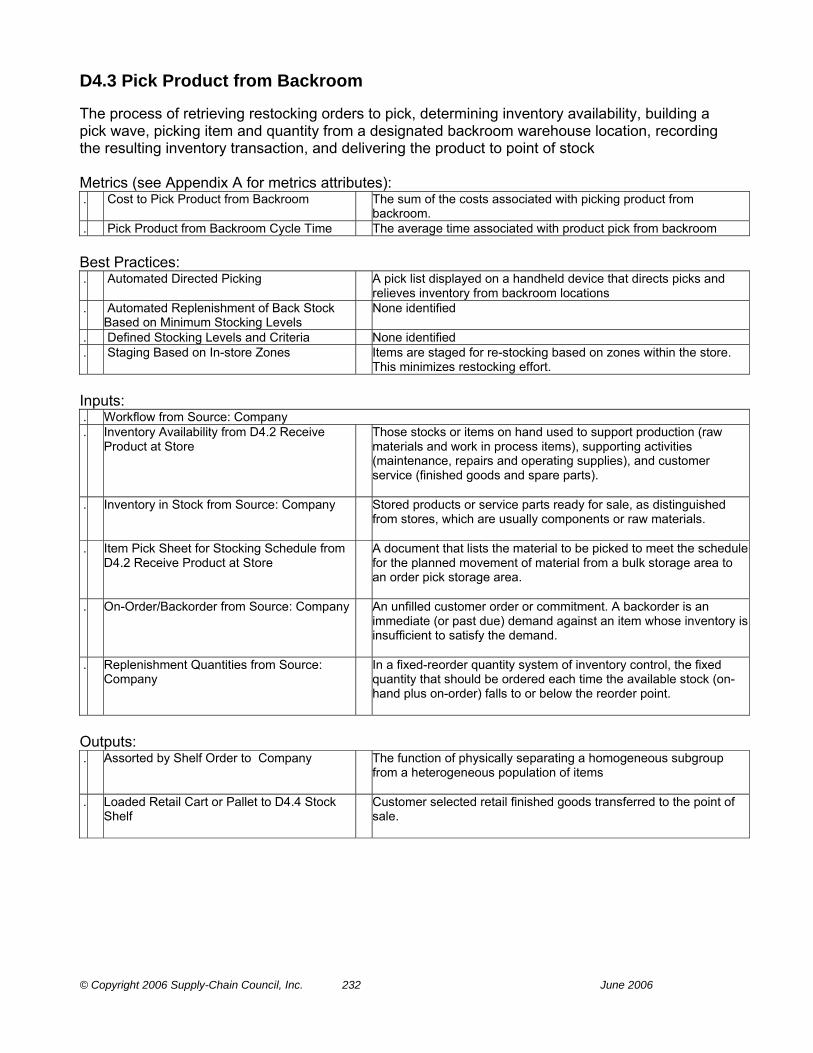
© Copyright 2006 Supply-Chain Council, Inc. 232 June 2006
D4.3 Pick Product from Backroom The process of retrieving restocking orders to pick, determining inventory availability, building a pick wave, picking item and quantity from a designated backroom warehouse location, recording the resulting inventory transaction, and delivering the product to point of stock Metrics (see Appendix A for metrics attributes): . Cost to Pick Product from Backroom The sum of the costs associated with picking product from
backroom. . Pick Product from Backroom Cycle Time The average time associated with product pick from backroom Best Practices: . Automated Directed Picking A pick list displayed on a handheld device that directs picks and
relieves inventory from backroom locations . Automated Replenishment of Back Stock
Based on Minimum Stocking Levels None identified
. Defined Stocking Levels and Criteria None identified . Staging Based on In-store Zones Items are staged for re-stocking based on zones within the store.
This minimizes restocking effort. Inputs: . Workflow from Source: Company . Inventory Availability from D4.2 Receive
Product at Store Those stocks or items on hand used to support production (raw
materials and work in process items), supporting activities (maintenance, repairs and operating supplies), and customer service (finished goods and spare parts).
. Inventory in Stock from Source: Company Stored products or service parts ready for sale, as distinguished from stores, which are usually components or raw materials.
. Item Pick Sheet for Stocking Schedule from D4.2 Receive Product at Store
A document that lists the material to be picked to meet the schedule for the planned movement of material from a bulk storage area to an order pick storage area.
. On-Order/Backorder from Source: Company An unfilled customer order or commitment. A backorder is an immediate (or past due) demand against an item whose inventory is insufficient to satisfy the demand.
. Replenishment Quantities from Source: Company
In a fixed-reorder quantity system of inventory control, the fixed quantity that should be ordered each time the available stock (on-hand plus on-order) falls to or below the reorder point.
Outputs: . Assorted by Shelf Order to Company The function of physically separating a homogeneous subgroup
from a heterogeneous population of items
. Loaded Retail Cart or Pallet to D4.4 Stock Shelf
Customer selected retail finished goods transferred to the point of sale.

© Copyright 2006 Supply-Chain Council, Inc. 233 June 2006
D4.4 Stock Shelf For restocks, the tasks associated with identifying the item location, stocking the shelf according to merchandise plans, and recording the appropriate inventory transaction. For promotional items and stock repositioning the tasks associated with shelf and point of sale preparation, stock placement, and end of sale activities. Metrics (see Appendix A for metrics attributes): . Cost to Stock Shelf The sum of the costs associated with stocking shelves. . In-Stock % Percentage of materials, components, or finished goods that are
there when needed. . Stock Shelf Cycle Time The average time associate with stocking shelves Best Practices: . Item/Shelf Scanning Upon Put-A-Way Scan store shelves / bar codes to confirm put-a-way. . Off Peak Stocking The majority of stocking is completed with minimal impact to or
visibility from the customer. . Proof of Performance (Promotion
Management) Scan store shelves / bar codes to confirm put-a-way. Scan using
handheld and match with ad. . Scan Displays for Promotion Conformance None identified . Stocking is Completed in Zones Each area of the store has its own stocking plan and items are
routed specifically to that area. Inputs: . Loaded Retail Cart or Pallet from D4.3 Pick
Product from Backroom Customer selected retail finished goods transferred to the point of
sale.
. Loaded Retail Cart or Pallet from S1.4 Transfer Product
Customer selected retail finished goods transferred to the point of sale.
. Plan-o-gram Data from Source: Company Data required to develop and build a Plan-O-Gram display to help minimize setup time by showing specific placement of all items, by product number, on the display.
. Stocking Schedule from D4.1 Generate Stocking Schedule
A timetable for the planned movement of material from a bulk storage area to an order pick storage area.
. Vendor Merchandising / Co-op advertising agreements from Source: Company
The plan for a promotional product offering and how it is communicated to the customer and includes public relations, advertising, sales promotions, and other tools to persuade customers to purchase the product offering.
Outputs: . Full Shelf Locations to D4.5 Fill Shopping
Cart Determination of the best retail locations for implementation of full
shelf equipment.
. Store Shelf Inventory Counts to P4.1 Identify, Prioritize, and Aggregate Delivery Requirements
The determination of inventory quantity by actual count. Physical inventories can be taken on a continuous, periodic or annual basis.

© Copyright 2006 Supply-Chain Council, Inc. 234 June 2006
D4.5 Fill Shopping Cart Typical set of tasks associated with product selection, storage and movement through to checkout. Metrics (see Appendix A for metrics attributes): . % Item Location Accuracy . Cost to Fill Shopping Cart The sum of the costs associated with filling a shopping cart. . Fill Shopping Cart Cycle Time The average time associated with “filling the shopping cart“ Best Practices: . Items Are Relieved from Inventory When
Item is Removed from Shelf RFID, smart cart or customer self-service reduces system inventory
upon item pick. . Loyalty Card Data Use for comparison to previous sales activity/track new consumers,
etc. . Measured and Compared with Same Activity
Previous Period DSS or portal tool that shows previous period performance and
comparison for store management (whether it is a year ago, period ago, etc.).
. Multiple Locations Throughout Store Planned and tracked via a plan-o-gram system; Location specific product labeling.
. Substitution Trained staff or automated systems (Internet) that recommend up-sell, cross-sell, and/or substitution See Up and cross selling
. Up and Cross Selling and/or Substitution Trained staff or automated systems (Internet) that recommend up-sell, cross-sell, and/or substitution.
Inputs: . Customer Data (preference) from Source:
Company Customer profile, which includes history, customer preferences,
status, and delivery requirements, etc.
. Full Shelf Locations from D4.4 Stock Shelf Determination of the best retail locations for implementation of full shelf equipment.
. Lost or Dropped Shopping Carts from Source: Company
On-line orders that are missing due to internet, software, or hardware malfunctions.
. Merchandising Plan (Supplier) from Source: Company
The merchandising plan includes the current market position, opportunity and issue analysis, merchandising objectives and strategies, action plans, programs, projects, budgets, and pro forma profit and loss statement and management controls.
. Product Data (linked/related SKU’s) from Source: Company
The properties and characteristics of a product (e.g. the part number and a text description of the product) and the relationships to other items in the product family and linked / related SKU’s.
. Promotional Plan from Source: Company The plan for a promotional product offering and how it is communicated to the customer and includes public relations, advertising, sales promotions, and other tools to persuade customers to purchase the product offering
Outputs: . Full Cart Ready for Checkout to D4.6
Checkout Customer selected goods transferred to the point of sale.

© Copyright 2006 Supply-Chain Council, Inc. 235 June 2006
D4.6 Checkout The processes and tasks associated with product checkout including scanning, method of payment, credit application and approval, service agreement, order confirmation, and/or invoice or receipt. Metrics (see Appendix A for metrics attributes): . Checkout Cycle Time The average time required for customer checkout. . Cost to Checkout The sum of the costs associated with product checkout. Best Practices: . Automatic Customer Payment RFID, smart cart or customer self-service charges goods to card
upon store departure. . Customer Profile Drive Recognition Upon
Checkout None identified
. Notification of Existing/Future Event or Promotions
None identified
It initiates event: . Checkout Completed for D4.7 Deliver and/or Install Inputs: . Customer Profile/Data from Source:
Company Customer profile, which includes history, customer preferences,
status, and delivery requirements, etc.
. Full Cart Ready for Checkout from D4.5 Fill Shopping Cart
Customer selected goods transferred to the point of sale.
. Promotion Event Calendar from Source: Company
Time phased promotion / event tasks where the product offering is communicated to the customer and includes public relations, advertising, sales promotions, and other tools to persuade customers to purchase the product offering during the year.
Outputs: . Workflow to D4.7 Deliver and/or Install . Customer Loyalty / Recurring Visits to
Company Input to customer profile, frequency of visits, recurring, time frame,
what purchased, numbers and rings. Measure of customer satisfaction with products and service.
. Full Cart (Empty Cart) to Company Completion of customer checkout, sale of the selected goods, cart transitions from full to empty.
. Loyalty Customer Profile Changes to Company
More units, higher average ring, etc.
. Point of Sale Data (Daily) to P4.1 Identify, Prioritize, and Aggregate Delivery Requirements
The relief of inventory and computation of sales data at the time and place of the sales, generally (may be manual) through the use of bar-coding, or magnetic media and equipment.
. Satisfied Customer to Company Customers who are satisfied with the product or service delivered by the suppliers, including the aspects such as time, quality, cost, etc.
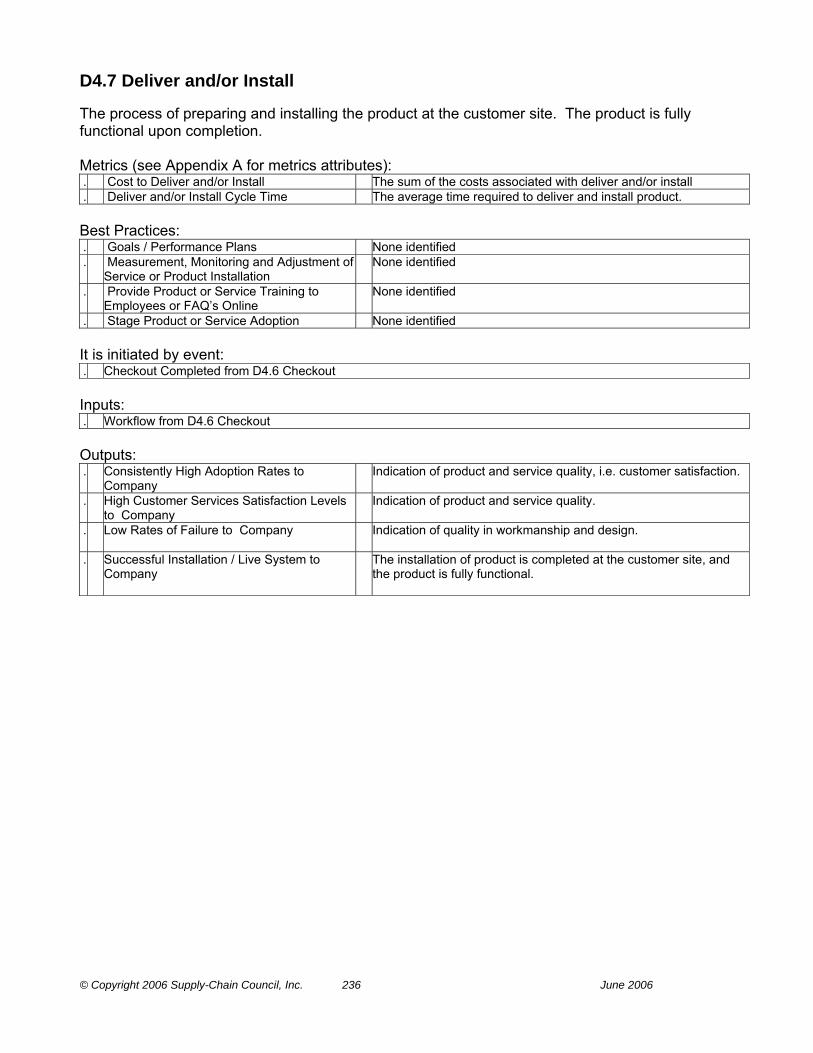
© Copyright 2006 Supply-Chain Council, Inc. 236 June 2006
D4.7 Deliver and/or Install The process of preparing and installing the product at the customer site. The product is fully functional upon completion. Metrics (see Appendix A for metrics attributes): . Cost to Deliver and/or Install The sum of the costs associated with deliver and/or install . Deliver and/or Install Cycle Time The average time required to deliver and install product. Best Practices: . Goals / Performance Plans None identified . Measurement, Monitoring and Adjustment of
Service or Product Installation None identified
. Provide Product or Service Training to Employees or FAQ’s Online
None identified
. Stage Product or Service Adoption None identified It is initiated by event: . Checkout Completed from D4.6 Checkout Inputs: . Workflow from D4.6 Checkout Outputs: . Consistently High Adoption Rates to
Company Indication of product and service quality, i.e. customer satisfaction.
. High Customer Services Satisfaction Levels
to Company Indication of product and service quality.
. Low Rates of Failure to Company Indication of quality in workmanship and design.
. Successful Installation / Live System to
Company The installation of product is completed at the customer site, and
the product is fully functional.
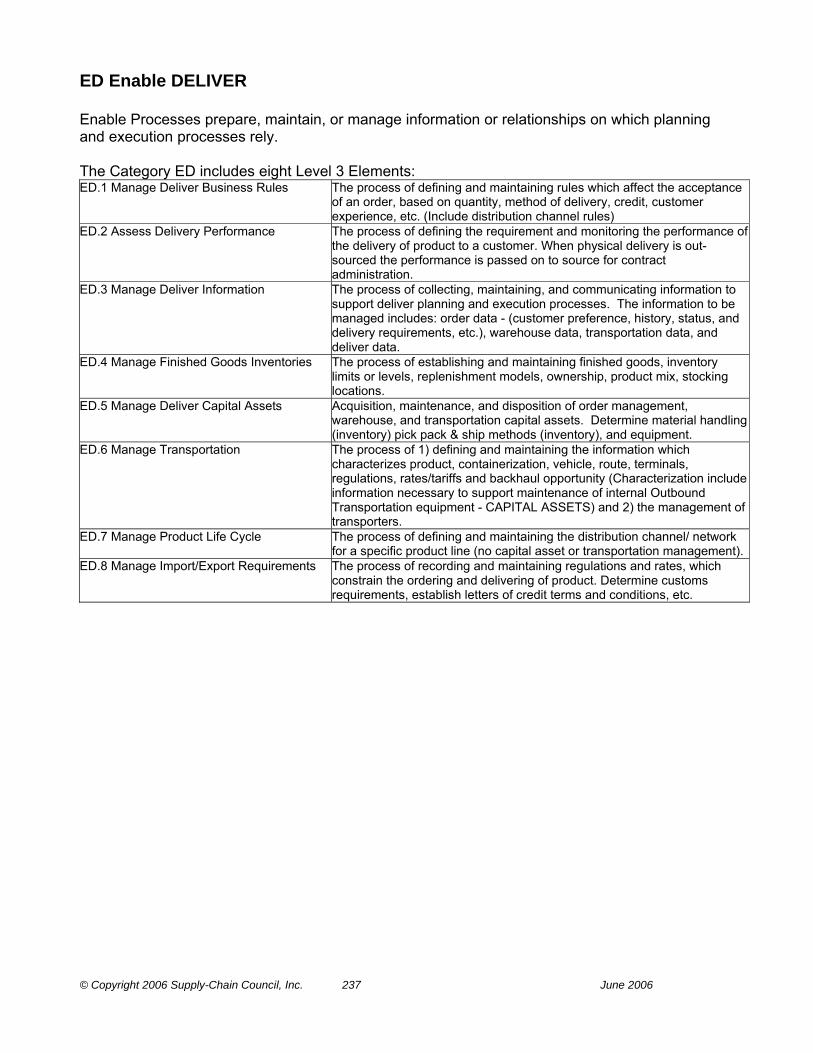
© Copyright 2006 Supply-Chain Council, Inc. 237 June 2006
ED Enable DELIVER Enable Processes prepare, maintain, or manage information or relationships on which planning and execution processes rely. The Category ED includes eight Level 3 Elements: ED.1 Manage Deliver Business Rules The process of defining and maintaining rules which affect the acceptance
of an order, based on quantity, method of delivery, credit, customer experience, etc. (Include distribution channel rules)
ED.2 Assess Delivery Performance The process of defining the requirement and monitoring the performance of the delivery of product to a customer. When physical delivery is out-sourced the performance is passed on to source for contract administration.
ED.3 Manage Deliver Information The process of collecting, maintaining, and communicating information to support deliver planning and execution processes. The information to be managed includes: order data - (customer preference, history, status, and delivery requirements, etc.), warehouse data, transportation data, and deliver data.
ED.4 Manage Finished Goods Inventories The process of establishing and maintaining finished goods, inventory limits or levels, replenishment models, ownership, product mix, stocking locations.
ED.5 Manage Deliver Capital Assets Acquisition, maintenance, and disposition of order management, warehouse, and transportation capital assets. Determine material handling (inventory) pick pack & ship methods (inventory), and equipment.
ED.6 Manage Transportation The process of 1) defining and maintaining the information which characterizes product, containerization, vehicle, route, terminals, regulations, rates/tariffs and backhaul opportunity (Characterization include information necessary to support maintenance of internal Outbound Transportation equipment - CAPITAL ASSETS) and 2) the management of transporters.
ED.7 Manage Product Life Cycle The process of defining and maintaining the distribution channel/ network for a specific product line (no capital asset or transportation management).
ED.8 Manage Import/Export Requirements The process of recording and maintaining regulations and rates, which constrain the ordering and delivering of product. Determine customs requirements, establish letters of credit terms and conditions, etc.
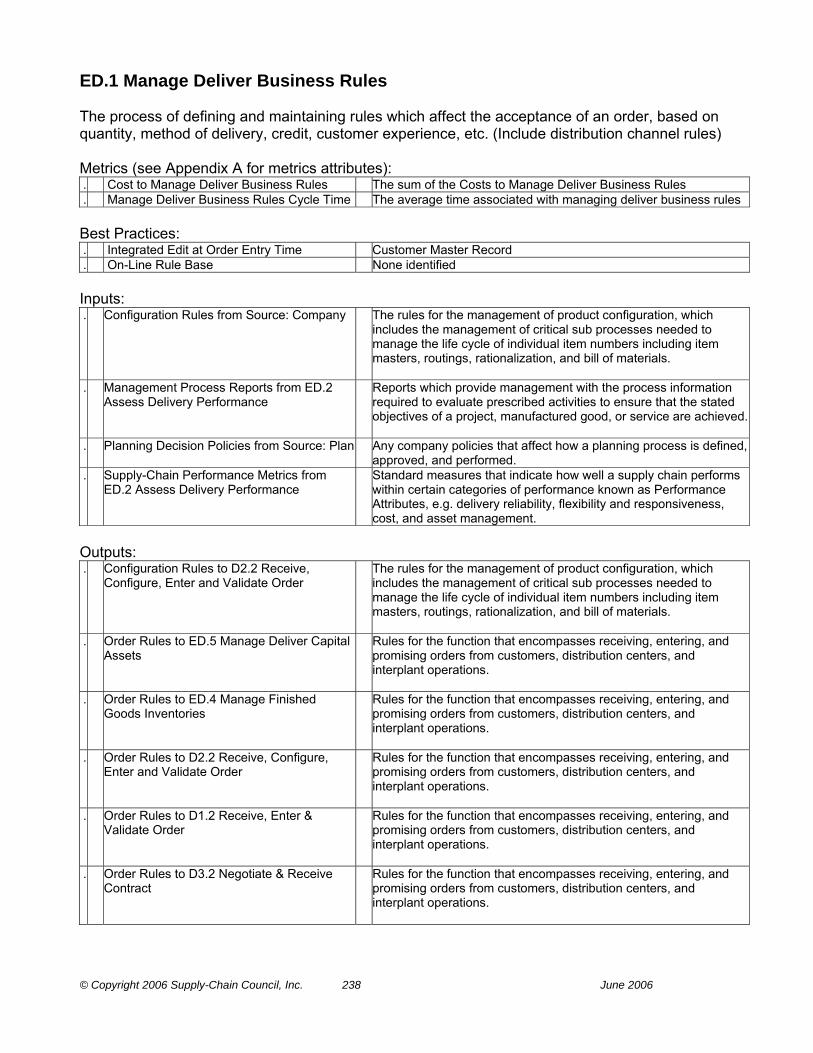
© Copyright 2006 Supply-Chain Council, Inc. 238 June 2006
ED.1 Manage Deliver Business Rules The process of defining and maintaining rules which affect the acceptance of an order, based on quantity, method of delivery, credit, customer experience, etc. (Include distribution channel rules) Metrics (see Appendix A for metrics attributes): . Cost to Manage Deliver Business Rules The sum of the Costs to Manage Deliver Business Rules . Manage Deliver Business Rules Cycle Time The average time associated with managing deliver business rules Best Practices: . Integrated Edit at Order Entry Time Customer Master Record . On-Line Rule Base None identified Inputs: . Configuration Rules from Source: Company The rules for the management of product configuration, which
includes the management of critical sub processes needed to manage the life cycle of individual item numbers including item masters, routings, rationalization, and bill of materials.
. Management Process Reports from ED.2 Assess Delivery Performance
Reports which provide management with the process information required to evaluate prescribed activities to ensure that the stated objectives of a project, manufactured good, or service are achieved.
. Planning Decision Policies from Source: Plan Any company policies that affect how a planning process is defined, approved, and performed.
. Supply-Chain Performance Metrics from ED.2 Assess Delivery Performance
Standard measures that indicate how well a supply chain performs within certain categories of performance known as Performance Attributes, e.g. delivery reliability, flexibility and responsiveness, cost, and asset management.
Outputs: . Configuration Rules to D2.2 Receive,
Configure, Enter and Validate Order The rules for the management of product configuration, which
includes the management of critical sub processes needed to manage the life cycle of individual item numbers including item masters, routings, rationalization, and bill of materials.
. Order Rules to ED.5 Manage Deliver Capital Assets
Rules for the function that encompasses receiving, entering, and promising orders from customers, distribution centers, and interplant operations.
. Order Rules to ED.4 Manage Finished Goods Inventories
Rules for the function that encompasses receiving, entering, and promising orders from customers, distribution centers, and interplant operations.
. Order Rules to D2.2 Receive, Configure, Enter and Validate Order
Rules for the function that encompasses receiving, entering, and promising orders from customers, distribution centers, and interplant operations.
. Order Rules to D1.2 Receive, Enter & Validate Order
Rules for the function that encompasses receiving, entering, and promising orders from customers, distribution centers, and interplant operations.
. Order Rules to D3.2 Negotiate & Receive Contract
Rules for the function that encompasses receiving, entering, and promising orders from customers, distribution centers, and interplant operations.

© Copyright 2006 Supply-Chain Council, Inc. 239 June 2006
ED.2 Assess Delivery Performance The process of defining the requirement and monitoring the performance of the delivery of product to a customer. When physical delivery is out-sourced the performance is passed on to source for contract administration. Metrics (see Appendix A for metrics attributes): . Assess Delivery Performance Cycle Time The average time associated with assessing the performance of
deliver processes. . Cost to Assess Delivery Performance The sum of the costs associated with assessing delivery
performance. . Documentation Accuracy Percentage of orders with on time and accurate documentation
supporting the order, including packing slips, bills of lading, invoices, etc. [Total number of orders delivered with correct and timely documentation] / [Total number of orders delivered] x 100%
. Perfect Condition Percentage of orders delivered in an undamaged state that meet specification, have the correct configuration, are faultlessly installed (as applicable), and accepted by the customer [ Number of orders delivered in Perfect Condition ] / [Number of orders delivered ] x 100%
Best Practices: . Customer Initiated Package Tracking WEB based Shared systems . Real Time Package Tracking Tracking and tracing Inputs: . Benchmark Data from Source: Company A set of measurements (or metrics) that is used to establish goals
for improvements in processes, functions, products, and so on Benchmark measures are often derived from other firms that display “best in class“ achievement
. Carrier Contracts (Customer) from Source: Source
Contracts that customers have with specific freight carriers through which suppliers have to work for the delivery of products. Customer manages carrier selection, shipment of purchased product, and payment of carrier.
. Customer Order from D1.2 Receive, Enter & Validate Order
An order from a customer for a particular product or a number of products. It is often referred to as an actual demand to distinguish it from a forecasted demand.
. Customer Order from D2.3 Reserve Resources & Determine Delivery Date
An order from a customer for a particular product or a number of products. It is often referred to as an actual demand to distinguish it from a forecasted demand.
. Customer Order from D3.2 Negotiate & Receive Contract
An order from a customer for a particular product or a number of products. It is often referred to as an actual demand to distinguish it from a forecasted demand.
. Delivery Performance from ED.5 Manage Deliver Capital Assets
The process of measuring actual supplier performance against internal and/or external standards, providing feedback to achieve and maintain the performance required to meet the customers’ business and/or competitive needs.
. Delivery Performance from ED.6 Manage Transportation
The process of measuring actual supplier performance against internal and/or external standards, providing feedback to achieve and maintain the performance required to meet the customers’ business and/or competitive needs.

© Copyright 2006 Supply-Chain Council, Inc. 240 June 2006
. Delivery Performance from ED.4 Manage Finished Goods Inventories
The process of measuring actual supplier performance against internal and/or external standards, providing feedback to achieve and maintain the performance required to meet the customers’ business and/or competitive needs.
Outputs: . Customer Service Requirements to ED.6
Manage Transportation Supply chain requirements related to the customer’s needs,
including service requirements, sales forecasts and actual orders/backorders.
. Customer Service Requirements to Plan Supply chain requirements related to the customer’s needs, including service requirements, sales forecasts and actual orders/backorders.
. Management Process Reports to ED.1 Manage Deliver Business Rules
Reports which provide management with the process information required to evaluate prescribed activities to ensure that the stated objectives of a project, manufactured good, or service are achieved.
. Supply-Chain Performance Metrics to EP.2 Manage Performance of Supply Chain
Standard measures that indicate how well a supply chain performs within certain categories of performance known as Performance Attributes, e.g. delivery reliability, flexibility and responsiveness, cost, and asset management.
. Supply-Chain Performance Metrics to ED.1 Manage Deliver Business Rules
Standard measures that indicate how well a supply chain performs within certain categories of performance known as Performance Attributes, e.g. delivery reliability, flexibility and responsiveness, cost, and asset management.
. Supply-Chain Performance Metrics to ED.5 Manage Deliver Capital Assets
Standard measures that indicate how well a supply chain performs within certain categories of performance known as Performance Attributes, e.g. delivery reliability, flexibility and responsiveness, cost, and asset management.

© Copyright 2006 Supply-Chain Council, Inc. 241 June 2006
ED.3 Manage Deliver Information The process of collecting, maintaining, and communicating information to support deliver planning and execution processes. The information to be managed includes: order data - (customer preference, history, status, and delivery requirements, etc.), warehouse data, transportation data, and deliver data. Metrics (see Appendix A for metrics attributes): . Cost to Manage Deliver Information The sum of the Cost to Manage Deliver Information . Manage Deliver Information Cycle Time The average time associated with managing deliver information Best Practices: . Comprehensive History of Customer
Interactions Including Order History, Claims, Problems, Etc.
None identified
. Customer Access to Online Tracking of Order Status and Shipping Information
Internet-enabled package/shipment tracking
. Customer Service Data Validation Including Geo-Coding
None identified
. Online Real-Time Customer Entry and Edit On-line Customer Service Module CRM (Customer resource Management) software is getting a big push in the E-Commerce/E-Business areas and generally provides a means to fulfill this requirement
. Provide Single Source of Information on the Customer (Single Group / Owner Responsible for Accuracy / Quality of Customer Data)
Secure E-Commerce Server and integrated Order Management System (OMS) Warehouse Management System (WMS) and Transportation Management System (TMS)
Inputs: . Booked Order from D2.2 Receive, Configure,
Enter and Validate Order The process of accepting and translating what a customer wants
into terms used by the manufacturer or distributor. The commitment should be based on the available-to-promise line (ATP) in the master schedule. This can be as simple as creating shipping documents for finished goods in a make-to-stock environment, or it might be a more complicated series of activities, including design efforts for make-to-order products
. Contract Status from D3.1 Obtain and Respond to RFP/RFQ
Customer profile, which include address data, credit and purchase histories, customer preferences including shipping, status, and delivery requirements, etc.
. Contract Status from D2.2 Receive, Configure, Enter and Validate Order
Customer profile, which include address data, credit and purchase histories, customer preferences including shipping, status, and delivery requirements, etc.
. Contract Status from D1.2 Receive, Enter & Validate Order
Customer profile, which include address data, credit and purchase histories, customer preferences including shipping, status, and delivery requirements, etc.
. Credit History from D3.1 Obtain and Respond to RFP/RFQ
Report that portrays a potential customer’s payment history and debt, indicating the ability to pay in a timely manner in the future.
. Credit History from D2.2 Receive, Configure, Enter and Validate Order
Report that portrays a potential customer’s payment history and debt, indicating the ability to pay in a timely manner in the future.
. Credit History from D1.2 Receive, Enter & Validate Order
Report that portrays a potential customer’s payment history and debt, indicating the ability to pay in a timely manner in the future.
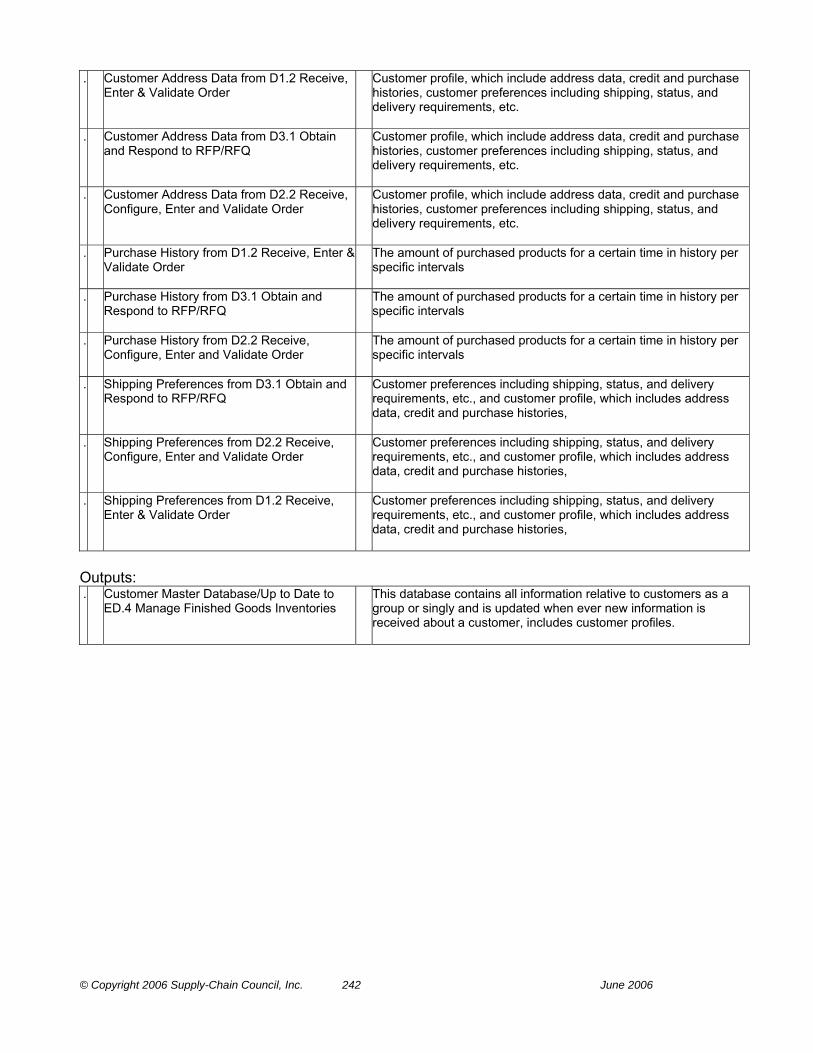
© Copyright 2006 Supply-Chain Council, Inc. 242 June 2006
. Customer Address Data from D1.2 Receive, Enter & Validate Order
Customer profile, which include address data, credit and purchase histories, customer preferences including shipping, status, and delivery requirements, etc.
. Customer Address Data from D3.1 Obtain and Respond to RFP/RFQ
Customer profile, which include address data, credit and purchase histories, customer preferences including shipping, status, and delivery requirements, etc.
. Customer Address Data from D2.2 Receive, Configure, Enter and Validate Order
Customer profile, which include address data, credit and purchase histories, customer preferences including shipping, status, and delivery requirements, etc.
. Purchase History from D1.2 Receive, Enter & Validate Order
The amount of purchased products for a certain time in history per specific intervals
. Purchase History from D3.1 Obtain and Respond to RFP/RFQ
The amount of purchased products for a certain time in history per specific intervals
. Purchase History from D2.2 Receive, Configure, Enter and Validate Order
The amount of purchased products for a certain time in history per specific intervals
. Shipping Preferences from D3.1 Obtain and Respond to RFP/RFQ
Customer preferences including shipping, status, and delivery requirements, etc., and customer profile, which includes address data, credit and purchase histories,
. Shipping Preferences from D2.2 Receive, Configure, Enter and Validate Order
Customer preferences including shipping, status, and delivery requirements, etc., and customer profile, which includes address data, credit and purchase histories,
. Shipping Preferences from D1.2 Receive, Enter & Validate Order
Customer preferences including shipping, status, and delivery requirements, etc., and customer profile, which includes address data, credit and purchase histories,
Outputs: . Customer Master Database/Up to Date to
ED.4 Manage Finished Goods Inventories This database contains all information relative to customers as a
group or singly and is updated when ever new information is received about a customer, includes customer profiles.

© Copyright 2006 Supply-Chain Council, Inc. 243 June 2006
ED.4 Manage Finished Goods Inventories The process of establishing and maintaining finished goods, inventory limits or levels, replenishment models, ownership, product mix, stocking locations. Metrics (see Appendix A for metrics attributes): . % of Orders Delivered in Full Percentage of orders which all of the items are received by
customer in the quantities committed The number of orders that are received by the customer in the quantities committed divided by the total orders [Total number of orders delivered in full] / [Total number of orders delivered] x 100%
. Cost to Manage Finished Goods Inventories The sum of the Costs to Manage Finished Good Inventory . Finished Goods Inventory Days of Supply Plant finished goods inventory days of supply are calculated as
gross plant finished goods inventory ÷ (value of transfers/365 days). . Inventory Days of Supply Five point annual average of the sum of all gross inventories (raw
materials & WIP, plant FG, field FG, field samples, other) ÷ (COGS ÷ 365). Total gross value of inventory at standard cost before reserves for excess and obsolescence. Only includes inventory on company books, future liabilities should not be included
. Manage Finished Goods Inventories Cycle Time
The average time associated with managing finished good inventory
Best Practices: . Periodic Review of Metrics and Strategy with
Comparisons to Industry Benchmarks Real time view of data.
. Real Time Data on Current Status Dynamic calculation of safety stock based on actual sales. . Statistical Test Count The Statistical Test Count (STC) process is a method of validating
inventory on-hand values by physically counting and reconciling a statistical sample of the entire inventory population. This sample is then extrapolated across the inventory population, which provides an indicative measure of entire inventory population. Furthermore, with extrapolation the net and gross percentage of error is determined.
Inputs: . Customer Master Database/Up to Date from
ED.3 Manage Deliver Information This database contains all information relative to customers as a
group or singly and is updated when ever new information is received about a customer, includes customer profiles.
. Existing Inventory Data from D1.8 Receive Product from Source or Make
Available data that characterizes and quantifies raw material, work in process, and finished goods inventories
. Integrated Supply Chain Plan from Source: Plan
Communication of courses of action over the appropriate time-defined planning horizon and interval, representing a projected appropriation of supply chain resource to meet supply-chain requirements as they affect the customer.
. Inventory Rules from Source: Plan The rules that determining the desired levels of items, whether raw materials, work in process, or finished products including order quantities and safety stock levels.
. Order Rules from ED.1 Manage Deliver Business Rules
Rules for the function that encompasses receiving, entering, and promising orders from customers, distribution centers, and interplant operations.
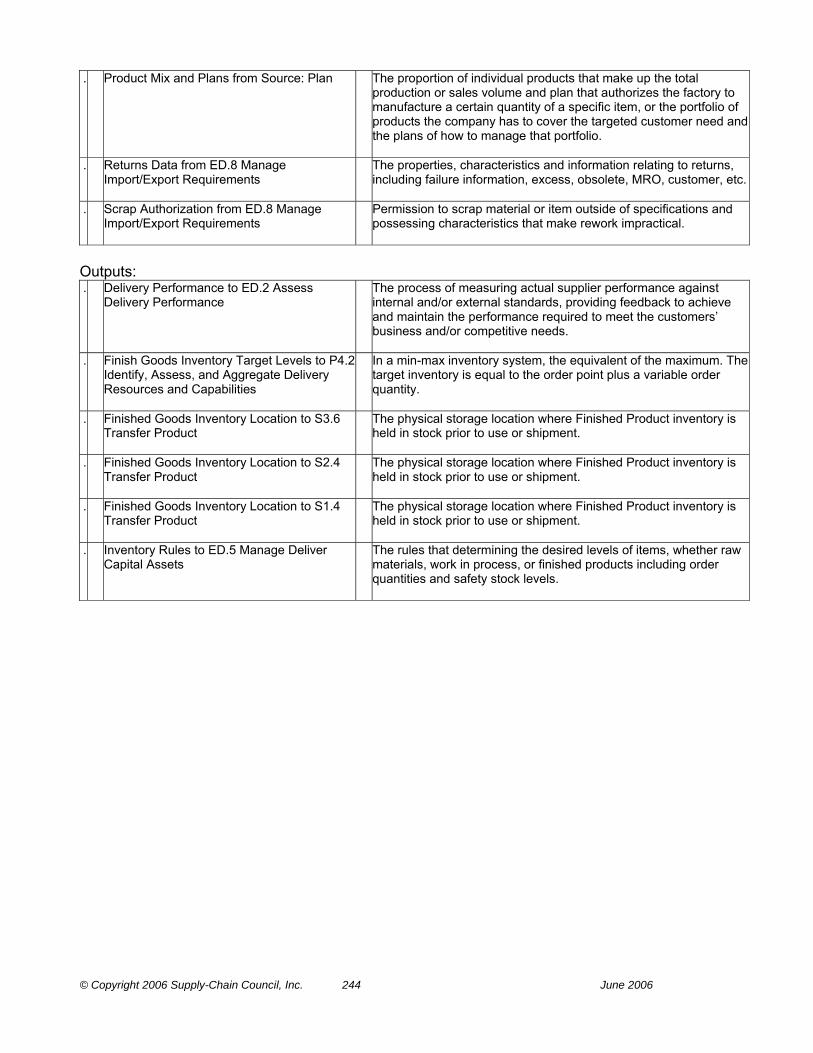
© Copyright 2006 Supply-Chain Council, Inc. 244 June 2006
. Product Mix and Plans from Source: Plan The proportion of individual products that make up the total production or sales volume and plan that authorizes the factory to manufacture a certain quantity of a specific item, or the portfolio of products the company has to cover the targeted customer need and the plans of how to manage that portfolio.
. Returns Data from ED.8 Manage Import/Export Requirements
The properties, characteristics and information relating to returns, including failure information, excess, obsolete, MRO, customer, etc.
. Scrap Authorization from ED.8 Manage Import/Export Requirements
Permission to scrap material or item outside of specifications and possessing characteristics that make rework impractical.
Outputs: . Delivery Performance to ED.2 Assess
Delivery Performance The process of measuring actual supplier performance against
internal and/or external standards, providing feedback to achieve and maintain the performance required to meet the customers’ business and/or competitive needs.
. Finish Goods Inventory Target Levels to P4.2 Identify, Assess, and Aggregate Delivery Resources and Capabilities
In a min-max inventory system, the equivalent of the maximum. The target inventory is equal to the order point plus a variable order quantity.
. Finished Goods Inventory Location to S3.6 Transfer Product
The physical storage location where Finished Product inventory is held in stock prior to use or shipment.
. Finished Goods Inventory Location to S2.4 Transfer Product
The physical storage location where Finished Product inventory is held in stock prior to use or shipment.
. Finished Goods Inventory Location to S1.4 Transfer Product
The physical storage location where Finished Product inventory is held in stock prior to use or shipment.
. Inventory Rules to ED.5 Manage Deliver Capital Assets
The rules that determining the desired levels of items, whether raw materials, work in process, or finished products including order quantities and safety stock levels.

© Copyright 2006 Supply-Chain Council, Inc. 245 June 2006
ED.5 Manage Deliver Capital Assets Acquisition, maintenance, and disposition of order management, warehouse, and transportation capital assets. Determine material handling (inventory) pick pack & ship methods (inventory), and equipment. Metrics (see Appendix A for metrics attributes): . Cost to Manage Deliver Capital Assets The sum of the Costs to Manage Deliver Capital Assets . Manage Deliver Capital Assets Cycle Time The average time associated with managing deliver capital assets Best Practices: . Automated Data Entry Scanning with RFID/Bar-codes systems . Facility Master Plan Automated Item Cubing and Weighting systems . Measure Customer Service Advanced Shipping Notices (ASN)Parcel and Container Routing
and Rating Compliance Labeling Real time shipment tracking . Removal of Obsolete Stock Automated Calculation of ABC Velocity Movement . Standard Operating Procedures and
Methodology None identified
. Storage Location Zoning Automated or Optimized Slotting (Storage Location) Systems Inputs: . Approved Item Master from Source: Plan The “master“ record for an item. Typically, it contains identifying and
descriptive data and control values (lead times, lot sizes, etc.) and may contain data on inventory status, requirements, planned orders, and costs. Item records are linked by bill of material records (or product structure records), thus defining the bill of material.
. Budgets from Source: Plan A plan that includes an estimate of future costs and revenues related to expected activities. The budget serves as a pattern for and a control over future operations.
. Inventory Rules from ED.4 Manage Finished Goods Inventories
The rules that determining the desired levels of items, whether raw materials, work in process, or finished products including order quantities and safety stock levels.
. Inventory Rules from Source: Plan The rules that determining the desired levels of items, whether raw materials, work in process, or finished products including order quantities and safety stock levels.
. Order Rules from ED.1 Manage Deliver Business Rules
Rules for the function that encompasses receiving, entering, and promising orders from customers, distribution centers, and interplant operations.
. Supply-Chain Performance Metrics from ED.2 Assess Delivery Performance
Standard measures that indicate how well a supply chain performs within certain categories of performance known as Performance Attributes, e.g. delivery reliability, flexibility and responsiveness, cost, and asset management.
Outputs: . Delivery Performance to ED.2 Assess
Delivery Performance The process of measuring actual supplier performance against
internal and/or external standards, providing feedback to achieve and maintain the performance required to meet the customers’ business and/or competitive needs.
. Warehouse Operating Constraints to Plan Warehouse constraints are those storage items that impact on the supply chain efficiency, including material handling equipment and personnel, equipment maintenance, building maintenance, and security personnel.

© Copyright 2006 Supply-Chain Council, Inc. 246 June 2006

© Copyright 2006 Supply-Chain Council, Inc. 247 June 2006
ED.6 Manage Transportation The process of 1) defining and maintaining the information which characterizes product, containerization, vehicle, route, terminals, regulations, rates/tariffs and backhaul opportunity (Characterization include information necessary to support maintenance of internal Outbound Transportation equipment - CAPITAL ASSETS) and 2) the management of transporters. Metrics (see Appendix A for metrics attributes): . Cost to Manage Transportation The sum of the costs associated with managing Finished Good
Transportation . Manage Transportation Cycle Time The average time associated with managing transportation Best Practices: . Appointment Scheduling for Pickup and
Delivery of Customer Shipments Transportation Management System (TMS) Maintenance
Management . Automated Documentation for International
Shipments Transportation Management System (TMS) Maintenance
Management . Backhaul Trading Exchange Pooling . Capture and Maintain Mode Specific Data Transportation Management System (TMS) Maintenance
Management . Electronic Manifest and Electronic Billing Transportation Management System (TMS) Maintenance
Management . Integrated Order Management, Warehouse
Management, and Transportation Management Systems View for analysis for all orders and shipments the following data: Logistics, Product, Cost, GL Charging
Transportation Management System (TMS) Maintenance Management
. Internet Pooling (Electronic Brokerage of Shipments)
Rating & Routing
. Manage Information Across 100% of Shipments
Transportation Management System (TMS) Maintenance Management
. Measurement of Carrier Performance for On-time Delivery and Completeness
Transportation Management System (TMS) Maintenance Management
. Real-Time Optimized Shipment Method Selection (Air Parcel, Ground Parcel, LTL, etc.) Based on Customer Service Requirements
Transportation Management System (TMS) Maintenance Management
. Real-Time Shipment Tracking, (via internet) Transportation Management System (TMS) Maintenance Management
. View for Analysis for All Orders and Shipments the Following Data: Logistics, Product, Cost, GL Charging
Transportation Management System (TMS) Maintenance Management
Inputs: . Air, Ground....Carrier Rate Tables from
Source: Company Rates charged by common carriers to move goods, or freight.
. Contract Carrier Rates from ES.8 Manage
Import/Export Requirements The rates charged by a carrier that does not serve the general
public, but provides transportation for hire for one or a limited number of shippers under a specific contract.
. Customer Order Size, Weight, and Freight Class from D3.2 Negotiate & Receive Contract
Coupled with cube and route, these criteria determine type of carrier and cost of shipment
. Customer Order Size, Weight, and Freight Class from D1.2 Receive, Enter & Validate Order
Coupled with cube and route, these criteria determine type of carrier and cost of shipment
. Customer Order Size, Weight, and Freight Class from D2.2 Receive, Configure, Enter
Coupled with cube and route, these criteria determine type of carrier and cost of shipment
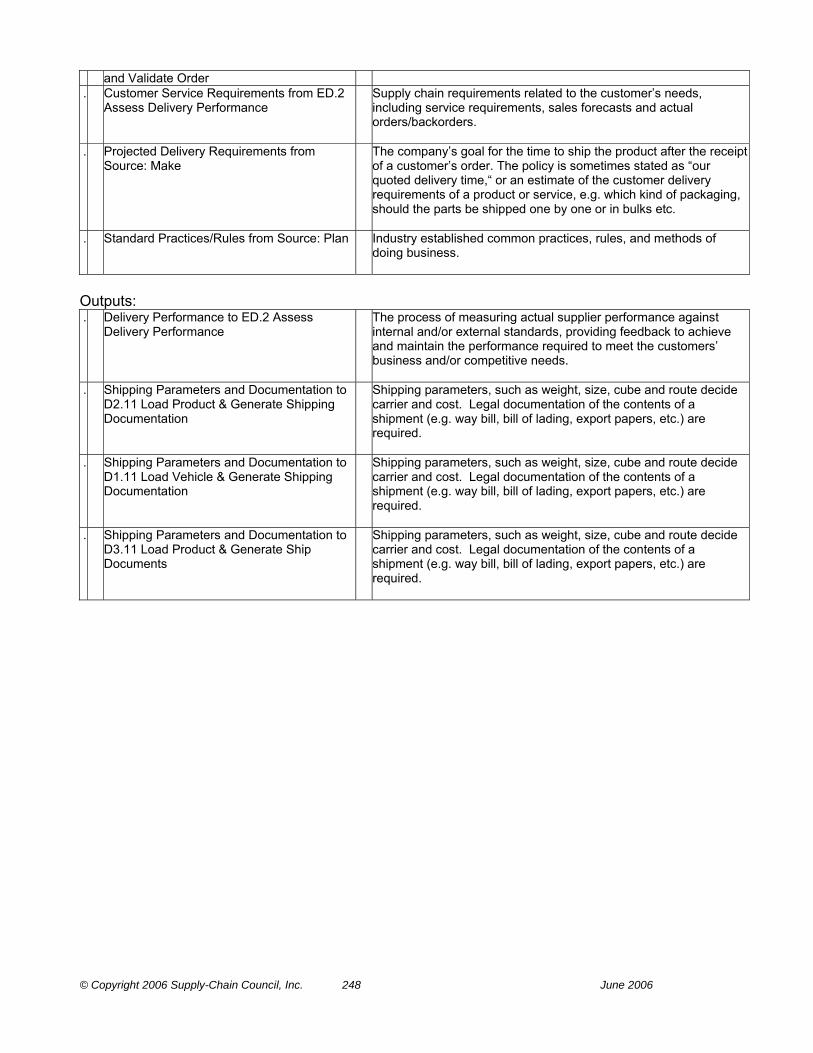
© Copyright 2006 Supply-Chain Council, Inc. 248 June 2006
and Validate Order . Customer Service Requirements from ED.2
Assess Delivery Performance Supply chain requirements related to the customer’s needs,
including service requirements, sales forecasts and actual orders/backorders.
. Projected Delivery Requirements from Source: Make
The company’s goal for the time to ship the product after the receipt of a customer’s order. The policy is sometimes stated as “our quoted delivery time,“ or an estimate of the customer delivery requirements of a product or service, e.g. which kind of packaging, should the parts be shipped one by one or in bulks etc.
. Standard Practices/Rules from Source: Plan Industry established common practices, rules, and methods of doing business.
Outputs: . Delivery Performance to ED.2 Assess
Delivery Performance The process of measuring actual supplier performance against
internal and/or external standards, providing feedback to achieve and maintain the performance required to meet the customers’ business and/or competitive needs.
. Shipping Parameters and Documentation to D2.11 Load Product & Generate Shipping Documentation
Shipping parameters, such as weight, size, cube and route decide carrier and cost. Legal documentation of the contents of a shipment (e.g. way bill, bill of lading, export papers, etc.) are required.
. Shipping Parameters and Documentation to D1.11 Load Vehicle & Generate Shipping Documentation
Shipping parameters, such as weight, size, cube and route decide carrier and cost. Legal documentation of the contents of a shipment (e.g. way bill, bill of lading, export papers, etc.) are required.
. Shipping Parameters and Documentation to D3.11 Load Product & Generate Ship Documents
Shipping parameters, such as weight, size, cube and route decide carrier and cost. Legal documentation of the contents of a shipment (e.g. way bill, bill of lading, export papers, etc.) are required.
© Copyright 2006 Supply-Chain Council, Inc. 249 June 2006
ED.7 Manage Product Life Cycle The process of defining and maintaining the distribution channel/ network for a specific product line (no capital asset or transportation management). Metrics (see Appendix A for metrics attributes): . Cost to Manage Product Life Cycle The sum of the Cost to Manage Product Life Cycle . Manage Product Life Cycle Time The average time associated with managing the product life cycle Best Practices: . Integrated Facility Management None identified . Operations and Network Analysis None identified . Standard Operating Procedures and
Methodology None identified
Inputs: . Budgets from Source: Plan A plan that includes an estimate of future costs and revenues
related to expected activities. The budget serves as a pattern for and a control over future operations.
. Current Inventory Source Data from ES.3 Maintain Source Data
Data which will provide measurement of actual supplier performance against internal and or external standards to provide feedback to achieve and maintain the performance required to meet the customer’s needs.
. Government Constraints from ED.8 Manage Import/Export Requirements
Requirements established by a government which must be met before allowing the shipping, delivery of a product or manufacture of an item.
. Location of Customers from D2.2 Receive, Configure, Enter and Validate Order
Customer profile, which includes address and location data, credit and purchase histories, customer preferences including shipping, status, and delivery requirements, etc.
. Location of Customers from D3.2 Negotiate & Receive Contract
Customer profile, which includes address and location data, credit and purchase histories, customer preferences including shipping, status, and delivery requirements, etc.
. Location of Customers from D1.2 Receive, Enter & Validate Order
Customer profile, which includes address and location data, credit and purchase histories, customer preferences including shipping, status, and delivery requirements, etc.
. Product Mix and Plans from Source: Plan The proportion of individual products that make up the total production or sales volume and plan that authorizes the factory to manufacture a certain quantity of a specific item, or the portfolio of products the company has to cover the targeted customer need and the plans of how to manage that portfolio.
. Revised Business Assumptions from Source: Plan
An update to the expected cause and effect statements that are the base for the Revised Aggregate Forecast and Projections. These are reviewed periodically with actual results to verify the linkage of actual cause and effect.
Outputs: . Enterprise Distribution Model to Plan Model of the distribution enterprise including the flows, processes,
inputs, outputs, metrics, and best business practices.
© Copyright 2006 Supply-Chain Council, Inc. 250 June 2006
ED.8 Manage Import/Export Requirements The process of recording and maintaining regulations and rates, which constrain the ordering and delivering of product. Determine customs requirements, establish letters of credit terms and conditions, etc. Metrics (see Appendix A for metrics attributes): . Cost to Manage Import/Export
Requirements The sum of the costs associated with the management of
import/export requirements . Customs Clearance Cycle Time The average time associated with clearing an order through
customs . Manage Import/Export Requirements Cycle
Time The average time associated with managing import/export
requirements Best Practices: . Ability to Track Component/Sub-Component
Manufacturing Country of Origin Component/lot tracking (lot trace-ability)
. Assessing Export/Import Requirements during Time of Product Development/Manufacture
Multi-country Export/Import documentation compliance
. Direct Connection to Customs Clearance Electronic documentation submission via EDI and/or internet. . Direct Transfer of Documents to Recipient
and Forwarder Electronic documentation submission via EDI and/or internet.
. Documents Generated Automatically During Shipment Preparation.
Electronic documentation submission via EDI and/or internet.
. Multi-country Export/Import documentation compliance
None identified
Inputs: . Government Regulations from Source:
Government Documents the implement law and requirements concerning the
import and export of items and the manufacture of item.
. Receipt Verification from S1.2 Receive Product
Acknowledgement that the product received conforms to specified requirements and criteria.
. Receipt Verification from S2.2 Receive Product
Acknowledgement that the product received conforms to specified requirements and criteria.
. Receipt Verification from S3.4 Receive Product
Acknowledgement that the product received conforms to specified requirements and criteria.
. Shipping History from D1.11 Load Vehicle & Generate Shipping Documentation
The transaction history of the physical shipment of an item to another internal location or to a customer.
. Shipping History from D3.11 Load Product & Generate Ship Documents
The transaction history of the physical shipment of an item to another internal location or to a customer.
. Shipping History from D2.11 Load Product & Generate Shipping Documentation
The transaction history of the physical shipment of an item to another internal location or to a customer.
. Tariffs and Duties from Source: Company Charges established by a government which must be met before allowing the shipping or delivery of a product across national boundaries.
Outputs:

© Copyright 2006 Supply-Chain Council, Inc. 251 June 2006
. Duty Drawback Claims to Company Claims for the refund of duties as a result of a ruling by a government agency.
. Government Constraints to Plan Requirements established by a government which must be met before allowing the shipping, delivery of a product or manufacture of an item.
. Government Constraints to ED.7 Manage Product Life Cycle
Requirements established by a government which must be met before allowing the shipping, delivery of a product or manufacture of an item.
. Returns Data to ED.4 Manage Finished Goods Inventories
The properties, characteristics and information relating to returns, including failure information, excess, obsolete, MRO, customer, etc.
. Scrap Authorization to ED.4 Manage Finished Goods Inventories
Permission to scrap material or item outside of specifications and possessing characteristics that make rework impractical.
. Shipping Export Parameters and Documentation to D2.11 Load Product & Generate Shipping Documentation
Shipping and documentation requirements established by a government which must be met before allowing the shipping or delivery of a product across national boundaries.
. Shipping Export Parameters and Documentation to D1.11 Load Vehicle & Generate Shipping Documentation
Shipping and documentation requirements established by a government which must be met before allowing the shipping or delivery of a product across national boundaries.
. Shipping Export Parameters and Documentation to D3.11 Load Product & Generate Ship Documents
Shipping and documentation requirements established by a government which must be met before allowing the shipping or delivery of a product across national boundaries.

© Copyright 2006 Supply-Chain Council, Inc. 252 June 2006
SR1 Source Return Defective Product The process, initiated by the customer, of returning material deemed defective by to the last known holder or designated return center. Process includes: customer identification that an action is required and determining what that action should be, communicating with the last known holder, generating return documentation, and physically returning of the excess product. The Category SR1 includes five Level 3 Elements: SR1.1 Identify Defective Product Condition The process where the customer utilizes planned policies, business rules
and product operating conditions inspection as criteria to identify and confirm that material is excess to requirements defective.
SR1.2 Disposition Defective Product The process of the customer determining whether to return the defective item and the appropriate source contact for a return authorization.
SR1.3 Request Defective Return Authorization
The process of a customer requesting and obtaining authorization, from last known holder or designated return center, for the return of defective product. Additionally, the customer and last known holder or designated return center would discuss enabling conditions such as return replacement or credit, packaging, handling, transportation and import / export requirements to facilitate the efficient return of the defective product.
SR1.4 Schedule Defective Product Shipment The process where the customer develops the schedule for a carrier to pick-up for delivery of the defective product. Activities include selecting the carrier and rates, preparing the item for transfer, preparing scheduling documentation and managing overall scheduling administration.
SR1.5 Return Defective Product The process where the customer packages, and handles the defective product in preparation for shipping in accord with pre-determined conditions. The product is then provided by the customer to the carrier who physically transports the product and its associated documentation to the last known holder or designated return center.
Metrics (see Appendix A for metrics attributes): Cost to Source Return The sum of the costs associated with Source Return. Order Fulfillment Cycle Time The average actual cycle time consistently achieved to fulfill customer
orders. Return on Supply Chain Fixed Assets Return on Supply Chain Fixed Assets measures the return an organization
receives on its invested capital in supply chain fixed assets. This includes the fixed assets used in Plan, Source, Make, Deliver, and Return. The levels of aggregation can be at any element associated with a supply chain asset.
Return on Working Capital Return on working capital is a measurement which assesses the magnitude of investment relative to a company’s working capital position verses the revenue generated from a supply chain. Components include accounts receivable, accounts payable, inventory, supply chain revenue, cost of goods sold and supply chain management costs.
Source Return Cycle Time The average time associated with Source Return Processes

© Copyright 2006 Supply-Chain Council, Inc. 253 June 2006
SR1.1 Identify Defective Product Condition The process where the customer utilizes planned policies, business rules and product operating conditions inspection as criteria to identify and confirm that material is excess to requirements defective. Metrics (see Appendix A for metrics attributes): . Cost of Identifying the Defective Condition as a % of Total Source Return Cost . Value of Defective Inventory in Identification Stage/ Total Inventory Value Best Practices: . Enterprise Level Policies/Rules with Local
Execution Web based access to enterprise level business rules
Inputs: . Business Rules for Return Processes from
ER.1 Manage Business Rules for Return Processes
Rules for conducting business, i.e. developing and maintaining customer and channel performance standards of an return processes such as service levels, given service requirements by supply chain stakeholders/trading partners. Business rules align Return process policies with business strategy, goals, and objectives.
. Manage Regulatory Return Policy from ER.8 Manage Return Regulatory Requirements
The process of identifying and complying with regulatory documentation and process standards set by external entities (i.e. government, trade officials, etc.) when planning for the Return and Recovery of Assets.
. Warranty Data from ER.8 Manage Return Regulatory Requirements
All data relevant to a warranty claim for a customer for replacement, repair or credit because the product received did not meet a commitment, either expressed or implied, concerning a certain fact regarding the product
Outputs: . Returned Defective Product to SR1.2
Disposition Defective Product Product being returned that is in a defective condition.
© Copyright 2006 Supply-Chain Council, Inc. 254 June 2006
SR1.2 Disposition Defective Product The process of the customer determining whether to return the defective item and the appropriate source contact for a return authorization. Metrics (see Appendix A for metrics attributes): . Defective Product Disposition Costs as % Total Source Return Cost . Value of Defective Inventory in Disposition
Stage/ Total Inventory Value Inventory Awaiting Return
Best Practices: . Confirm Asset Return Condition Codes Are
Clearly Understood by All Employees, Especially Those Who Are New to the Process
None identified
. Confirm Changes in Condition Code Policies Are Promptly Communicated to All Employees and Supply-Chain Partners.
None identified
. Drive Returns Directly to Return Stock Point of Disposition to Reduce Cost and Cycle Time
Specify return disposition location and time.
Inputs: . Return Plans from P5.4 Establish and
Communicate Return Plans Courses of action over specified time periods that represent the
projected appropriation of required return resources and or assets to meet the return process requirements.
. Returned Defective Product from SR1.1 Identify Defective Product Condition
Product being returned that is in a defective condition.
Outputs: . Authorization to Return to Service to D1.8
Receive Product from Source or Make Permission to return to service an item that has been repaired and
found to be within specifications and operable.
. Authorization to Scrap to D1.8 Receive Product from Source or Make
Permission to scrap material or item outside of specifications and possessing characteristics that make rework impractical.
. Return Inventory Availability to ER.4 Manage Return Inventory
Inventory relative to return process available for use.
. Return Product Location to ER.4 Manage Return Inventory
The physical location where the returned product inventory is held prior to disposition
. Returned Defective Product to SR1.3 Request Defective Return Authorization
Product being returned that is in a defective condition.
© Copyright 2006 Supply-Chain Council, Inc. 255 June 2006
SR1.3 Request Defective Return Authorization The process of a customer requesting and obtaining authorization, from last known holder or designated return center, for the return of defective product. Additionally, the customer and last known holder or designated return center would discuss enabling conditions such as return replacement or credit, packaging, handling, transportation and import / export requirements to facilitate the efficient return of the defective product. Metrics (see Appendix A for metrics attributes): . Cost per Request Authorization . Ratio of Authorization Cost to Total Source Return cost . Value of Defective Product Inventory in
Request Return Authorization Stage/ Total Defective Product Inventory Value
Inventory awaiting return authorization.
Best Practices: . Clarify Point of Contact and Return Location Electronic rules for business relationships and transactions. . Develop and Clarify Mutually Understood
Cycle Times to Process Return Authorizations
Clarification as to who will pay in-bound and out-bound freight cost.
. Enable Customer-Service Representatives to Complete the Bill Of Lading for the Customer Including Carrier Routing, Weight, Description and Class to Minimize Guesswork & Wrong Estimates
Clarification of policy if authorizations are not processed within the expected cycle time.
. Long-Term Return Agreements / Partnerships
None identified
Inputs: . Defective Product Return Authorization
Response from DR1.1 Authorize Defective Product Return
The approved or disapproved Return Product Authorization (RPA) for excess inventory, unserviceable products and/or serviceable or obsolete products as defined by the terms and conditions of a customer/supplier contract.
. Return Inventory Availability from ER.4 Manage Return Inventory
Inventory relative to return process available for use.
. Return Schedule Instructions from DR1.2 Schedule Defective Return Receipt
A list of operations and procedures for scheduling the return of product.
. Returned Defective Product from SR1.2 Disposition Defective Product
Product being returned that is in a defective condition.
Outputs: . Credit/ Exchange Options to SR1.4
Schedule Defective Product Shipment The options available on the return of a repairable item, credit for
the cost of the item, repair of the repairable item, receipt of a serviceable item from stock.
. Defective Product Disposition Request to DR1.1 Authorize Defective Product Return
The customer request for disposition instructions for a defective product from the appropriate source.
. Defective Product Return Authorization Request to DR1.1 Authorize Defective Product Return
The customer request for disposition instructions for a defective product from the appropriate source.
. Historical Return Rates to P5.1 Assess, and Aggregate Return Requirements
A judgmental forecasting technique based upon the a return history that is analogous to a present situation, such as the return history on a similar product, and using the past pattern to predict future returns.

© Copyright 2006 Supply-Chain Council, Inc. 256 June 2006
. Returned Defective Product to SR1.4 Schedule Defective Product Shipment
Product being returned that is in a defective condition.
. Ship-to Data to SR1.4 Schedule Defective Product Shipment
Data about the destination of a retun delivery.
. Validated Return Material Authorization to SR1.4 Schedule Defective Product Shipment
A validated and approved Return Product Authorization (RPA).
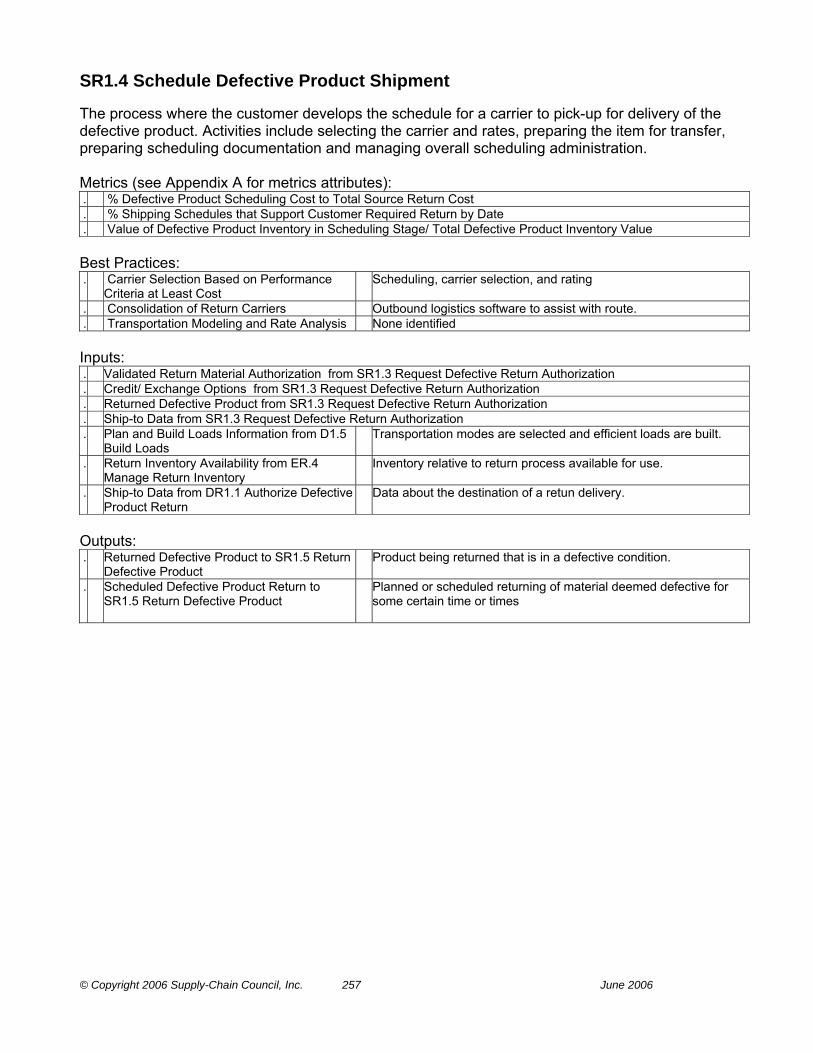
© Copyright 2006 Supply-Chain Council, Inc. 257 June 2006
SR1.4 Schedule Defective Product Shipment The process where the customer develops the schedule for a carrier to pick-up for delivery of the defective product. Activities include selecting the carrier and rates, preparing the item for transfer, preparing scheduling documentation and managing overall scheduling administration. Metrics (see Appendix A for metrics attributes): . % Defective Product Scheduling Cost to Total Source Return Cost . % Shipping Schedules that Support Customer Required Return by Date . Value of Defective Product Inventory in Scheduling Stage/ Total Defective Product Inventory Value Best Practices: . Carrier Selection Based on Performance
Criteria at Least Cost Scheduling, carrier selection, and rating
. Consolidation of Return Carriers Outbound logistics software to assist with route. . Transportation Modeling and Rate Analysis None identified Inputs: . Validated Return Material Authorization from SR1.3 Request Defective Return Authorization . Credit/ Exchange Options from SR1.3 Request Defective Return Authorization . Returned Defective Product from SR1.3 Request Defective Return Authorization . Ship-to Data from SR1.3 Request Defective Return Authorization . Plan and Build Loads Information from D1.5
Build Loads Transportation modes are selected and efficient loads are built.
. Return Inventory Availability from ER.4
Manage Return Inventory Inventory relative to return process available for use.
. Ship-to Data from DR1.1 Authorize Defective
Product Return Data about the destination of a retun delivery.
Outputs: . Returned Defective Product to SR1.5 Return
Defective Product Product being returned that is in a defective condition.
. Scheduled Defective Product Return to
SR1.5 Return Defective Product Planned or scheduled returning of material deemed defective for
some certain time or times

© Copyright 2006 Supply-Chain Council, Inc. 258 June 2006
SR1.5 Return Defective Product The process where the customer packages, and handles the defective product in preparation for shipping in accord with pre-determined conditions. The product is then provided by the customer to the carrier who physically transports the product and its associated documentation to the last known holder or designated return center. Metrics (see Appendix A for metrics attributes): . % Error-Free Returns Shipped . Cost per Request Authorization . Return Shipments Shipped on Time . Return Transportation Costs . Value of Defective Product Inventory in Physical Return and Transportation Stage/ Total Defective Inventory Value Best Practices: . Advanced Shipping Notice Integrated data sharing with repair facility. . Shipment Tracking and Tracing Satellite communications, GPS, RFID Inputs: . Scheduled Defective Product Return from SR1.4 Schedule Defective Product Shipment . Returned Defective Product from SR1.4 Schedule Defective Product Shipment . Load, Shipping, Verify, and Credit
Information from D1.11 Load Vehicle & Generate Shipping Documentation
The function that performs tasks for the outgoing shipment of parts, components, and products. It includes packaging, marking, weighing, and loading for shipment. Also, verify the shipment and customer credit information.
. Return Inventory Availability from ER.4 Manage Return Inventory
Inventory relative to return process available for use.
Outputs: . Returned Defective Product to DR1.3
Receive Defective Product Product being returned that is in a defective condition.
. Shipment Documents to Government Legal documentation of the contents of a shipment (e.g. way bill, bill
of lading, export papers, etc....).
. Shipment Documents to Customer Legal documentation of the contents of a shipment (e.g. way bill, bill of lading, export papers, etc....).
. Shipment Documents to Carrier Legal documentation of the contents of a shipment (e.g. way bill, bill of lading, export papers, etc....).

© Copyright 2006 Supply-Chain Council, Inc. 259 June 2006
DR1 Deliver Return Defective Product The processes of the last known holder or designated return center authorizing and scheduling the defective product return and the physical receipt of the item by the last known holder or known return center and their transfer of the item for final disposition determination. The process includes communication between the customer and last known holder or known return center and the generation of associated documentation. The Category DR1 includes four Level 3 Elements: . DR1.1 Authorize Defective Product Return The process where the last known holder or designated return
center receives a defective product return authorization request from a customer, determines if the item can be accepted and communicates decision to the customer. Accepting the request would include negotiating the conditions of the return with the customer, including authorizing return replacement or credit. Rejecting the request would include providing a reason for the rejection to the customer.
. DR1.2 Schedule Defective Return Receipt The process where the last known holder or designated return center evaluates the defective product handling requirements including negotiated conditions and develops a schedule that tells the Customer when to ship the product. The scheduling activity would also inform Receiving when to expect the shipment and where to send the product, for disposition, upon receipt.
. DR1.3 Receive Defective Product The process where the last known holder or designated return center receives and verifies the returned defective product against the return authorization and other documentation and prepares the item for transfer.
. DR1.4 Transfer Defective Product The process where the last known holder or designated return center transfers the defective product to the appropriate process to implement the disposition decision.
Metrics (see Appendix A for metrics attributes): . Cost to Deliver Return . Deliver Return Cycle Time The average time associated with returns. . Order Fulfillment Cycle Time The average actual cycle time consistently achieved to fulfill
customer orders. . Return on Supply Chain Fixed Assets Return on Supply Chain Fixed Assets measures the return an
organization receives on its invested capital in supply chain fixed assets. This includes the fixed assets used in Plan, Source, Make, Deliver, and Return. The levels of aggregation can be at any element associated with a supply chain asset.
. Return on Working Capital Return on working capital is a measurement which assesses the magnitude of investment relative to a company’s working capital position verses the revenue generated from a supply chain. Components include accounts receivable, accounts payable, inventory, supply chain revenue, cost of goods sold and supply chain management costs.
. Value of Defective Product Inventory in Deliver Return Process/ Total Defective Product Inventory Value

© Copyright 2006 Supply-Chain Council, Inc. 260 June 2006
DR1.1 Authorize Defective Product Return The process where the last known holder or designated return center receives a defective product return authorization request from a customer, determines if the item can be accepted and communicates decision to the customer. Accepting the request would include negotiating the conditions of the return with the customer, including authorizing return replacement or credit. Rejecting the request would include providing a reason for the rejection to the customer. Metrics (see Appendix A for metrics attributes): . Authorize Defective Product Return Cycle
Time The average time associated with authorizing the return of defective
product. . Cost to Authorize Defective Product Return The sum of the costs associated with authorizing the return of
defective product. . Value of Defective Product Inventory in Authorization Stage/ Total Defective Product Inventory Value Best Practices: . Communicate with Customer before the
Return to Establish What Types of Returns Are Acceptable
None identified
. Set Up Electronic or Pre-authorized Returns None identified . Use an Exchange System Where Customer
is Issued a Serviceable Item Upon Submitting an Unserviceable Item
None identified
Inputs: . Business Rules for Return Processes from
ER.1 Manage Business Rules for Return Processes
Rules for conducting business, i.e. developing and maintaining customer and channel performance standards of an return processes such as service levels, given service requirements by supply chain stakeholders/trading partners. Business rules align Return process policies with business strategy, goals, and objectives.
. Defective Product Disposition Request from SR1.3 Request Defective Return Authorization
The customer request for disposition instructions for a defective product from the appropriate source.
. Defective Product Return Authorization Request from SR1.3 Request Defective Return Authorization
The customer request for disposition instructions for a defective product from the appropriate source.
. Manage Integrated Supply Chain Inventory Information from EP.4 Manage Integrated Supply Chain Inventory
Managing the flow of raw materials and products in a supply chain based on uncertain demand for the finished products
. Product Return Capabilities from P5.4 Establish and Communicate Return Plans
The capability of a system or resources to produce a quantity output in a particular time period; and, any element or factor that constrains the system or resources from achieving a higher level of performance in respect to its goal. The ability the supply chain has to return products in a valid and accurate way.
. Return Plans from P5.4 Establish and Communicate Return Plans
Courses of action over specified time periods that represent the projected appropriation of required return resources and or assets to meet the return process requirements.
Outputs: . Defective Product Return Authorization
Response to SR1.3 Request Defective Return Authorization
The approved or disapproved Return Product Authorization (RPA) for excess inventory, unserviceable products and/or serviceable or obsolete products as defined by the terms and conditions of a customer/supplier contract.

© Copyright 2006 Supply-Chain Council, Inc. 261 June 2006
. Historical Return Rates to P5.1 Assess, and Aggregate Return Requirements
A judgmental forecasting technique based upon the a return history that is analogous to a present situation, such as the return history on a similar product, and using the past pattern to predict future returns.
. Manage Integrated Supply Chain Inventory Information to EP.4 Manage Integrated Supply Chain Inventory
Managing the flow of raw materials and products in a supply chain based on uncertain demand for the finished products
. Ship-to Data to SR1.4 Schedule Defective Product Shipment
Data about the destination of a retun delivery.
. Valid Returns Request to DR1.2 Schedule Defective Return Receipt
Requests for returns that are valid.
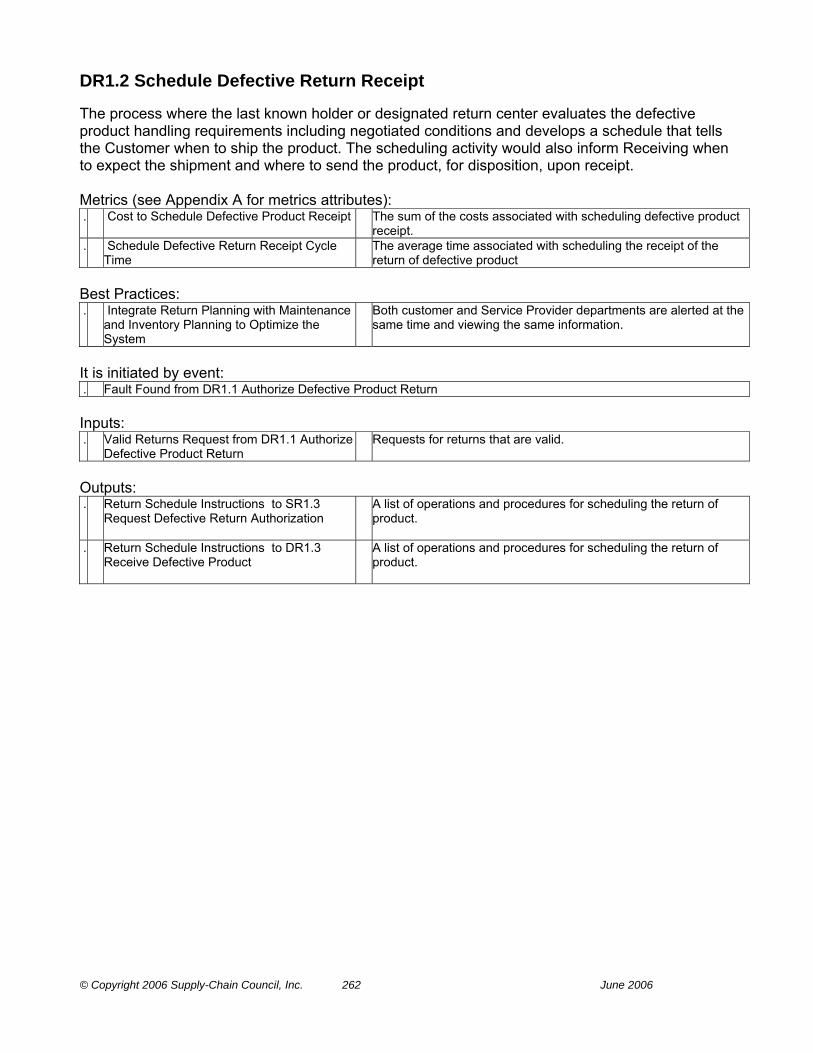
© Copyright 2006 Supply-Chain Council, Inc. 262 June 2006
DR1.2 Schedule Defective Return Receipt The process where the last known holder or designated return center evaluates the defective product handling requirements including negotiated conditions and develops a schedule that tells the Customer when to ship the product. The scheduling activity would also inform Receiving when to expect the shipment and where to send the product, for disposition, upon receipt. Metrics (see Appendix A for metrics attributes): . Cost to Schedule Defective Product Receipt The sum of the costs associated with scheduling defective product
receipt. . Schedule Defective Return Receipt Cycle
Time The average time associated with scheduling the receipt of the
return of defective product Best Practices: . Integrate Return Planning with Maintenance
and Inventory Planning to Optimize the System
Both customer and Service Provider departments are alerted at the same time and viewing the same information.
It is initiated by event: . Fault Found from DR1.1 Authorize Defective Product Return Inputs: . Valid Returns Request from DR1.1 Authorize
Defective Product Return Requests for returns that are valid.
Outputs: . Return Schedule Instructions to SR1.3
Request Defective Return Authorization A list of operations and procedures for scheduling the return of
product.
. Return Schedule Instructions to DR1.3 Receive Defective Product
A list of operations and procedures for scheduling the return of product.
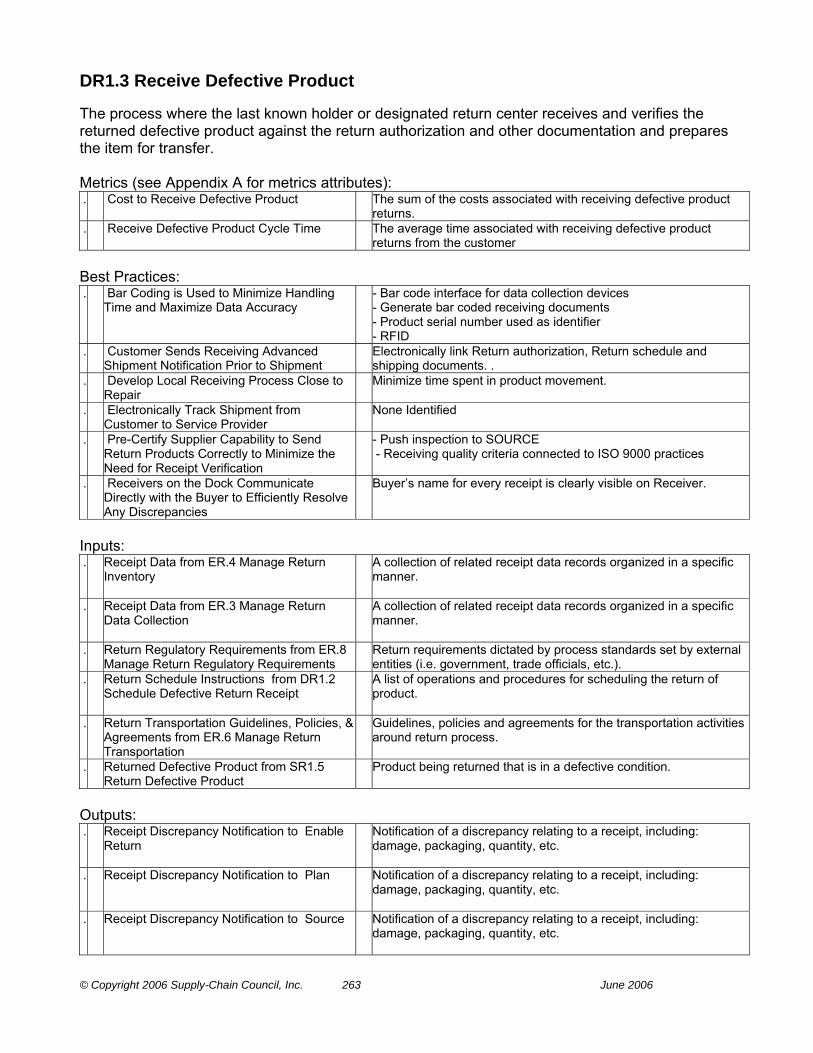
© Copyright 2006 Supply-Chain Council, Inc. 263 June 2006
DR1.3 Receive Defective Product The process where the last known holder or designated return center receives and verifies the returned defective product against the return authorization and other documentation and prepares the item for transfer. Metrics (see Appendix A for metrics attributes): . Cost to Receive Defective Product The sum of the costs associated with receiving defective product
returns. . Receive Defective Product Cycle Time The average time associated with receiving defective product
returns from the customer Best Practices: . Bar Coding is Used to Minimize Handling
Time and Maximize Data Accuracy - Bar code interface for data collection devices
- Generate bar coded receiving documents - Product serial number used as identifier - RFID
. Customer Sends Receiving Advanced Shipment Notification Prior to Shipment
Electronically link Return authorization, Return schedule and shipping documents. .
. Develop Local Receiving Process Close to Repair
Minimize time spent in product movement.
. Electronically Track Shipment from Customer to Service Provider
None Identified
. Pre-Certify Supplier Capability to Send Return Products Correctly to Minimize the Need for Receipt Verification
- Push inspection to SOURCE - Receiving quality criteria connected to ISO 9000 practices
. Receivers on the Dock Communicate Directly with the Buyer to Efficiently Resolve Any Discrepancies
Buyer’s name for every receipt is clearly visible on Receiver.
Inputs: . Receipt Data from ER.4 Manage Return
Inventory A collection of related receipt data records organized in a specific
manner.
. Receipt Data from ER.3 Manage Return Data Collection
A collection of related receipt data records organized in a specific manner.
. Return Regulatory Requirements from ER.8 Manage Return Regulatory Requirements
Return requirements dictated by process standards set by external entities (i.e. government, trade officials, etc.).
. Return Schedule Instructions from DR1.2 Schedule Defective Return Receipt
A list of operations and procedures for scheduling the return of product.
. Return Transportation Guidelines, Policies, & Agreements from ER.6 Manage Return Transportation
Guidelines, policies and agreements for the transportation activities around return process.
. Returned Defective Product from SR1.5 Return Defective Product
Product being returned that is in a defective condition.
Outputs: . Receipt Discrepancy Notification to Enable
Return Notification of a discrepancy relating to a receipt, including:
damage, packaging, quantity, etc.
. Receipt Discrepancy Notification to Plan Notification of a discrepancy relating to a receipt, including: damage, packaging, quantity, etc.
. Receipt Discrepancy Notification to Source Notification of a discrepancy relating to a receipt, including: damage, packaging, quantity, etc.

© Copyright 2006 Supply-Chain Council, Inc. 264 June 2006
. Return Inventory Transfer Data to ER.4 Manage Return Inventory
The process of receipt and verification of the returned item against the return authorization and other documentation and prepares the item for transfer.
. Return Inventory Transfer Data to P5.2 Identify, Assess, and Aggregate Return Resources
The process of receipt and verification of the returned item against the return authorization and other documentation and prepares the item for transfer.
. Returned Defective Product to DR1.4 Transfer Defective Product
Product being returned that is in a defective condition.

© Copyright 2006 Supply-Chain Council, Inc. 265 June 2006
DR1.4 Transfer Defective Product The process where the last known holder or designated return center transfers the defective product to the appropriate process to implement the disposition decision. Metrics (see Appendix A for metrics attributes): . Cost to Transfer Defective Product The sum of the costs associated transferring defective product for
disposition . Transfer Defective Product Cycle Time The average time associated transfer until product is moved to the
next process. Best Practices: . Defective Products Scheduling Identifies
Next Destination (Source, Make, or Deliver) on Return Authorization
Utilize electronic links
. Receiving Equipment and Packaging Materials to Transfer Product Are Planned for In Advance and Readily Available When Needed
Include packaging materials in inventory management system and treat as any other inventory to minimize potential of stock-out.
. Return Process Electronically Tracks Transfer from Station to Station
Utilize Bar coding
. Review Transfer Cycle Time Trends and Determine If Equipment Capacity is Properly Balanced with Projected Usage
Periodic review of capital asset plan to determine if additional equipment, if needed, can be funded.
Inputs: . Return Inventory for Transfer from ER.4
Manage Return Inventory Inventory relative to return process available for transfer to other
destination.
. Returned Defective Product from DR1.3 Receive Defective Product
Product being returned that is in a defective condition.
. Sourcing Plans from P2.4 Establish Sourcing Plans
An aggregate material requirements plan used to schedule material deliveries to meet production plan.
Outputs: . Defective Products to S1.2 Receive Product Maintenance, Repair and Overhaul spare parts used to support of
operations and maintenance.
. Defective Products to S2.2 Receive Product Maintenance, Repair and Overhaul spare parts used to support of operations and maintenance.
. Return Inventory Transfer Data to P5.2 Identify, Assess, and Aggregate Return Resources
The process of receipt and verification of the returned item against the return authorization and other documentation and prepares the item for transfer.
. Return Inventory Transfer Data to S1.1 Schedule Product Deliveries
The process of receipt and verification of the returned item against the return authorization and other documentation and prepares the item for transfer.
. Return Inventory Transfer Data to S3.3 Schedule Product Deliveries
The process of receipt and verification of the returned item against the return authorization and other documentation and prepares the item for transfer.
. Return Inventory Transfer Data to ER.4 Manage Return Inventory
The process of receipt and verification of the returned item against the return authorization and other documentation and prepares the item for transfer.
. Return Inventory Transfer Data to S2.1 Schedule Product Deliveries
The process of receipt and verification of the returned item against the return authorization and other documentation and prepares the item for transfer.
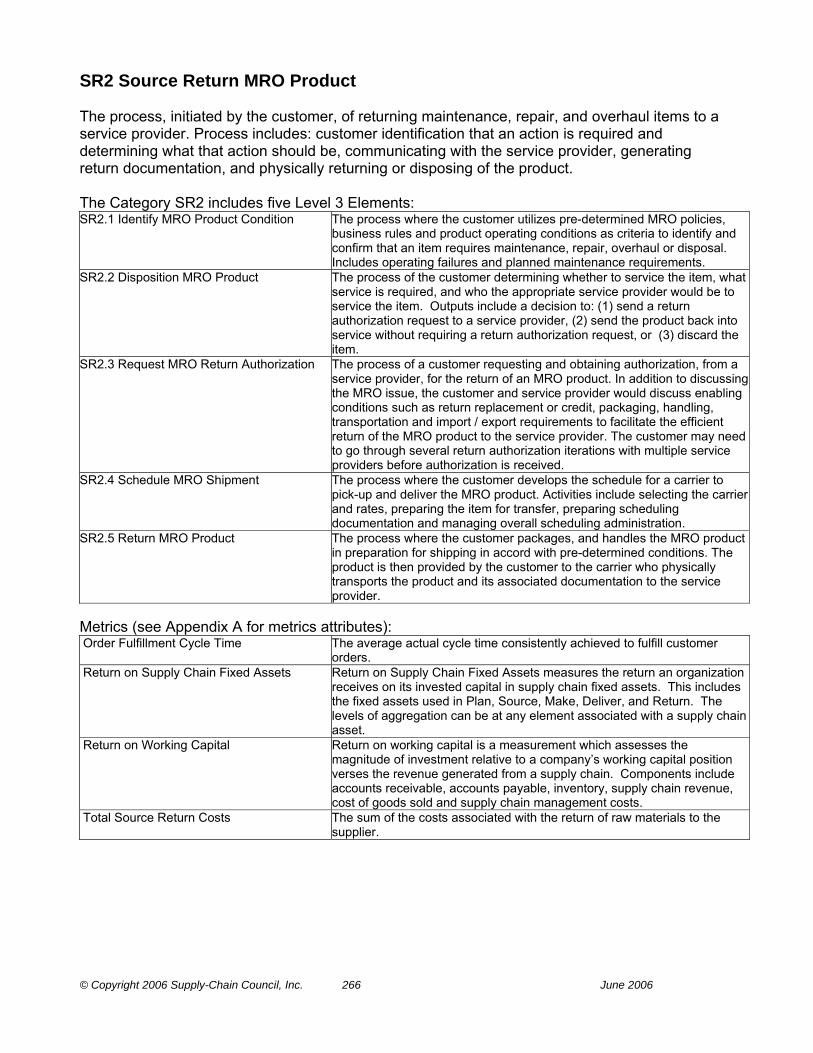
© Copyright 2006 Supply-Chain Council, Inc. 266 June 2006
SR2 Source Return MRO Product The process, initiated by the customer, of returning maintenance, repair, and overhaul items to a service provider. Process includes: customer identification that an action is required and determining what that action should be, communicating with the service provider, generating return documentation, and physically returning or disposing of the product. The Category SR2 includes five Level 3 Elements: SR2.1 Identify MRO Product Condition The process where the customer utilizes pre-determined MRO policies,
business rules and product operating conditions as criteria to identify and confirm that an item requires maintenance, repair, overhaul or disposal. Includes operating failures and planned maintenance requirements.
SR2.2 Disposition MRO Product The process of the customer determining whether to service the item, what service is required, and who the appropriate service provider would be to service the item. Outputs include a decision to: (1) send a return authorization request to a service provider, (2) send the product back into service without requiring a return authorization request, or (3) discard the item.
SR2.3 Request MRO Return Authorization The process of a customer requesting and obtaining authorization, from a service provider, for the return of an MRO product. In addition to discussing the MRO issue, the customer and service provider would discuss enabling conditions such as return replacement or credit, packaging, handling, transportation and import / export requirements to facilitate the efficient return of the MRO product to the service provider. The customer may need to go through several return authorization iterations with multiple service providers before authorization is received.
SR2.4 Schedule MRO Shipment The process where the customer develops the schedule for a carrier to pick-up and deliver the MRO product. Activities include selecting the carrier and rates, preparing the item for transfer, preparing scheduling documentation and managing overall scheduling administration.
SR2.5 Return MRO Product The process where the customer packages, and handles the MRO product in preparation for shipping in accord with pre-determined conditions. The product is then provided by the customer to the carrier who physically transports the product and its associated documentation to the service provider.
Metrics (see Appendix A for metrics attributes): Order Fulfillment Cycle Time The average actual cycle time consistently achieved to fulfill customer
orders. Return on Supply Chain Fixed Assets Return on Supply Chain Fixed Assets measures the return an organization
receives on its invested capital in supply chain fixed assets. This includes the fixed assets used in Plan, Source, Make, Deliver, and Return. The levels of aggregation can be at any element associated with a supply chain asset.
Return on Working Capital Return on working capital is a measurement which assesses the magnitude of investment relative to a company’s working capital position verses the revenue generated from a supply chain. Components include accounts receivable, accounts payable, inventory, supply chain revenue, cost of goods sold and supply chain management costs.
Total Source Return Costs The sum of the costs associated with the return of raw materials to the supplier.
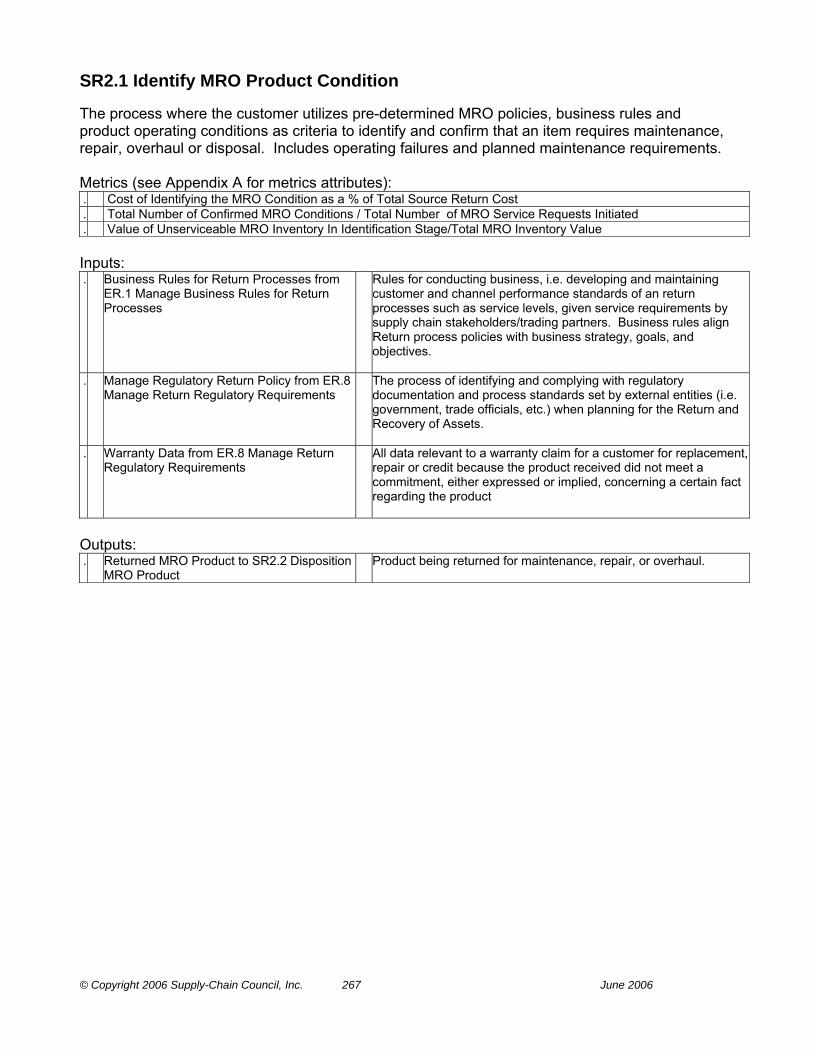
© Copyright 2006 Supply-Chain Council, Inc. 267 June 2006
SR2.1 Identify MRO Product Condition The process where the customer utilizes pre-determined MRO policies, business rules and product operating conditions as criteria to identify and confirm that an item requires maintenance, repair, overhaul or disposal. Includes operating failures and planned maintenance requirements. Metrics (see Appendix A for metrics attributes): . Cost of Identifying the MRO Condition as a % of Total Source Return Cost . Total Number of Confirmed MRO Conditions / Total Number of MRO Service Requests Initiated . Value of Unserviceable MRO Inventory In Identification Stage/Total MRO Inventory Value Inputs: . Business Rules for Return Processes from
ER.1 Manage Business Rules for Return Processes
Rules for conducting business, i.e. developing and maintaining customer and channel performance standards of an return processes such as service levels, given service requirements by supply chain stakeholders/trading partners. Business rules align Return process policies with business strategy, goals, and objectives.
. Manage Regulatory Return Policy from ER.8 Manage Return Regulatory Requirements
The process of identifying and complying with regulatory documentation and process standards set by external entities (i.e. government, trade officials, etc.) when planning for the Return and Recovery of Assets.
. Warranty Data from ER.8 Manage Return Regulatory Requirements
All data relevant to a warranty claim for a customer for replacement, repair or credit because the product received did not meet a commitment, either expressed or implied, concerning a certain fact regarding the product
Outputs: . Returned MRO Product to SR2.2 Disposition
MRO Product Product being returned for maintenance, repair, or overhaul.

© Copyright 2006 Supply-Chain Council, Inc. 268 June 2006
SR2.2 Disposition MRO Product The process of the customer determining whether to service the item, what service is required, and who the appropriate service provider would be to service the item. Outputs include a decision to: (1) send a return authorization request to a service provider, (2) send the product back into service without requiring a return authorization request, or (3) discard the item. Metrics (see Appendix A for metrics attributes): . % Identified MRO Products Returned to Service . MRO Disposition Costs as % Total Source Return Cost . Value of Defective Inventory in Disposition
Stage/ Total Inventory Value Inventory Awaiting Return
. Value of Unserviceable MRO Inventory In Disposition Stage/ Total MRO Inventory Value
Inventory awaiting disposition
Inputs: . Return Plans from P5.4 Establish and
Communicate Return Plans Courses of action over specified time periods that represent the
projected appropriation of required return resources and or assets to meet the return process requirements.
. Returned MRO Product from SR2.1 Identify MRO Product Condition
Product being returned for maintenance, repair, or overhaul.
Outputs: . Authorization to Return to Service to D1.8
Receive Product from Source or Make Permission to return to service an item that has been repaired and
found to be within specifications and operable.
. Authorization to Scrap to D1.8 Receive Product from Source or Make
Permission to scrap material or item outside of specifications and possessing characteristics that make rework impractical.
. Return Inventory Availability to ER.4 Manage Return Inventory
Inventory relative to return process available for use.
. Returned MRO Product to SR2.3 Request MRO Return Authorization
Product being returned for maintenance, repair, or overhaul.
. Returned Product Location to ER.4 Manage Return Inventory
The storage location of those items being returned.
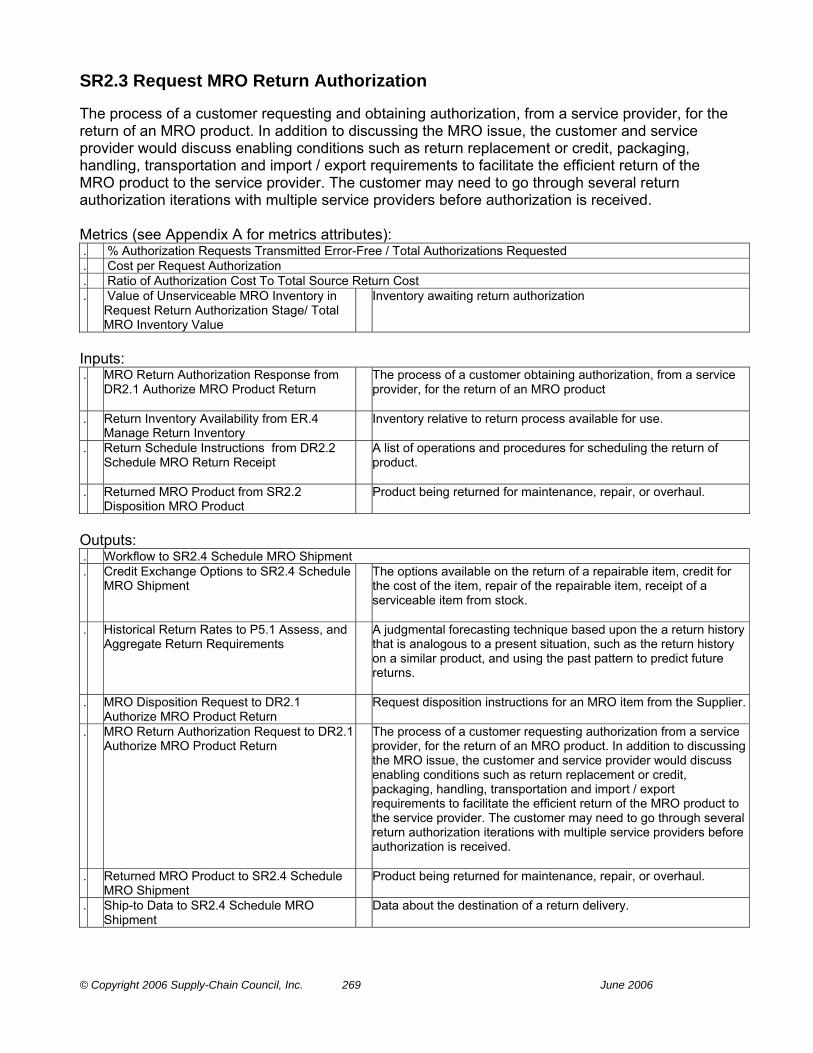
© Copyright 2006 Supply-Chain Council, Inc. 269 June 2006
SR2.3 Request MRO Return Authorization The process of a customer requesting and obtaining authorization, from a service provider, for the return of an MRO product. In addition to discussing the MRO issue, the customer and service provider would discuss enabling conditions such as return replacement or credit, packaging, handling, transportation and import / export requirements to facilitate the efficient return of the MRO product to the service provider. The customer may need to go through several return authorization iterations with multiple service providers before authorization is received. Metrics (see Appendix A for metrics attributes): . % Authorization Requests Transmitted Error-Free / Total Authorizations Requested . Cost per Request Authorization . Ratio of Authorization Cost To Total Source Return Cost . Value of Unserviceable MRO Inventory in
Request Return Authorization Stage/ Total MRO Inventory Value
Inventory awaiting return authorization
Inputs: . MRO Return Authorization Response from
DR2.1 Authorize MRO Product Return The process of a customer obtaining authorization, from a service
provider, for the return of an MRO product
. Return Inventory Availability from ER.4 Manage Return Inventory
Inventory relative to return process available for use.
. Return Schedule Instructions from DR2.2 Schedule MRO Return Receipt
A list of operations and procedures for scheduling the return of product.
. Returned MRO Product from SR2.2 Disposition MRO Product
Product being returned for maintenance, repair, or overhaul.
Outputs: . Workflow to SR2.4 Schedule MRO Shipment . Credit Exchange Options to SR2.4 Schedule
MRO Shipment The options available on the return of a repairable item, credit for
the cost of the item, repair of the repairable item, receipt of a serviceable item from stock.
. Historical Return Rates to P5.1 Assess, and Aggregate Return Requirements
A judgmental forecasting technique based upon the a return history that is analogous to a present situation, such as the return history on a similar product, and using the past pattern to predict future returns.
. MRO Disposition Request to DR2.1 Authorize MRO Product Return
Request disposition instructions for an MRO item from the Supplier.
. MRO Return Authorization Request to DR2.1 Authorize MRO Product Return
The process of a customer requesting authorization from a service provider, for the return of an MRO product. In addition to discussing the MRO issue, the customer and service provider would discuss enabling conditions such as return replacement or credit, packaging, handling, transportation and import / export requirements to facilitate the efficient return of the MRO product to the service provider. The customer may need to go through several return authorization iterations with multiple service providers before authorization is received.
. Returned MRO Product to SR2.4 Schedule MRO Shipment
Product being returned for maintenance, repair, or overhaul.
. Ship-to Data to SR2.4 Schedule MRO Shipment
Data about the destination of a return delivery.
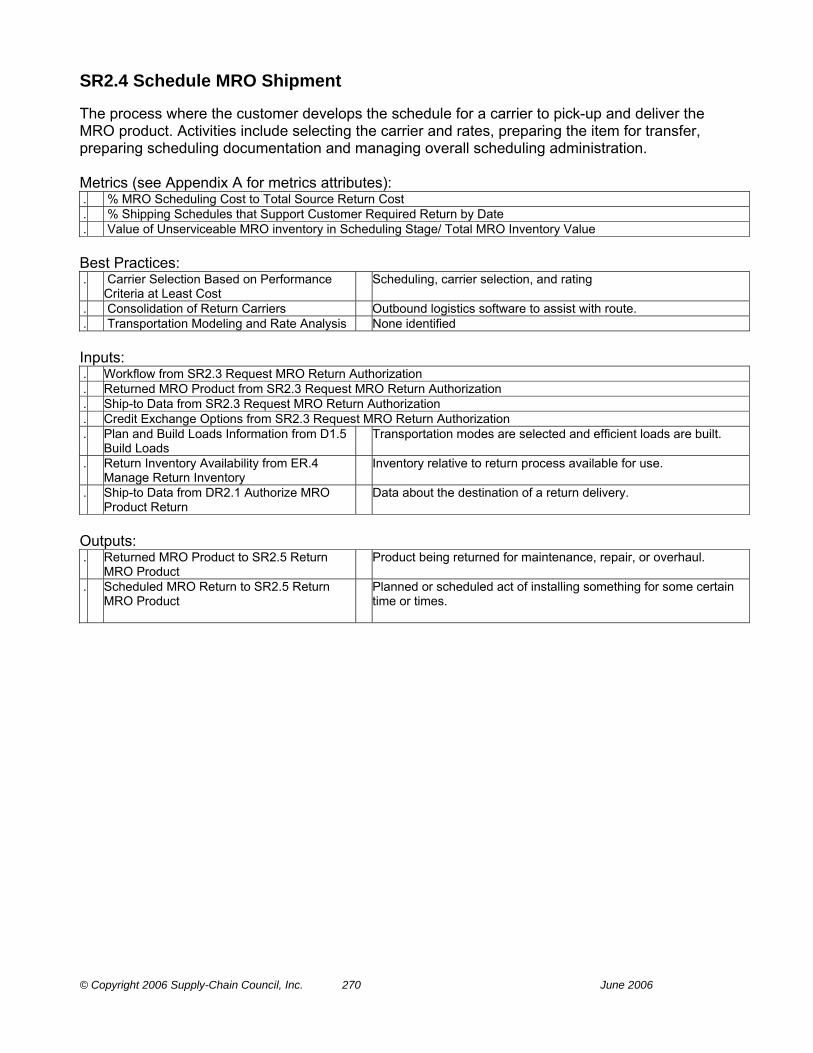
© Copyright 2006 Supply-Chain Council, Inc. 270 June 2006
SR2.4 Schedule MRO Shipment The process where the customer develops the schedule for a carrier to pick-up and deliver the MRO product. Activities include selecting the carrier and rates, preparing the item for transfer, preparing scheduling documentation and managing overall scheduling administration. Metrics (see Appendix A for metrics attributes): . % MRO Scheduling Cost to Total Source Return Cost . % Shipping Schedules that Support Customer Required Return by Date . Value of Unserviceable MRO inventory in Scheduling Stage/ Total MRO Inventory Value Best Practices: . Carrier Selection Based on Performance
Criteria at Least Cost Scheduling, carrier selection, and rating
. Consolidation of Return Carriers Outbound logistics software to assist with route. . Transportation Modeling and Rate Analysis None identified Inputs: . Workflow from SR2.3 Request MRO Return Authorization . Returned MRO Product from SR2.3 Request MRO Return Authorization . Ship-to Data from SR2.3 Request MRO Return Authorization . Credit Exchange Options from SR2.3 Request MRO Return Authorization . Plan and Build Loads Information from D1.5
Build Loads Transportation modes are selected and efficient loads are built.
. Return Inventory Availability from ER.4
Manage Return Inventory Inventory relative to return process available for use.
. Ship-to Data from DR2.1 Authorize MRO
Product Return Data about the destination of a return delivery.
Outputs: . Returned MRO Product to SR2.5 Return
MRO Product Product being returned for maintenance, repair, or overhaul.
. Scheduled MRO Return to SR2.5 Return
MRO Product Planned or scheduled act of installing something for some certain
time or times.
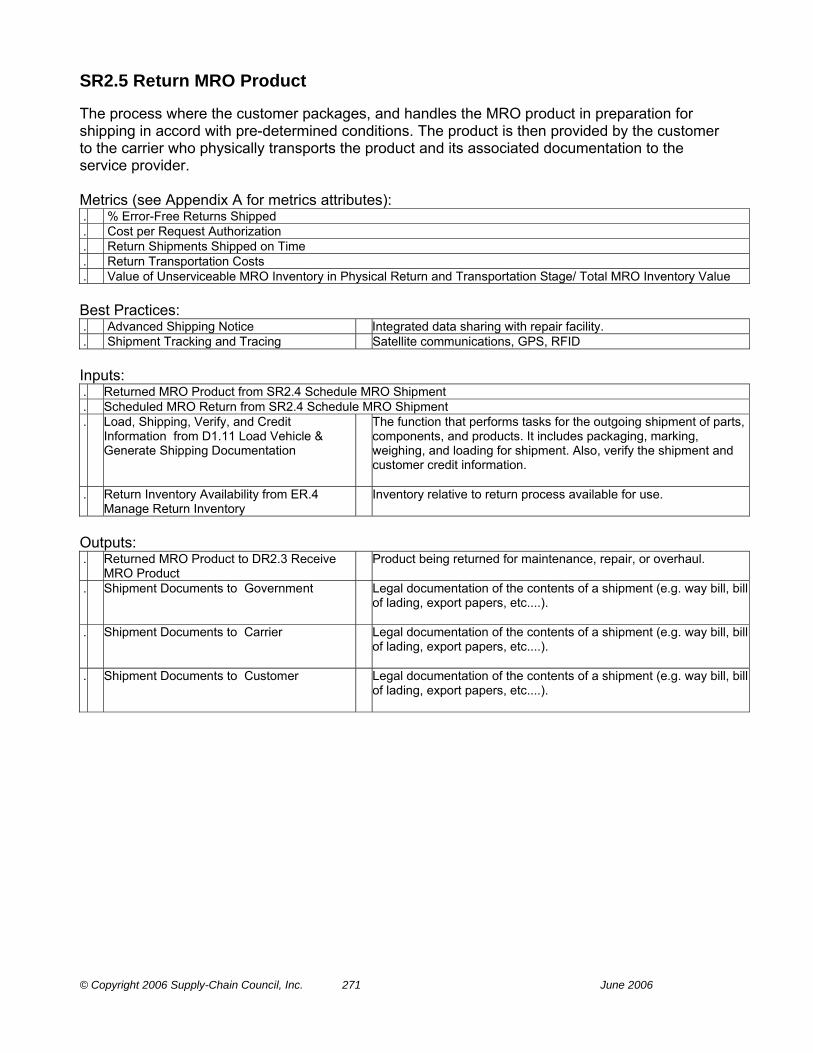
© Copyright 2006 Supply-Chain Council, Inc. 271 June 2006
SR2.5 Return MRO Product The process where the customer packages, and handles the MRO product in preparation for shipping in accord with pre-determined conditions. The product is then provided by the customer to the carrier who physically transports the product and its associated documentation to the service provider. Metrics (see Appendix A for metrics attributes): . % Error-Free Returns Shipped . Cost per Request Authorization . Return Shipments Shipped on Time . Return Transportation Costs . Value of Unserviceable MRO Inventory in Physical Return and Transportation Stage/ Total MRO Inventory Value Best Practices: . Advanced Shipping Notice Integrated data sharing with repair facility. . Shipment Tracking and Tracing Satellite communications, GPS, RFID Inputs: . Returned MRO Product from SR2.4 Schedule MRO Shipment . Scheduled MRO Return from SR2.4 Schedule MRO Shipment . Load, Shipping, Verify, and Credit
Information from D1.11 Load Vehicle & Generate Shipping Documentation
The function that performs tasks for the outgoing shipment of parts, components, and products. It includes packaging, marking, weighing, and loading for shipment. Also, verify the shipment and customer credit information.
. Return Inventory Availability from ER.4 Manage Return Inventory
Inventory relative to return process available for use.
Outputs: . Returned MRO Product to DR2.3 Receive
MRO Product Product being returned for maintenance, repair, or overhaul.
. Shipment Documents to Government Legal documentation of the contents of a shipment (e.g. way bill, bill
of lading, export papers, etc....).
. Shipment Documents to Carrier Legal documentation of the contents of a shipment (e.g. way bill, bill of lading, export papers, etc....).
. Shipment Documents to Customer Legal documentation of the contents of a shipment (e.g. way bill, bill of lading, export papers, etc....).

© Copyright 2006 Supply-Chain Council, Inc. 272 June 2006
DR2 Deliver Return MRO Product The processes of the service provider authorizing and scheduling the MRO return product and the physical receipt of the item by the service provider and their transfer of the item for final disposition determination. The process includes communication between the customer and service provider and the generation of associated documentation. The Category DR2 includes four Level 3 Elements: DR2.1 Authorize MRO Product Return The process where a service provider receives an MRO product return
authorization request from a customer, determines if the item can be accepted for MRO and communicates their decision to the customer. Accepting the request would include negotiating the conditions of the return with the customer, including authorizing return replacement or credit. Rejecting the request would include providing a reason for the rejection to the customer.
DR2.2 Schedule MRO Return Receipt The process where the service provider evaluates the MRO service requirements including negotiated conditions and develops a schedule that tells the Customer when to ship the part. The scheduling activity would also inform Receiving when to expect the shipment and where to send the part, for induction or storage, upon receipt.
DR2.3 Receive MRO Product The process where the service provider receives and verifies the returned MRO item against the return authorization and other documentation and prepares the item for transfer (includes verify).
DR2.4 Transfer MRO Product The process where the service provider transfers the MRO product to the appropriate process to implement the disposition decision.
Metrics (see Appendix A for metrics attributes): % of MRO Returns Delivered to the Correct Service Provider Location, within Schedule, with the Correct Part and Documentation
Cost to Deliver Return Deliver Return Cycle Time The average time associated with returns. Order Fulfillment Cycle Time The average actual cycle time consistently achieved to fulfill customer
orders. Return on Supply Chain Fixed Assets Return on Supply Chain Fixed Assets measures the return an organization
receives on its invested capital in supply chain fixed assets. This includes the fixed assets used in Plan, Source, Make, Deliver, and Return. The levels of aggregation can be at any element associated with a supply chain asset.
Return on Working Capital Return on working capital is a measurement which assesses the magnitude of investment relative to a company’s working capital position verses the revenue generated from a supply chain. Components include accounts receivable, accounts payable, inventory, supply chain revenue, cost of goods sold and supply chain management costs.
Upside Deliver Return Adaptability The maximum sustainable percentage increase in returns of finished goods from customers that can be achieved in 30 days.
Upside Deliver Return Flexibility The number of days required to achieve an unplanned sustainable 20% increase in the return of finished goods from customers.
Value of Unserviceable MRO Inventory in Deliver Return Process/ Total MRO Inventory Value
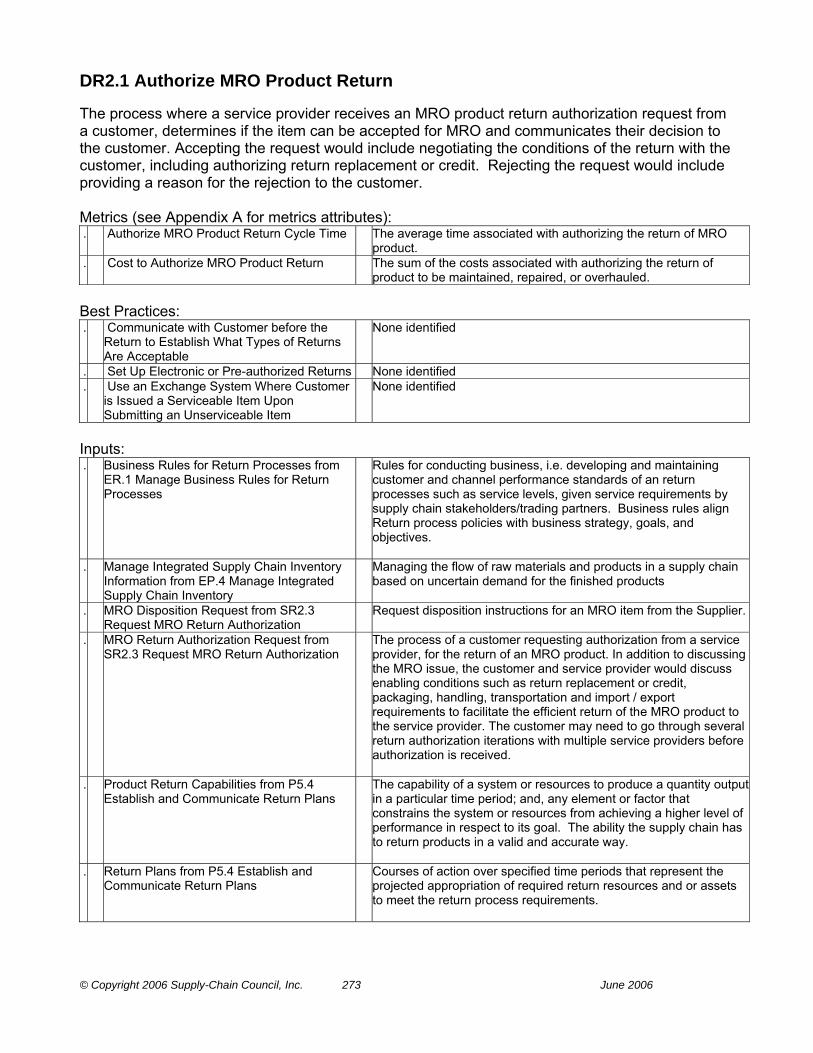
© Copyright 2006 Supply-Chain Council, Inc. 273 June 2006
DR2.1 Authorize MRO Product Return The process where a service provider receives an MRO product return authorization request from a customer, determines if the item can be accepted for MRO and communicates their decision to the customer. Accepting the request would include negotiating the conditions of the return with the customer, including authorizing return replacement or credit. Rejecting the request would include providing a reason for the rejection to the customer. Metrics (see Appendix A for metrics attributes): . Authorize MRO Product Return Cycle Time The average time associated with authorizing the return of MRO
product. . Cost to Authorize MRO Product Return The sum of the costs associated with authorizing the return of
product to be maintained, repaired, or overhauled. Best Practices: . Communicate with Customer before the
Return to Establish What Types of Returns Are Acceptable
None identified
. Set Up Electronic or Pre-authorized Returns None identified . Use an Exchange System Where Customer
is Issued a Serviceable Item Upon Submitting an Unserviceable Item
None identified
Inputs: . Business Rules for Return Processes from
ER.1 Manage Business Rules for Return Processes
Rules for conducting business, i.e. developing and maintaining customer and channel performance standards of an return processes such as service levels, given service requirements by supply chain stakeholders/trading partners. Business rules align Return process policies with business strategy, goals, and objectives.
. Manage Integrated Supply Chain Inventory Information from EP.4 Manage Integrated Supply Chain Inventory
Managing the flow of raw materials and products in a supply chain based on uncertain demand for the finished products
. MRO Disposition Request from SR2.3 Request MRO Return Authorization
Request disposition instructions for an MRO item from the Supplier.
. MRO Return Authorization Request from SR2.3 Request MRO Return Authorization
The process of a customer requesting authorization from a service provider, for the return of an MRO product. In addition to discussing the MRO issue, the customer and service provider would discuss enabling conditions such as return replacement or credit, packaging, handling, transportation and import / export requirements to facilitate the efficient return of the MRO product to the service provider. The customer may need to go through several return authorization iterations with multiple service providers before authorization is received.
. Product Return Capabilities from P5.4 Establish and Communicate Return Plans
The capability of a system or resources to produce a quantity output in a particular time period; and, any element or factor that constrains the system or resources from achieving a higher level of performance in respect to its goal. The ability the supply chain has to return products in a valid and accurate way.
. Return Plans from P5.4 Establish and Communicate Return Plans
Courses of action over specified time periods that represent the projected appropriation of required return resources and or assets to meet the return process requirements.
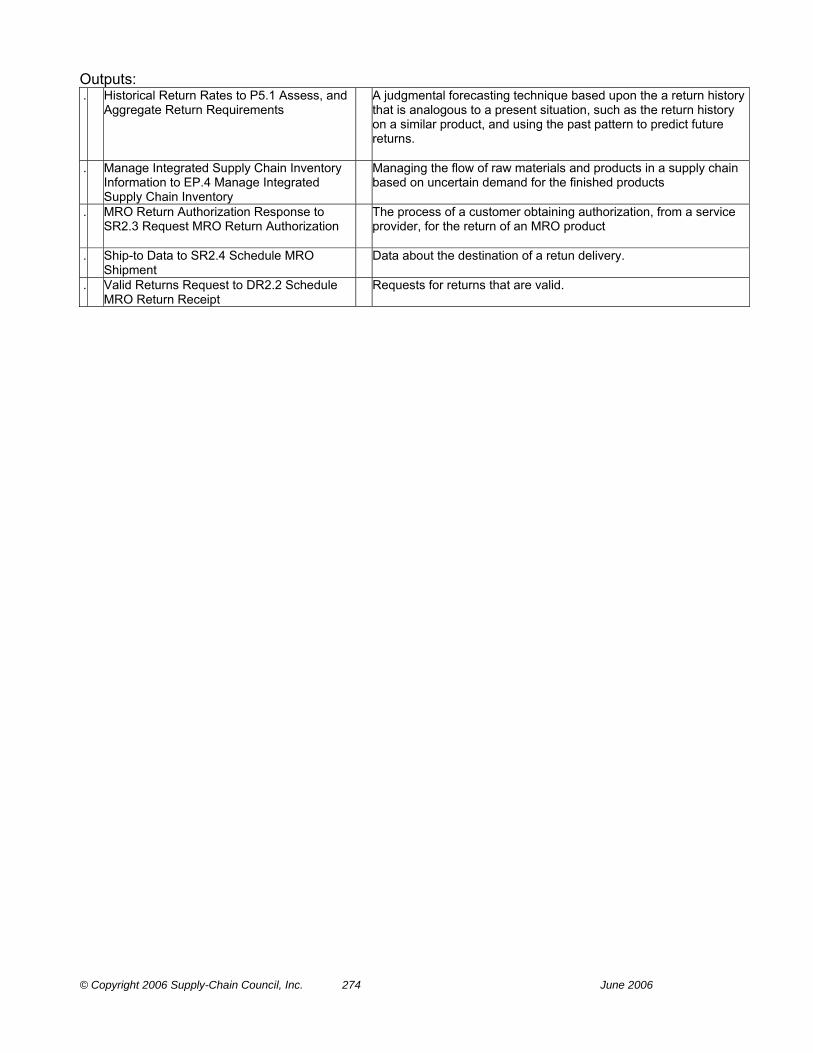
© Copyright 2006 Supply-Chain Council, Inc. 274 June 2006
Outputs: . Historical Return Rates to P5.1 Assess, and
Aggregate Return Requirements A judgmental forecasting technique based upon the a return history
that is analogous to a present situation, such as the return history on a similar product, and using the past pattern to predict future returns.
. Manage Integrated Supply Chain Inventory Information to EP.4 Manage Integrated Supply Chain Inventory
Managing the flow of raw materials and products in a supply chain based on uncertain demand for the finished products
. MRO Return Authorization Response to SR2.3 Request MRO Return Authorization
The process of a customer obtaining authorization, from a service provider, for the return of an MRO product
. Ship-to Data to SR2.4 Schedule MRO Shipment
Data about the destination of a retun delivery.
. Valid Returns Request to DR2.2 Schedule MRO Return Receipt
Requests for returns that are valid.
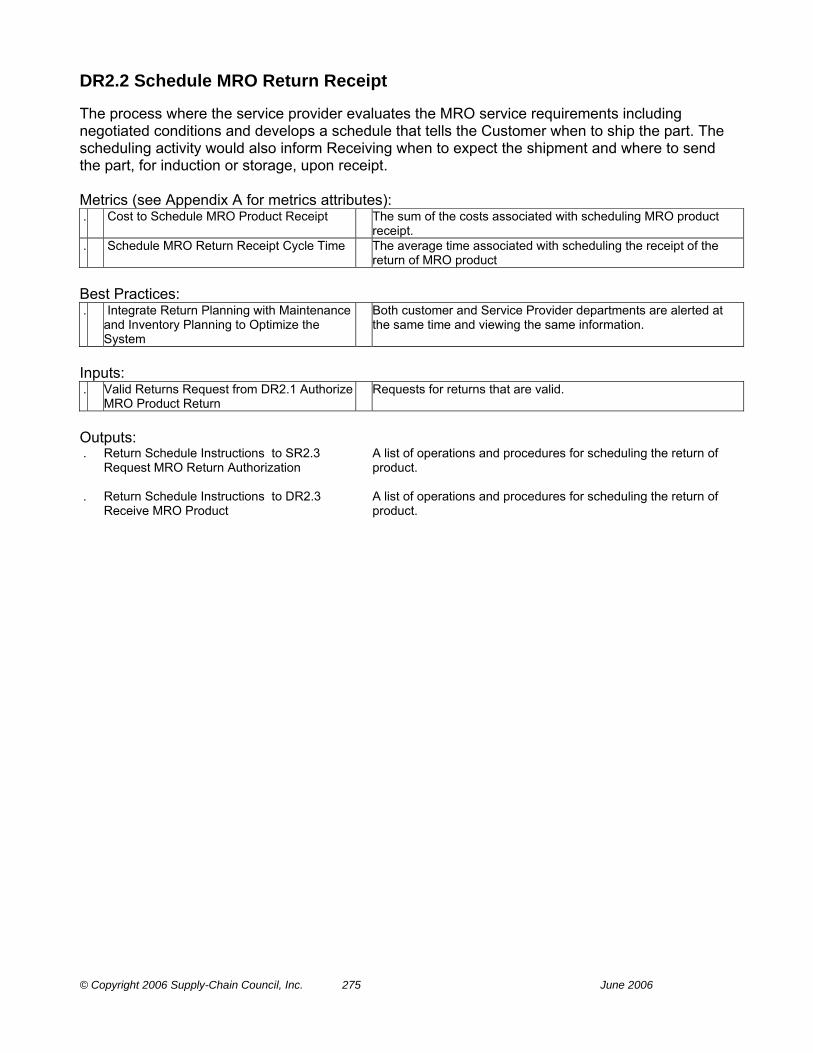
© Copyright 2006 Supply-Chain Council, Inc. 275 June 2006
DR2.2 Schedule MRO Return Receipt The process where the service provider evaluates the MRO service requirements including negotiated conditions and develops a schedule that tells the Customer when to ship the part. The scheduling activity would also inform Receiving when to expect the shipment and where to send the part, for induction or storage, upon receipt. Metrics (see Appendix A for metrics attributes): . Cost to Schedule MRO Product Receipt The sum of the costs associated with scheduling MRO product
receipt. . Schedule MRO Return Receipt Cycle Time The average time associated with scheduling the receipt of the
return of MRO product Best Practices: . Integrate Return Planning with Maintenance
and Inventory Planning to Optimize the System
Both customer and Service Provider departments are alerted at the same time and viewing the same information.
Inputs: . Valid Returns Request from DR2.1 Authorize
MRO Product Return Requests for returns that are valid.
Outputs: . Return Schedule Instructions to SR2.3
Request MRO Return Authorization A list of operations and procedures for scheduling the return of
product.
. Return Schedule Instructions to DR2.3 Receive MRO Product
A list of operations and procedures for scheduling the return of product.

© Copyright 2006 Supply-Chain Council, Inc. 276 June 2006
DR2.3 Receive MRO Product The process where the service provider receives and verifies the returned MRO item against the return authorization and other documentation and prepares the item for transfer (includes verify). Metrics (see Appendix A for metrics attributes): . Cost to Receive MRO Product The sum of the costs associated with receiving MRO product
returns. . Receive MRO Product Cycle Time The average time associated with receiving MRO product returns
from the customer Best Practices: . Bar Coding is Used to Minimize Handling
Time and Maximize Data Accuracy - Bar code interface for data collection devices
- Generate bar coded receiving documents - Product serial number used as identifier - RFID
. Customer Sends Receiving Advanced Shipment Notification Prior to Shipment
Electronically link Return authorization, Return schedule and shipping documents. .
. Develop Local Receiving Process Close to Repair
Minimize time spent in product movement.
. Electronically Track Shipment from Customer to Service Provider
None Identified
. Pre-Certify Supplier Capability to Send Return Products Correctly to Minimize the Need for Receipt Verification
- Push inspection to SOURCE - Receiving quality criteria connected to ISO 9000 practices
. Receivers on the Dock Communicate Directly with the Buyer to Efficiently Resolve Any Discrepancies
Buyer’s name for every receipt is clearly visible on Receiver.
Inputs: . Receipt Data from ER.4 Manage Return
Inventory A collection of related receipt data records organized in a specific
manner.
. Receipt Data from ER.3 Manage Return Data Collection
A collection of related receipt data records organized in a specific manner.
. Return Regulatory Requirements from ER.8 Manage Return Regulatory Requirements
Return requirements dictated by process standards set by external entities (i.e. government, trade officials, etc.).
. Return Schedule Instructions from DR2.2 Schedule MRO Return Receipt
A list of operations and procedures for scheduling the return of product.
. Return Transportation Guidelines, Policies, & Agreements from ER.6 Manage Return Transportation
Guidelines, policies and agreements for the transportation activities around return process.
. Returned MRO Product from SR2.5 Return MRO Product
Product being returned for maintenance, repair, or overhaul.
Outputs: . Receipt Discrepancy Notification to Enable
Return Notification of a discrepancy relating to a receipt, including:
damage, packaging, quantity, etc.
. Receipt Discrepancy Notification to Plan Notification of a discrepancy relating to a receipt, including: damage, packaging, quantity, etc.
. Receipt Discrepancy Notification to Source Notification of a discrepancy relating to a receipt, including: damage, packaging, quantity, etc.
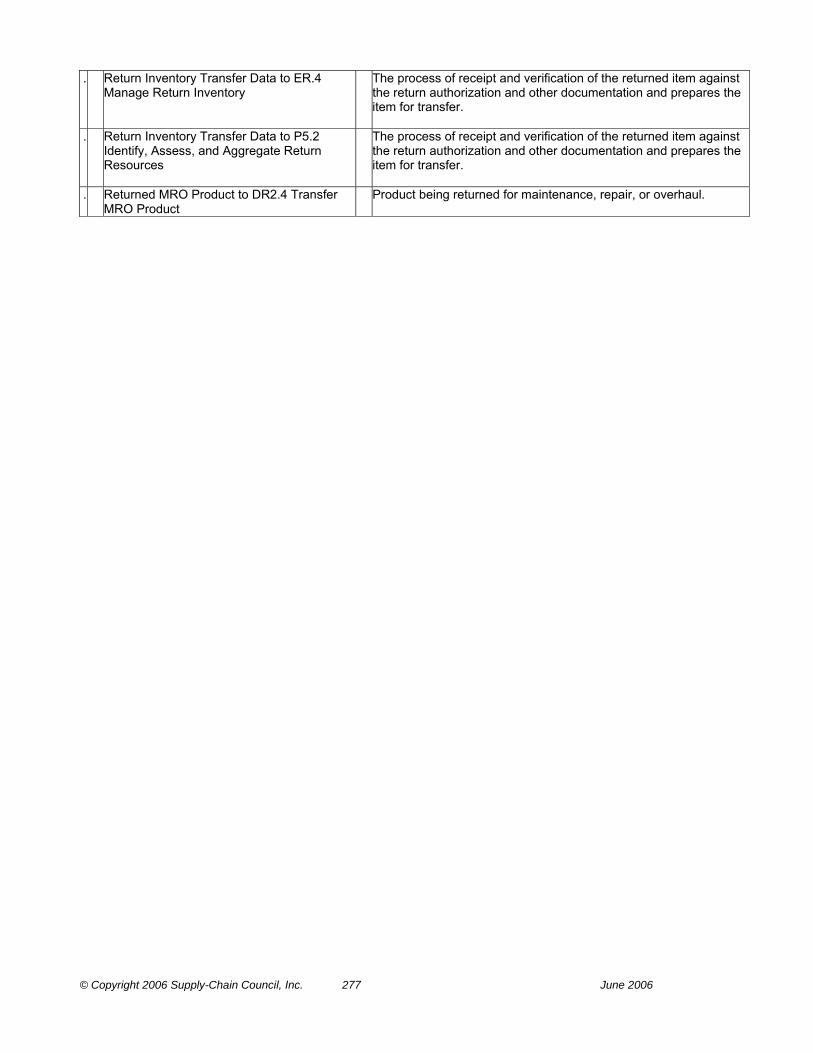
© Copyright 2006 Supply-Chain Council, Inc. 277 June 2006
. Return Inventory Transfer Data to ER.4 Manage Return Inventory
The process of receipt and verification of the returned item against the return authorization and other documentation and prepares the item for transfer.
. Return Inventory Transfer Data to P5.2 Identify, Assess, and Aggregate Return Resources
The process of receipt and verification of the returned item against the return authorization and other documentation and prepares the item for transfer.
. Returned MRO Product to DR2.4 Transfer MRO Product
Product being returned for maintenance, repair, or overhaul.

© Copyright 2006 Supply-Chain Council, Inc. 278 June 2006
DR2.4 Transfer MRO Product The process where the service provider transfers the MRO product to the appropriate process to implement the disposition decision. Metrics (see Appendix A for metrics attributes): . Cost to Transfer MRO Product The sum of the costs associated transferring MRO product for
disposition . Transfer MRO Product Cycle Time The average time associated transfer until product is moved to the
next process. Best Practices: . MRO Scheduling Identifies Next Destination
(Stores or Repair Station) on Return Authorization
Utilize electronic links
. Receiving Equipment and Packaging Materials to Transfer Product Are Planned for In Advance and Readily Available When Needed
Include packaging materials in inventory management system and treat as any other inventory to minimize potential of stock-out.
. Return Process Electronically Tracks Transfer from Station to Station
Utilize Bar coding
. Review Transfer Cycle Time Trends and Determine If Equipment Capacity is Properly Balanced with Projected Usage
Periodic review of capital asset plan to determine if additional equipment, if needed, can be funded.
Inputs: . Return Inventory for Transfer from ER.4
Manage Return Inventory Inventory relative to return process available for transfer to other
destination.
. Returned MRO Product from DR2.3 Receive MRO Product
Product being returned for maintenance, repair, or overhaul.
. Sourcing Plans from P2.4 Establish Sourcing Plans
An aggregate material requirements plan used to schedule material deliveries to meet production plan.
Outputs: . MRO Products to S2.2 Receive Product Maintenance, Repair and Overhaul spare parts used to support of
operations and maintenance.
. MRO Products to S1.2 Receive Product Maintenance, Repair and Overhaul spare parts used to support of operations and maintenance.
. Return Inventory Transfer Data to S2.1 Schedule Product Deliveries
The process of receipt and verification of the returned item against the return authorization and other documentation and prepares the item for transfer.
. Return Inventory Transfer Data to S1.1 Schedule Product Deliveries
The process of receipt and verification of the returned item against the return authorization and other documentation and prepares the item for transfer.
. Return Inventory Transfer Data to ER.4 Manage Return Inventory
The process of receipt and verification of the returned item against the return authorization and other documentation and prepares the item for transfer.
. Return Inventory Transfer Data to P5.2 Identify, Assess, and Aggregate Return Resources
The process of receipt and verification of the returned item against the return authorization and other documentation and prepares the item for transfer.

© Copyright 2006 Supply-Chain Council, Inc. 279 June 2006
. Return Inventory Transfer Data to S3.3 Schedule Product Deliveries
The process of receipt and verification of the returned item against the return authorization and other documentation and prepares the item for transfer.
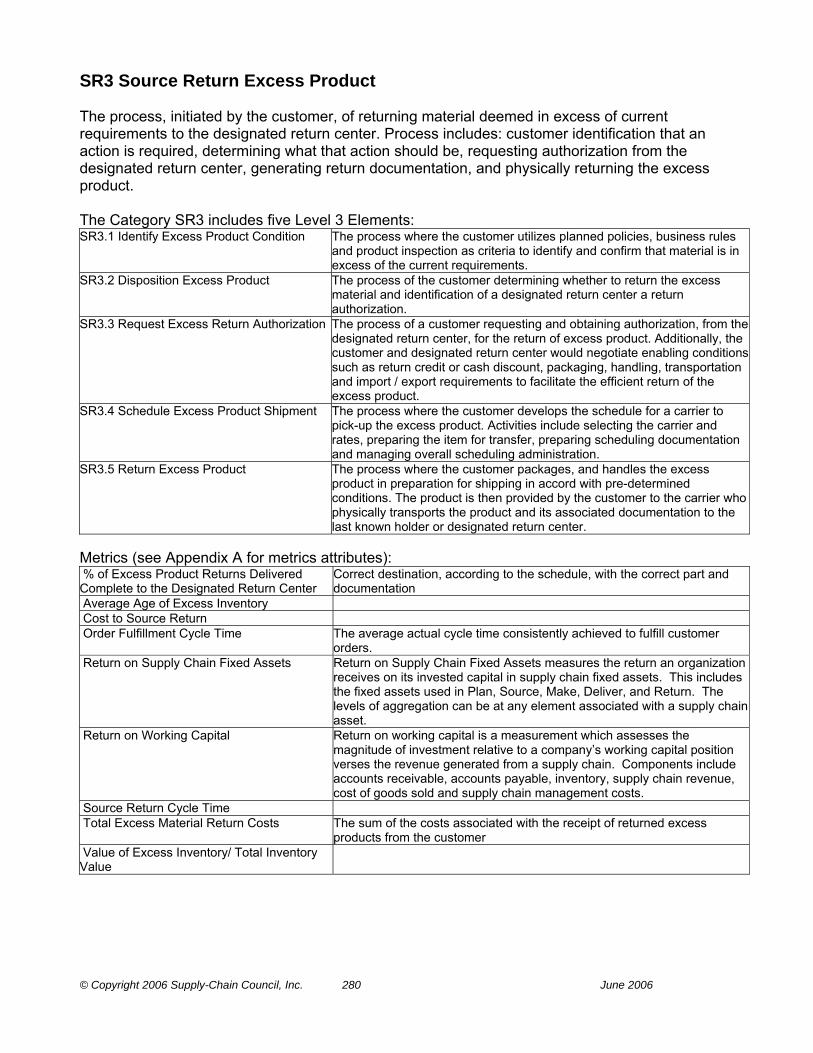
© Copyright 2006 Supply-Chain Council, Inc. 280 June 2006
SR3 Source Return Excess Product The process, initiated by the customer, of returning material deemed in excess of current requirements to the designated return center. Process includes: customer identification that an action is required, determining what that action should be, requesting authorization from the designated return center, generating return documentation, and physically returning the excess product. The Category SR3 includes five Level 3 Elements: SR3.1 Identify Excess Product Condition The process where the customer utilizes planned policies, business rules
and product inspection as criteria to identify and confirm that material is in excess of the current requirements.
SR3.2 Disposition Excess Product The process of the customer determining whether to return the excess material and identification of a designated return center a return authorization.
SR3.3 Request Excess Return Authorization The process of a customer requesting and obtaining authorization, from the designated return center, for the return of excess product. Additionally, the customer and designated return center would negotiate enabling conditions such as return credit or cash discount, packaging, handling, transportation and import / export requirements to facilitate the efficient return of the excess product.
SR3.4 Schedule Excess Product Shipment The process where the customer develops the schedule for a carrier to pick-up the excess product. Activities include selecting the carrier and rates, preparing the item for transfer, preparing scheduling documentation and managing overall scheduling administration.
SR3.5 Return Excess Product The process where the customer packages, and handles the excess product in preparation for shipping in accord with pre-determined conditions. The product is then provided by the customer to the carrier who physically transports the product and its associated documentation to the last known holder or designated return center.
Metrics (see Appendix A for metrics attributes): % of Excess Product Returns Delivered Complete to the Designated Return Center
Correct destination, according to the schedule, with the correct part and documentation
Average Age of Excess Inventory Cost to Source Return Order Fulfillment Cycle Time The average actual cycle time consistently achieved to fulfill customer
orders. Return on Supply Chain Fixed Assets Return on Supply Chain Fixed Assets measures the return an organization
receives on its invested capital in supply chain fixed assets. This includes the fixed assets used in Plan, Source, Make, Deliver, and Return. The levels of aggregation can be at any element associated with a supply chain asset.
Return on Working Capital Return on working capital is a measurement which assesses the magnitude of investment relative to a company’s working capital position verses the revenue generated from a supply chain. Components include accounts receivable, accounts payable, inventory, supply chain revenue, cost of goods sold and supply chain management costs.
Source Return Cycle Time Total Excess Material Return Costs The sum of the costs associated with the receipt of returned excess
products from the customer Value of Excess Inventory/ Total Inventory Value

© Copyright 2006 Supply-Chain Council, Inc. 281 June 2006
SR3.1 Identify Excess Product Condition The process where the customer utilizes planned policies, business rules and product inspection as criteria to identify and confirm that material is in excess of the current requirements. Metrics (see Appendix A for metrics attributes): . Cost of Identifying the Excess Condition as a % of Total Source Return Cost . Number of Occurrences Where Excess Inventory is Returned and Subsequently Followed by an Expedite Request . Return on Working Capital Return on working capital is a measurement which assesses the
magnitude of investment relative to a company’s working capital position verses the revenue generated from a supply chain. Components include accounts receivable, accounts payable, inventory, supply chain revenue, cost of goods sold and supply chain management costs.
. Value of Excess Inventory in Identification Stage/ Total Inventory Value Best Practices: . Automated Inventory Visibility and Planning
System to Highlight Inventory in Excess of Requirements
Automated inventory planning package linked to real time demand data and inventory business rules.
. Enterprise Level Policies/Rules with Local Execution
Web based access to enterprise level business rules
Inputs: . Business Rules for Return Processes from
ER.1 Manage Business Rules for Return Processes
Rules for conducting business, i.e. developing and maintaining customer and channel performance standards of an return processes such as service levels, given service requirements by supply chain stakeholders/trading partners. Business rules align Return process policies with business strategy, goals, and objectives.
. Manage Regulatory Return Policy from ER.8 Manage Return Regulatory Requirements
The process of identifying and complying with regulatory documentation and process standards set by external entities (i.e. government, trade officials, etc.) when planning for the Return and Recovery of Assets.
Outputs: . Returned Excess Product to SR3.2
Disposition Excess Product Product being returned as defined by the terms and conditions of a
customer/supplier contract as available inventory and disposition excess not usable for sale.
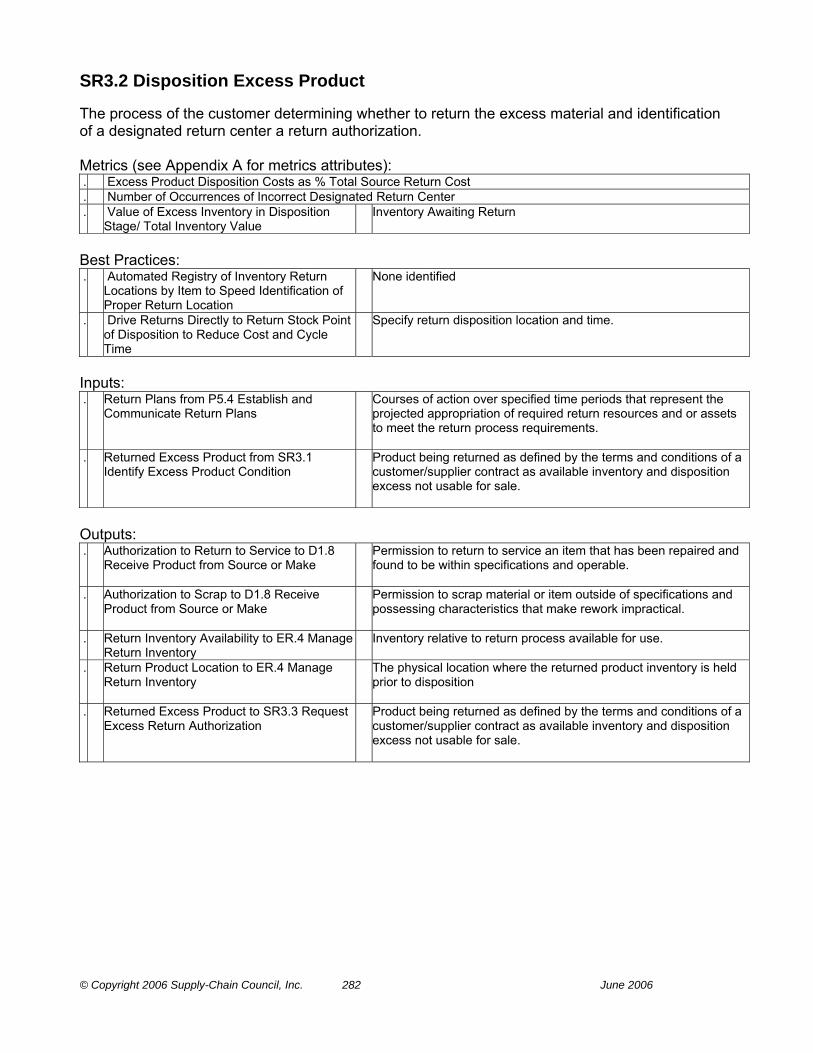
© Copyright 2006 Supply-Chain Council, Inc. 282 June 2006
SR3.2 Disposition Excess Product The process of the customer determining whether to return the excess material and identification of a designated return center a return authorization. Metrics (see Appendix A for metrics attributes): . Excess Product Disposition Costs as % Total Source Return Cost . Number of Occurrences of Incorrect Designated Return Center . Value of Excess Inventory in Disposition
Stage/ Total Inventory Value Inventory Awaiting Return
Best Practices: . Automated Registry of Inventory Return
Locations by Item to Speed Identification of Proper Return Location
None identified
. Drive Returns Directly to Return Stock Point of Disposition to Reduce Cost and Cycle Time
Specify return disposition location and time.
Inputs: . Return Plans from P5.4 Establish and
Communicate Return Plans Courses of action over specified time periods that represent the
projected appropriation of required return resources and or assets to meet the return process requirements.
. Returned Excess Product from SR3.1 Identify Excess Product Condition
Product being returned as defined by the terms and conditions of a customer/supplier contract as available inventory and disposition excess not usable for sale.
Outputs: . Authorization to Return to Service to D1.8
Receive Product from Source or Make Permission to return to service an item that has been repaired and
found to be within specifications and operable.
. Authorization to Scrap to D1.8 Receive Product from Source or Make
Permission to scrap material or item outside of specifications and possessing characteristics that make rework impractical.
. Return Inventory Availability to ER.4 Manage Return Inventory
Inventory relative to return process available for use.
. Return Product Location to ER.4 Manage Return Inventory
The physical location where the returned product inventory is held prior to disposition
. Returned Excess Product to SR3.3 Request Excess Return Authorization
Product being returned as defined by the terms and conditions of a customer/supplier contract as available inventory and disposition excess not usable for sale.
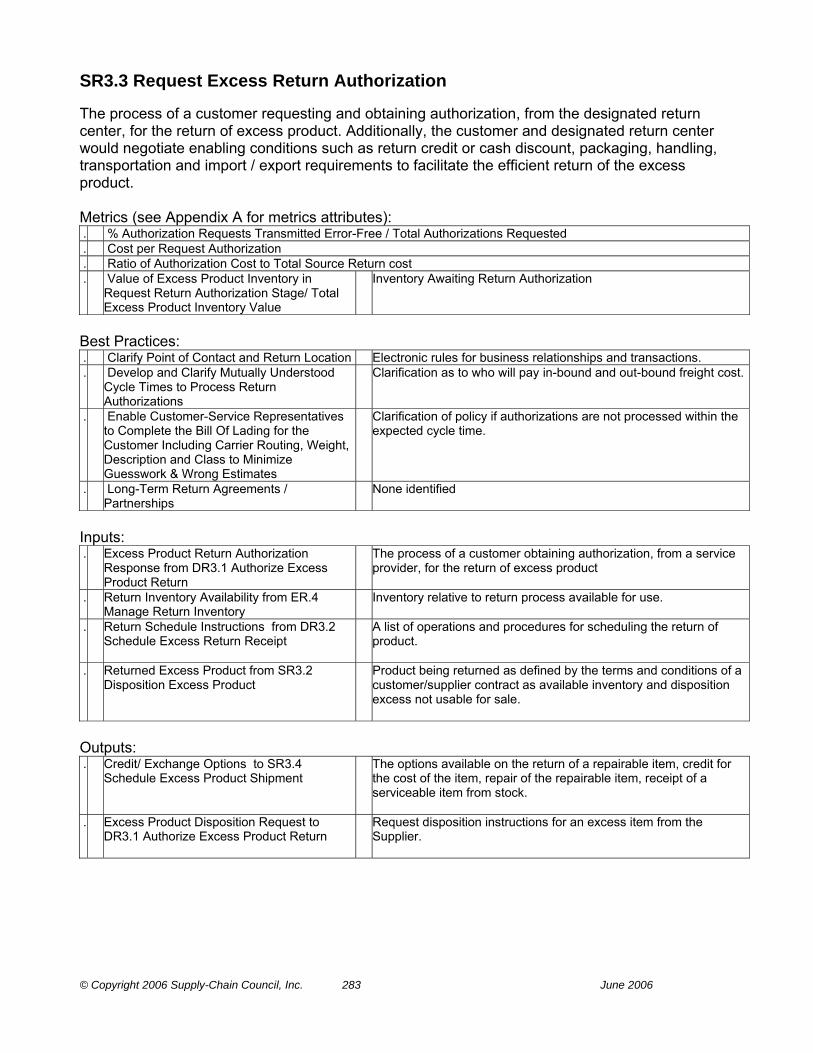
© Copyright 2006 Supply-Chain Council, Inc. 283 June 2006
SR3.3 Request Excess Return Authorization The process of a customer requesting and obtaining authorization, from the designated return center, for the return of excess product. Additionally, the customer and designated return center would negotiate enabling conditions such as return credit or cash discount, packaging, handling, transportation and import / export requirements to facilitate the efficient return of the excess product. Metrics (see Appendix A for metrics attributes): . % Authorization Requests Transmitted Error-Free / Total Authorizations Requested . Cost per Request Authorization . Ratio of Authorization Cost to Total Source Return cost . Value of Excess Product Inventory in
Request Return Authorization Stage/ Total Excess Product Inventory Value
Inventory Awaiting Return Authorization
Best Practices: . Clarify Point of Contact and Return Location Electronic rules for business relationships and transactions. . Develop and Clarify Mutually Understood
Cycle Times to Process Return Authorizations
Clarification as to who will pay in-bound and out-bound freight cost.
. Enable Customer-Service Representatives to Complete the Bill Of Lading for the Customer Including Carrier Routing, Weight, Description and Class to Minimize Guesswork & Wrong Estimates
Clarification of policy if authorizations are not processed within the expected cycle time.
. Long-Term Return Agreements / Partnerships
None identified
Inputs: . Excess Product Return Authorization
Response from DR3.1 Authorize Excess Product Return
The process of a customer obtaining authorization, from a service provider, for the return of excess product
. Return Inventory Availability from ER.4 Manage Return Inventory
Inventory relative to return process available for use.
. Return Schedule Instructions from DR3.2 Schedule Excess Return Receipt
A list of operations and procedures for scheduling the return of product.
. Returned Excess Product from SR3.2 Disposition Excess Product
Product being returned as defined by the terms and conditions of a customer/supplier contract as available inventory and disposition excess not usable for sale.
Outputs: . Credit/ Exchange Options to SR3.4
Schedule Excess Product Shipment The options available on the return of a repairable item, credit for
the cost of the item, repair of the repairable item, receipt of a serviceable item from stock.
. Excess Product Disposition Request to DR3.1 Authorize Excess Product Return
Request disposition instructions for an excess item from the Supplier.

© Copyright 2006 Supply-Chain Council, Inc. 284 June 2006
. Excess Product Return Authorization Request to DR3.1 Authorize Excess Product Return
The process of a customer requesting authorization from a service provider, for the return of excess. In addition to discussing the excess, the customer and service provider would discuss enabling conditions such as return replacement or credit, packaging, handling, transportation and import / export requirements to facilitate the efficient return of excess to the service provider. The customer may need to go through several return authorization iterations with multiple service providers before authorization is received.
. Historical Return Rates to P5.1 Assess, and Aggregate Return Requirements
A judgmental forecasting technique based upon the a return history that is analogous to a present situation, such as the return history on a similar product, and using the past pattern to predict future returns.
. Returned Excess Product to SR3.4 Schedule Excess Product Shipment
Product being returned as defined by the terms and conditions of a customer/supplier contract as available inventory and disposition excess not usable for sale.
. Ship-to Data to SR3.4 Schedule Excess Product Shipment
Data about the destination of a return delivery.
. Validated Return Material Authorization to SR3.4 Schedule Excess Product Shipment
A validated and approved Return Product Authorization (RPA).

© Copyright 2006 Supply-Chain Council, Inc. 285 June 2006
SR3.4 Schedule Excess Product Shipment The process where the customer develops the schedule for a carrier to pick-up the excess product. Activities include selecting the carrier and rates, preparing the item for transfer, preparing scheduling documentation and managing overall scheduling administration. Metrics (see Appendix A for metrics attributes): . % Excess Product Scheduling Cost to Total Source Return Cost . % Shipping Schedules that Support Customer Required Return by Date . Value of Excess Product Inventory in Scheduling Stage/ Total Excess Product Inventory Value Best Practices: . Arrange for Shipping Insurance in Case Of
In-Transit Loss or Damage Preventative management
. Carrier Selection Based on Performance Criteria at Least Cost
Scheduling, carrier selection, and rating
. Consolidation of Return Carriers Outbound logistics software to assist with route. . Transportation Modeling and Rate Analysis None identified Inputs: . Validated Return Material Authorization from SR3.3 Request Excess Return Authorization . Returned Excess Product from SR3.3 Request Excess Return Authorization . Credit/ Exchange Options from SR3.3 Request Excess Return Authorization . Ship-to Data from SR3.3 Request Excess Return Authorization . Plan and Build Loads Information from D1.5
Build Loads Transportation modes are selected and efficient loads are built.
. Return Inventory Availability from ER.4
Manage Return Inventory Inventory relative to return process available for use.
. Ship-to Data from DR3.1 Authorize Excess
Product Return Data about the destination of a retun delivery.
Outputs: . Returned Excess Product to SR3.5 Return
Excess Product Product being returned as defined by the terms and conditions of a
customer/supplier contract as available inventory and disposition excess not usable for sale.
. Scheduled Excess Product Return to SR3.5 Return Excess Product
Planned or scheduled returning of material deemed in excess of current requirements for some certain time or times.

© Copyright 2006 Supply-Chain Council, Inc. 286 June 2006
SR3.5 Return Excess Product The process where the customer packages, and handles the excess product in preparation for shipping in accord with pre-determined conditions. The product is then provided by the customer to the carrier who physically transports the product and its associated documentation to the last known holder or designated return center. Metrics (see Appendix A for metrics attributes): . % Error-Free Returns Shipped . Cost per Request Authorization . Return Shipments Shipped on Time . Return Transportation Costs . Value of Excess Product Inventory in Physical Return and Transportation Stage/ Total Excess Inventory Value Best Practices: . Advanced Shipping Notice Integrated data sharing with repair facility. . Shipment Tracking and Tracing Satellite communications, GPS, RFID Inputs: . Scheduled Excess Product Return from SR3.4 Schedule Excess Product Shipment . Returned Excess Product from SR3.4 Schedule Excess Product Shipment . Load, Shipping, Verify, and Credit
Information from D1.11 Load Vehicle & Generate Shipping Documentation
The function that performs tasks for the outgoing shipment of parts, components, and products. It includes packaging, marking, weighing, and loading for shipment. Also, verify the shipment and customer credit information.
. Return Inventory Availability from ER.4 Manage Return Inventory
Inventory relative to return process available for use.
Outputs: . Returned Excess Product to DR3.3 Receive
Excess Product Product being returned as defined by the terms and conditions of a
customer/supplier contract as available inventory and disposition excess not usable for sale.
. Shipment Documents to Government Legal documentation of the contents of a shipment (e.g. way bill, bill of lading, export papers, etc....).
. Shipment Documents to Carrier Legal documentation of the contents of a shipment (e.g. way bill, bill of lading, export papers, etc....).
. Shipment Documents to Customer Legal documentation of the contents of a shipment (e.g. way bill, bill of lading, export papers, etc....).

© Copyright 2006 Supply-Chain Council, Inc. 287 June 2006
DR3 Deliver Return Excess Product The processes of the designated return center authorizing and scheduling the excess product return, the physical receipt of the item by the designated return center and transfer of the item for final disposition The process includes communication between the customer and designated return center and the generation of associated documentation. The Category DR3 includes four Level 3 Elements: DR3.1 Authorize Excess Product Return The process where the designated return center receives an excess
product return authorization request from a customer, determines if the item can be accepted and communicates their decision to the customer. Accepting the request would include negotiating the conditions of the return with the customer, including authorizing credit or cash discount. Rejecting the request would include providing a reason for the rejection to the customer.
DR3.2 Schedule Excess Return Receipt The process where the designated return center evaluates an authorized excess material return to determine packaging and handling requirements. This assessment will lead to the development of a return disposition decision and a return schedule with terms and conditions that will tell the Customer how and when to ship the product. The scheduling activity would also inform the Return Center’s Receiving department when to expect the shipment and where to send the product, for disposition, upon receipt.
DR3.3 Receive Excess Product The process where the designated return center receives and verifies the returned excess product and associated documentation against the return authorization and other documentation and prepares the item for transfer. Administrate any discrepancies that arise.
DR3.4 Transfer Excess Product The process where the designated return center transfers the excess product to the appropriate process to implement the disposition decision.
Metrics (see Appendix A for metrics attributes): % of Excess Product Returns Delivered Complete to the Designated Return Center
Correct destination, according to the schedule, with the correct part and documentation
Order Fulfillment Cycle Time The average actual cycle time consistently achieved to fulfill customer orders.
Return on Supply Chain Fixed Assets Return on Supply Chain Fixed Assets measures the return an organization receives on its invested capital in supply chain fixed assets. This includes the fixed assets used in Plan, Source, Make, Deliver, and Return. The levels of aggregation can be at any element associated with a supply chain asset.
Return on Working Capital Return on working capital is a measurement which assesses the magnitude of investment relative to a company’s working capital position verses the revenue generated from a supply chain. Components include accounts receivable, accounts payable, inventory, supply chain revenue, cost of goods sold and supply chain management costs.
Upside Deliver Return Adaptability The maximum sustainable percentage increase in returns of finished goods from customers that can be achieved in 30 days.
Upside Deliver Return Flexibility The number of days required to achieve an unplanned sustainable 20% increase in the return of finished goods from customers.
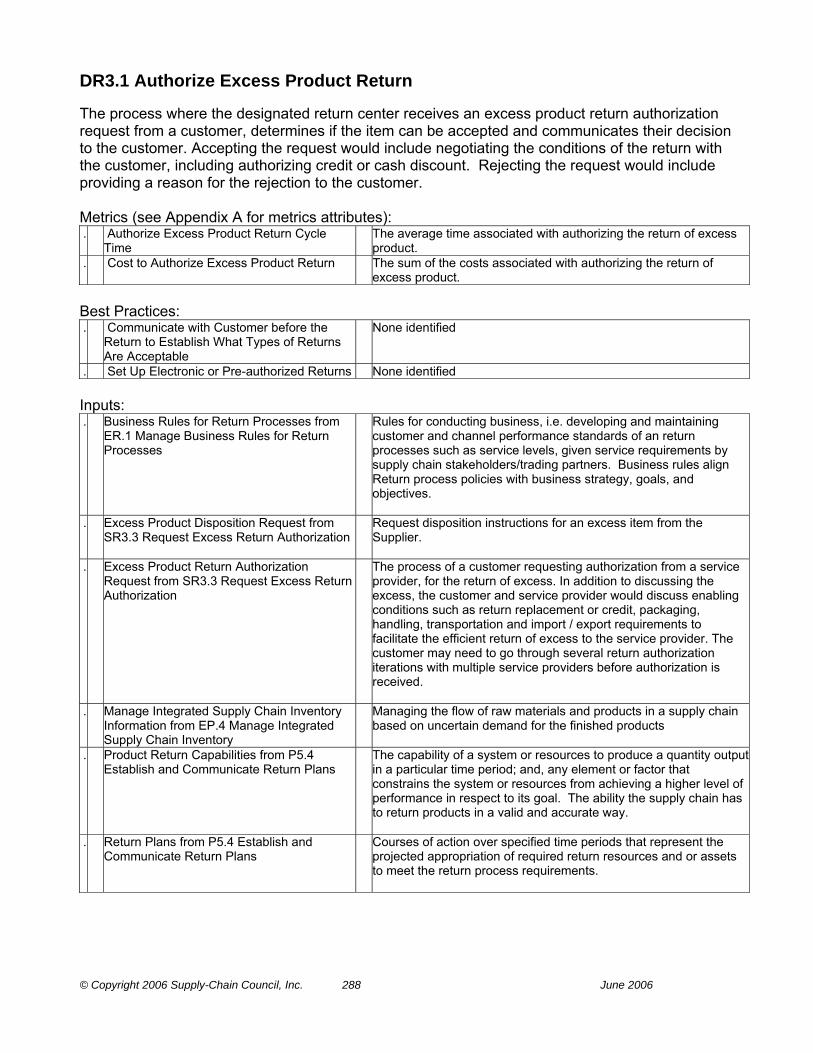
© Copyright 2006 Supply-Chain Council, Inc. 288 June 2006
DR3.1 Authorize Excess Product Return The process where the designated return center receives an excess product return authorization request from a customer, determines if the item can be accepted and communicates their decision to the customer. Accepting the request would include negotiating the conditions of the return with the customer, including authorizing credit or cash discount. Rejecting the request would include providing a reason for the rejection to the customer. Metrics (see Appendix A for metrics attributes): . Authorize Excess Product Return Cycle
Time The average time associated with authorizing the return of excess
product. . Cost to Authorize Excess Product Return The sum of the costs associated with authorizing the return of
excess product. Best Practices: . Communicate with Customer before the
Return to Establish What Types of Returns Are Acceptable
None identified
. Set Up Electronic or Pre-authorized Returns None identified Inputs: . Business Rules for Return Processes from
ER.1 Manage Business Rules for Return Processes
Rules for conducting business, i.e. developing and maintaining customer and channel performance standards of an return processes such as service levels, given service requirements by supply chain stakeholders/trading partners. Business rules align Return process policies with business strategy, goals, and objectives.
. Excess Product Disposition Request from SR3.3 Request Excess Return Authorization
Request disposition instructions for an excess item from the Supplier.
. Excess Product Return Authorization Request from SR3.3 Request Excess Return Authorization
The process of a customer requesting authorization from a service provider, for the return of excess. In addition to discussing the excess, the customer and service provider would discuss enabling conditions such as return replacement or credit, packaging, handling, transportation and import / export requirements to facilitate the efficient return of excess to the service provider. The customer may need to go through several return authorization iterations with multiple service providers before authorization is received.
. Manage Integrated Supply Chain Inventory Information from EP.4 Manage Integrated Supply Chain Inventory
Managing the flow of raw materials and products in a supply chain based on uncertain demand for the finished products
. Product Return Capabilities from P5.4 Establish and Communicate Return Plans
The capability of a system or resources to produce a quantity output in a particular time period; and, any element or factor that constrains the system or resources from achieving a higher level of performance in respect to its goal. The ability the supply chain has to return products in a valid and accurate way.
. Return Plans from P5.4 Establish and Communicate Return Plans
Courses of action over specified time periods that represent the projected appropriation of required return resources and or assets to meet the return process requirements.
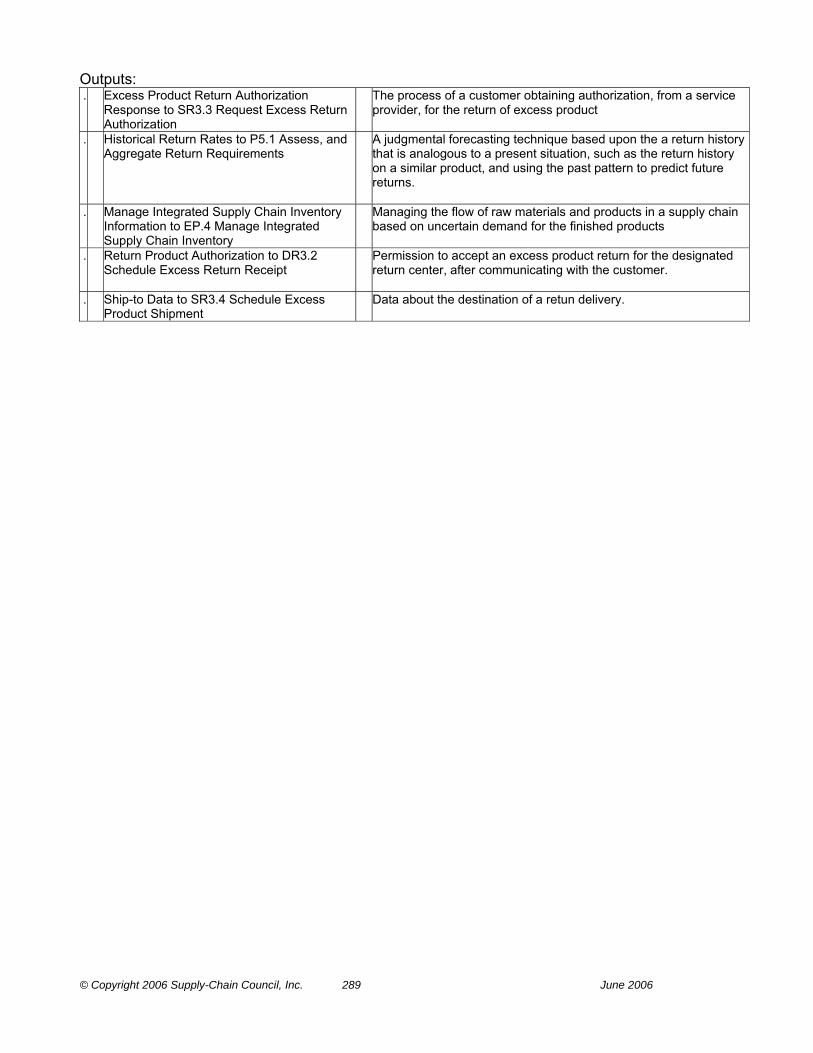
© Copyright 2006 Supply-Chain Council, Inc. 289 June 2006
Outputs: . Excess Product Return Authorization
Response to SR3.3 Request Excess Return Authorization
The process of a customer obtaining authorization, from a service provider, for the return of excess product
. Historical Return Rates to P5.1 Assess, and Aggregate Return Requirements
A judgmental forecasting technique based upon the a return history that is analogous to a present situation, such as the return history on a similar product, and using the past pattern to predict future returns.
. Manage Integrated Supply Chain Inventory Information to EP.4 Manage Integrated Supply Chain Inventory
Managing the flow of raw materials and products in a supply chain based on uncertain demand for the finished products
. Return Product Authorization to DR3.2 Schedule Excess Return Receipt
Permission to accept an excess product return for the designated return center, after communicating with the customer.
. Ship-to Data to SR3.4 Schedule Excess Product Shipment
Data about the destination of a retun delivery.
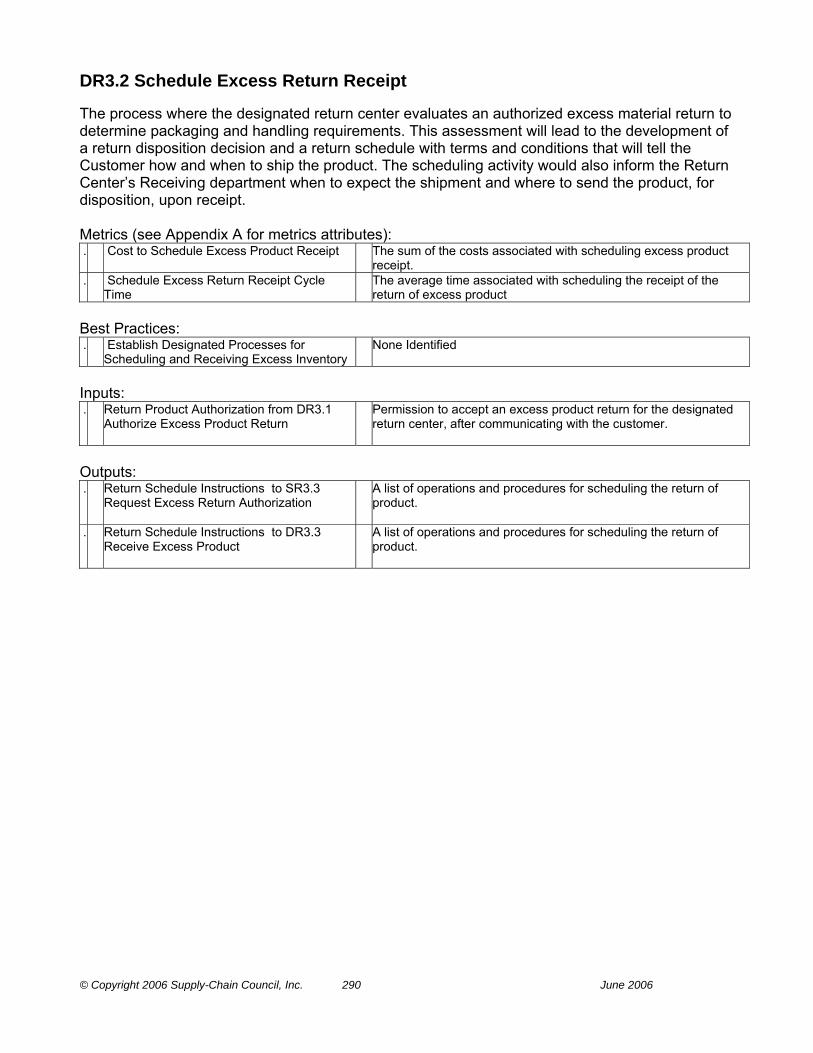
© Copyright 2006 Supply-Chain Council, Inc. 290 June 2006
DR3.2 Schedule Excess Return Receipt The process where the designated return center evaluates an authorized excess material return to determine packaging and handling requirements. This assessment will lead to the development of a return disposition decision and a return schedule with terms and conditions that will tell the Customer how and when to ship the product. The scheduling activity would also inform the Return Center’s Receiving department when to expect the shipment and where to send the product, for disposition, upon receipt. Metrics (see Appendix A for metrics attributes): . Cost to Schedule Excess Product Receipt The sum of the costs associated with scheduling excess product
receipt. . Schedule Excess Return Receipt Cycle
Time The average time associated with scheduling the receipt of the
return of excess product Best Practices: . Establish Designated Processes for
Scheduling and Receiving Excess Inventory None Identified
Inputs: . Return Product Authorization from DR3.1
Authorize Excess Product Return Permission to accept an excess product return for the designated
return center, after communicating with the customer.
Outputs: . Return Schedule Instructions to SR3.3
Request Excess Return Authorization A list of operations and procedures for scheduling the return of
product.
. Return Schedule Instructions to DR3.3 Receive Excess Product
A list of operations and procedures for scheduling the return of product.

© Copyright 2006 Supply-Chain Council, Inc. 291 June 2006
DR3.3 Receive Excess Product The process where the designated return center receives and verifies the returned excess product and associated documentation against the return authorization and other documentation and prepares the item for transfer. Administrate any discrepancies that arise. Metrics (see Appendix A for metrics attributes): . Cost to Receive Excess Product The sum of the costs associated with receiving excess returns. . Receive Excess Product Cycle Time The average time associated with receiving excess product returns
from the customer Best Practices: . Bar Coding is Used to Minimize Handling
Time and Maximize Data Accuracy - Bar code interface for data collection devices
- Generate bar coded receiving documents - Product serial number used as identifier - RFID
. Customer Sends Receiving Advanced Shipment Notification Prior to Shipment
Electronically link Return authorization, Return schedule and shipping documents. .
. Develop Local Receiving Process Close to Repair
Minimize time spent in product movement.
. Electronically Track Shipment from Customer to Service Provider
None Identified
. Pre-Certify Supplier Capability to Send Return Products Correctly to Minimize the Need for Receipt Verification
- Push inspection to SOURCE - Receiving quality criteria connected to ISO 9000 practices
. Receivers on the Dock Communicate Directly with the Buyer to Efficiently Resolve Any Discrepancies
Buyer’s name for every receipt is clearly visible on Receiver.
Inputs: . Receipt Data from ER.3 Manage Return
Data Collection A collection of related receipt data records organized in a specific
manner.
. Receipt Data from ER.4 Manage Return Inventory
A collection of related receipt data records organized in a specific manner.
. Return Regulatory Requirements from ER.8 Manage Return Regulatory Requirements
Return requirements dictated by process standards set by external entities (i.e. government, trade officials, etc.).
. Return Schedule Instructions from DR3.2 Schedule Excess Return Receipt
A list of operations and procedures for scheduling the return of product.
. Return Transportation Guidelines, Policies, & Agreements from ER.6 Manage Return Transportation
Guidelines, policies and agreements for the transportation activities around return process.
. Returned Excess Product from SR3.5 Return Excess Product
Product being returned as defined by the terms and conditions of a customer/supplier contract as available inventory and disposition excess not usable for sale.
Outputs: . Receipt Discrepancy Notification to Plan Notification of a discrepancy relating to a receipt, including:
damage, packaging, quantity, etc.
. Receipt Discrepancy Notification to Source Notification of a discrepancy relating to a receipt, including: damage, packaging, quantity, etc.

© Copyright 2006 Supply-Chain Council, Inc. 292 June 2006
. Receipt Discrepancy Notification to Enable Return
Notification of a discrepancy relating to a receipt, including: damage, packaging, quantity, etc.
. Return Inventory Transfer Data to ER.4 Manage Return Inventory
The process of receipt and verification of the returned item against the return authorization and other documentation and prepares the item for transfer.
. Return Inventory Transfer Data to P5.2 Identify, Assess, and Aggregate Return Resources
The process of receipt and verification of the returned item against the return authorization and other documentation and prepares the item for transfer.
. Returned Excess Product to DR3.4 Transfer Excess Product
Product being returned as defined by the terms and conditions of a customer/supplier contract as available inventory and disposition excess not usable for sale.

© Copyright 2006 Supply-Chain Council, Inc. 293 June 2006
DR3.4 Transfer Excess Product The process where the designated return center transfers the excess product to the appropriate process to implement the disposition decision. Metrics (see Appendix A for metrics attributes): . Cost to Transfer Excess Product The sum of the costs associated transferring excess product for
disposition . Transfer Excess Product Cycle Time The average time associated transfer until product is moved to the
next process. Best Practices: . Excess Products Scheduling Identifies Next
Destination (Source, Make, or Deliver) on Return Authorization
Utilize electronic links
. Receiving Equipment and Packaging Materials to Transfer Product Are Planned for In Advance and Readily Available When Needed
Include packaging materials in inventory management system and treat as any other inventory to minimize potential of stock-out.
. Return Process Electronically Tracks Transfer from Station to Station
Utilize Bar coding
. Review Transfer Cycle Time Trends and Determine If Equipment Capacity is Properly Balanced with Projected Usage
Periodic review of capital asset plan to determine if additional equipment, if needed, can be funded.
Inputs: . Return Inventory for Transfer from ER.4
Manage Return Inventory Inventory relative to return process available for transfer to other
destination.
. Returned Excess Product from DR3.3 Receive Excess Product
Product being returned as defined by the terms and conditions of a customer/supplier contract as available inventory and disposition excess not usable for sale.
. Sourcing Plans from P2.4 Establish Sourcing Plans
An aggregate material requirements plan used to schedule material deliveries to meet production plan.
Outputs: . Excess Products to S2.2 Receive Product Material in excess of the current requirements.
. Excess Products to S1.2 Receive Product Material in excess of the current requirements.
. Return Inventory Transfer Data to S2.1
Schedule Product Deliveries The process of receipt and verification of the returned item against
the return authorization and other documentation and prepares the item for transfer.
. Return Inventory Transfer Data to S3.3 Schedule Product Deliveries
The process of receipt and verification of the returned item against the return authorization and other documentation and prepares the item for transfer.
. Return Inventory Transfer Data to P5.2 Identify, Assess, and Aggregate Return Resources
The process of receipt and verification of the returned item against the return authorization and other documentation and prepares the item for transfer.
. Return Inventory Transfer Data to S1.1 Schedule Product Deliveries
The process of receipt and verification of the returned item against the return authorization and other documentation and prepares the item for transfer.

© Copyright 2006 Supply-Chain Council, Inc. 294 June 2006
. Return Inventory Transfer Data to ER.4 Manage Return Inventory
The process of receipt and verification of the returned item against the return authorization and other documentation and prepares the item for transfer.

© Copyright 2006 Supply-Chain Council, Inc. 295 June 2006
ER Enable RETURN Enable Processes prepare, maintain, or manage information or relationships on which planning and execution processes rely. The Category ER includes eight Level 3 Elements: ER.1 Manage Business Rules for Return Processes
The process of establishing, maintaining, and enforcing decision support criteria for Return Planning that are translated into rules for conducting business. These rules align Return process policies with business strategy, goals, and objectives. Examples of business rules include those that (1) Enable customers to identify when scheduled and unscheduled conditions occur that require a return authorization request, (2) Enable a service provider to confirm a part is authorized to be returned, (3) Identify the waiting period to confirm a return item has been shipped and received before following up (4) Develop and maintain customer and channel performance standards of return processes such as service levels, given service requirements by supply chain stakeholders/trading partners.(5) Communicate to customers the allowable amount of elapsed time from purchase and condition in which excess material must be received in order for it to be accepted as a return (6) Negotiate any restocking charge stipulations.
ER.2 Manage Performance of Return Processes
The process of measuring actual Return Process performance against internal and/or external standards to develop and implement a course of action to achieve targeted performance levels.
ER.3 Manage Return Data Collection The process of collecting, cleansing, integrating and maintaining the accuracy of return execution information necessary to plan the recovery of supply chain resources.
ER.4 Manage Return Inventory The process of establishing a return process inventory strategy and planning the recovery process inventory limits or levels (unserviceable carcasses ready for teardown/evaluation and those carcasses already evaluated and ready for repair) including replenishment models, ownership, product mix, and stocking locations, both inter and intra company.
ER.5 Manage Return Capital Assets The process of acquiring, maintaining and dispositioning capital assets such as fork lift trucks, information systems and equipment in receiving docks that are utilized in support of Return. Management activities would include defining asset requirements, determining resource availability and conducting gap analysis and resolution. The process includes lease-buy and outsourcing decisions.
ER.6 Manage Return Transportation The process of providing the least cost transportation of a returned product from a customer location to the appropriate service provider location within specified time frames. Can include interim transportation activities conducted within more than one service provider locations. Includes defining and implementing a Return transportation strategy throughout the supply chain, maintaining transportation-related information (rates, lead times) and managing transportation performance.
ER.7 Manage Return Network Configuration The process where customer and service provider locations involved in the flow of returns are defined and maintained throughout the supply chain. Locations include retail and wholesale customer and supplier sites, manufacturing facilities, distribution centers, warehouses, repair depots and military bases. How unserviceable material flow throughout the network is governed by the specific supply chain’s business rules. (See ER1)
ER.8 Manage Return Regulatory Requirements
The process of identifying and complying with regulatory documentation and process standards set by external entities (i.e. government, trade officials, etc.) when planning for the Return of Assets. Includes Customs requirements and Import / Export Controls.

© Copyright 2006 Supply-Chain Council, Inc. 296 June 2006
ER.1 Manage Business Rules for Return Processes The process of establishing, maintaining, and enforcing decision support criteria for Return Planning that are translated into rules for conducting business. These rules align Return process policies with business strategy, goals, and objectives. Examples of business rules include those that (1) Enable customers to identify when scheduled and unscheduled conditions occur that require a return authorization request, (2) Enable a service provider to confirm a part is authorized to be returned, (3) Identify the waiting period to confirm a return item has been shipped and received before following up (4) Develop and maintain customer and channel performance standards of return processes such as service levels, given service requirements by supply chain stakeholders/trading partners.(5) Communicate to customers the allowable amount of elapsed time from purchase and condition in which excess material must be received in order for it to be accepted as a return (6) Negotiate any restocking charge stipulations. Metrics (see Appendix A for metrics attributes): Cost to Manage Business Rules for Return Processes
The sum of the Cost to Manage Business Rules for Return Processes
Manage Business Rules for Return Processes Cycle Time
The average time associated with managing rules for returns
Best Practices: Electronic Reminders of Possible Scheduled Maintenance
Pull signals.
Evaluate the Benefits of Out-Sourcing the Excess Material Return Process
Enables customer to focus on core competencies.
Publish Return Policy Easy access to return business rules. Standard Inventory Policy to Determine Excess
None Identified
Utilize Real-World Cases in Employee Training
None Identified
Inputs: Process Procedures from P5.4 Establish and Communicate Return Plans
A planned series of actions or operations that advances returns from one stage to another, or established procedures to manage and execute all activities in the process.
Return Rules and Policies from P5.4 Establish and Communicate Return Plans
Rules and Policies for conducting business, i.e. developing and maintaining customer and channel performance standards of return processes such as service levels, given service requirements by supply chain stakeholders/trading partners. Rules and policies align the Return process with the organization’s business strategy, goals and objectives.
Outputs: Business Rules for Return Processes to DR3.1 Authorize Excess Product Return
Rules for conducting business, i.e. developing and maintaining customer and channel performance standards of an return processes such as service levels, given service requirements by supply chain stakeholders/trading partners. Business rules align Return process policies with business strategy, goals, and objectives.
Business Rules for Return Processes to ER.4 Manage Return Inventory
Rules for conducting business, i.e. developing and maintaining customer and channel performance standards of an return processes such as service levels, given service requirements by supply chain stakeholders/trading partners. Business rules align Return process policies with business strategy, goals, and objectives.

© Copyright 2006 Supply-Chain Council, Inc. 297 June 2006
Business Rules for Return Processes to ER.5 Manage Return Capital Assets
Rules for conducting business, i.e. developing and maintaining customer and channel performance standards of an return processes such as service levels, given service requirements by supply chain stakeholders/trading partners. Business rules align Return process policies with business strategy, goals, and objectives.
Business Rules for Return Processes to P5.2 Identify, Assess, and Aggregate Return Resources
Rules for conducting business, i.e. developing and maintaining customer and channel performance standards of an return processes such as service levels, given service requirements by supply chain stakeholders/trading partners. Business rules align Return process policies with business strategy, goals, and objectives.
Business Rules for Return Processes to DR1.1 Authorize Defective Product Return
Rules for conducting business, i.e. developing and maintaining customer and channel performance standards of an return processes such as service levels, given service requirements by supply chain stakeholders/trading partners. Business rules align Return process policies with business strategy, goals, and objectives.
Business Rules for Return Processes to SR2.1 Identify MRO Product Condition
Rules for conducting business, i.e. developing and maintaining customer and channel performance standards of an return processes such as service levels, given service requirements by supply chain stakeholders/trading partners. Business rules align Return process policies with business strategy, goals, and objectives.
Business Rules for Return Processes to ER.7 Manage Return Network Configuration
Rules for conducting business, i.e. developing and maintaining customer and channel performance standards of an return processes such as service levels, given service requirements by supply chain stakeholders/trading partners. Business rules align Return process policies with business strategy, goals, and objectives.
Business Rules for Return Processes to DR2.1 Authorize MRO Product Return
Rules for conducting business, i.e. developing and maintaining customer and channel performance standards of an return processes such as service levels, given service requirements by supply chain stakeholders/trading partners. Business rules align Return process policies with business strategy, goals, and objectives.
Business Rules for Return Processes to ER.8 Manage Return Regulatory Requirements
Rules for conducting business, i.e. developing and maintaining customer and channel performance standards of an return processes such as service levels, given service requirements by supply chain stakeholders/trading partners. Business rules align Return process policies with business strategy, goals, and objectives.
Business Rules for Return Processes to SR1.1 Identify Defective Product Condition
Rules for conducting business, i.e. developing and maintaining customer and channel performance standards of an return processes such as service levels, given service requirements by supply chain stakeholders/trading partners. Business rules align Return process policies with business strategy, goals, and objectives.
Business Rules for Return Processes to P5.1 Assess, and Aggregate Return Requirements
Rules for conducting business, i.e. developing and maintaining customer and channel performance standards of an return processes such as service levels, given service requirements by supply chain stakeholders/trading partners. Business rules align Return process policies with business strategy, goals, and objectives.
Business Rules for Return Processes to SR3.1 Identify Excess Product Condition
Rules for conducting business, i.e. developing and maintaining customer and channel performance standards of an return processes such as service levels, given service requirements by supply chain stakeholders/trading partners. Business rules align Return process policies with business strategy, goals, and objectives.
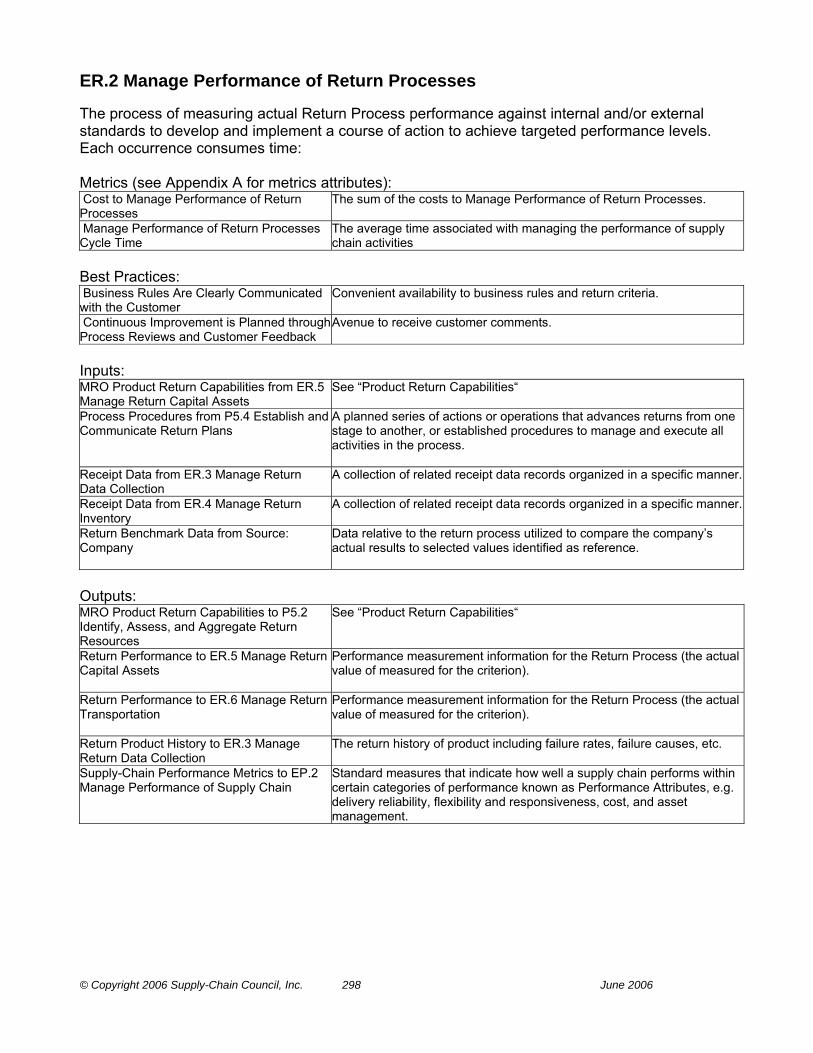
© Copyright 2006 Supply-Chain Council, Inc. 298 June 2006
ER.2 Manage Performance of Return Processes The process of measuring actual Return Process performance against internal and/or external standards to develop and implement a course of action to achieve targeted performance levels. Each occurrence consumes time: Metrics (see Appendix A for metrics attributes): Cost to Manage Performance of Return Processes
The sum of the costs to Manage Performance of Return Processes.
Manage Performance of Return Processes Cycle Time
The average time associated with managing the performance of supply chain activities
Best Practices: Business Rules Are Clearly Communicated with the Customer
Convenient availability to business rules and return criteria.
Continuous Improvement is Planned through Process Reviews and Customer Feedback
Avenue to receive customer comments.
Inputs: MRO Product Return Capabilities from ER.5 Manage Return Capital Assets
See “Product Return Capabilities“
Process Procedures from P5.4 Establish and Communicate Return Plans
A planned series of actions or operations that advances returns from one stage to another, or established procedures to manage and execute all activities in the process.
Receipt Data from ER.3 Manage Return Data Collection
A collection of related receipt data records organized in a specific manner.
Receipt Data from ER.4 Manage Return Inventory
A collection of related receipt data records organized in a specific manner.
Return Benchmark Data from Source: Company
Data relative to the return process utilized to compare the company’s actual results to selected values identified as reference.
Outputs: MRO Product Return Capabilities to P5.2 Identify, Assess, and Aggregate Return Resources
See “Product Return Capabilities“
Return Performance to ER.5 Manage Return Capital Assets
Performance measurement information for the Return Process (the actual value of measured for the criterion).
Return Performance to ER.6 Manage Return Transportation
Performance measurement information for the Return Process (the actual value of measured for the criterion).
Return Product History to ER.3 Manage Return Data Collection
The return history of product including failure rates, failure causes, etc.
Supply-Chain Performance Metrics to EP.2 Manage Performance of Supply Chain
Standard measures that indicate how well a supply chain performs within certain categories of performance known as Performance Attributes, e.g. delivery reliability, flexibility and responsiveness, cost, and asset management.

© Copyright 2006 Supply-Chain Council, Inc. 299 June 2006
ER.3 Manage Return Data Collection The process of collecting, cleansing, integrating and maintaining the accuracy of return execution information necessary to plan the recovery of supply chain resources. Metrics (see Appendix A for metrics attributes): Cost to Manage Return Data Collection The sum of the costs to manage the capital assets associated with returns
data collection. Manage Return Data Collection Cycle Time The average time associated with managing return data collection Best Practices: Automated Update of Customer Excess Material Return Transaction History
- Use trend analysis to influence inventory level decisions. - Web-based alerts to identify update occurred and when pre-determined thresholds are exceeded.
Data Accessibility across the Enterprise for Visibility by Discrete Business Units
Web based access to various levels of enterprise data
Inputs: Data Cleansing Procedure from Source: Company
The procedure that outlines the cleansing of return data to insure its validity and accuracy during the return process.
Data System Requirements from Source: Company
List of requirements of the data system that insure cleansed data is compatible and usable, or the data system requirements to fully automate the return process.
Return Product History from ER.2 Manage Performance of Return Processes
The return history of product including failure rates, failure causes, etc.
Outputs: Data About Return Capabilities to P5.2 Identify, Assess, and Aggregate Return Resources
Information required in the process of integrating and maintaining the accuracy of return execution.
Receipt Data to DR1.3 Receive Defective Product
A collection of related receipt data records organized in a specific manner.
Receipt Data to ER.2 Manage Performance of Return Processes
A collection of related receipt data records organized in a specific manner.
Receipt Data to DR2.3 Receive MRO Product
A collection of related receipt data records organized in a specific manner.
Receipt Data to DR3.3 Receive Excess Product
A collection of related receipt data records organized in a specific manner.
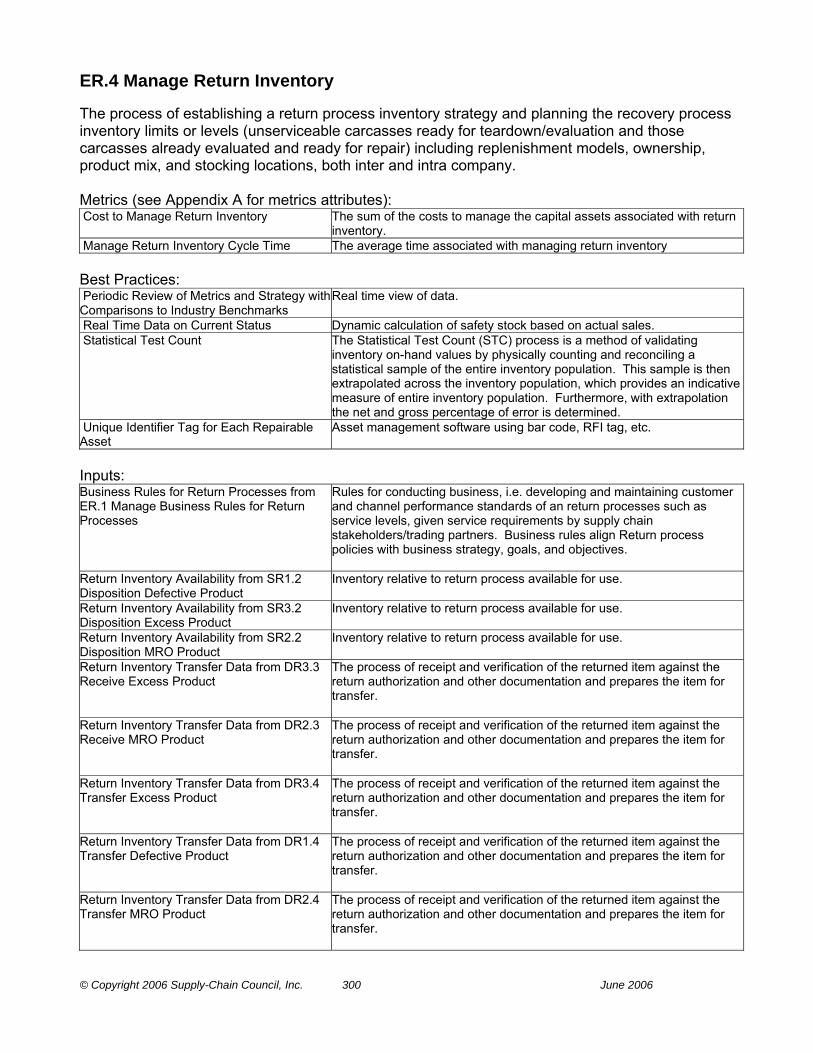
© Copyright 2006 Supply-Chain Council, Inc. 300 June 2006
ER.4 Manage Return Inventory The process of establishing a return process inventory strategy and planning the recovery process inventory limits or levels (unserviceable carcasses ready for teardown/evaluation and those carcasses already evaluated and ready for repair) including replenishment models, ownership, product mix, and stocking locations, both inter and intra company. Metrics (see Appendix A for metrics attributes): Cost to Manage Return Inventory The sum of the costs to manage the capital assets associated with return
inventory. Manage Return Inventory Cycle Time The average time associated with managing return inventory Best Practices: Periodic Review of Metrics and Strategy with Comparisons to Industry Benchmarks
Real time view of data.
Real Time Data on Current Status Dynamic calculation of safety stock based on actual sales. Statistical Test Count The Statistical Test Count (STC) process is a method of validating
inventory on-hand values by physically counting and reconciling a statistical sample of the entire inventory population. This sample is then extrapolated across the inventory population, which provides an indicative measure of entire inventory population. Furthermore, with extrapolation the net and gross percentage of error is determined.
Unique Identifier Tag for Each Repairable Asset
Asset management software using bar code, RFI tag, etc.
Inputs: Business Rules for Return Processes from ER.1 Manage Business Rules for Return Processes
Rules for conducting business, i.e. developing and maintaining customer and channel performance standards of an return processes such as service levels, given service requirements by supply chain stakeholders/trading partners. Business rules align Return process policies with business strategy, goals, and objectives.
Return Inventory Availability from SR1.2 Disposition Defective Product
Inventory relative to return process available for use.
Return Inventory Availability from SR3.2 Disposition Excess Product
Inventory relative to return process available for use.
Return Inventory Availability from SR2.2 Disposition MRO Product
Inventory relative to return process available for use.
Return Inventory Transfer Data from DR3.3 Receive Excess Product
The process of receipt and verification of the returned item against the return authorization and other documentation and prepares the item for transfer.
Return Inventory Transfer Data from DR2.3 Receive MRO Product
The process of receipt and verification of the returned item against the return authorization and other documentation and prepares the item for transfer.
Return Inventory Transfer Data from DR3.4 Transfer Excess Product
The process of receipt and verification of the returned item against the return authorization and other documentation and prepares the item for transfer.
Return Inventory Transfer Data from DR1.4 Transfer Defective Product
The process of receipt and verification of the returned item against the return authorization and other documentation and prepares the item for transfer.
Return Inventory Transfer Data from DR2.4 Transfer MRO Product
The process of receipt and verification of the returned item against the return authorization and other documentation and prepares the item for transfer.
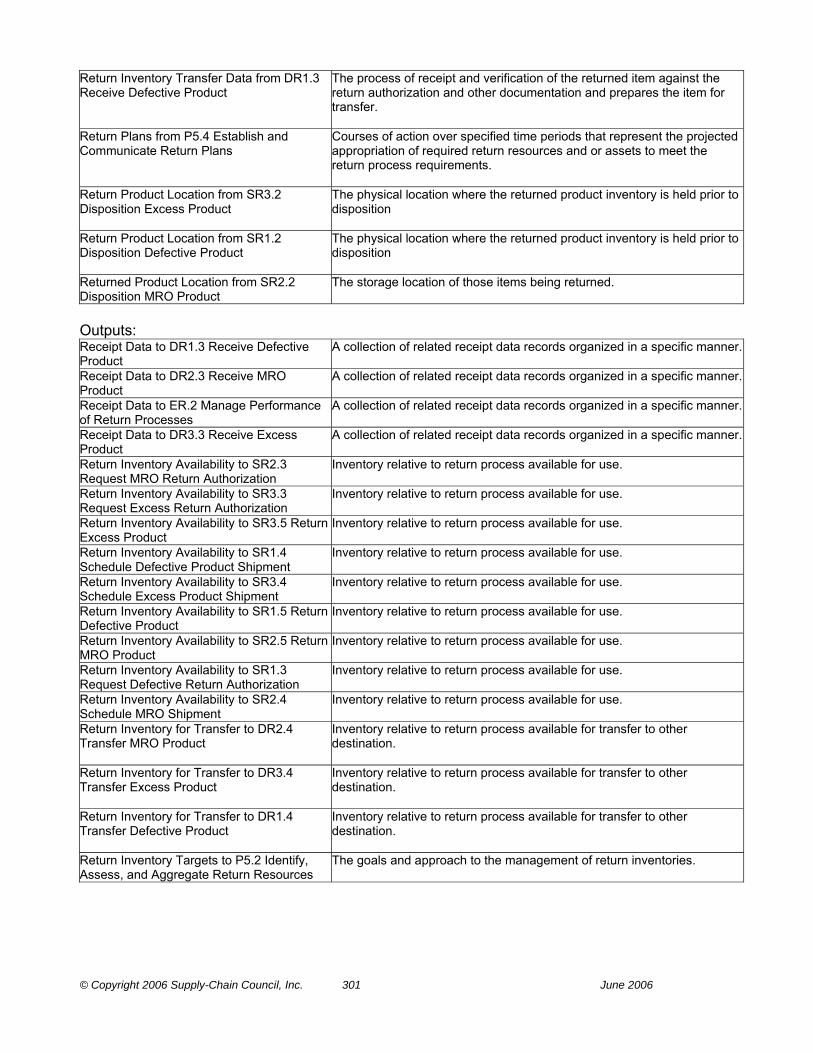
© Copyright 2006 Supply-Chain Council, Inc. 301 June 2006
Return Inventory Transfer Data from DR1.3 Receive Defective Product
The process of receipt and verification of the returned item against the return authorization and other documentation and prepares the item for transfer.
Return Plans from P5.4 Establish and Communicate Return Plans
Courses of action over specified time periods that represent the projected appropriation of required return resources and or assets to meet the return process requirements.
Return Product Location from SR3.2 Disposition Excess Product
The physical location where the returned product inventory is held prior to disposition
Return Product Location from SR1.2 Disposition Defective Product
The physical location where the returned product inventory is held prior to disposition
Returned Product Location from SR2.2 Disposition MRO Product
The storage location of those items being returned.
Outputs: Receipt Data to DR1.3 Receive Defective Product
A collection of related receipt data records organized in a specific manner.
Receipt Data to DR2.3 Receive MRO Product
A collection of related receipt data records organized in a specific manner.
Receipt Data to ER.2 Manage Performance of Return Processes
A collection of related receipt data records organized in a specific manner.
Receipt Data to DR3.3 Receive Excess Product
A collection of related receipt data records organized in a specific manner.
Return Inventory Availability to SR2.3 Request MRO Return Authorization
Inventory relative to return process available for use.
Return Inventory Availability to SR3.3 Request Excess Return Authorization
Inventory relative to return process available for use.
Return Inventory Availability to SR3.5 Return Excess Product
Inventory relative to return process available for use.
Return Inventory Availability to SR1.4 Schedule Defective Product Shipment
Inventory relative to return process available for use.
Return Inventory Availability to SR3.4 Schedule Excess Product Shipment
Inventory relative to return process available for use.
Return Inventory Availability to SR1.5 ReturnDefective Product
Inventory relative to return process available for use.
Return Inventory Availability to SR2.5 Return MRO Product
Inventory relative to return process available for use.
Return Inventory Availability to SR1.3 Request Defective Return Authorization
Inventory relative to return process available for use.
Return Inventory Availability to SR2.4 Schedule MRO Shipment
Inventory relative to return process available for use.
Return Inventory for Transfer to DR2.4 Transfer MRO Product
Inventory relative to return process available for transfer to other destination.
Return Inventory for Transfer to DR3.4 Transfer Excess Product
Inventory relative to return process available for transfer to other destination.
Return Inventory for Transfer to DR1.4 Transfer Defective Product
Inventory relative to return process available for transfer to other destination.
Return Inventory Targets to P5.2 Identify, Assess, and Aggregate Return Resources
The goals and approach to the management of return inventories.

© Copyright 2006 Supply-Chain Council, Inc. 302 June 2006
ER.5 Manage Return Capital Assets The process of acquiring, maintaining and dispositioning capital assets such as fork lift trucks, information systems and equipment in receiving docks that are utilized in support of Return. Management activities would include defining asset requirements, determining resource availability and conducting gap analysis and resolution. The process includes lease-buy and outsourcing decisions. Metrics (see Appendix A for metrics attributes): Cost to Manage Return Capital Assets The sum of the costs to manage the capital assets associated with returns. Manage Return Capital Assets Cycle Time The average time associated with managing return capital assets Best Practices: Automated Data Entry Scanning with RFID/Bar-codes systems Automated Disposition Instructions for Returns Based on Data Interchange with Strategic Providers
Advanced planning and scheduling capability coupled with decision support logic.
Integrated Transportation Visibility - Advanced shipping notices - Real time shipping tracking
Outsource If Not a Core Competency Use 4PL to manage and move. Inputs: Business Rules for Return Processes from ER.1 Manage Business Rules for Return Processes
Rules for conducting business, i.e. developing and maintaining customer and channel performance standards of an return processes such as service levels, given service requirements by supply chain stakeholders/trading partners. Business rules align Return process policies with business strategy, goals, and objectives.
Return Performance from ER.2 Manage Performance of Return Processes
Performance measurement information for the Return Process (the actual value of measured for the criterion).
Return Plans from P5.4 Establish and Communicate Return Plans
Courses of action over specified time periods that represent the projected appropriation of required return resources and or assets to meet the return process requirements.
Outputs: MRO Product Return Capabilities to ER.2 Manage Performance of Return Processes
See “Product Return Capabilities“
MRO Product Return Capabilities to P5.2 Identify, Assess, and Aggregate Return Resources
See “Product Return Capabilities“

© Copyright 2006 Supply-Chain Council, Inc. 303 June 2006
ER.6 Manage Return Transportation The process of providing the least cost transportation of a returned product from a customer location to the appropriate service provider location within specified time frames. Can include interim transportation activities conducted within more than one service provider locations. Includes defining and implementing a Return transportation strategy throughout the supply chain, maintaining transportation-related information (rates, lead times) and managing transportation performance. Metrics (see Appendix A for metrics attributes): Cost to Manage Return Transportation The sum of the costs associated with managing return transportation. Manage Return Transportation Cycle Time The average time associated with managing return transportation Best Practices: Appointment Scheduling for Pickup and Delivery of Customer Shipments
Transportation Management System (TMS) Maintenance Management
Automated Documentation for International Shipments
Transportation Management System (TMS) Maintenance Management
Backhaul Trading Exchange Pooling Capture and Maintain Mode Specific Data Transportation Management System (TMS) Maintenance Management Consolidate Shipments Through Cross Docking - Coordinate with Other Shipments
None Identified
Develop Proactive Transit Damage Programs
None Identified
Electronic Manifest and Electronic Billing Transportation Management System (TMS) Maintenance Management Integrated Order Management, Warehouse Management, and Transportation Management Systems View for analysis for all orders and shipments the following data: Logistics, Product, Cost, GL Charging
Transportation Management System (TMS) Maintenance Management
Internet Pooling (Electronic Brokerage of Shipments)
Rating & Routing
Involve Your Other Supply-Chain Partners If Possible to Leverage Transportation throughout the Chain
Utilization of transportation management system (TMS) to manage returns. Maximization of TMS use, both intra and inter-company within the supply chain.
Limit the Number of Carriers, Treat Them as Partners and Build a Strong Relationship with Each One Geared Toward Continually Improving Service and Lowering Cost
Utilization of transportation management system (TMS) to manage returns. Maximization of TMS use, both intra and inter-company within the supply chain.
Manage Information Across 100% of Shipments
Transportation Management System (TMS) Maintenance Management
Measurement of Carrier Performance for On-time Delivery and Completeness
Transportation Management System (TMS) Maintenance Management
Real-Time Optimized Shipment Method Selection (Air Parcel, Ground Parcel, LTL, etc.) Based on Customer Service Requirements
Transportation Management System (TMS) Maintenance Management
Real-Time Shipment Tracking, (via internet) Transportation Management System (TMS) Maintenance Management Segregate In-Bound Carcass Return Cost from Other Transportation Costs
None Identified
Utilize Internet-Based Freight Bidding Built Around Shared Shipping Volume Projections
None Identified
Utilize Invoice-less Freight Payment None Identified View for Analysis for All Orders and Shipments the Following Data: Logistics, Product, Cost, GL Charging
Transportation Management System (TMS) Maintenance Management

© Copyright 2006 Supply-Chain Council, Inc. 304 June 2006
Inputs: Return Performance from ER.2 Manage Performance of Return Processes
Performance measurement information for the Return Process (the actual value of measured for the criterion).
Return Plans from P5.4 Establish and Communicate Return Plans
Courses of action over specified time periods that represent the projected appropriation of required return resources and or assets to meet the return process requirements.
Outputs: Return Transportation Guidelines, Policies, & Agreements to DR3.3 Receive Excess Product
Guidelines, policies and agreements for the transportation activities around return process.
Return Transportation Guidelines, Policies, & Agreements to DR1.3 Receive Defective Product
Guidelines, policies and agreements for the transportation activities around return process.
Return Transportation Guidelines, Policies, & Agreements to P5.2 Identify, Assess, and Aggregate Return Resources
Guidelines, policies and agreements for the transportation activities around return process.
Return Transportation Guidelines, Policies, & Agreements to DR2.3 Receive MRO Product
Guidelines, policies and agreements for the transportation activities around return process.

© Copyright 2006 Supply-Chain Council, Inc. 305 June 2006
ER.7 Manage Return Network Configuration The process where customer and service provider locations involved in the flow of returns are defined and maintained throughout the supply chain. Locations include retail and wholesale customer and supplier sites, manufacturing facilities, distribution centers, warehouses, repair depots and military bases. How unserviceable material flow throughout the network is governed by the specific supply chain’s business rules. (See ER1) Metrics (see Appendix A for metrics attributes): Cost to Manage Return Network Configuration
The sum of the costs to manage the capital assets associated with configuring the return network.
Manage Return Network Configuration Cycle Time
The average time associated with managing the return network configuration
Best Practices: Service Provider Utilizes Web-Based Communicate to Identify New and Discontinued Repair Sites to Customers
Continuously updated authorized repair sites
Utilize Web-Based Collaboration between Asset Manager and Repair Sites Regarding Capacity and Scheduling
Total return asset visibility throughout the network
Utilize Web-Based Collaboration between Customer and Service Provider on In-Bound Return Forecasts and Asset Tracking
Shared return forecasts
Utilize Web-Based Collaboration to Identify Potential New Repair Sites Prior to Their Selection
Shared knowledge of resource availability and bottlenecks
Inputs: Business Rules for Return Processes from ER.1 Manage Business Rules for Return Processes
Rules for conducting business, i.e. developing and maintaining customer and channel performance standards of an return processes such as service levels, given service requirements by supply chain stakeholders/trading partners. Business rules align Return process policies with business strategy, goals, and objectives.
Return Plans from P5.4 Establish and Communicate Return Plans
Courses of action over specified time periods that represent the projected appropriation of required return resources and or assets to meet the returnprocess requirements.
Outputs: Return Network Configuration to ER.8 Manage Return Regulatory Requirements
The business rules that govern the flow of unserviceable material through the network, i.e. the network configuration.
Return Process Workflow Definition and Policies to P5.2 Identify, Assess, and Aggregate Return Resources
Definition and maintenance of the information flow about the Returns supply chain network for a group of similar or complimentary items through out their life cycle

© Copyright 2006 Supply-Chain Council, Inc. 306 June 2006
ER.8 Manage Return Regulatory Requirements The process of identifying and complying with regulatory documentation and process standards set by external entities (i.e. government, trade officials, etc.) when planning for the Return of Assets. Includes Customs requirements and Import / Export Controls. Metrics (see Appendix A for metrics attributes): Cost to Manage Return Regulatory Requirements and Compliance
The sum of the costs associated with managing compliance to return regulatory requirements.
Manage Return Regulatory Requirements and Compliance Cycle Time
The average time associated with compliance and regulatory requirements for return products
Best Practices: Clarify in Advance Hazardous Material Packaging, Labeling and Shipping Requirements
Overseas packaging, labeling and shipping regulatory requirements are given specific attention.
Clarify in Advance If the Product to be Returned Requires Specific, Formal Authorization from the Service Provider per Federal, State or Local Regulation, Prior to Returning
Participants at all customer and service provider locations involved clearly understand all regulatory requirements at each step in the return process .
Compare Local Customs Requirements to Your Process Procedures to Ensure All Requirements Are Accounted for Before Shipping
None Identified
Confirm All Documentation and Inspection Requirements Before Shipping
None Identified
Note and Communicate Shelf Life Requirements Carefully Before Shipping
Hazardous material regulations are given specific attention.
Inputs: Business Rules for Return Processes from ER.1 Manage Business Rules for Return Processes
Rules for conducting business, i.e. developing and maintaining customer and channel performance standards of return processes such as service levels, given service requirements by supply chain stakeholders/trading partners. Business rules align Return process policies with business strategy, goals, and objectives.
Process Procedures from P5.4 Establish and Communicate Return Plans
A planned series of actions or operations that advances returns from one stage to another, or established procedures to manage and execute all activities in the process.
Return Network Configuration from ER.7 Manage Return Network Configuration
The business rules that govern the flow of unserviceable material through the network, i.e. the network configuration.
Outputs: Manage Regulatory Return Policy to SR2.1 Identify MRO Product Condition
The process of identifying and complying with regulatory documentation and process standards set by external entities (i.e. government, trade officials, etc.) when planning for the Return and Recovery of Assets.
Manage Regulatory Return Policy to SR1.1 Identify Defective Product Condition
The process of identifying and complying with regulatory documentation and process standards set by external entities (i.e. government, trade officials, etc.) when planning for the Return and Recovery of Assets.
Manage Regulatory Return Policy to SR3.1 Identify Excess Product Condition
The process of identifying and complying with regulatory documentation and process standards set by external entities (i.e. government, trade officials, etc.) when planning for the Return and Recovery of Assets.

© Copyright 2006 Supply-Chain Council, Inc. 307 June 2006
Return Regulatory Requirements to DR3.3 Receive Excess Product
Return requirements dictated by process standards set by external entities (i.e. government, trade officials, etc.).
Return Regulatory Requirements to DR1.3 Receive Defective Product
Return requirements dictated by process standards set by external entities (i.e. government, trade officials, etc.).
Return Regulatory Requirements to P5.1 Assess, and Aggregate Return Requirements
Return requirements dictated by process standards set by external entities (i.e. government, trade officials, etc.).
Return Regulatory Requirements to P5.2 Identify, Assess, and Aggregate Return Resources
Return requirements dictated by process standards set by external entities (i.e. government, trade officials, etc.).
Return Regulatory Requirements to DR2.3 Receive MRO Product
Return requirements dictated by process standards set by external entities (i.e. government, trade officials, etc.).
Warranty Data to SR2.1 Identify MRO Product Condition
All data relevant to a warranty claim for a customer for replacement, repair or credit because the product received did not meet a commitment, either expressed or implied, concerning a certain fact regarding the product
Warranty Data to SR1.1 Identify Defective Product Condition
All data relevant to a warranty claim for a customer for replacement, repair or credit because the product received did not meet a commitment, either expressed or implied, concerning a certain fact regarding the product

© Copyright 2006 Supply-Chain Council, Inc. 308 June 2006
Workflow Graphics
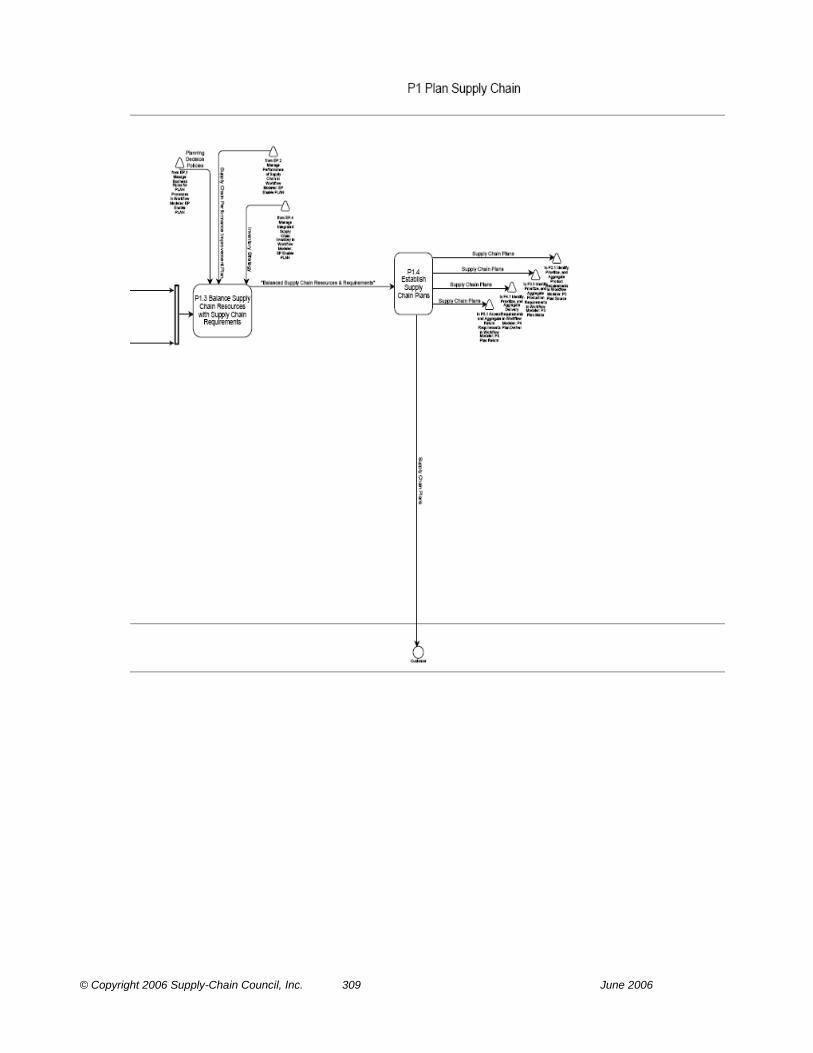
© Copyright 2006 Supply-Chain Council, Inc. 309 June 2006

© Copyright 2006 Supply-Chain Council, Inc. 310 June 2006
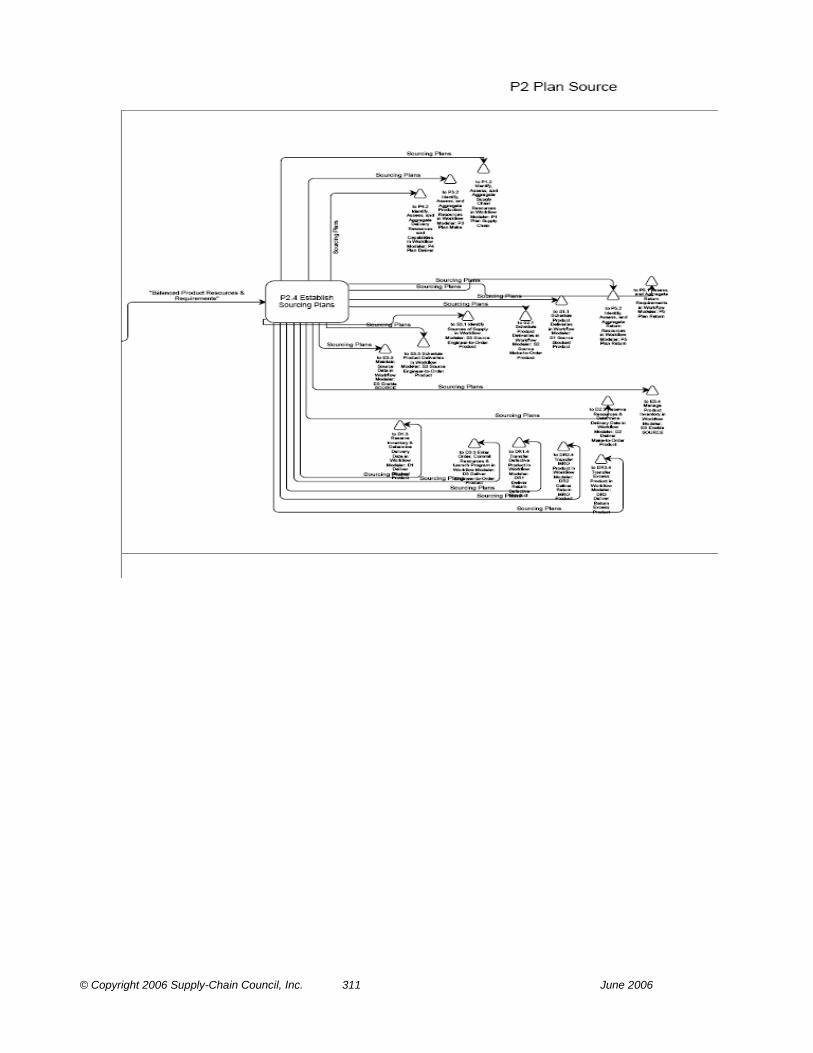
© Copyright 2006 Supply-Chain Council, Inc. 311 June 2006

© Copyright 2006 Supply-Chain Council, Inc. 312 June 2006
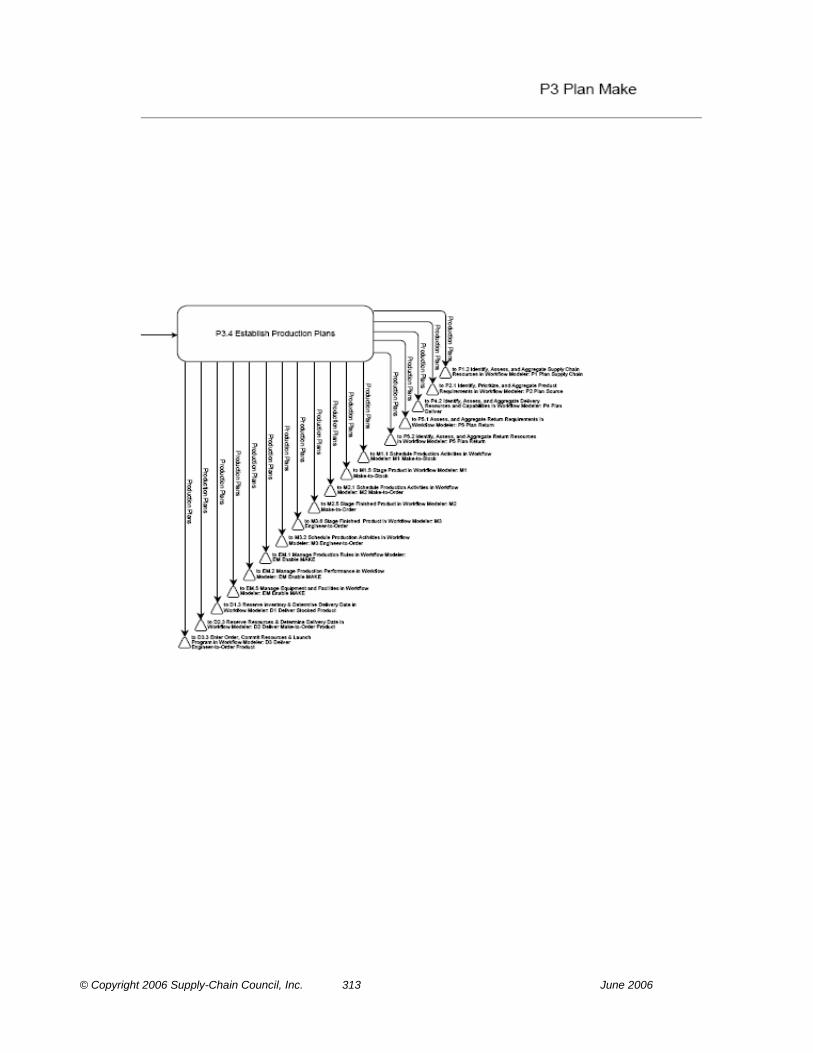
© Copyright 2006 Supply-Chain Council, Inc. 313 June 2006
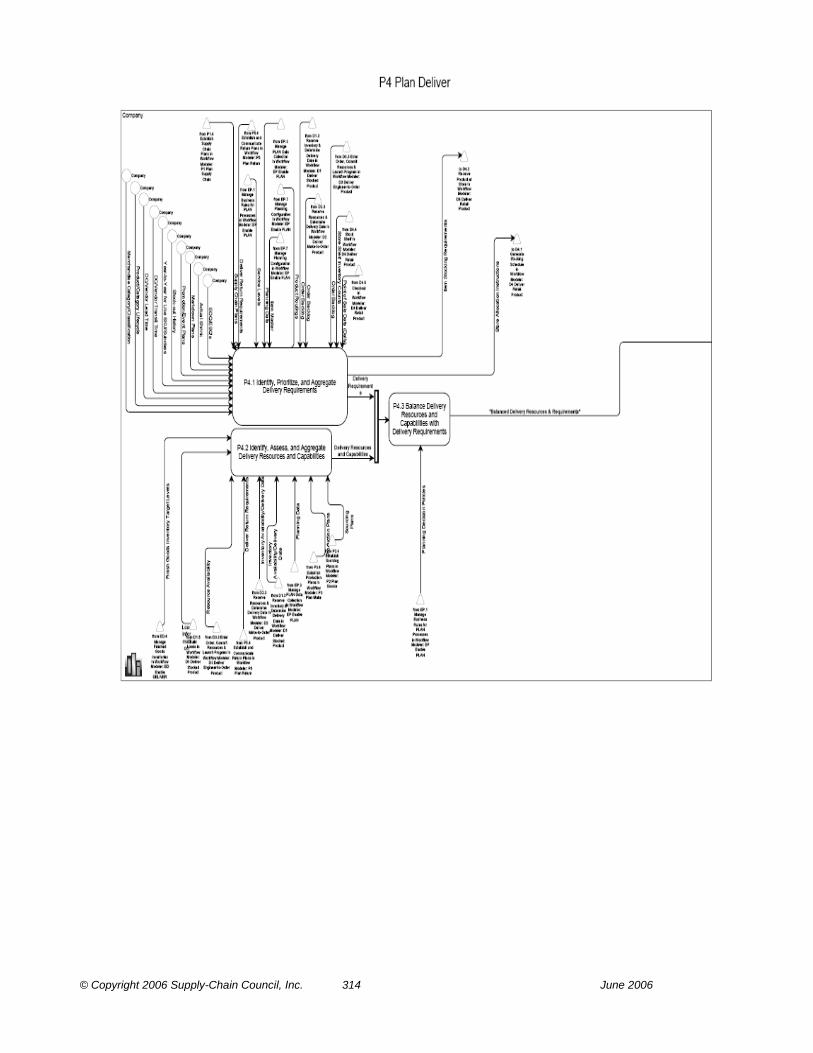
© Copyright 2006 Supply-Chain Council, Inc. 314 June 2006

© Copyright 2006 Supply-Chain Council, Inc. 315 June 2006

© Copyright 2006 Supply-Chain Council, Inc. 316 June 2006

© Copyright 2006 Supply-Chain Council, Inc. 317 June 2006

© Copyright 2006 Supply-Chain Council, Inc. 318 June 2006

© Copyright 2006 Supply-Chain Council, Inc. 319 June 2006

© Copyright 2006 Supply-Chain Council, Inc. 320 June 2006
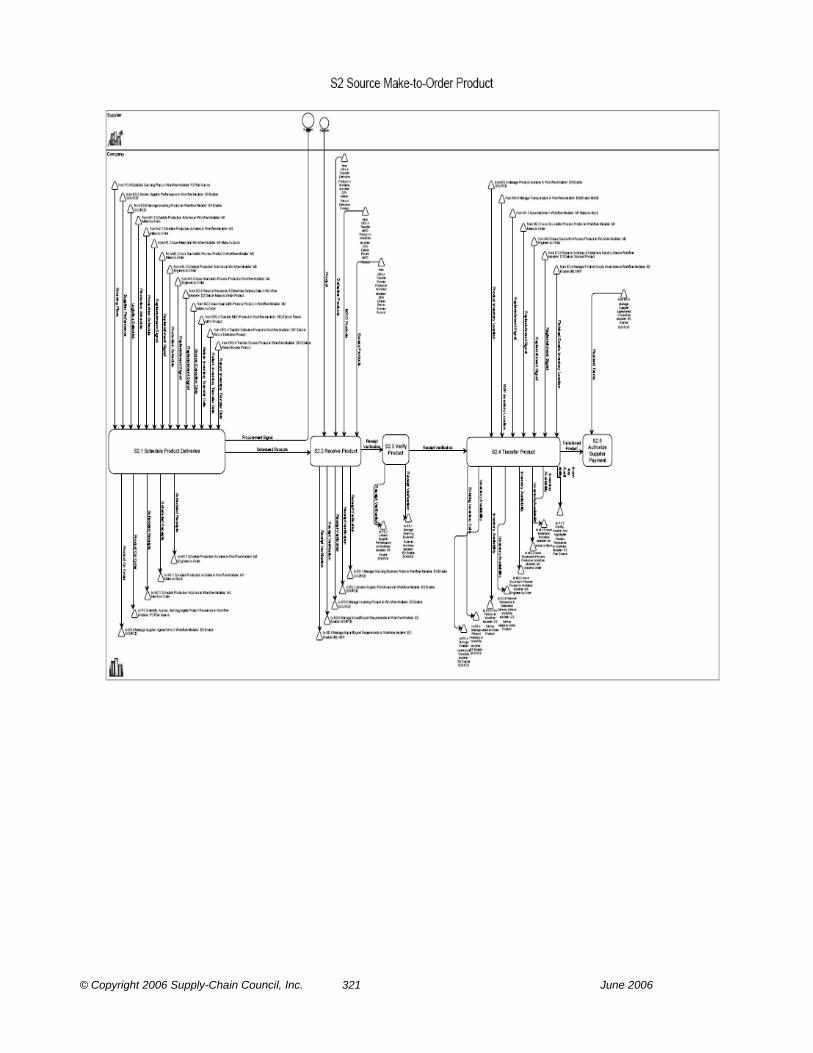
© Copyright 2006 Supply-Chain Council, Inc. 321 June 2006
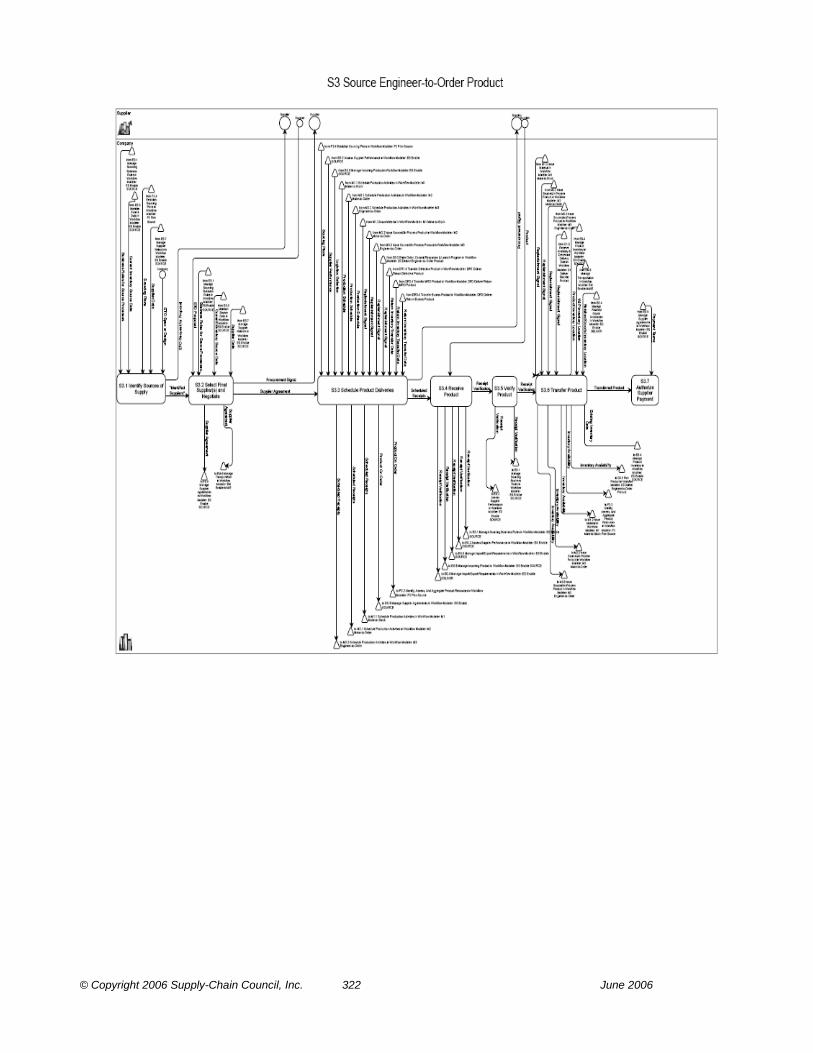
© Copyright 2006 Supply-Chain Council, Inc. 322 June 2006

© Copyright 2006 Supply-Chain Council, Inc. 323 June 2006

© Copyright 2006 Supply-Chain Council, Inc. 324 June 2006

© Copyright 2006 Supply-Chain Council, Inc. 325 June 2006
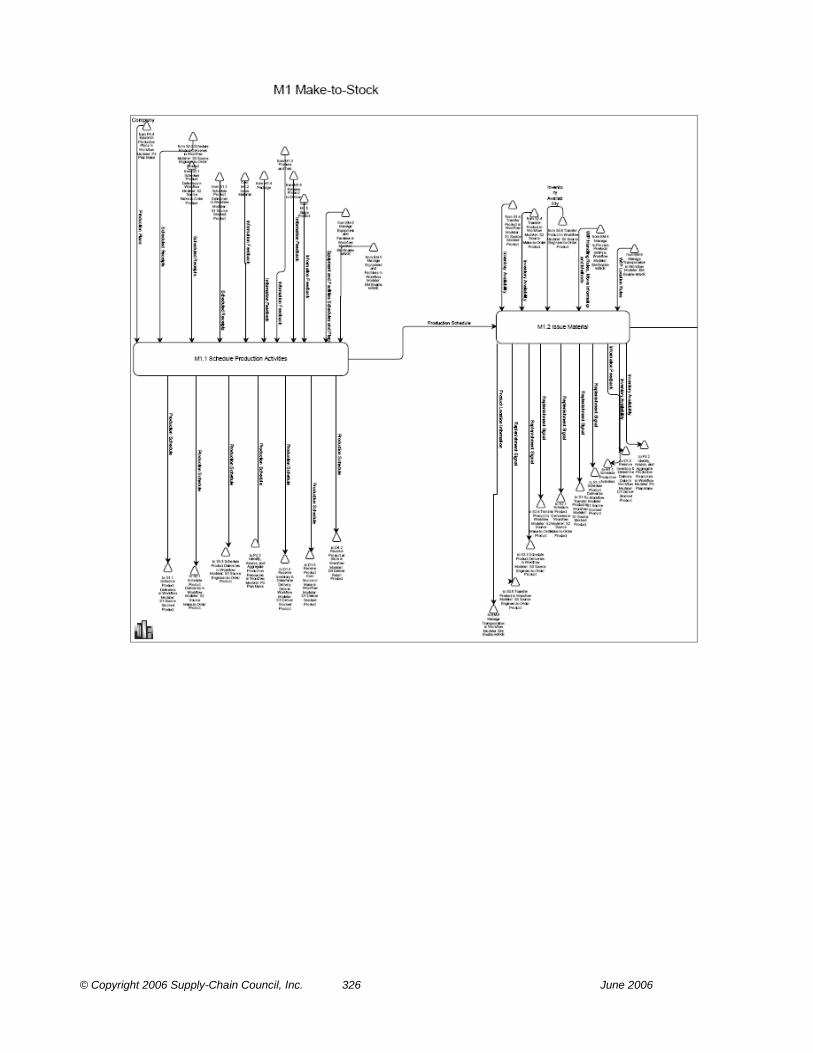
© Copyright 2006 Supply-Chain Council, Inc. 326 June 2006
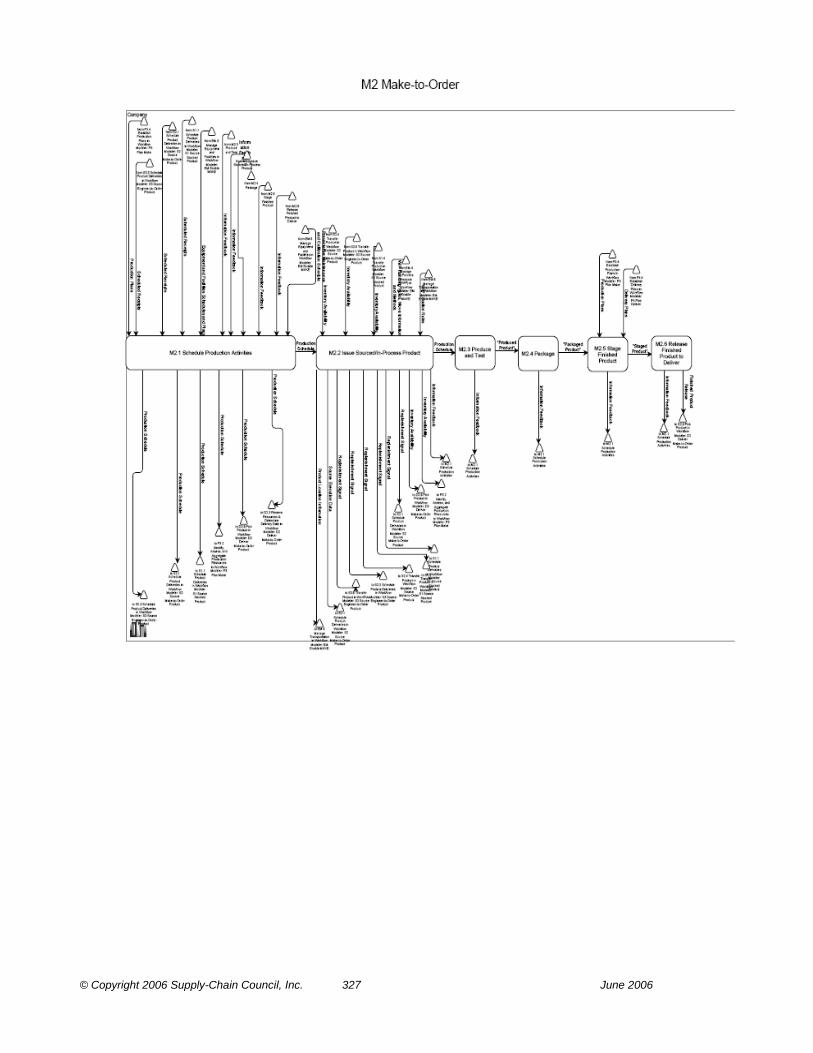
© Copyright 2006 Supply-Chain Council, Inc. 327 June 2006

© Copyright 2006 Supply-Chain Council, Inc. 328 June 2006
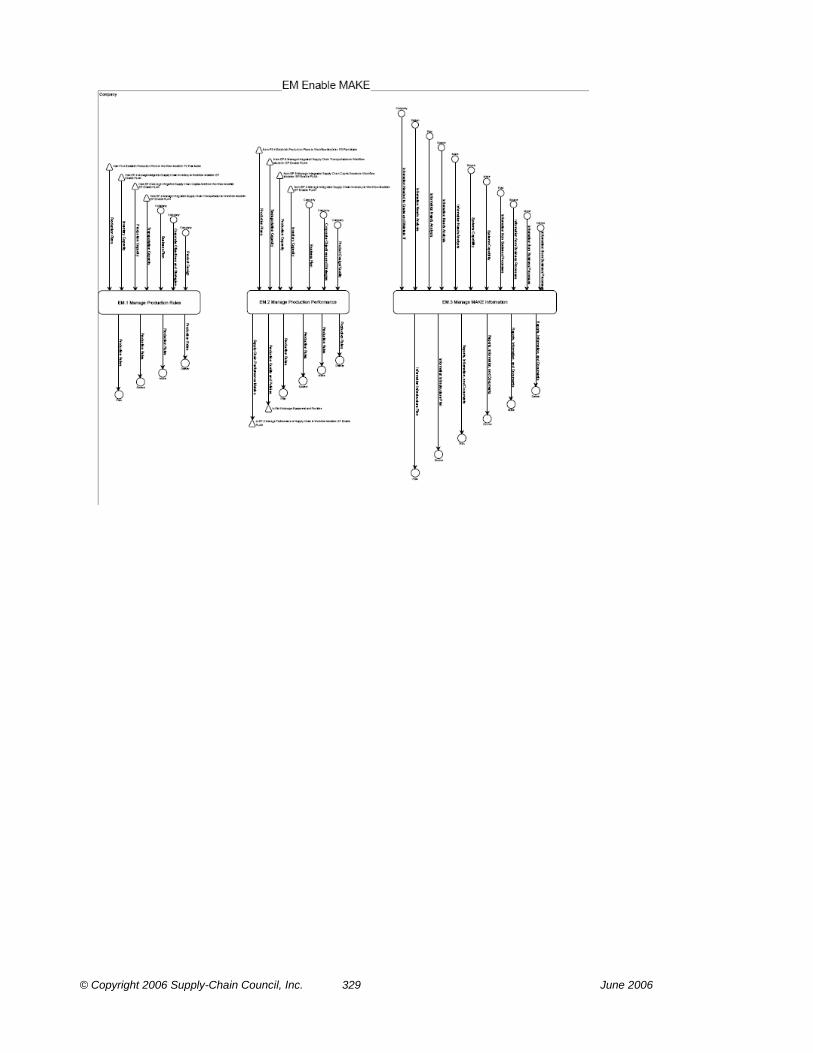
© Copyright 2006 Supply-Chain Council, Inc. 329 June 2006

© Copyright 2006 Supply-Chain Council, Inc. 330 June 2006
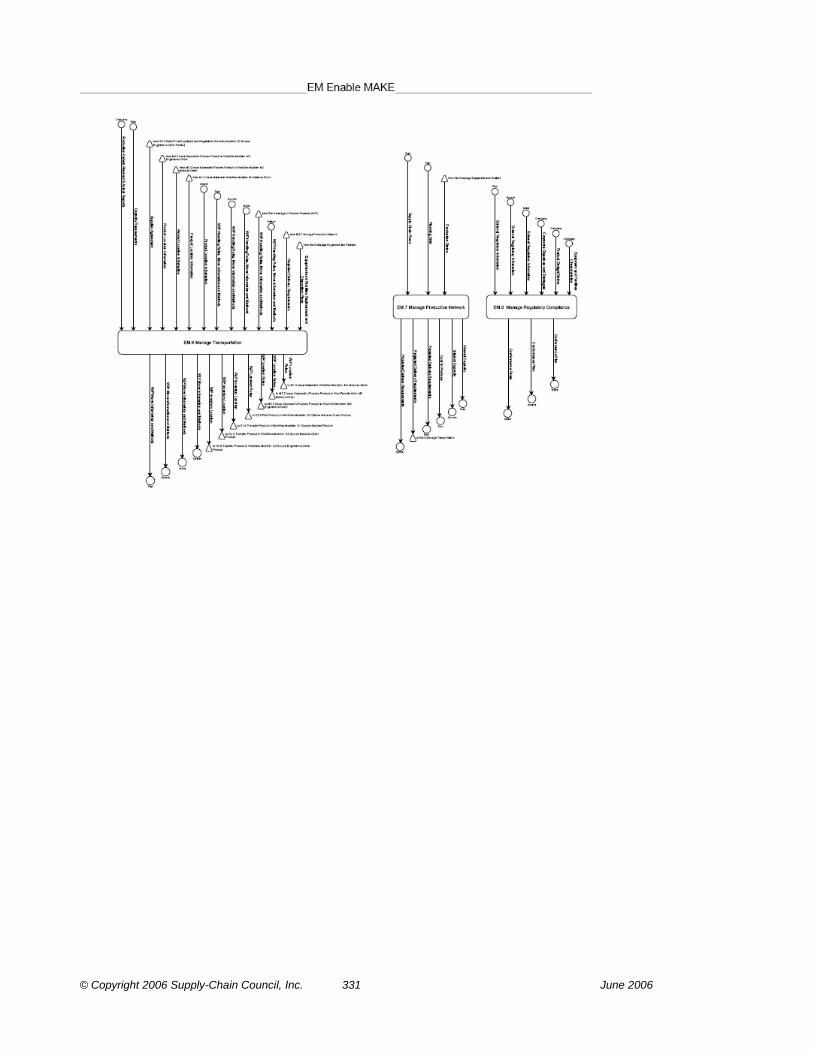
© Copyright 2006 Supply-Chain Council, Inc. 331 June 2006

© Copyright 2006 Supply-Chain Council, Inc. 332 June 2006

© Copyright 2006 Supply-Chain Council, Inc. 333 June 2006
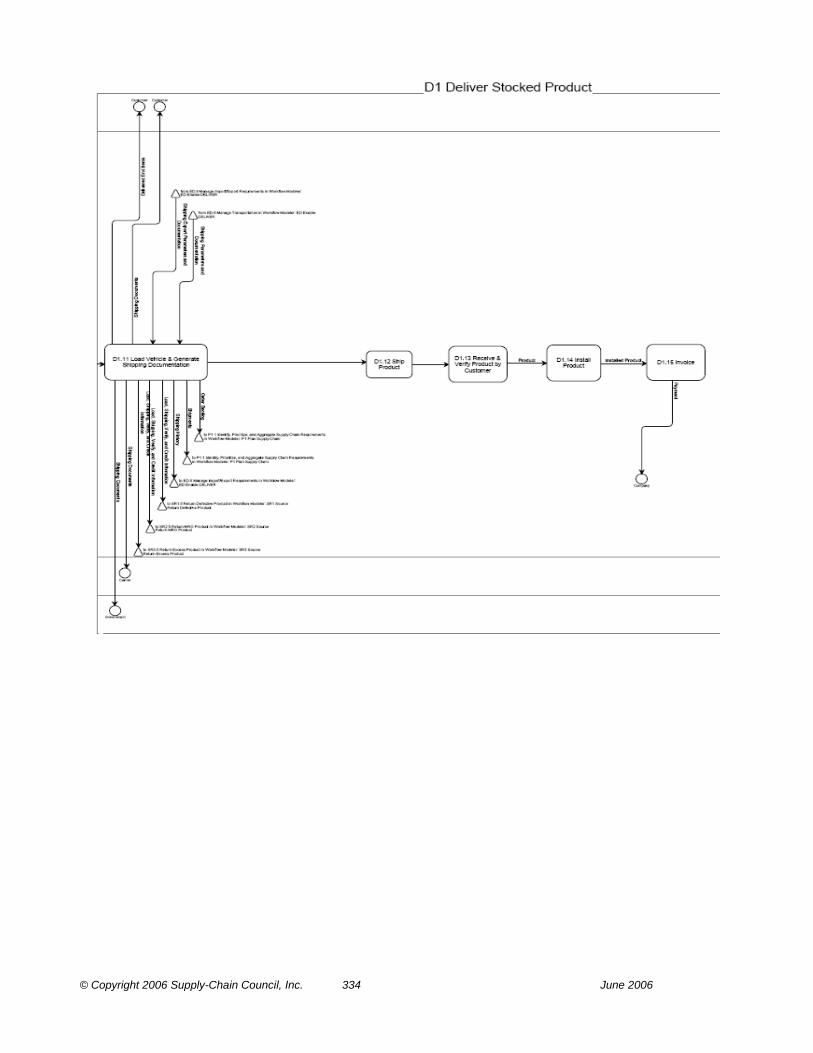
© Copyright 2006 Supply-Chain Council, Inc. 334 June 2006

© Copyright 2006 Supply-Chain Council, Inc. 335 June 2006

© Copyright 2006 Supply-Chain Council, Inc. 336 June 2006
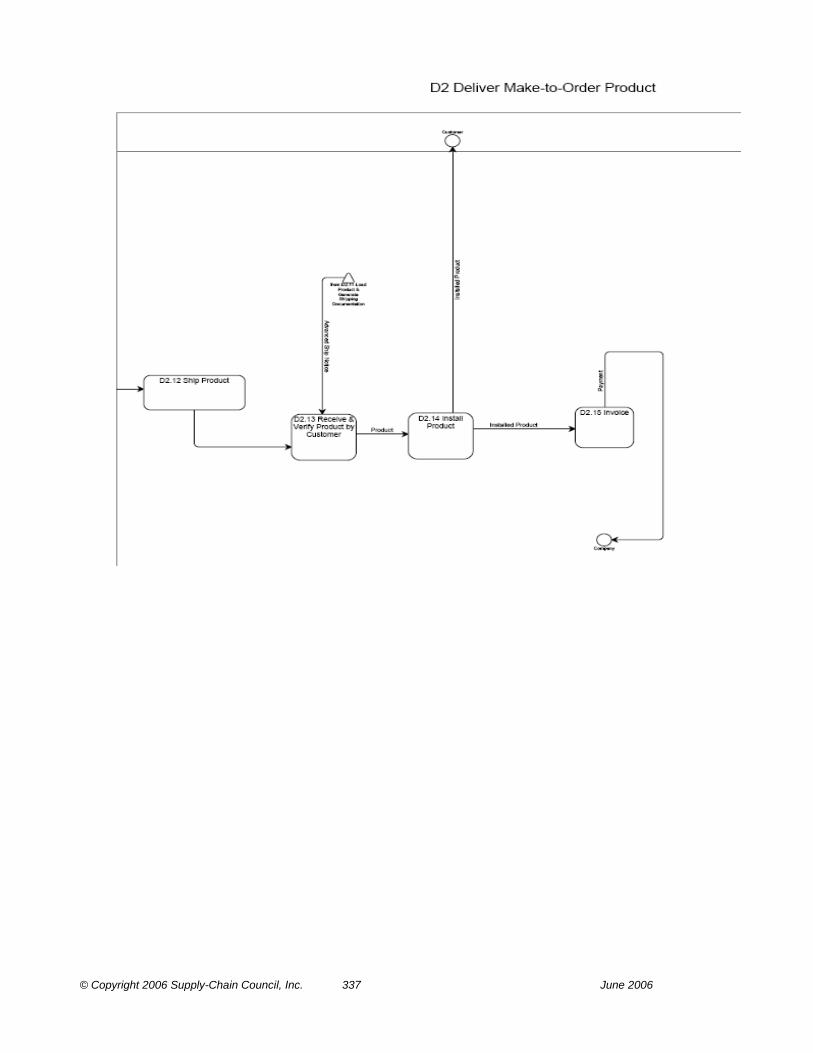
© Copyright 2006 Supply-Chain Council, Inc. 337 June 2006
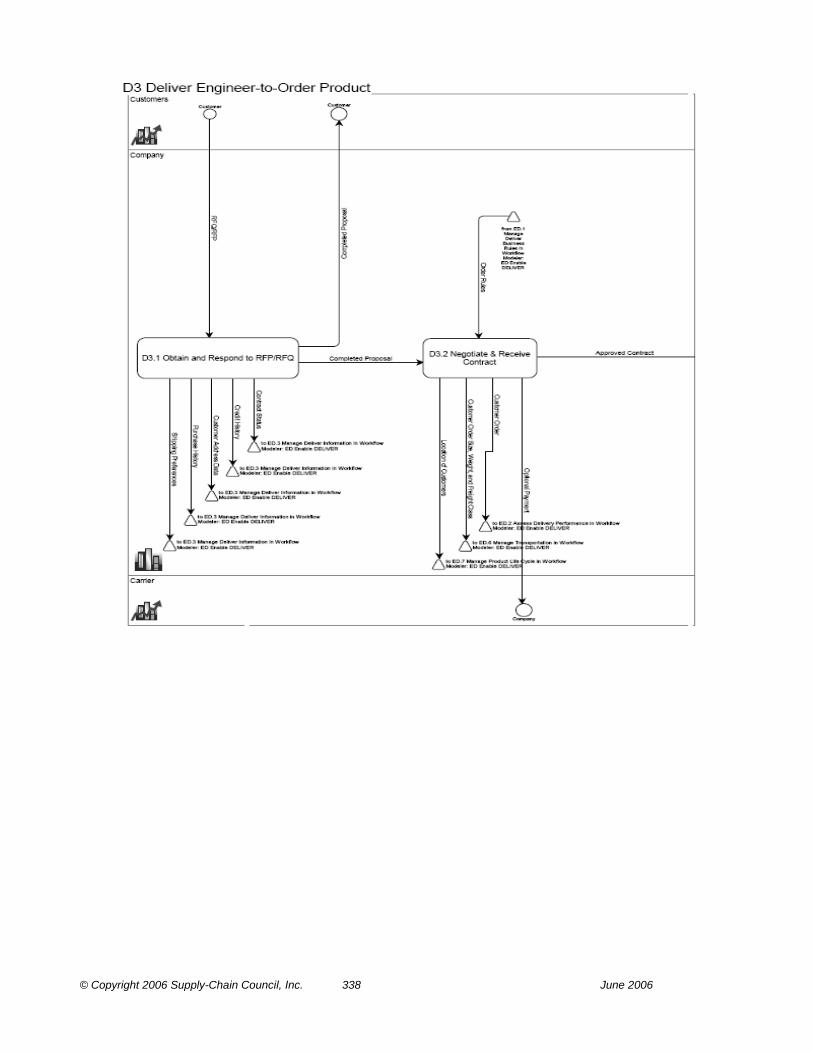
© Copyright 2006 Supply-Chain Council, Inc. 338 June 2006

© Copyright 2006 Supply-Chain Council, Inc. 339 June 2006
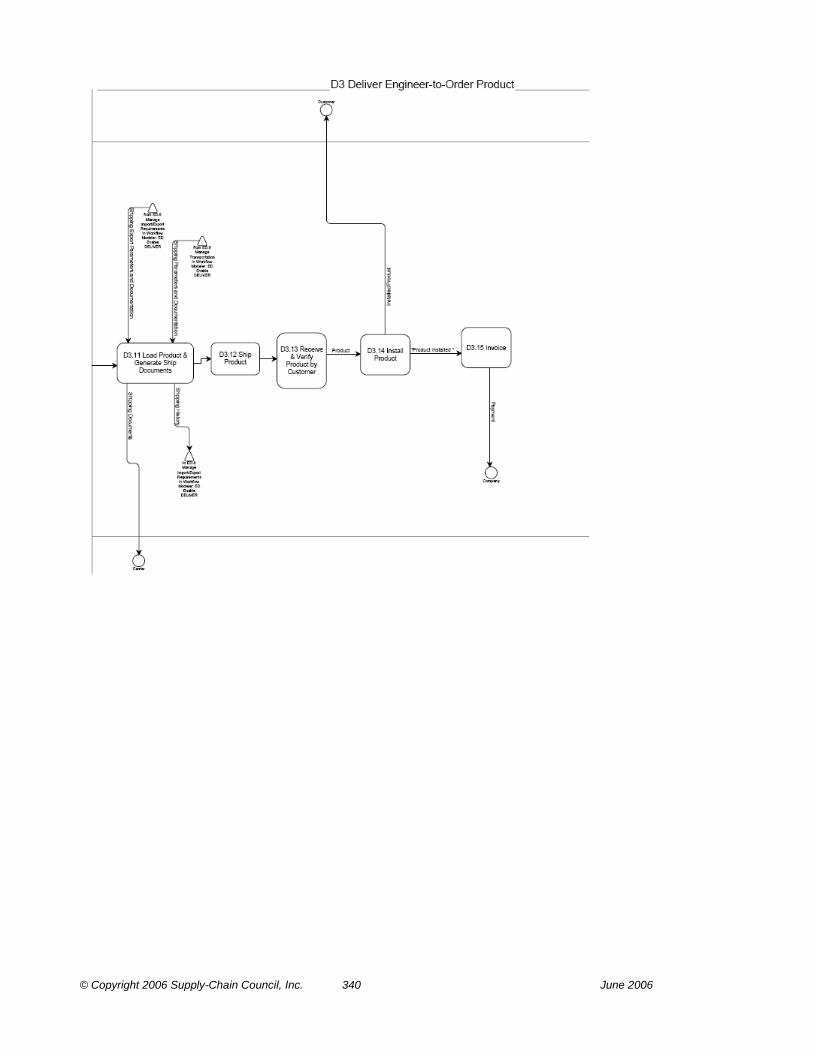
© Copyright 2006 Supply-Chain Council, Inc. 340 June 2006
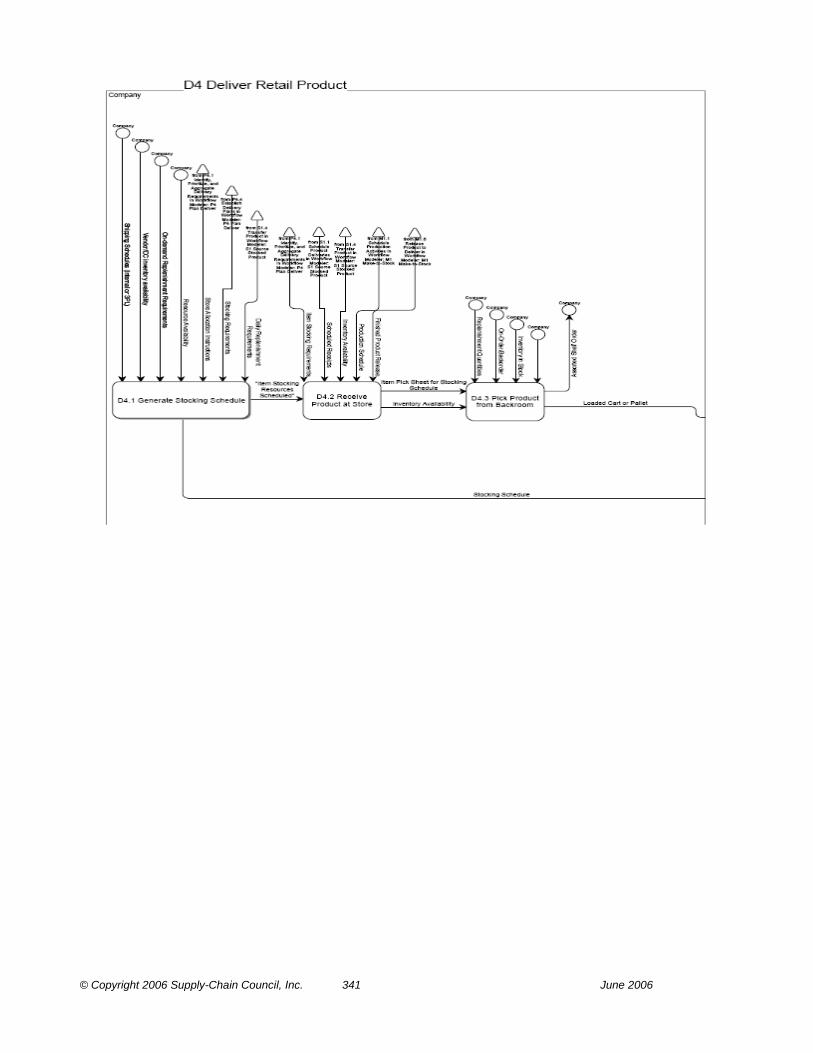
© Copyright 2006 Supply-Chain Council, Inc. 341 June 2006

© Copyright 2006 Supply-Chain Council, Inc. 342 June 2006

© Copyright 2006 Supply-Chain Council, Inc. 343 June 2006

© Copyright 2006 Supply-Chain Council, Inc. 344 June 2006

© Copyright 2006 Supply-Chain Council, Inc. 345 June 2006
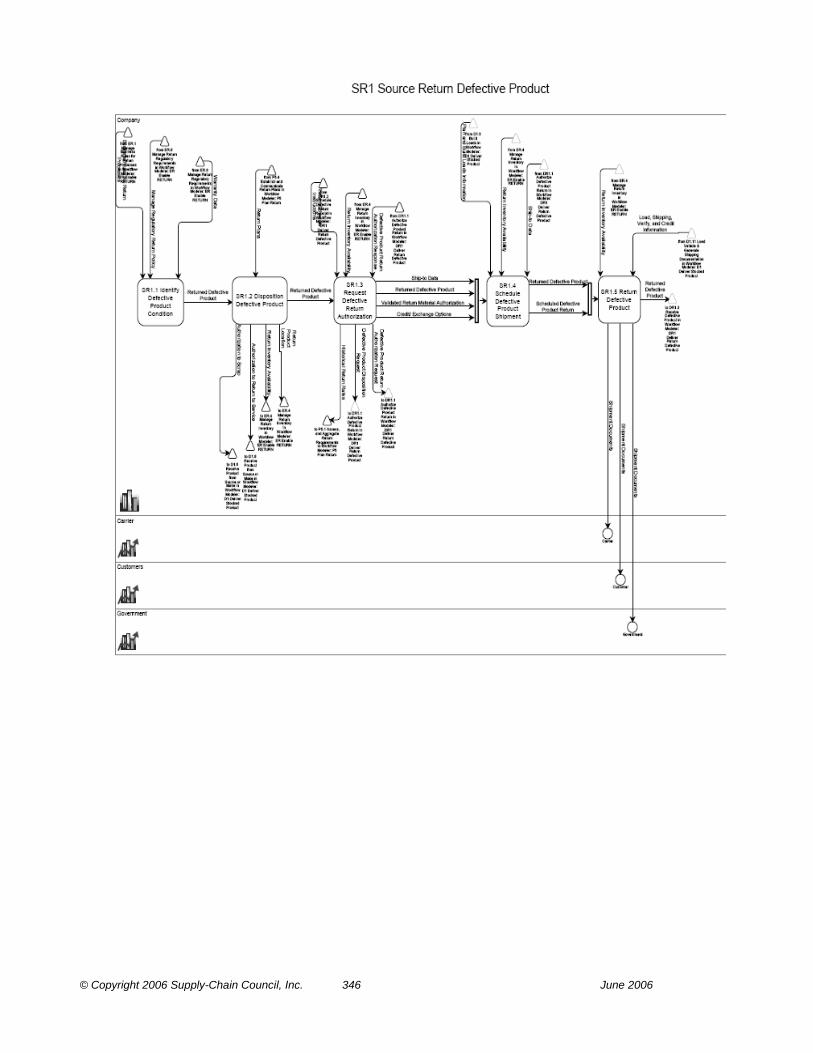
© Copyright 2006 Supply-Chain Council, Inc. 346 June 2006

© Copyright 2006 Supply-Chain Council, Inc. 347 June 2006
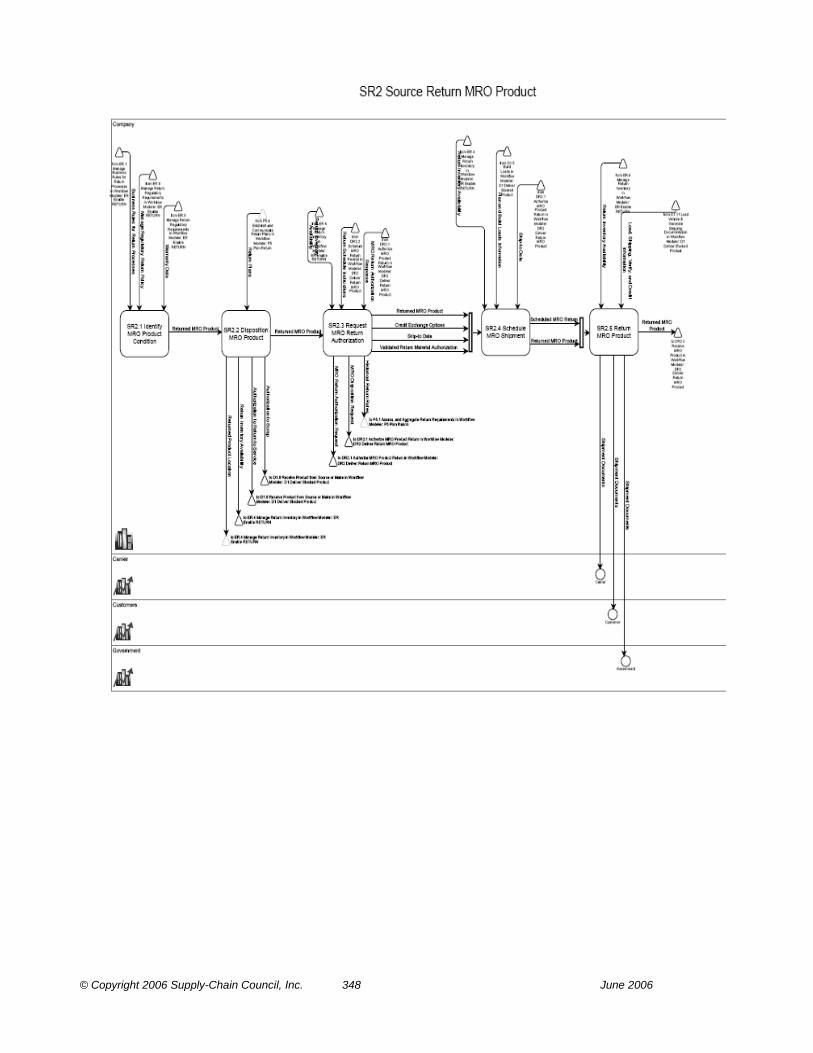
© Copyright 2006 Supply-Chain Council, Inc. 348 June 2006

© Copyright 2006 Supply-Chain Council, Inc. 349 June 2006

© Copyright 2006 Supply-Chain Council, Inc. 350 June 2006
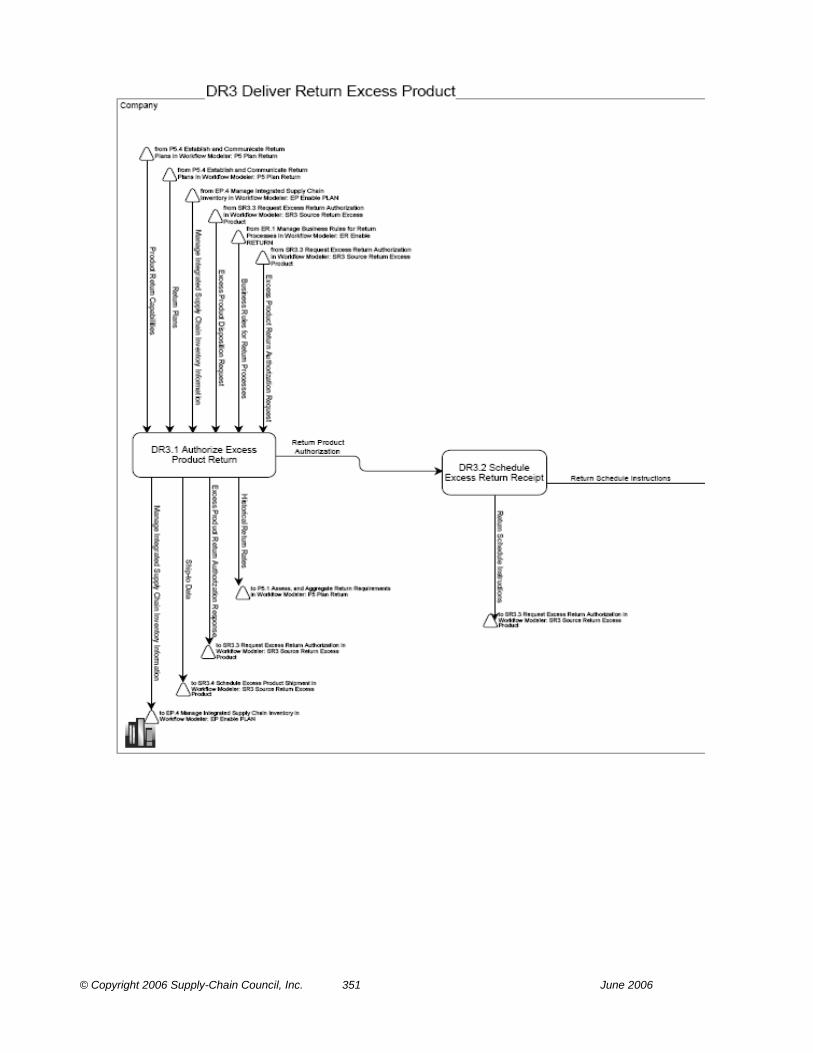
© Copyright 2006 Supply-Chain Council, Inc. 351 June 2006
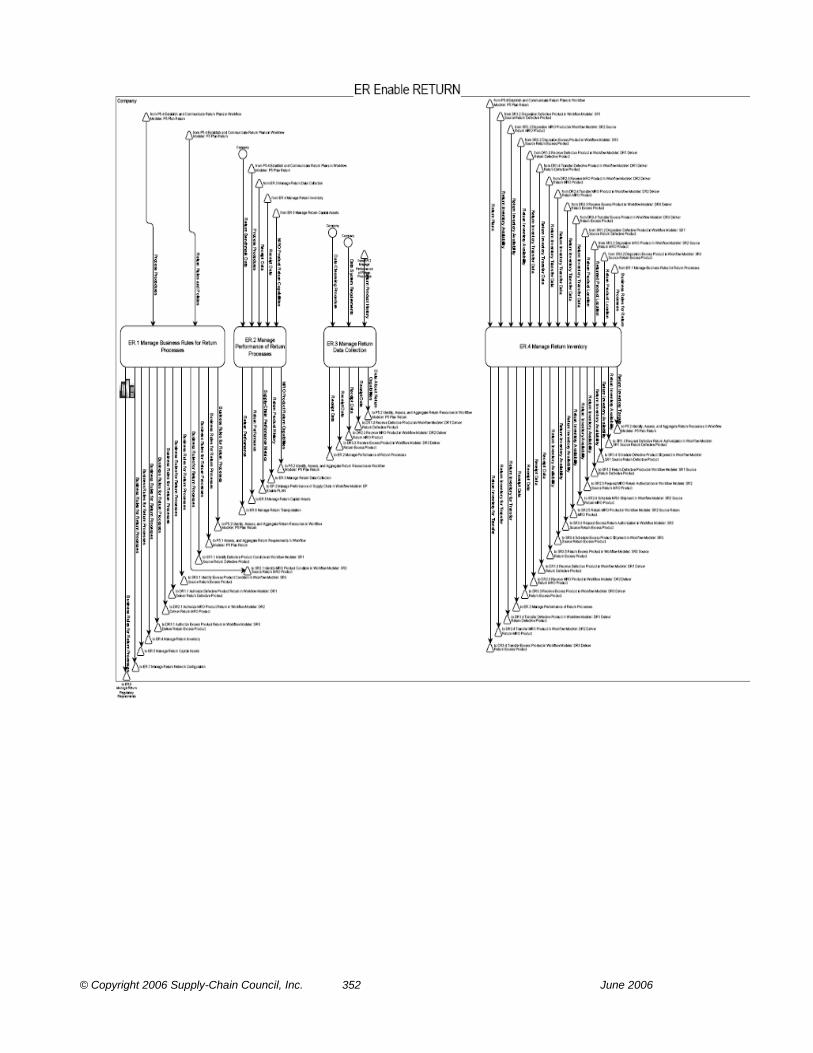
© Copyright 2006 Supply-Chain Council, Inc. 352 June 2006
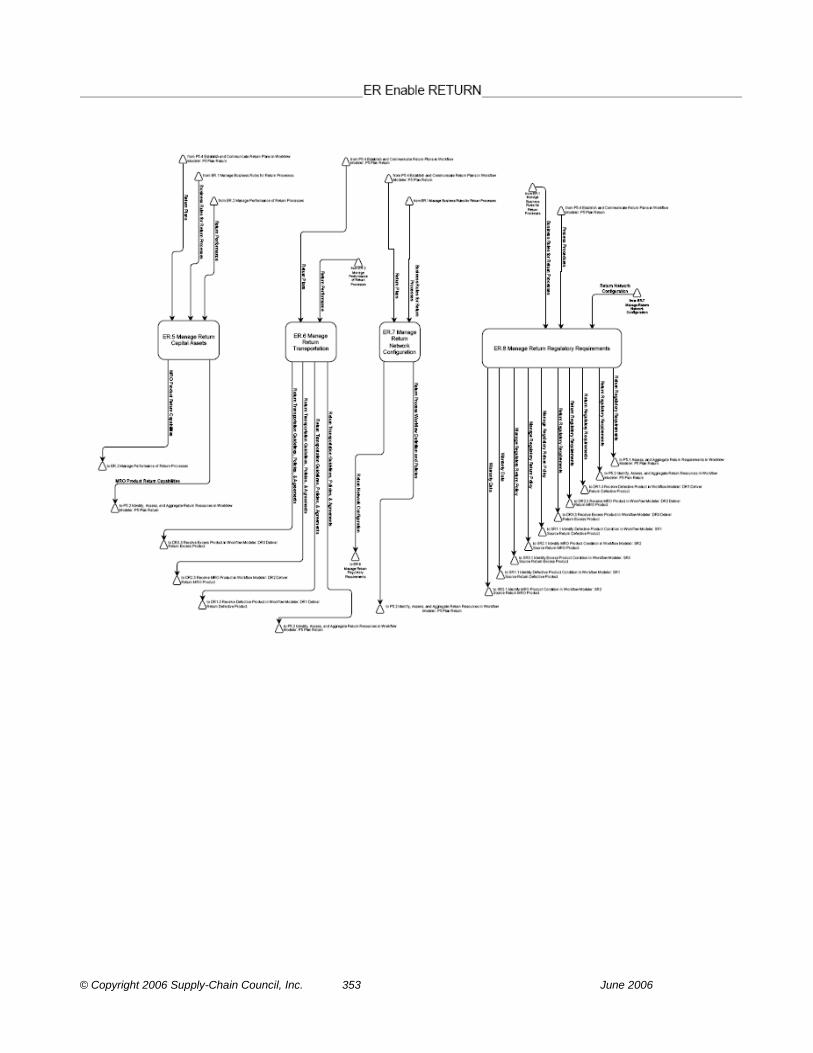
© Copyright 2006 Supply-Chain Council, Inc. 353 June 2006

© Copyright 2006 Supply-Chain Council, Inc. 354 June 2006
GLOSSARY PROCESS TERMS PROCESS TERM NAME DEFINITION
D Deliver
Processes that provide finished goods and services to meet planned or actual demand, typically including order management, transportation management, and distribution management.
D1 Deliver Stocked Product The process of delivering product that is maintained in a finished goods state prior to the receipt of a firm customer order.
D1.1 Process Inquiry & Quote Receive and respond to general customer inquiries and requests for quotes.
D1.10 Pack Product
The activities such as sorting / combining the products, packing / kitting the products, paste labels, barcodes etc. and delivering the products to the shipping area for loading.
D1.11 Load Vehicle & Generate Shipping Documentation
The series of tasks including placing/loading product onto modes of transportation and generating the documentation necessary to meet internal, customer, carrier and government needs..
D1.12 Ship Product The process of shipping the product to the customer site.
D1.13 Receive & Verify Product by Customer
The process of receiving the shipment by the customer site (either at customer site or at shipping area in case of self-collection) and verifying that the order was shipped complete and that the product meets delivery terms.
D1.14 Install Product When necessary, the process of preparing, testing and installing the product at the customer site. The product is fully functional upon completion.
D1.15 Invoice
A signal is sent to the financial organization that the order has been shipped and that the billing process should begin and payment be received or be closed out if payment has already been received. Payment is received from the customer within the payment terms of the invoice.
D1.2 Receive, Enter & Validate Order
Receive orders from the customer and enter them into a company's order processing system. Orders can be received through phone, fax, or electronic media. "Technically" examine orders to ensure an orderable configuration and provide accurate price. Check the customer's credit. Optionally accept payment.
D1.3 Reserve Inventory & Determine Delivery Date
Inventory and/or planned capacity (both on hand and scheduled) is identified and reserved for specific orders and a delivery date is committed and scheduled.
D1.4 Consolidate Orders The process of analyzing orders to determine the groupings that result in least cost/best service fulfillment and transportation.
D1.5 Build Loads Transportation modes are selected and efficient loads are built. D1.6 Route Shipments Loads are consolidated and routed by mode, lane and location. D1.7 Select Carriers & Rate Shipments
Specific carriers are selected by lowest cost per route and shipments are rated and tendered.
D1.8 Receive Product from Source or Make
The activities such as receiving product, verifying, recording product receipt, determining put-away location, putting away and recording location that a company performs at its own warehouses. May include quality inspection.
D1.9 Pick Product
The series of activities including retrieving orders to pick, determining inventory availability, building the pick wave, picking the product, recording the pick and delivering product to shipping in response to an order.
D2 Deliver Make-to-Order Product
The process of delivering product that is manufactured, assembled or configured from standard parts or subassemblies. Manufacture, assembly or configuration will begins only after the receipt and validation of a firm customer order.
D2.1 Process Inquiry & Quote Receive and respond to general customer inquiries and requests for quotes.
D2.10 Pack Product
The activities such as sorting / combining the products, packing / kitting the products, paste labels, barcodes etc. ande delivering the products to the shipping area for loading.
D2.11 Load Product & Generate Shipping Documentation
The series of tasks including placing/loading product onto modes of transportation and generating the documentation necessary to meet internal, customer, carrier and government needs..
D2.12 Ship Product The process of shipping the product to the customer site.
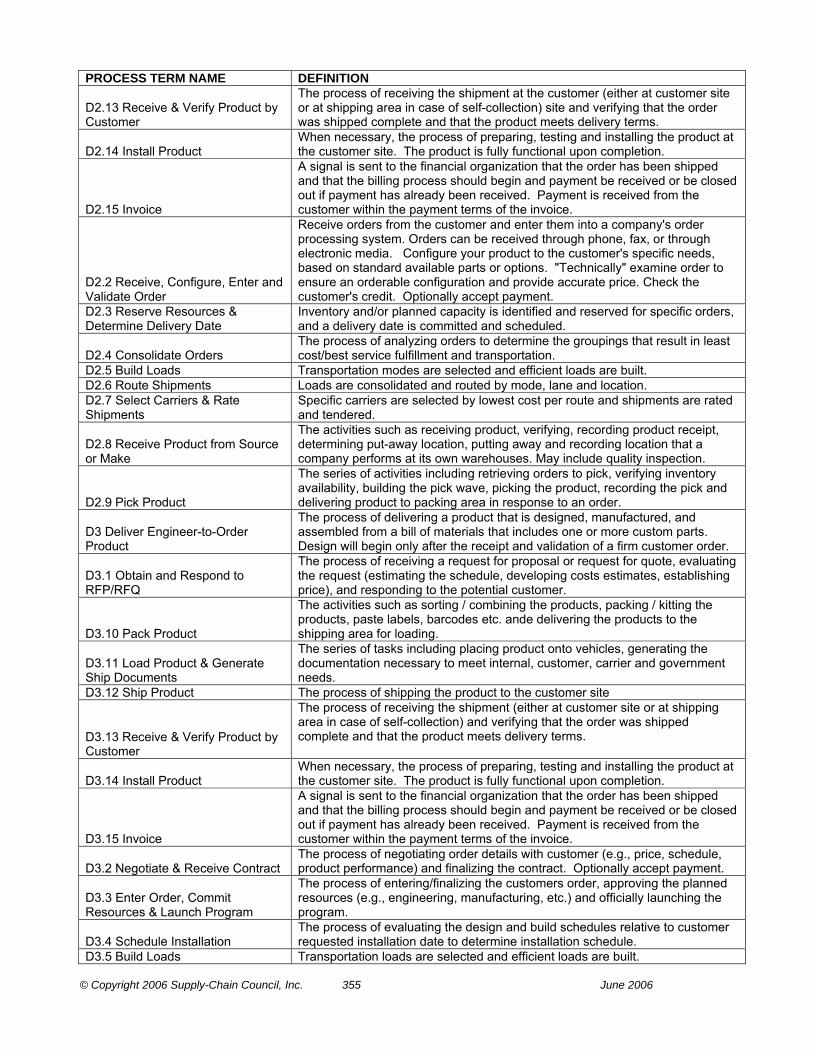
© Copyright 2006 Supply-Chain Council, Inc. 355 June 2006
PROCESS TERM NAME DEFINITION
D2.13 Receive & Verify Product by Customer
The process of receiving the shipment at the customer (either at customer site or at shipping area in case of self-collection) site and verifying that the order was shipped complete and that the product meets delivery terms.
D2.14 Install Product When necessary, the process of preparing, testing and installing the product at the customer site. The product is fully functional upon completion.
D2.15 Invoice
A signal is sent to the financial organization that the order has been shipped and that the billing process should begin and payment be received or be closed out if payment has already been received. Payment is received from the customer within the payment terms of the invoice.
D2.2 Receive, Configure, Enter and Validate Order
Receive orders from the customer and enter them into a company's order processing system. Orders can be received through phone, fax, or through electronic media. Configure your product to the customer's specific needs, based on standard available parts or options. "Technically" examine order to ensure an orderable configuration and provide accurate price. Check the customer's credit. Optionally accept payment.
D2.3 Reserve Resources & Determine Delivery Date
Inventory and/or planned capacity is identified and reserved for specific orders, and a delivery date is committed and scheduled.
D2.4 Consolidate Orders The process of analyzing orders to determine the groupings that result in least cost/best service fulfillment and transportation.
D2.5 Build Loads Transportation modes are selected and efficient loads are built. D2.6 Route Shipments Loads are consolidated and routed by mode, lane and location. D2.7 Select Carriers & Rate Shipments
Specific carriers are selected by lowest cost per route and shipments are rated and tendered.
D2.8 Receive Product from Source or Make
The activities such as receiving product, verifying, recording product receipt, determining put-away location, putting away and recording location that a company performs at its own warehouses. May include quality inspection.
D2.9 Pick Product
The series of activities including retrieving orders to pick, verifying inventory availability, building the pick wave, picking the product, recording the pick and delivering product to packing area in response to an order.
D3 Deliver Engineer-to-Order Product
The process of delivering a product that is designed, manufactured, and assembled from a bill of materials that includes one or more custom parts. Design will begin only after the receipt and validation of a firm customer order.
D3.1 Obtain and Respond to RFP/RFQ
The process of receiving a request for proposal or request for quote, evaluating the request (estimating the schedule, developing costs estimates, establishing price), and responding to the potential customer.
D3.10 Pack Product
The activities such as sorting / combining the products, packing / kitting the products, paste labels, barcodes etc. ande delivering the products to the shipping area for loading.
D3.11 Load Product & Generate Ship Documents
The series of tasks including placing product onto vehicles, generating the documentation necessary to meet internal, customer, carrier and government needs.
D3.12 Ship Product The process of shipping the product to the customer site
D3.13 Receive & Verify Product by Customer
The process of receiving the shipment (either at customer site or at shipping area in case of self-collection) and verifying that the order was shipped complete and that the product meets delivery terms.
D3.14 Install Product When necessary, the process of preparing, testing and installing the product at the customer site. The product is fully functional upon completion.
D3.15 Invoice
A signal is sent to the financial organization that the order has been shipped and that the billing process should begin and payment be received or be closed out if payment has already been received. Payment is received from the customer within the payment terms of the invoice.
D3.2 Negotiate & Receive Contract The process of negotiating order details with customer (e.g., price, schedule, product performance) and finalizing the contract. Optionally accept payment.
D3.3 Enter Order, Commit Resources & Launch Program
The process of entering/finalizing the customers order, approving the planned resources (e.g., engineering, manufacturing, etc.) and officially launching the program.
D3.4 Schedule Installation The process of evaluating the design and build schedules relative to customer requested installation date to determine installation schedule.
D3.5 Build Loads Transportation loads are selected and efficient loads are built.

© Copyright 2006 Supply-Chain Council, Inc. 356 June 2006
PROCESS TERM NAME DEFINITION
D3.6 Route Shipments The process of consolidating and routing shipments by mode, lane, and location.
D3.7 Select Carriers and Rate Shipments
Specific carriers are selected by lowest cost per route and shipments are rated and tendered.
D3.8 Receive Product from Source or Make
The activities such as receiving product, verifying, recording product receipt, determining put-away location, putting away and recording location that a company performs at its own warehouses. May include quality inspection.
D3.9 Pick Product
The series of activities including retrieving orders to pick, verifying inventory availability, building the pick wave, picking the product, recording the pick and delivering product to packing area in response to an order.
D4 Deliver Retail Product
Deliver Retail Products are the processes used to acquire, merchandise, and sell finished goods at a retail store. A retail store is a physical location that sells products (and services) direct to the consumer using a point of sale process (manual or automated) to collect payment. Merchandising at a store level is the stocking and restocking of products in designated storage locations to generate sales in a retail store.
D4.1 Generate Stocking Schedule The process of scheduling resources to support item-stocking requirements.
D4.2 Receive Product at Store
The activities such as receiving product, verifying, recording product receipt, determining put-away location, putting away and recording location that a company performs at its own stores. May include quality inspection.
D4.3 Pick Product from Backroom
The process of retrieving restocking orders to pick, determining inventory availability, building a pick wave, picking item and quantity from a designated backroom warehouse location, recording the resulting inventory transaction, and delivering the product to point of stock
D4.4 Stock Shelf
For restocks, the tasks associated with identifying the item location, stocking the shelf according to merchandise plans, and recording the appropriate inventory transaction. For promotional items and stock repositioning the tasks associated with shelf and point of sale preparation, stock placement, and end of sale activities.
D4.5 Fill Shopping Cart Typical set of tasks associated with product selection, storage and movement through to checkout.
D4.6 Checkout
The processes and tasks associated with product checkout including scanning, method of payment, credit application and approval, service agreement, order confirmation, and/or invoice or receipt.
D4.7 Deliver and/or Install The process of preparing and installing the product at the customer site. The product is fully functional upon completion.
DR Deliver Return Processes associated with receiving returned products for any reason. These processes extend into post-delivery customer support.
DR1 Deliver Return Defective Product
The processes of the last known holder or designated return center authorizing and scheduling the defective product return and the physical receipt of the item by the last known holder or known return center and their transfer of the item for final disposition determination. The process includes communication between the customer and last known holder or known return center and the generation of associated documentation.
DR1.1 Authorize Defective Product Return
The process where the last known holder or designated return center receives a defective product return authorization request from a customer, determines if the item can be accepted and communicates decision to the customer. Accepting the request would include negotiating the conditions of the return with the customer, including authorizing return replacement or credit. Rejecting the request would include providing a reason for the rejection to the customer.
DR1.2 Schedule Defective Return Receipt
The process where the last known holder or designated return center evaluates the defective product handling requirements including negotiated conditions and develops a schedule that tells the Customer when to ship the product. The scheduling activity would also inform Receiving when to expect the shipment and where to send the product, for disposition, upon receipt.
DR1.3 Receive Defective Product
The process where the last known holder or designated return center receives and verifies the returned defective product against the return authorization and other documentation and prepares the item for transfer.

© Copyright 2006 Supply-Chain Council, Inc. 357 June 2006
PROCESS TERM NAME DEFINITION
DR1.4 Transfer Defective Product
The process where the last known holder or designated return center transfers the defective product to the appropriate process to implement the disposition decision.
DR2 Deliver Return MRO Product
The processes of the service provider authorizing and scheduling the MRO return product and the physical receipt of the item by the service provider and their transfer of the item for final disposition determination. The process includes communication between the customer and service provider and the generation of associated documentation.
DR2.1 Authorize MRO Product Return
The process where a service provider receives an MRO product return authorization request from a customer, determines if the item can be accepted for MRO and communicates their decision to the customer. Accepting the request would include negotiating the conditions of the return with the customer, including authorizing return replacement or credit. Rejecting the request would include providing a reason for the rejection to the customer.
DR2.2 Schedule MRO Return Receipt
The process where the service provider evaluates the MRO service requirements including negotiated conditions and develops a schedule that tells the Customer when to ship the part. The scheduling activity would also inform Receiving when to expect the shipment and where to send the part, for induction or storage, upon receipt.
DR2.3 Receive MRO Product
The process where the service provider receives and verifies the returned MRO item against the return authorization and other documentation and prepares the item for transfer (includes verify).
DR2.4 Transfer MRO Product The process where the service provider transfers the MRO product to the appropriate process to implement the disposition decision.
DR3 Deliver Return Excess Product
The processes of the designated return center authorizing and scheduling the excess product return, the physical receipt of the item by the designated return center and transfer of the item for final disposition The process includes communication between the customer and designated return center and the generation of associated documentation.
DR3.1 Authorize Excess Product Return
The process where the designated return center receives an excess product return authorization request from a customer, determines if the item can be accepted and communicates their decision to the customer. Accepting the request would include negotiating the conditions of the return with the customer, including authorizing credit or cash discount. Rejecting the request would include providing a reason for the rejection to the customer.
DR3.2 Schedule Excess Return Receipt
The process where the designated return center evaluates an authorized excess material return to determine packaging and handling requirements. This assessment will lead to the development of a return disposition decision and a return schedule with terms and conditions that will tell the Customer how and when to ship the product. The scheduling activity would also inform the Return Center's Receiving department when to expect the shipment and where to send the product, for disposition, upon receipt.
DR3.3 Receive Excess Product
The process where the designated return center receives and verifies the returned excess product and associated documentation against the return authorization and other documentation and prepares the item for transfer. Administrate any discrepancies that arise.
DR3.4 Transfer Excess Product The process where the designated return center transfers the excess product to the appropriate process to implement the disposition decision.
ED Enable Deliver Enable Processes prepare, maintain, or manage information or relationships on which planning and execution processes rely.
ED.1 Manage Deliver Business Rules
The process of defining and maintaining rules which affect the acceptance of an order, based on quantity, method of delivery, credit, customer experience, etc. (Include distribution channel rules)
ED.2 Assess Delivery Performance
The process of defining the requirement and monitoring the performance of the delivery of product to a customer. When physical delivery is out-sourced the performance is passed on to source for contract administration.

© Copyright 2006 Supply-Chain Council, Inc. 358 June 2006
PROCESS TERM NAME DEFINITION
ED.3 Manage Deliver Information
The process of collecting, maintaining, and communicating information to support deliver planning and execution processes. The information to be managed includes: order data - (customer preference, history, status, and delivery requirements, etc.), warehouse data, transportation data, and deliver data.
ED.4 Manage Finished Goods Inventories
The process of establishing and maintaining finished goods, inventory limits or levels, replenishment models, ownership, product mix, stocking locations.
ED.5 Manage Deliver Capital Assets
Acquisition, maintenance, and disposition of order management, warehouse, and transportation capital assets. Determine material handling (inventory) pick pack & ship methods (inventory), and equipment.
ED.6 Manage Transportation
The process of 1) defining and maintaining the information which characterizes product, containerization, vehicle, route, terminals, regulations, rates/tariffs and backhaul opportunity (Characterization include information necessary to support maintenance of internal Outbound Transportation equipment - CAPITAL ASSETS) and 2) the management of transporters.
ED.7 Manage Product Life Cycle The process of defining and maintaining the distribution channel/ network for a specific product line (no capital asset or transportation management).
ED.8 Manage Import/Export Requirements
The process of recording and maintaining regulations and rates, which constrain the ordering and delivering of product. Determine customs requirements, establish letters of credit terms and conditions, etc.
EM Enable Make Enable Processes prepare, maintain, or manage information or relationships on which planning and execution processes rely.
EM.1 Manage Production Rules
The process of establishing, maintaining, and enforcing rules for managing production details in line with business strategy, goals, and objectives. Production details include part/item master, bills of materials/formulas, routings, processes, equipment requirements, tooling, and other information specifying the method of production for a particular product.
EM.2 Manage Production Performance
The process of developing and maintaining performance standards and analysis methods to compare actual production performance against the established standards. This process allows the development and implementation of a course of action to achieve targeted performance.
EM.3 Manage MAKE Information
The process of managing, collecting, maintaining, and communicating information to support MAKE planning and execution processes. The information to be managed includes production, order and process data.
EM.4 Manage In-Process Products (WIP)
The process of establishing and maintaining limits or levels, replenishment models, ownership, product mix and stocking locations for In-Process Product (WIP). Management of the activities associated with handling/storage/movement of materials used to support production.
EM.5 Manage Equipment and Facilities
The process of specifying maintaining and dispositioning MAKE's capital assets to operate the supply chain production processes. This process element includes repairs, alterations, calibration and other miscellaneous items to maintain production capabilities of the manufacturing fixed asset base. The ongoing management of the activities associated with ensuring equipment and facilities are kept in proper order.
EM.6 Manage Transportation
The process of transporting In-Process Product (WIP). This includes management of the activities associated with in transit handling and movement of In-Process Product (WIP).
EM.7 Manage Production Network
The process of identifying and maintaining a network of intra-company production units that deliver specific semi-finished materials or product sets to the final production site.
EM.8 Manage Regulatory Compliance
The process of identifying and complying with regulatory documentation and process standards set by external entities (e.g. government)
EP Enable PLAN
A plan for the development and establishment of courses of action over specified time periods to appropriate delivery resources to meet projected delivery requirements. The plan contains necessary business requirements for information and relationships to effectively and efficiently PLAN the Supply Chain.
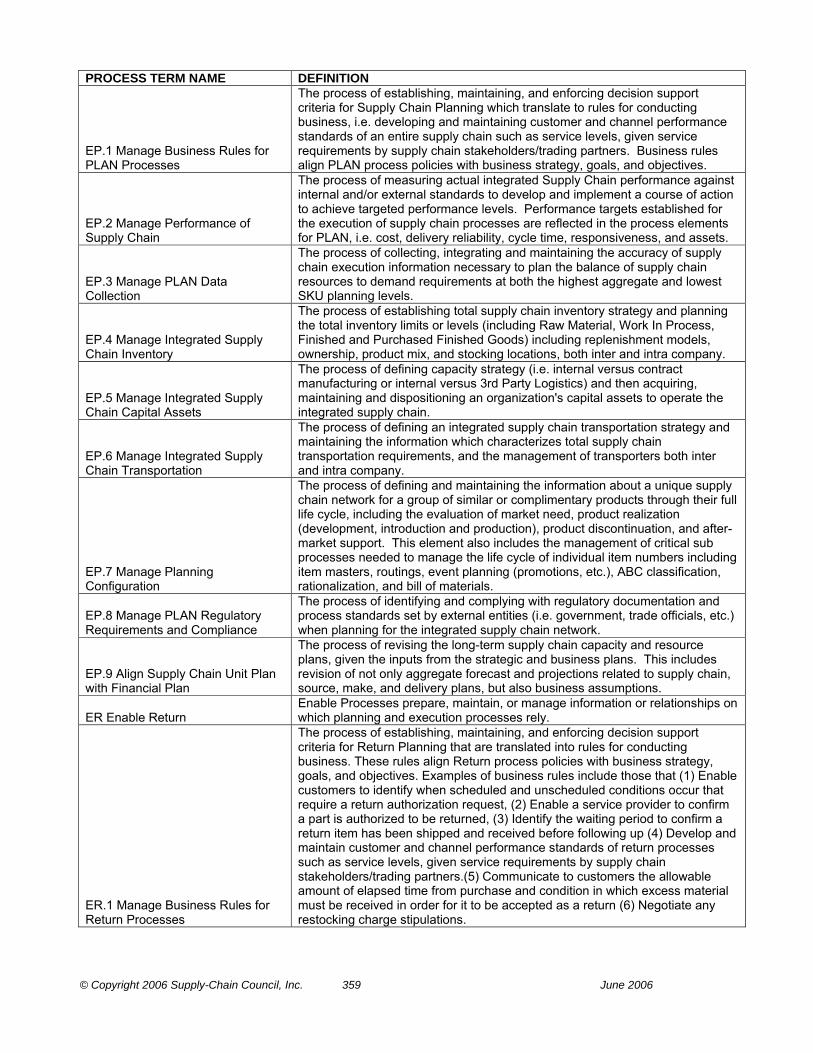
© Copyright 2006 Supply-Chain Council, Inc. 359 June 2006
PROCESS TERM NAME DEFINITION
EP.1 Manage Business Rules for PLAN Processes
The process of establishing, maintaining, and enforcing decision support criteria for Supply Chain Planning which translate to rules for conducting business, i.e. developing and maintaining customer and channel performance standards of an entire supply chain such as service levels, given service requirements by supply chain stakeholders/trading partners. Business rules align PLAN process policies with business strategy, goals, and objectives.
EP.2 Manage Performance of Supply Chain
The process of measuring actual integrated Supply Chain performance against internal and/or external standards to develop and implement a course of action to achieve targeted performance levels. Performance targets established for the execution of supply chain processes are reflected in the process elements for PLAN, i.e. cost, delivery reliability, cycle time, responsiveness, and assets.
EP.3 Manage PLAN Data Collection
The process of collecting, integrating and maintaining the accuracy of supply chain execution information necessary to plan the balance of supply chain resources to demand requirements at both the highest aggregate and lowest SKU planning levels.
EP.4 Manage Integrated Supply Chain Inventory
The process of establishing total supply chain inventory strategy and planning the total inventory limits or levels (including Raw Material, Work In Process, Finished and Purchased Finished Goods) including replenishment models, ownership, product mix, and stocking locations, both inter and intra company.
EP.5 Manage Integrated Supply Chain Capital Assets
The process of defining capacity strategy (i.e. internal versus contract manufacturing or internal versus 3rd Party Logistics) and then acquiring, maintaining and dispositioning an organization's capital assets to operate the integrated supply chain.
EP.6 Manage Integrated Supply Chain Transportation
The process of defining an integrated supply chain transportation strategy and maintaining the information which characterizes total supply chain transportation requirements, and the management of transporters both inter and intra company.
EP.7 Manage Planning Configuration
The process of defining and maintaining the information about a unique supply chain network for a group of similar or complimentary products through their full life cycle, including the evaluation of market need, product realization (development, introduction and production), product discontinuation, and after-market support. This element also includes the management of critical sub processes needed to manage the life cycle of individual item numbers including item masters, routings, event planning (promotions, etc.), ABC classification, rationalization, and bill of materials.
EP.8 Manage PLAN Regulatory Requirements and Compliance
The process of identifying and complying with regulatory documentation and process standards set by external entities (i.e. government, trade officials, etc.) when planning for the integrated supply chain network.
EP.9 Align Supply Chain Unit Plan with Financial Plan
The process of revising the long-term supply chain capacity and resource plans, given the inputs from the strategic and business plans. This includes revision of not only aggregate forecast and projections related to supply chain, source, make, and delivery plans, but also business assumptions.
ER Enable Return Enable Processes prepare, maintain, or manage information or relationships on which planning and execution processes rely.
ER.1 Manage Business Rules for Return Processes
The process of establishing, maintaining, and enforcing decision support criteria for Return Planning that are translated into rules for conducting business. These rules align Return process policies with business strategy, goals, and objectives. Examples of business rules include those that (1) Enable customers to identify when scheduled and unscheduled conditions occur that require a return authorization request, (2) Enable a service provider to confirm a part is authorized to be returned, (3) Identify the waiting period to confirm a return item has been shipped and received before following up (4) Develop and maintain customer and channel performance standards of return processes such as service levels, given service requirements by supply chain stakeholders/trading partners.(5) Communicate to customers the allowable amount of elapsed time from purchase and condition in which excess material must be received in order for it to be accepted as a return (6) Negotiate any restocking charge stipulations.

© Copyright 2006 Supply-Chain Council, Inc. 360 June 2006
PROCESS TERM NAME DEFINITION
ER.2 Manage Performance of Return Processes
The process of measuring actual Return Process performance against internal and/or external standards to develop and implement a course of action to achieve targeted performance levels.
ER.3 Manage Return Data Collection
The process of collecting, cleansing, integrating and maintaining the accuracy of return execution information necessary to plan the recovery of supply chain resources.
ER.4 Manage Return Inventory
The process of establishing a return process inventory strategy and planning the recovery process inventory limits or levels (unserviceable carcasses ready for teardown/evaluation and those carcasses already evaluated and ready for repair) including replenishment models, ownership, product mix, and stocking locations, both inter and intra company.
ER.5 Manage Return Capital Assets
The process of acquiring, maintaining and dispositioning capital assets such as fork lift trucks, information systems and equipment in receiving docks that are utilized in support of Return. Management activities would include defining asset requirements, determining resource availability and conducting gap analysis and resolution. The process includes lease-buy and outsourcing decisions.
ER.6 Manage Return Transportation
The process of providing the least cost transportation of a returned product from a customer location to the appropriate service provider location within specified time frames. Can include interim transportation activities conducted within more than one service provider locations. Includes defining and implementing a Return transportation strategy throughout the supply chain, maintaining transportation-related information (rates, lead times) and managing transportation performance.
ER.7 Manage Return Network Configuration
The process where customer and service provider locations involved in the flow of returns are defined and maintained throughout the supply chain. Locations include retail and wholesale customer and supplier sites, manufacturing facilities, distribution centers, warehouses, repair depots and military bases. How unserviceable material flow throughout the network is governed by the specific supply chain's business rules. (See ER1)
ER.8 Manage Return Regulatory Requirements
The process of identifying and complying with regulatory documentation and process standards set by external entities (i.e. government, trade officials, etc.) when planning for the Return of Assets. Includes Customs requirements and Import / Export Controls.
ES Enable Source Enable Processes prepare, maintain, or manage information or relationships on which planning and execution processes rely.
ES.1 Manage Sourcing Business Rules
The process of defining requirements and establishing, maintaining and enforcing decision support criteria, in alignment with business strategy, goals and objectives. The business strategy defines the criteria for sourcing business rules that are translated into guidelines and policies for conducting business within the enterprise and other legal entities. Sourcing business rules include: supplier selection and negotiation processes, fulfillment and delivery performance and relationship definition for specific levels of collaboration and partnership.
ES.2 Assess Supplier Performance
The process of measuring actual supplier performance against internal and/or external standards, providing feedback to achieve and maintain the performance required to meet the customers' business and/or competitive needs.
ES.3 Maintain Source Data
The process of collecting, sorting, defining hierarchy and managing configuration control of supplier information and source data that are required to make sourcing and related planning and manufacturing decisions. Source data to be maintained includes supplier profile data, financials, quality and delivery performance, spend analysis at various levels of the enterprise, from major business units to material part number.
ES.4 Manage Product Inventory
The process of establishing and maintaining physical inventories and inventory information. This includes warehouse management, cycle counting, physical inventories and inventory reconciliation. For Services, this may include tracking the number of service providers and the financial resources committed at any given point in time.

© Copyright 2006 Supply-Chain Council, Inc. 361 June 2006
PROCESS TERM NAME DEFINITION
ES.5 Manage Capital Assets
The process of acquiring, maintaining and dispositioning an organization's <capital assets> located at a supplier's facility and/or outside source, which are used to operate the supply chain.
ES.6 Manage Incoming Product
The process of defining and maintaining the information that characterizes inbound logistics management of all supplier deliveries, including both physical and electronic goods and services. This includes carrier selection and management, tracking deliveries and import.
ES.7 Manage Supplier Network
The process of defining and maintaining a unique network of suppliers to deliver a specific product set. This includes establishment of a new supplier or maintaining an existing supplier and all the tasks and activities associated with identifying and qualifying the supplier and finalizing on the sourcing terms and conditions. Also, the management of a supplier certification process, which includes certifying new suppliers and maintaining the current status of existing suppliers.
ES.8 Manage Import/Export Requirements
The process of identifying and complying with import/export regulatory documentation and process standards set by external entities (e.g., government).
ES.9 Manage Supplier Agreements
The management of existing purchase orders or supplier contracts. This includes managing volume/step pricing, resolving issues, enforcing terms and conditions and maintaining an accurate status for existing purchase orders or contracts. Also, the management of a supplier certification process, which includes certifying new suppliers and maintaining the current status of existing suppliers.
M Make Processes that transform product to a finished state to meet planned or actual demand.
M1 Make-to-Stock
The process of manufacturing in a make to stock environment adds value to products through mixing, separating, forming, machining, and chemical processes. Make to stock products are intended to be shipped from finished goods or "off the shelf," are completed prior to receipt of a customer order, and are generally produced in accordance with a sales forecast.
M1.1 Schedule Production Activities
Given plans for the production of specific parts, products, or formulations in specified quantities and planned availability of required sourced products, the scheduling of the operations to be performed in accordance with these plans. Scheduling includes sequencing, and, depending on the factory layout, any standards for setup and run. In general, intermediate production activities are coordinated prior to the scheduling of the operations to be performed in producing a finished product.
M1.2 Issue Material
The selection and physical movement of sourced/in-process product (e.g., raw materials, fabricated components, subassemblies, required ingredients or intermediate formulations) from a stocking location (e.g., stockroom, a location on the production floor, a supplier) to a specific point of use location. Issuing product includes the corresponding system transaction. The Bill of Materials/routing information or recipe/production instructions will determine the products to be issued to support the production operation(s).
M1.3 Produce and Test
The series of activities performed upon sourced/in-process product to convert it from the raw or semi-finished state to a state of completion and greater value. The processes associated with the validation of product performance to ensure conformance to defined specifications and requirements.
M1.4 Package
The series of activities that containerize completed products for storage or sale to end-users. Within certain industries, packaging may include cleaning or sterilization.
M1.5 Stage Product
The movement of packaged products into a temporary holding location to await movement to a finished goods location. Products that are made to order may remain in the holding location to await shipment per the associated customer order. The movement to finished goods is part of the Deliver process.
M1.6 Release Product to Deliver
Activities associated with post-production documentation, testing, or certification required prior to delivery of finished product to customer. Examples include assembly of batch records for regulatory agencies, laboratory tests for potency or purity, creating certificate of analysis, and sign-off by the quality organization.
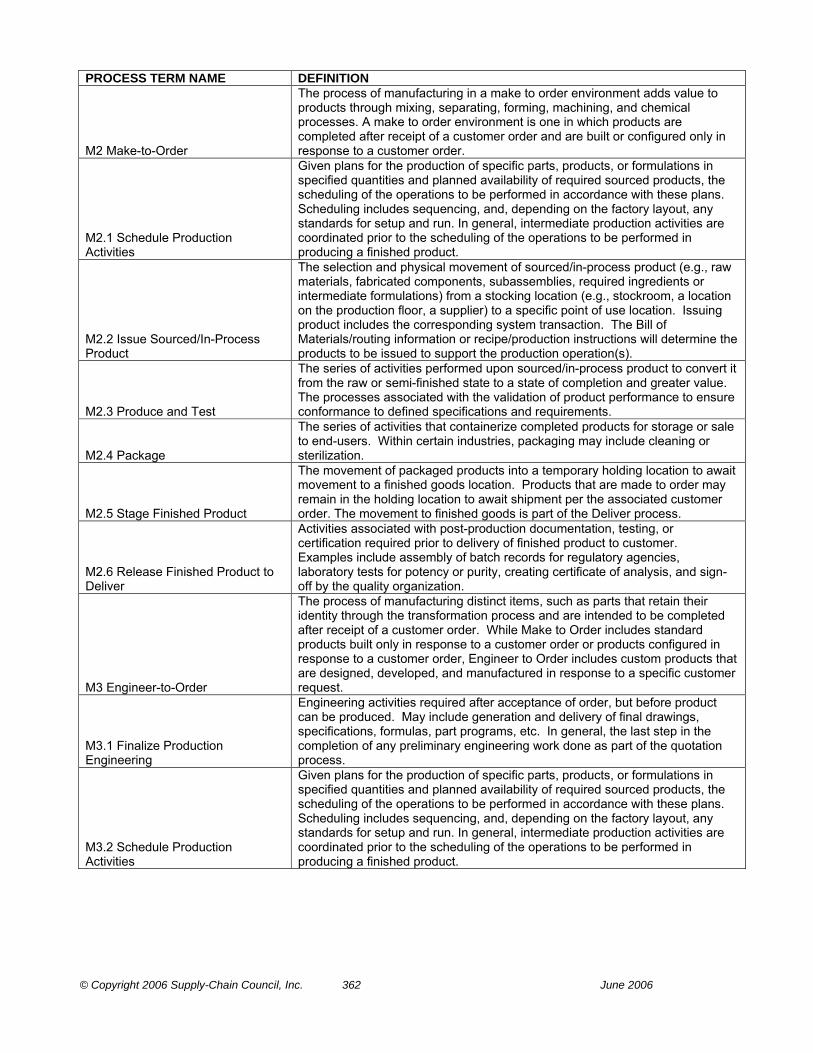
© Copyright 2006 Supply-Chain Council, Inc. 362 June 2006
PROCESS TERM NAME DEFINITION
M2 Make-to-Order
The process of manufacturing in a make to order environment adds value to products through mixing, separating, forming, machining, and chemical processes. A make to order environment is one in which products are completed after receipt of a customer order and are built or configured only in response to a customer order.
M2.1 Schedule Production Activities
Given plans for the production of specific parts, products, or formulations in specified quantities and planned availability of required sourced products, the scheduling of the operations to be performed in accordance with these plans. Scheduling includes sequencing, and, depending on the factory layout, any standards for setup and run. In general, intermediate production activities are coordinated prior to the scheduling of the operations to be performed in producing a finished product.
M2.2 Issue Sourced/In-Process Product
The selection and physical movement of sourced/in-process product (e.g., raw materials, fabricated components, subassemblies, required ingredients or intermediate formulations) from a stocking location (e.g., stockroom, a location on the production floor, a supplier) to a specific point of use location. Issuing product includes the corresponding system transaction. The Bill of Materials/routing information or recipe/production instructions will determine the products to be issued to support the production operation(s).
M2.3 Produce and Test
The series of activities performed upon sourced/in-process product to convert it from the raw or semi-finished state to a state of completion and greater value. The processes associated with the validation of product performance to ensure conformance to defined specifications and requirements.
M2.4 Package
The series of activities that containerize completed products for storage or sale to end-users. Within certain industries, packaging may include cleaning or sterilization.
M2.5 Stage Finished Product
The movement of packaged products into a temporary holding location to await movement to a finished goods location. Products that are made to order may remain in the holding location to await shipment per the associated customer order. The movement to finished goods is part of the Deliver process.
M2.6 Release Finished Product to Deliver
Activities associated with post-production documentation, testing, or certification required prior to delivery of finished product to customer. Examples include assembly of batch records for regulatory agencies, laboratory tests for potency or purity, creating certificate of analysis, and sign-off by the quality organization.
M3 Engineer-to-Order
The process of manufacturing distinct items, such as parts that retain their identity through the transformation process and are intended to be completed after receipt of a customer order. While Make to Order includes standard products built only in response to a customer order or products configured in response to a customer order, Engineer to Order includes custom products that are designed, developed, and manufactured in response to a specific customer request.
M3.1 Finalize Production Engineering
Engineering activities required after acceptance of order, but before product can be produced. May include generation and delivery of final drawings, specifications, formulas, part programs, etc. In general, the last step in the completion of any preliminary engineering work done as part of the quotation process.
M3.2 Schedule Production Activities
Given plans for the production of specific parts, products, or formulations in specified quantities and planned availability of required sourced products, the scheduling of the operations to be performed in accordance with these plans. Scheduling includes sequencing, and, depending on the factory layout, any standards for setup and run. In general, intermediate production activities are coordinated prior to the scheduling of the operations to be performed in producing a finished product.
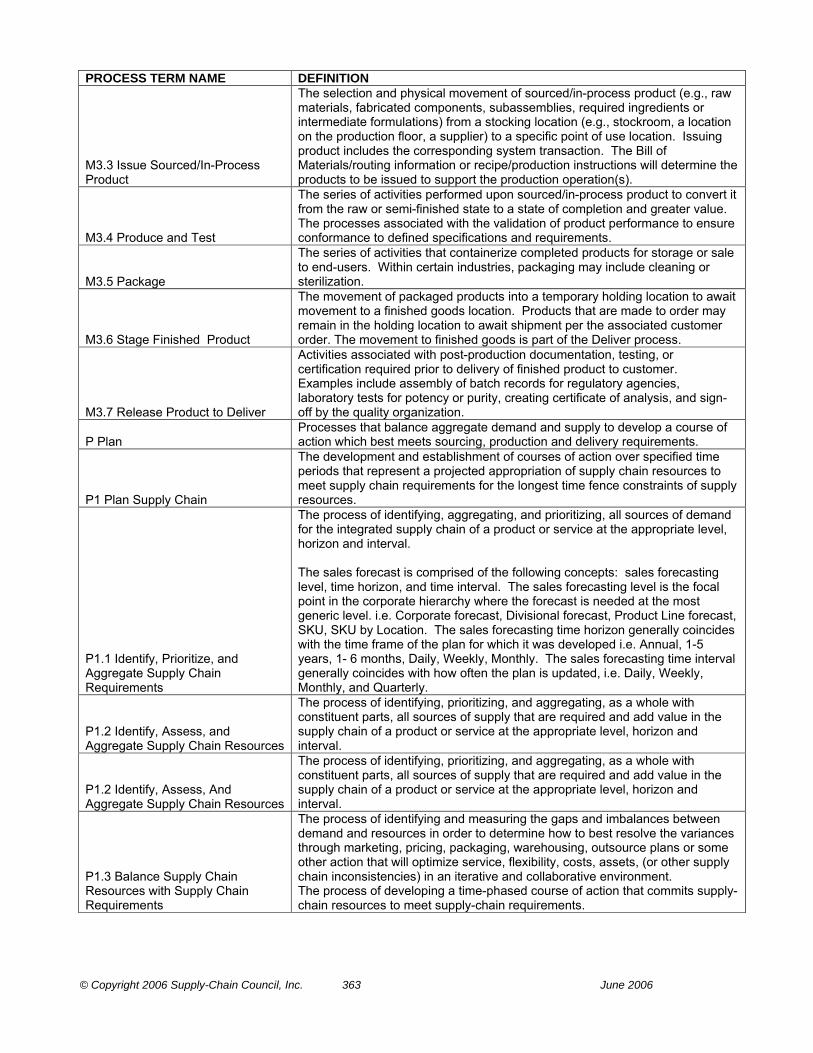
© Copyright 2006 Supply-Chain Council, Inc. 363 June 2006
PROCESS TERM NAME DEFINITION
M3.3 Issue Sourced/In-Process Product
The selection and physical movement of sourced/in-process product (e.g., raw materials, fabricated components, subassemblies, required ingredients or intermediate formulations) from a stocking location (e.g., stockroom, a location on the production floor, a supplier) to a specific point of use location. Issuing product includes the corresponding system transaction. The Bill of Materials/routing information or recipe/production instructions will determine the products to be issued to support the production operation(s).
M3.4 Produce and Test
The series of activities performed upon sourced/in-process product to convert it from the raw or semi-finished state to a state of completion and greater value. The processes associated with the validation of product performance to ensure conformance to defined specifications and requirements.
M3.5 Package
The series of activities that containerize completed products for storage or sale to end-users. Within certain industries, packaging may include cleaning or sterilization.
M3.6 Stage Finished Product
The movement of packaged products into a temporary holding location to await movement to a finished goods location. Products that are made to order may remain in the holding location to await shipment per the associated customer order. The movement to finished goods is part of the Deliver process.
M3.7 Release Product to Deliver
Activities associated with post-production documentation, testing, or certification required prior to delivery of finished product to customer. Examples include assembly of batch records for regulatory agencies, laboratory tests for potency or purity, creating certificate of analysis, and sign-off by the quality organization.
P Plan Processes that balance aggregate demand and supply to develop a course of action which best meets sourcing, production and delivery requirements.
P1 Plan Supply Chain
The development and establishment of courses of action over specified time periods that represent a projected appropriation of supply chain resources to meet supply chain requirements for the longest time fence constraints of supply resources.
P1.1 Identify, Prioritize, and Aggregate Supply Chain Requirements
The process of identifying, aggregating, and prioritizing, all sources of demand for the integrated supply chain of a product or service at the appropriate level, horizon and interval. The sales forecast is comprised of the following concepts: sales forecasting level, time horizon, and time interval. The sales forecasting level is the focal point in the corporate hierarchy where the forecast is needed at the most generic level. i.e. Corporate forecast, Divisional forecast, Product Line forecast, SKU, SKU by Location. The sales forecasting time horizon generally coincides with the time frame of the plan for which it was developed i.e. Annual, 1-5 years, 1- 6 months, Daily, Weekly, Monthly. The sales forecasting time interval generally coincides with how often the plan is updated, i.e. Daily, Weekly, Monthly, and Quarterly.
P1.2 Identify, Assess, and Aggregate Supply Chain Resources
The process of identifying, prioritizing, and aggregating, as a whole with constituent parts, all sources of supply that are required and add value in the supply chain of a product or service at the appropriate level, horizon and interval.
P1.2 Identify, Assess, And Aggregate Supply Chain Resources
The process of identifying, prioritizing, and aggregating, as a whole with constituent parts, all sources of supply that are required and add value in the supply chain of a product or service at the appropriate level, horizon and interval.
P1.3 Balance Supply Chain Resources with Supply Chain Requirements
The process of identifying and measuring the gaps and imbalances between demand and resources in order to determine how to best resolve the variances through marketing, pricing, packaging, warehousing, outsource plans or some other action that will optimize service, flexibility, costs, assets, (or other supply chain inconsistencies) in an iterative and collaborative environment. The process of developing a time-phased course of action that commits supply-chain resources to meet supply-chain requirements.

© Copyright 2006 Supply-Chain Council, Inc. 364 June 2006
PROCESS TERM NAME DEFINITION
P1.4 Establish Supply Chain Plans
The establishment and communication of courses of action over the appropriate time-defined (long-term, annual, monthly, weekly) planning horizon and interval, representing a projected appropriation of supply-chain resources to meet supply-chain requirements.
P2 Plan Source
The development and establishment of courses of action over specified time periods that represent a projected appropriation of material resources to meet supply chain requirements.
P2.1 Identify, Prioritize, and Aggregate Product Requirements
The process of identifying, prioritizing, and considering, as a whole with constituent parts, all sources of demand for a product or service in the supply chain.
P2.2 Identify, Assess, And Aggregate Product Resources
The process of identifying, evaluating, and considering, as a whole with constituent parts, all material and other resources used to add value in the supply chain for a product or services.
P2.3 Balance Product Resources with Product Requirements
The process of developing a time-phased course of action that commits resources to meet requirements.
P2.4 Establish Sourcing Plans
The establishment of courses of action over specified time periods that represent a projected appropriation of supply resources to meet sourcing plan requirements.
P3 Plan Make
The development and establishment of courses of action over specified time periods that represent a projected appropriation of production resources to meet production requirements.
P3.1 Identify, Prioritize, and Aggregate Production Requirements
The process of identifying, prioritizing, and considering as a whole with constituent parts, all sources of demand in the creation of a product or service.
P3.2 Identify, Assess, and Aggregate Production Resources
The process of identifying, evaluating, and considering, as a whole with constituent parts, all things that add value in the creation of a product or performance of a service.
P3.3 Balance Production Resources with Production Requirements
The process of developing a time-phased course of action that commits creation and operation resources to meet creation and operation requirements.
P3.4 Establish Production Plans
The establishment of courses of action over specified time periods that represent a projected appropriation of supply resources to meet production and operating plan requirements.
P4 Plan Deliver
The development and establishment of courses of action over specified time periods that represent a projected appropriation of delivery resources to meet delivery requirements.
P4.1 Identify, Prioritize, and Aggregate Delivery Requirements
The process of identifying, prioritizing, and considering, as a whole with constituent parts, all sources of demand in the delivery of a product or service.
P4.2 Identify, Assess, and Aggregate Delivery Resources and Capabilities
The process of identifying, evaluating, and considering, as a whole with constituent parts, all things that add value in the delivery of a product or service.
P4.3 Balance Delivery Resources and Capabilities with Delivery Requirements
The process of developing a time-phased course of action that commits delivery resources to meet delivery requirements.
P4.4 Establish Delivery Plans
The establishment of courses of action over specified time periods that represent a projected appropriation of delivery resources to meet delivery requirements.
P5 Plan Return
A strategic or tactical process to establish and adjust courses of action or tasks over specified time periods that represent a projected appropriation of return resources and assets to meet anticipated as well as unanticipated return requirements. The scope includes unplanned returns of sold merchandise as well as planned returns of "rotable" products that are refurbished for reissue to customers.
P5.1 Assess, and Aggregate Return Requirements
The process of identifying, evaluating, and considering, as a whole with constituent parts, all sources of demand for the return of a product.
P5.2 Identify, Assess, and Aggregate Return Resources
The process of identifying, evaluating, and consideration for all resources that add value to, execute, or constrain the processes for the return of a product.
P5.3 Balance Return Resources with Return Requirements
The process of developing courses of action that make feasible the commitment the appropriate return resources and or assets to satisfy return requirements.

© Copyright 2006 Supply-Chain Council, Inc. 365 June 2006
PROCESS TERM NAME DEFINITION
P5.4 Establish and Communicate Return Plans
The establishment and communication of courses of action over specified time periods that represent a projected appropriation of required return resources and or assets to meet return process requirements.
R1 Return Defective Product
The return and disposition of defective products as defined by the warranty claims, product recall, non-conforming product and/or other similar policies including appropriate replacement.
R2 Return MRO Product The return of MRO products as defined by the planned and unplanned Capital Maintenance Plan.
R3 Return Excess Product The return of excess inventory and/or serviceable or obsolete products as defined by the terms and conditions of a customer/supplier contract.
S Source Processes that procure goods and services to meet planned or actual demand.
S1 Source Stocked Product The procurement, delivery, receipt and transfer of raw material items, subassemblies, product and or services.
S1.1 Schedule Product Deliveries
Scheduling and managing the execution of the individual deliveries of product against an existing contract or purchase order. The requirements for product releases are determined based on the detailed sourcing plan or other types of product pull signals.
S1.2 Receive Product The process and associated activities of receiving product to contract requirements.
S1.3 Verify Product The process and actions required determining product conformance to requirements and criteria.
S1.4 Transfer Product
The transfer of accepted product to the appropriate stocking location within the supply chain. This includes all of the activities associated with repackaging, staging, transferring and stocking product. For service this is the transfer or application of service to the final customer or end user.
S1.5 Authorize Supplier Payment
The process of authorizing payments and paying suppliers for product or services. This process includes invoice collection, invoice matching and the issuance of checks.
S2 Source Make-to-Order Product The procurement and delivery of product that is built to a specific design or configured based on the requirements of a particular customer order.
S2.1 Schedule Product Deliveries
Scheduling and managing the execution of the individual deliveries of product against the contract. The requirements for product deliveries are determined based on the detailed sourcing plan. This includes all aspects of managing the contract schedule including prototypes, qualifications or service deployment.
S2.2 Receive Product The process and associated activities of receiving product to contract requirements.
S2.3 Verify Product The process and actions required determining product conformance to requirements and criteria.
S2.4 Transfer Product
The transfer of accepted product to the appropriate stocking location within the supply chain. This includes all of the activities associated with repackaging, staging, transferring, and stocking product and or application of service.
S2.5 Authorize Supplier Payment
The process of authorizing payments and paying suppliers for product or services. This process includes invoice collection, invoice matching and the issuance of checks.
S3 Source Engineer-to-Order Product
The negotiation, procurement and delivery of engineer-to-order assemblies or specialized product or services that are designed and built based on the requirements or specifications of a particular customer order or contract.
S3.1 Identify Sources of Supply The identification and qualification of potential suppliers capable of designing and delivering product that will meet all of the required product specifications.
S3.2 Select Final Supplier(s) and Negotiate
The identification of the final supplier(s) based on the evaluation of RFQs, supplier qualifications and the generation of a contract defining the costs and terms and conditions of product availability.
S3.3 Schedule Product Deliveries
Scheduling and managing the execution of the individual deliveries of product against the contract. The requirements for product deliveries are determined based on the detailed sourcing plan. This includes all aspects of managing the contract schedule including prototypes and qualifications.
S3.4 Receive Product The process and associated activities of receiving product to contract requirements.
S3.5 Verify Product The process and actions required determining product conformance to requirements and criteria.

© Copyright 2006 Supply-Chain Council, Inc. 366 June 2006
PROCESS TERM NAME DEFINITION
S3.6 Transfer Product
The transfer of accepted product to the appropriate stocking location within the supply chain. This includes all of the activities associated with repackaging, staging, transferring, and stocking product.
S3.7 Authorize Supplier Payment
The process of authorizing payments and paying suppliers for product or services. This process includes invoice collection, invoice matching and the issuance of checks.
SR Source Return Processes associated with returning products for any reason. These processes extend into post-delivery customer support.
SR1 Source Return Defective Product
The process, initiated by the customer, of returning material deemed defective by to the last known holder or designated return center. Process includes: customer identification that an action is required and determining what that action should be, communicating with the last known holder, generating return documentation, and physically returning of the excess product.
SR1.1 Identify Defective Product Condition
The process where the customer utilizes planned policies, business rules and product operating conditions inspection as criteria to identify and confirm that material is excess to requirements defective.
SR1.2 Disposition Defective Product
The process of the customer determining whether to return the defective item and the appropriate source contact for a return authorization.
SR1.3 Request Defective Return Authorization
The process of a customer requesting and obtaining authorization, from last known holder or designated return center, for the return of defective product. Additionally, the customer and last known holder or designated return center would discuss enabling conditions such as return replacement or credit, packaging, handling, transportation and import / export requirements to facilitate the efficient return of the defective product.
SR1.4 Schedule Defective Product Shipment
The process where the customer develops the schedule for a carrier to pick-up for delivery of the defective product. Activities include selecting the carrier and rates, preparing the item for transfer, preparing scheduling documentation and managing overall scheduling administration.
SR1.5 Return Defective Product
The process where the customer packages, and handles the defective product in preparation for shipping in accord with pre-determined conditions. The product is then provided by the customer to the carrier who physically transports the product and its associated documentation to the last known holder or designated return center.
SR2 Source Return MRO Product
The process, initiated by the customer, of returning maintenance, repair, and overhaul items to a service provider. Process includes: customer identification that an action is required and determining what that action should be, communicating with the service provider, generating return documentation, and physically returning or disposing of the product.
SR2.1 Identify MRO Product Condition
The process where the customer utilizes pre-determined MRO policies, business rules and product operating conditions as criteria to identify and confirm that an item requires maintenance, repair, overhaul or disposal. Includes operating failures and planned maintenance requirements.
SR2.2 Disposition MRO Product
The process of the customer determining whether to service the item, what service is required, and who the appropriate service provider would be to service the item. Outputs include a decision to: (1) send a return authorization request to a service provider, (2) send the product back into service without requiring a return authorization request, or (3) discard the item.
SR2.3 Request MRO Return Authorization
The process of a customer requesting and obtaining authorization, from a service provider, for the return of an MRO product. In addition to discussing the MRO issue, the customer and service provider would discuss enabling conditions such as return replacement or credit, packaging, handling, transportation and import / export requirements to facilitate the efficient return of the MRO product to the service provider. The customer may need to go through several return authorization iterations with multiple service providers before authorization is received.
SR2.4 Schedule MRO Shipment
The process where the customer develops the schedule for a carrier to pick-up and deliver the MRO product. Activities include selecting the carrier and rates, preparing the item for transfer, preparing scheduling documentation and managing overall scheduling administration.

© Copyright 2006 Supply-Chain Council, Inc. 367 June 2006
PROCESS TERM NAME DEFINITION
SR2.5 Return MRO Product
The process where the customer packages, and handles the MRO product in preparation for shipping in accord with pre-determined conditions. The product is then provided by the customer to the carrier who physically transports the product and its associated documentation to the service provider.
SR3 Source Return Excess Product
The process, initiated by the customer, of returning material deemed in excess of current requirements to the designated return center. Process includes: customer identification that an action is required, determining what that action should be, requesting authorization from the designated return center, generating return documentation, and physically returning the excess product.
SR3.1 Identify Excess Product Condition
The process where the customer utilizes planned policies, business rules and product inspection as criteria to identify and confirm that material is in excess of the current requirements.
SR3.2 Disposition Excess Product The process of the customer determining whether to return the excess material and identification of a designated return center a return authorization.
SR3.3 Request Excess Return Authorization
The process of a customer requesting and obtaining authorization, from the designated return center, for the return of excess product. Additionally, the customer and designated return center would negotiate enabling conditions such as return credit or cash discount, packaging, handling, transportation and import / export requirements to facilitate the efficient return of the excess product.
SR3.4 Schedule Excess Product Shipment
The process where the customer develops the schedule for a carrier to pick-up the excess product. Activities include selecting the carrier and rates, preparing the item for transfer, preparing scheduling documentation and managing overall scheduling administration.
SR3.5 Return Excess Product
The process where the customer packages, and handles the excess product in preparation for shipping in accord with pre-determined conditions. The product is then provided by the customer to the carrier who physically transports the product and its associated documentation to the last known holder or designated return center.

© Copyright 2006 Supply-Chain Council, Inc. 368 June 2006
METRICS METRIC DEFINITION PROCESS % In-Stock Percentage of materials, components, or
finished goods that are there when needed. D4.4 Stock Shelf
% of Excess Product Returns Delivered Complete to the Designated Return Center
Correct destination, according to the schedule, with the correct part and documentation
DR3 Deliver Return Excess Product SR3 Source Return Excess Product
% of Faultless Invoices
The number of invoices processed without issues and or errors divided by the total number of invoices. Examples of potential invoice defects are: Change from customer purchase order without proper customer involvement Wrong Customer Information (e.g., name, address, telephone number) Wrong Product Information (e.g., part number, product description) Wrong Price (e.g., discounts not applied) Wrong Quantity or Wrong Terms or Wrong Date
D2.14 Install Product D1.14 Install Product D3.15 Invoice D2.15 Invoice D1.15 Invoice
% Orders/ Lines Processed Complete The number of orders / lines that are processed complete divided by the total orders / lines processed within the measurement period
S1.2, S2.2, S3.4
% Orders/ Lines Received Defect Free
The number of orders / lines that are received defect free divided by the total orders / lines processed in the measurement period.
S1.3, S2.3, S3.5
% Orders/ Lines Received On-Time To Demand Requirement
The number of orders / lines that are received on-time to the demand requirements divided by the total orders / lines for the demand requirements in the measurement period
S1.2, S2.2, S3.4
% Orders/ Lines Received with Correct Shipping Documents
The number of orders / lines that are received on-time with correct shipping documents divided by the total orders / lines processed in the measurement period
S1.2, S2.2, S3.4
% of Orders Delivered In Full Percentage of orders which all of the items are received by customer in the quantities committed The number of orders that are received by the customer in the quantities committed divided by the total orders [Total number of orders delivered in full] / [Total number of orders delivered] x 100%
M1.1, M2.1, M3.1, D1.3, D1.12, D1.13, D2.3, D2.12, D2.13, D3.3, D3.12, D3.13, ED
% Product Transferred On-Time to Demand Requirement
The number of product orders / lines that are transferred on-time to demand requirements divided by the total orders / lines transferred in the measurement period
S1.4, S2.4, S3.6
% Product Transferred without Transaction Errors
The number of transactions processed without error divided by the total transactions processed in the measurement period.
S1.4, S2.4, S3.6
% Return % Return to sales at any level of merchandise hierarchy
R1 Return Defective Product R2 Return MRO Product
% Schedules Changed within Supplier's Lead Time
The number of schedules that are changed within the suppliers lead-time divided by the total number of schedules generated within the measurement period
S1.1, S2.1, S3.3

© Copyright 2006 Supply-Chain Council, Inc. 369 June 2006
METRIC DEFINITION PROCESS Actual Asset Life Maintenance Cost as % of Replacement Value
Measure of total lifecycle maintenance cost of an asset compared to its replacement cost. This ratio is based maintenance cost to-date so that that replacement or upgrade cost can be evaluated as the asset ages on an on-going basis.
EM.5
Align Supply Chain Unit Plan with Financial Plan Cycle Time
The average time associated with aligning the supply chain unit plan with the financial plan
EP.9 Align Supply Chain Unit Plan with Financial Plan
Assess Delivery Performance Cycle Time
The average time associated with assessing the performance of deliver processes.
ED.2 Assess Delivery Performance
Assess Supplier Performance Cycle Time
The average time associated with assessing the performance of supplier processes.
ES.2 Assess Supplier Performance
Asset Turns Total gross product revenue ÷ Total net assets
M1.3, M1.4, M2.3, M2.4, M3.4, M3.5
Authorize Defective Product Return Cycle Time
The average time associated with authorizing the return of defective product.
DR1.1 Authorize Defective Product Return
Authorize Excess Product Return Cycle Time
The average time associated with authorizing the return of excess product.
DR3.1 Authorize Excess Product Return
Authorize MRO Product Return Cycle Time
The average time associated with authorizing the return of MRO product.
DR2.1 Authorize MRO Product Return
Authorize Supplier Payment Cycle Time
The average time associated with authorizing payment to suppliers.
S3.7 Authorize Supplier Payment S2.5 Authorize Supplier Payment S1.5 Authorize Supplier Payment
Average Days per Engineering Change
# of days each engineering change impacts the delivery date divided by the total # of changes.
S1.1, S2.1, S3.3
Average Days per Schedule Change # of days each schedule change impacts the delivery date divided by the total # of changes.
S1.1, S2.1, S3.3
Average Release Cycle of Changes Cycle time for implementing change notices divided by total number of changes.
S1.1, S2.1, S3.3
Balance Delivery Resources with Delivery Requirements Cycle Time
The average time associated with balancing deliver resources and deliver requirements.
P4.3 Balance Delivery Resources and Capabilities with Delivery Requirements
Balance Product Resources with Product Requirements Cycle Time
The average time associated with balancing product resources and product requirements.
P2.3 Balance Product Resources with Product Requirements
Balance Production Resources with Product Creation Requirements Cycle Time
The average time associated with balancing production resources with production creation requirements.
P3.3 Balance Production Resources with Production Requirements
Balance Return Resources with Return Requirements Cycle Time
The average time associated with balancing return resources and return requirements.
P5.3 Balance Return Resources with Return Requirements
Balance Supply Chain Resources with Supply Chain Requirements Cycle Time
The average time associated with balancing supply chain resources and supply chain requirements.
P1.3 Balance Supply Chain Resources with Supply Chain Requirements
Build Loads Cycle Time The average time associated with building shipment loads.
D1.5 Build Loads D2.5 Build Loads D3.5 Build Loads
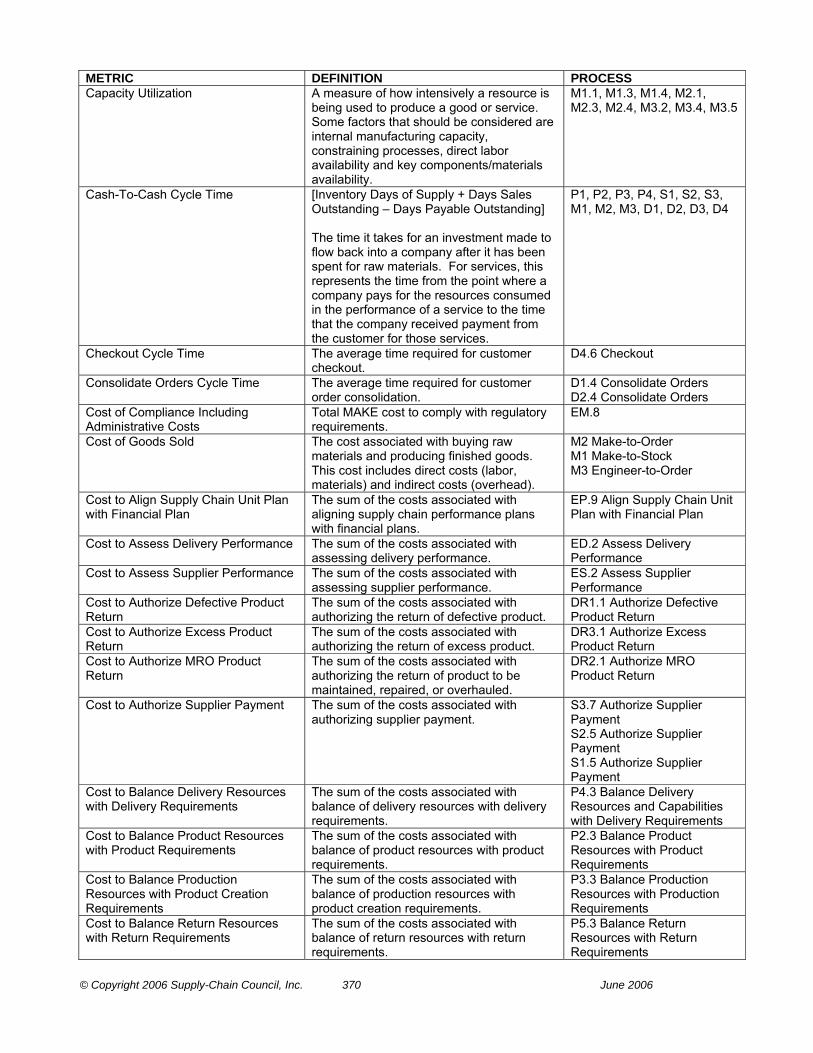
© Copyright 2006 Supply-Chain Council, Inc. 370 June 2006
METRIC DEFINITION PROCESS Capacity Utilization A measure of how intensively a resource is
being used to produce a good or service. Some factors that should be considered are internal manufacturing capacity, constraining processes, direct labor availability and key components/materials availability.
M1.1, M1.3, M1.4, M2.1, M2.3, M2.4, M3.2, M3.4, M3.5
Cash-To-Cash Cycle Time [Inventory Days of Supply + Days Sales Outstanding – Days Payable Outstanding] The time it takes for an investment made to flow back into a company after it has been spent for raw materials. For services, this represents the time from the point where a company pays for the resources consumed in the performance of a service to the time that the company received payment from the customer for those services.
P1, P2, P3, P4, S1, S2, S3, M1, M2, M3, D1, D2, D3, D4
Checkout Cycle Time The average time required for customer checkout.
D4.6 Checkout
Consolidate Orders Cycle Time The average time required for customer order consolidation.
D1.4 Consolidate Orders D2.4 Consolidate Orders
Cost of Compliance Including Administrative Costs
Total MAKE cost to comply with regulatory requirements.
EM.8
Cost of Goods Sold The cost associated with buying raw materials and producing finished goods. This cost includes direct costs (labor, materials) and indirect costs (overhead).
M2 Make-to-Order M1 Make-to-Stock M3 Engineer-to-Order
Cost to Align Supply Chain Unit Plan with Financial Plan
The sum of the costs associated with aligning supply chain performance plans with financial plans.
EP.9 Align Supply Chain Unit Plan with Financial Plan
Cost to Assess Delivery Performance The sum of the costs associated with assessing delivery performance.
ED.2 Assess Delivery Performance
Cost to Assess Supplier Performance The sum of the costs associated with assessing supplier performance.
ES.2 Assess Supplier Performance
Cost to Authorize Defective Product Return
The sum of the costs associated with authorizing the return of defective product.
DR1.1 Authorize Defective Product Return
Cost to Authorize Excess Product Return
The sum of the costs associated with authorizing the return of excess product.
DR3.1 Authorize Excess Product Return
Cost to Authorize MRO Product Return
The sum of the costs associated with authorizing the return of product to be maintained, repaired, or overhauled.
DR2.1 Authorize MRO Product Return
Cost to Authorize Supplier Payment The sum of the costs associated with authorizing supplier payment.
S3.7 Authorize Supplier Payment S2.5 Authorize Supplier Payment S1.5 Authorize Supplier Payment
Cost to Balance Delivery Resources with Delivery Requirements
The sum of the costs associated with balance of delivery resources with delivery requirements.
P4.3 Balance Delivery Resources and Capabilities with Delivery Requirements
Cost to Balance Product Resources with Product Requirements
The sum of the costs associated with balance of product resources with product requirements.
P2.3 Balance Product Resources with Product Requirements
Cost to Balance Production Resources with Product Creation Requirements
The sum of the costs associated with balance of production resources with product creation requirements.
P3.3 Balance Production Resources with Production Requirements
Cost to Balance Return Resources with Return Requirements
The sum of the costs associated with balance of return resources with return requirements.
P5.3 Balance Return Resources with Return Requirements

© Copyright 2006 Supply-Chain Council, Inc. 371 June 2006
METRIC DEFINITION PROCESS Cost to Balance Supply Chain Resources with Supply Chain Requirements
The sum of the costs associated with balance of supply chain resources with supply chain requirements.
P1.3 Balance Supply Chain Resources with Supply Chain Requirements
Cost to Build Loads The sum of the costs associated with building transportation loads.
D1.5 Build Loads D2.5 Build Loads D3.5 Build Loads
Cost to Checkout The sum of the costs associated with product checkout.
D4.6 Checkout
Cost to Consolidate Orders The sum of the costs associated with consolidating customer orders.
D1.4 Consolidate Orders D2.4 Consolidate Orders
Cost to Deliver The sum of the costs associated with deliver
D1 Deliver Stocked Product D2 Deliver Make-to-Order Product D3 Deliver Engineer-to-Order Product
Cost to Deliver and/or Install The sum of the costs associated with deliver and/or install
D4.7 Deliver and/or Install
Cost to Enter Order, Commit Resources & Launch Program
The sum of the costs associated with entering the order, committing resources & launching a program.
D3.3 Enter Order, Commit Resources & Launch Program
Cost to Establish and Communicate Return Plans
The sum of the costs associated with establishing and communicating return plans.
P5.4 Establish and Communicate Return Plans
Cost to Establish and Communicate Supply Chain Plans
The sum of the costs associated with establishing and communicating supply chain plans.
P1.4 Establish Supply Chain Plans
Cost to Establish Delivery Plans The sum of the costs associated with establishing and communicating deliver plans.
P4.4 Establish Delivery Plans
Cost to Establish Production Plans The sum of the costs associated with establishing and communicating production plans.
P3.4 Establish Production Plans
Cost to Establish Sourcing Plans The sum of the costs associated with establishing and communicating source plans.
P2.4 Establish Sourcing Plans
Cost to Fill Shopping Cart The sum of the costs associated with filling a shopping cart.
D4.5 Fill Shopping Cart
Cost to Finalize Production Engineering
The sum of the costs associated with finalizing production engineering.
M3.1 Finalize Production Engineering
Cost to Generate Stocking Schedule The sum of the costs associated with generating a stocking schedule.
D4.1 Generate Stocking Schedule
Cost to Identify Sources of Supply The sum of the costs associated with identifying sources of supply.
S3.1 Identify Sources of Supply
Cost to Identify, Assess, and Aggregate Product Resources
The sum of the costs associated with identifying, assessing and aggregating product resources.
P2.2 Identify, Assess, And Aggregate Product Resources
Cost to Identify, Assess, and Aggregate Production Resources
The sum of the costs associated with identifying, assessing and aggregating production resources.
P3.2 Identify, Assess, and Aggregate Production Resources P4.2 Identify, Assess, and Aggregate Delivery Resources and Capabilities
Cost to Identify, Assess, and Aggregate Return Resources
The sum of the costs associated with identifying, assessing and aggregating return resources.
P5.2 Identify, Assess, and Aggregate Return Resources
Cost to Identify, Assess, and Aggregate Supply Chain Resources
The sum of the costs associated with identifying, assessing and aggregating supply chain resources.
P1.2 Identify, Assess, and Aggregate Supply Chain Resources

© Copyright 2006 Supply-Chain Council, Inc. 372 June 2006
METRIC DEFINITION PROCESS Cost to Identify, Prioritize, and Aggregate Delivery Requirements
The sum of the costs associated with identifying, assessing and aggregating deliver requirements
P4.1 Identify, Prioritize, and Aggregate Delivery Requirements
Cost to Identify, Prioritize, and Aggregate Product Requirements
The sum of the costs associated with identifying, assessing and aggregating deliver requirements.
P2.1 Identify, Prioritize, and Aggregate Product Requirements
Cost to Identify, Prioritize, and Aggregate Production Requirements
The sum of the costs associated with identifying, assessing and aggregating production requirements
P3.1 Identify, Prioritize, and Aggregate Production Requirements
Cost to Identify, Prioritize, and Aggregate Return Requirements
The sum of the costs associated with identifying, assessing and aggregating return requirements.
P5.1 Assess, and Aggregate Return Requirements
Cost to Identify, Prioritize, and Aggregate Supply Chain Requirements
The sum of the costs associated with identifying, assessing and aggregating supply chain requirements.
P1.1 Identify, Prioritize, and Aggregate Supply Chain Requirements
Cost to Install Product The sum of the costs associated with product installation.
D1.14 Install Product D2.14 Install Product D3.14 Install Product
Cost to Invoice The sum of the costs associated with invoicing.
D1.15 Invoice D3.15 Invoice
Cost to Issue Material The sum of the costs associated with issuing material.
M1.2 Issue Material
Cost to Issue Sourced/In-Process Product
The sum of the costs associated with issuing sourced or in-process material.
M3.3 Issue Sourced/In-Process Product M2.2 Issue Sourced/In-Process Product
Cost to Load Product & Generate Shipping Documentation
The sum of the costs associated with loading product & generating shipping documentation.
D1.11 Load Vehicle & Generate Shipping Documentation D2.11 Load Product & Generate Shipping Documentation D3.11 Load Product & Generate Ship Documents
Cost to Maintain Source Data The sum of the costs associated with maintaining supplier data.
ES.3 Maintain Source Data
Cost to Make The sum of the costs associated with make. M1, M2, M3 Cost to Manage Business Rules for PLAN Processes
The sum of the .Costs to Manage Business Rules for PLAN Processes
EP.1 Manage Business Rules for PLAN Processes
Cost to Manage Business Rules for Return Processes
The sum of the Cost to Manage Business Rules for Return Processes
ER.1 Manage Business Rules for Return Processes
Cost to Manage Deliver Business Rules
The sum of the Costs to Manage Deliver Business Rules
ED.1 Manage Deliver Business Rules
Cost to Manage Deliver Capital Assets
The sum of the Costs to Manage Deliver Capital Assets
ED.5 Manage Deliver Capital Assets
Cost to Manage Deliver Information The sum of the Cost to Manage Deliver Information
ED.3 Manage Deliver Information
Cost to Manage Finished Goods Inventories
The sum of the Costs to Manage Finished Good Inventory
ED.4 Manage Finished Goods Inventories
Cost to Manage Import/Export Requirements
The sum of the costs associated with the management of import/export requirements
ED.8 Manage Import/Export Requirements ES.8 Manage Import/Export Requirements
Cost to Manage Incoming Product The sum of the costs associated with managing incoming product.
ES.6 Manage Incoming Product
Cost to Manage In-Process Products (WIP)
The sum of the costs associated with managing in-process products (WIP).
EM.4 Manage In-Process Products (WIP)
Cost to Manage Integrated Supply Chain Capital Assets
The sum of the costs associated with managing integrated supply chain assets.
EP.5 Manage Integrated Supply Chain Capital Assets

© Copyright 2006 Supply-Chain Council, Inc. 373 June 2006
METRIC DEFINITION PROCESS Cost to Manage Integrated Supply Chain Inventory
The sum of the costs associated with managing the integrated supply chain inventory.
EP.4 Manage Integrated Supply Chain Inventory
Cost to Manage Integrated Supply Chain Transportation
The sum of the costs associated with managing integrated supply chain transportation.
EP.6 Manage Integrated Supply Chain Transportation
Cost to Manage MAKE Equipment and Facilities
The sum of the costs associated with managing Make equipment and facilities.
EM.5 Manage Equipment and Facilities
Cost to Manage MAKE Information The sum of the Cost to Manage MAKE Information
EM.3 Manage MAKE Information
Cost to Manage MAKE Regulatory Compliance
The sum of the Cost to Manage MAKE Regulatory Compliance
EM.8 Manage Regulatory Compliance
Cost to Manage Performance of Return Processes
The sum of the costs to Manage Performance of Return Processes.
ER.2 Manage Performance of Return Processes
Cost to Manage Performance of Supply Chain
The sum of the costs associated with assessing supplier performance.
EP.2 Manage Performance of Supply Chain
Cost to Manage PLAN Data Collection
The sum of the costs to Manage PLAN Data Collection.
EP.3 Manage PLAN Data Collection
Cost to Manage Plan Regulatory Requirements and Compliance
The sum of the costs to Manage Plan Regulatory Requirements and Compliance.
EP.8 Manage PLAN Regulatory Requirements and Compliance
Cost to Manage Planning Configuration
The sum of the Cost to Manage Planning Configuration
EP.7 Manage Planning Configuration
Cost to Manage Product Inventory The sum of the Cost to Manage Product Inventory
ES.4 Manage Product Inventory
Cost to Manage Product Life Cycle The sum of the Cost to Manage Product Life Cycle
ED.7 Manage Product Life Cycle
Cost to Manage Production Network The sum of the costs to manage the production network
EM.7 Manage Production Network
Cost to Manage Production Performance
The sum of the costs to manage production performance.
EM.2 Manage Production Performance
Cost to Manage Production Rules The sum of the costs to manage production rules.
EM.1 Manage Production Rules
Cost to Manage Return Capital Assets
The sum of the costs to manage the capital assets associated with returns.
ER.5 Manage Return Capital Assets
Cost to Manage Return Data Collection
The sum of the costs to manage the capital assets associated with returns data collection.
ER.3 Manage Return Data Collection
Cost to Manage Return Inventory The sum of the costs to manage the capital assets associated with return inventory.
ER.4 Manage Return Inventory
Cost to Manage Return Network Configuration
The sum of the costs to manage the capital assets associated with configuring the return network.
ER.7 Manage Return Network Configuration
Cost to Manage Return Regulatory Requirements and Compliance
The sum of the costs associated with managing compliance to return regulatory requirements.
ER.8 Manage Return Regulatory Requirements
Cost to Manage Return Transportation
The sum of the costs associated with managing return transportation.
ER.6 Manage Return Transportation
Cost to Manage Source Capital Assets
The sum of the Costs to Manage Source Capital Assets
ES.5 Manage Capital Assets
Cost to Manage Sourcing Business Rules
The sum of the costs associated with Source business rules.
ES.1 Manage Sourcing Business Rules
Cost to Manage Supplier Agreements The sum of the costs associated with managing supplier agreements.
ES.9 Manage Supplier Agreements
Cost to Manage Supplier Network The sum of the costs associated with managing the supplier network.
ES.7 Manage Supplier Network
Cost to Manage Transportation The sum of the costs associated with managing Finished Good Transportation
ED.6 Manage Transportation

© Copyright 2006 Supply-Chain Council, Inc. 374 June 2006
METRIC DEFINITION PROCESS Cost to Manage Transportation (WIP) The sum of the costs associated with
managing WIP Transportation EM.6 Manage Transportation
Cost to Negotiate & Receive Contract The sum of the costs associated with negotiating and receiving contracts
D3.2 Negotiate & Receive Contract
Cost to Obtain & Respond to Request for Quote (RFQ) / Request for Proposal (RFP)
The sum of the costs associated with obtaining and responding to Request for Quote (RFQ) / Request for Proposal (RFP).
D3.1 Obtain and Respond to RFP/RFQ
Cost to Pack Product The sum of the costs associated with product packaging.
D1.10 Pack Product D2.10 Pack Product D3.10 Pack Product
Cost to Package The sum of the costs associated with product packaging.
M3.5 Package M2.4 Package M1.4 Package
Cost to Pick Product The sum of the costs associated with picking product.
D1.9 Pick Product D2.9 Pick Product D3.9 Pick Product
Cost to Pick Product from Backroom The sum of the costs associated with picking product from backroom.
D4.3 Pick Product from Backroom
Cost to Plan Deliver The sum of the costs associated with planning the delivery of product.
P4
Cost to Plan Make The sum of the costs associated with planning the making of product.
P3
Cost to Plan Return The sum of the costs associated with planning the returning of product.
P5
Cost to Plan Source The sum of the costs associated with planning source activities.
P2 Plan Source
Cost to Plan Supply Chain The sum of the costs associated with planning supply chain activities.
P1 Plan Supply Chain
Cost to Process Inquiry & Quote The sum of the costs associated with processing inquiry and quotes.
D1.1 Process Inquiry & Quote D2.1 Process Inquiry & Quote
Cost to Produce and Test The sum of the costs associated with production and test.
M3.4 Produce and Test M2.3 Produce and Test M1.3 Produce and Test
Cost to Receive & Verify Product by Customer
The sum of the costs associated with receipt and verification at customer site.
D1.13 Receive & Verify Product by Customer D2.13 Receive & Verify Product by Customer D3.13 Receive & Verify Product by Customer
Cost to Receive Defective Product The sum of the costs associated with receiving defective product returns.
DR1.3 Receive Defective Product
Cost to Receive Excess Product The sum of the costs associated with receiving excess returns.
DR3.3 Receive Excess Product
Cost to Receive MRO Product The sum of the costs associated with receiving MRO product returns.
DR2.3 Receive MRO Product
Cost to Receive Product The sum of the costs associated with receiving product.
S3.4 Receive Product S2.2 Receive Product S1.2 Receive Product
Cost to Receive Product at Store The sum of the costs associated with receiving product at the store.
D4.2 Receive Product at Store
Cost to Receive Product from Source or Make
The sum of the costs associated with transferring product from source or make activities.
D2.8 Receive Product from Source or Make D3.8 Receive Product from Source or Make D1.8 Receive Product from Source or Make
Cost to Receive, Enter & Validate Order
The sum of the costs associated with receiving, entering and validating a customer order.
D1.2 Receive, Enter & Validate Order D2.2 Receive, Configure, Enter and Validate Order

© Copyright 2006 Supply-Chain Council, Inc. 375 June 2006
METRIC DEFINITION PROCESS Cost to Release Finished Product to Deliver
The sum of the costs associated with releasing finished goods to deliver processes.
M3.7 Release Product to Deliver M2.6 Release Finished Product to Deliver M1.6 Release Product to Deliver
Cost to Reserve Resources & Determine Delivery Date
The sum of the costs associated with reserving resources and determining a delivery date.
D1.3 Reserve Inventory & Determine Delivery Date D2.3 Reserve Resources & Determine Delivery Date
Cost to Route Shipments The sum of the costs associated with routing shipments.
D3.6 Route Shipments D2.6 Route Shipments D1.6 Route Shipments
Cost to Schedule Excess Product Receipt
The sum of the costs associated with scheduling excess product receipt.
DR3.2 Schedule Excess Return Receipt
Cost to Schedule Installation The sum of the costs associated with scheduling product installation.
D3.4 Schedule Installation
Cost to Schedule MRO Product Receipt
The sum of the costs associated with scheduling MRO product receipt.
DR2.2 Schedule MRO Return Receipt
Cost to Schedule Product Deliveries The sum of the costs associated with scheduling product deliveries.
S3.3 Schedule Product Deliveries S2.1 Schedule Product Deliveries S1.1 Schedule Product Deliveries
Cost to Schedule Production Activities The sum of the costs associated with scheduling production activities.
M1.1 Schedule Production Activities M2.1 Schedule Production Activities M3.2 Schedule Production Activities
Cost to Select Carriers & Rate Shipments
The sum of the costs associated with selecting carriers and rating shipments.
D2.7 Select Carriers & Rate Shipments D1.7 Select Carriers & Rate Shipments D3.7 Select Carriers and Rate Shipments
Cost to Select Final Supplier(s) and Negotiate
The sum of the costs associated with selecting final suppliers and negotiating supplier agreements.
S3.2 Select Final Supplier(s) and Negotiate
Cost to Ship Product The sum of the costs associated with shipping products.
D1.12 Ship Product D2.12 Ship Product D3.12 Ship Product
Cost to Source The sum of the costs associated with Source.
S1 Source Stocked Product S2 Source Make-to-Order Product S3 Source Engineer-to-Order Product
Cost to Source Return The sum of the costs associated with Source Return
SR3 Source Return Excess Product SR2 Source Return MRO Product SR1 Source Return Defective Product
Cost to Stage Finished Product The sum of the costs associated with staging finished goods.
M3.6 Stage Finished Product M2.5 Stage Finished Product M1.5 Stage Product
Cost to Stock Shelf The sum of the costs associated with stocking shelves.
D4.4 Stock Shelf
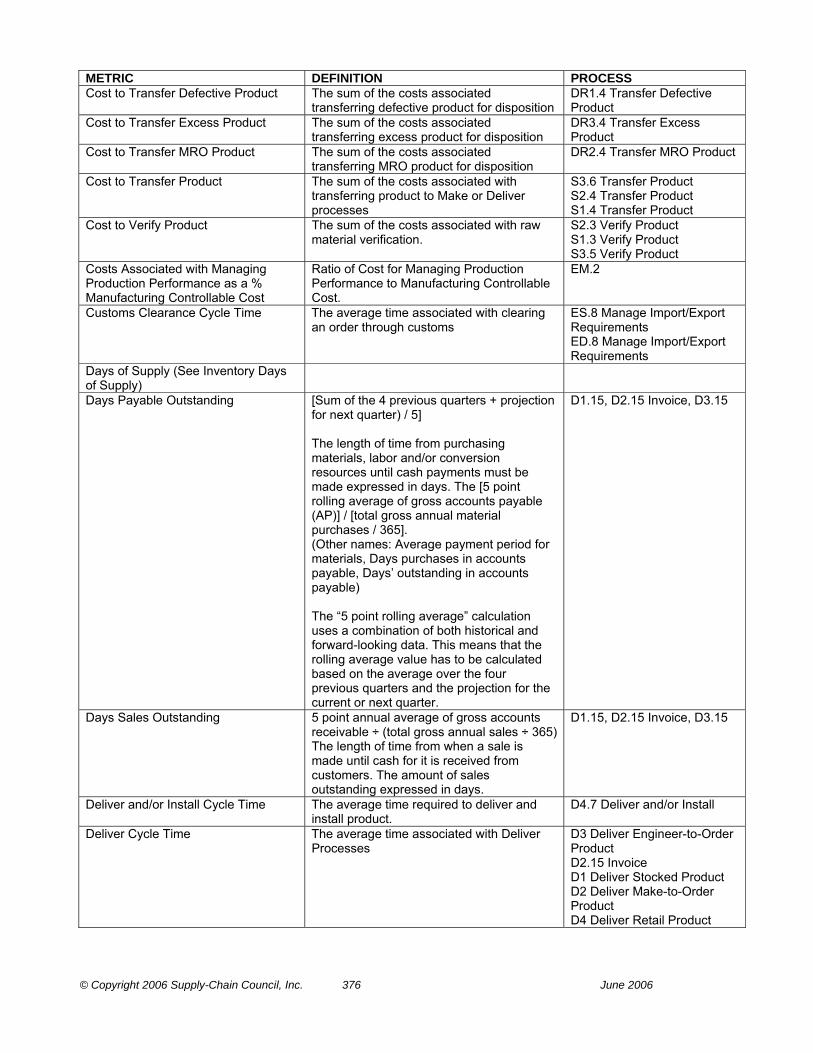
© Copyright 2006 Supply-Chain Council, Inc. 376 June 2006
METRIC DEFINITION PROCESS Cost to Transfer Defective Product The sum of the costs associated
transferring defective product for disposition DR1.4 Transfer Defective Product
Cost to Transfer Excess Product The sum of the costs associated transferring excess product for disposition
DR3.4 Transfer Excess Product
Cost to Transfer MRO Product The sum of the costs associated transferring MRO product for disposition
DR2.4 Transfer MRO Product
Cost to Transfer Product The sum of the costs associated with transferring product to Make or Deliver processes
S3.6 Transfer Product S2.4 Transfer Product S1.4 Transfer Product
Cost to Verify Product The sum of the costs associated with raw material verification.
S2.3 Verify Product S1.3 Verify Product S3.5 Verify Product
Costs Associated with Managing Production Performance as a % Manufacturing Controllable Cost
Ratio of Cost for Managing Production Performance to Manufacturing Controllable Cost.
EM.2
Customs Clearance Cycle Time The average time associated with clearing an order through customs
ES.8 Manage Import/Export Requirements ED.8 Manage Import/Export Requirements
Days of Supply (See Inventory Days of Supply)
Days Payable Outstanding
[Sum of the 4 previous quarters + projection for next quarter) / 5] The length of time from purchasing materials, labor and/or conversion resources until cash payments must be made expressed in days. The [5 point rolling average of gross accounts payable (AP)] / [total gross annual material purchases / 365]. (Other names: Average payment period for materials, Days purchases in accounts payable, Days’ outstanding in accounts payable) The “5 point rolling average” calculation uses a combination of both historical and forward-looking data. This means that the rolling average value has to be calculated based on the average over the four previous quarters and the projection for the current or next quarter.
D1.15, D2.15 Invoice, D3.15
Days Sales Outstanding 5 point annual average of gross accounts receivable ÷ (total gross annual sales ÷ 365) The length of time from when a sale is made until cash for it is received from customers. The amount of sales outstanding expressed in days.
D1.15, D2.15 Invoice, D3.15
Deliver and/or Install Cycle Time The average time required to deliver and install product.
D4.7 Deliver and/or Install
Deliver Cycle Time The average time associated with Deliver Processes
D3 Deliver Engineer-to-Order Product D2.15 Invoice D1 Deliver Stocked Product D2 Deliver Make-to-Order Product D4 Deliver Retail Product

© Copyright 2006 Supply-Chain Council, Inc. 377 June 2006
METRIC DEFINITION PROCESS Deliver Return Cycle Time The average time associated with returns. DR1 Deliver Return Defective
Product DR Deliver Return DR2 Deliver Return MRO Product
Delivery Performance to Customer Commit Date
The percentage of orders that are fulfilled on the customer's original commit date
D1.3, D1.12, D1.13, D2.3, D2.12, D2.13, D3.3, D3.12, D3.13
Documentation Accuracy Percentage of orders with on time and accurate documentation supporting the order, including packing slips, bills of lading, invoices, etc. [Total number of orders delivered with correct and timely documentation] / [Total number of orders delivered] x 100%
D1.11, D1.15, D2.11, D2.15, D3.11, D3.15, ED.2
Downside Deliver Adaptability The reduction in delivered quantities sustainable at 30 days prior to delivery with no inventory or cost penalties.
D2 Deliver Make-to-Order Product D1 Deliver Stocked Product D3 Deliver Engineer-to-Order Product D4 Deliver Retail Product
Downside Make Adaptability The production reduction sustainable at 30 days prior to delivery with no inventory or cost penalties.
M1 Make-to-Stock M2 Make-to-Order M3 Engineer-to-Order
Enter Order, Commit Resources & Launch Program Cycle Time
The average time associated with entering an order, committing resources and program launch
D3.3 Enter Order, Commit Resources & Launch Program
Establish and Communicate Return Plans Cycle Time
The average time associated with establishing and communicating return plans
P5.4 Establish and Communicate Return Plans
Establish and Communicate Supply Chain Plans Cycle Time
The average time associated with establishing and communicating supply chain plans
P1.4 Establish Supply Chain Plans
Establish Delivery Plans Cycle Time The average time associated with establishing and communicating deliver plans
P4.4 Establish Delivery Plans
Establish Production Plans Cycle Time
The average time associated with establishing and communicating production plans
P3.4 Establish Production Plans
Establish Sourcing Plans Cycle Time The average time associated with establishing and communicating source plans
P2.4 Establish Sourcing Plans
Fill Rate The percentage of ship-from-stock orders shipped within 24 hours of order receipt. For services, this metric is the proportion for services that are filled so that the service is completed within 24 hours
P1.3, P4.4, M1.3, D1.3, D1.9
Fill Shopping Cart Cycle Time The average time associated with "filling the shopping cart"
D4.5 Fill Shopping Cart
Finalize Production Engineering Cycle Time
The average time associated with the finalization of production engineering
M3.1 Finalize Production Engineering

© Copyright 2006 Supply-Chain Council, Inc. 378 June 2006
METRIC DEFINITION PROCESS Forecast Accuracy Forecast accuracy is calculated for products
and/or families for markets/distribution channels, in unit measurement. Common calculation (Sum Actuals - Sum of Variance) / Sum Actuals to determine percentage error. *monitoring the delta of Forecast Accuracy over measured time periods can determine success rates.
EP.4, EP.5, EP.6, EP.7, P1, P1.1, P2.1, P3.1, P4, P4.1, P4.2
Generate Stocking Schedule Cycle Time
The average time associated with the generating a stocking schedule
D4.1 Generate Stocking Schedule
Identify Sources of Supply Cycle Time The average time associated with the identification of sources of supply
S3.1 Identify Sources of Supply
Identify, Assess, and Aggregate Delivery Resources Cycle Time
The average time associated with the identifying, assessing, and aggregating delivery resource availability
P4.2 Identify, Assess, and Aggregate Delivery Resources and Capabilities
Identify, Assess, and Aggregate Product Resources Cycle Time
The average time associated with the identifying, assessing, and aggregating product resource availability
P2.2 Identify, Assess, And Aggregate Product Resources
Identify, Assess, and Aggregate Production Resources Cycle Time
The average time associated with the identifying, assessing, and aggregating production resource availability
P3.2 Identify, Assess, and Aggregate Production Resources
Identify, Assess, and Aggregate Return Resources Cycle Time
The average time associated with the identifying, assessing, and aggregating return resource availability
P5.2 Identify, Assess, and Aggregate Return Resources
Identify, Assess, and Aggregate Supply Chain Resources Cycle Time
The average time associated with the identifying, assessing, and aggregating supply chain resource availability
P1.2 Identify, Assess, and Aggregate Supply Chain Resources
Identify, Prioritize, and Aggregate Delivery Requirements Cycle Time
The average time associated with the identifying, prioritizing, and aggregating delivery requirements
P4.1 Identify, Prioritize, and Aggregate Delivery Requirements
Identify, Prioritize, and Aggregate Product Requirements Cycle Time
The average time associated with the identifying, prioritizing, and aggregating product requirements
P2.1 Identify, Prioritize, and Aggregate Product Requirements
Identify, Prioritize, and Aggregate Production Requirements Cycle Time
The average time associated with the identifying, prioritizing, and aggregating production requirements
P3.1 Identify, Prioritize, and Aggregate Production Requirements
Identify, Prioritize, and Aggregate Return Requirements Cycle Time
The average time associated with the identifying, prioritizing, and aggregating return requirements
P5.1 Assess, and Aggregate Return Requirements
Identify, Prioritize, and Aggregate Supply Chain Requirements Cycle Time
The average time associated with the identifying, prioritizing, and aggregating supply chain requirements
P1.1 Identify, Prioritize, and Aggregate Supply Chain Requirements
Install Product Cycle Time The average time associated with product installation
D1.14 Install Product D2.14 Install Product D3.14 Install Product
Inventory Days of Supply The amount of inventory (stock) expressed in days of sales. The [5 point rolling average of gross value of inventory at standard cost] / [annual cost of goods sold (COGS) / 365]. Example: If 2 items a day are sold and 20 items are held in inventory, this represents 10 days’ (20/2) sales in inventory. (Other names: Days cost-of-sales in inventory, Days’ sales in inventory).
P1.2, P1.3, P1.4, S1.4, S2.4, S3.6, ES.4, EM.4, ED.4
Inventory Days of Supply (Finished Goods)
Plant finished goods inventory days of supply are calculated as gross plant finished goods inventory ÷ (value of transfers/365 days).
D1.3, D1.8, D1.11, D1.14, D2.3, D2.8, D2.11, D2.14, D3.3, D3.8, D3.11, D3.14

© Copyright 2006 Supply-Chain Council, Inc. 379 June 2006
METRIC DEFINITION PROCESS Inventory Days of Supply (Raw Material)
Value of raw materials ÷ (COGS ÷ 365). S2 Source Make-to-Order Product S1 Source Stocked Product S3 Source Engineer-to-Order Product
Inventory Days of Supply (WIP) Total value of Work in Process ÷ (COGS ÷ 365).
P3.3, P3.4, M1.1, M1.5, M2.1, M2.5, M3.2, M3.6
Invoice Cycle Time The average time associated with the generation and issuance of an invoice
D1.15 Invoice D3.15 Invoice
Issue Material Cycle Time The average time associated with the issuance of material to production
M1.2 Issue Material
Issue Sourced/In-Process Product Cycle Time
The average time associated with the issuance of material to production
M2.2 Issue Sourced/In-Process Product M3.3 Issue Sourced/In-Process Product
Load Product & Generate Shipping Documentation Cycle Time
The average time associated with product loading and the generation of shipping documentation
D1.11 Load Vehicle & Generate Shipping Documentation D2.11 Load Product & Generate Shipping Documentation D3.11 Load Product & Generate Ship Documents
Maintain Source Data Cycle Time The average time associated with maintaining source data
ES.3 Maintain Source Data
Make Cycle Time The average time associated with Make Processes
M1 Make-to-Stock M3 Engineer-to-Order M2 Make-to-Order
Manage Business Rules for PLAN Processes Cycle Time
The average time associated with managing plan business rules
EP.1 Manage Business Rules for PLAN Processes
Manage Business Rules for Return Processes Cycle Time
The average time associated with managing rules for returns
ER.1 Manage Business Rules for Return Processes
Manage Capital Assets Cycle Time The average time associated with managing capital assets
ES.5 Manage Capital Assets
Manage Deliver Business Rules Cycle Time
The average time associated with managing deliver business rules
ED.1 Manage Deliver Business Rules
Manage Deliver Capital Assets Cycle Time
The average time associated with managing deliver capital assets
ED.5 Manage Deliver Capital Assets
Manage Deliver Information Cycle Time
The average time associated with managing deliver information
ED.3 Manage Deliver Information
Manage Finished Goods Inventories Cycle Time
The average time associated with managing finished good inventory
ED.4 Manage Finished Goods Inventories
Manage Import/Export Requirements Cycle Time
The average time associated with managing import/export requirements
ED.8 Manage Import/Export Requirements ES.8 Manage Import/Export Requirements
Manage Incoming Product Cycle Time The average time associated with managing inbound raw material
ES.6 Manage Incoming Product
Manage In-Process Products (WIP) Cycle Time
The average time associated with managing WIP inventory
EM.4 Manage In-Process Products (WIP)
Manage Integrated Supply Chain Capital Assets Cycle Time
The average time associated with managing integrated supply chain capital assets
EP.5 Manage Integrated Supply Chain Capital Assets
Manage Integrated Supply Chain Inventory Cycle Time
The average time associated with managing integrated supply chain inventory
EP.4 Manage Integrated Supply Chain Inventory
Manage Integrated Supply Chain Transportation Cycle Time
The average time associated with managing integrated supply chain transportation
EP.6 Manage Integrated Supply Chain Transportation
Manage MAKE Equipment and Facilities Cycle Time
The average time associated with managing production equipment and facilities
EM.5 Manage Equipment and Facilities
Manage MAKE Information Cycle Time
The average time associated with managing production information
EM.3 Manage MAKE Information
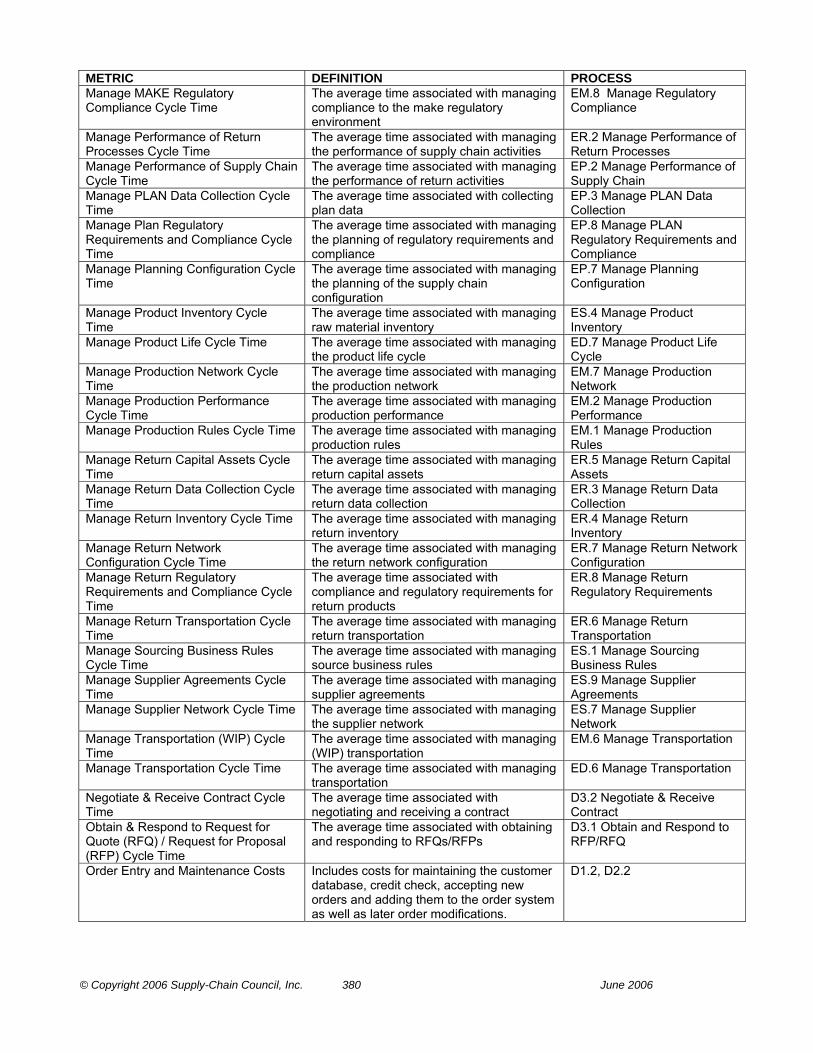
© Copyright 2006 Supply-Chain Council, Inc. 380 June 2006
METRIC DEFINITION PROCESS Manage MAKE Regulatory Compliance Cycle Time
The average time associated with managing compliance to the make regulatory environment
EM.8 Manage Regulatory Compliance
Manage Performance of Return Processes Cycle Time
The average time associated with managing the performance of supply chain activities
ER.2 Manage Performance of Return Processes
Manage Performance of Supply Chain Cycle Time
The average time associated with managing the performance of return activities
EP.2 Manage Performance of Supply Chain
Manage PLAN Data Collection Cycle Time
The average time associated with collecting plan data
EP.3 Manage PLAN Data Collection
Manage Plan Regulatory Requirements and Compliance Cycle Time
The average time associated with managing the planning of regulatory requirements and compliance
EP.8 Manage PLAN Regulatory Requirements and Compliance
Manage Planning Configuration Cycle Time
The average time associated with managing the planning of the supply chain configuration
EP.7 Manage Planning Configuration
Manage Product Inventory Cycle Time
The average time associated with managing raw material inventory
ES.4 Manage Product Inventory
Manage Product Life Cycle Time The average time associated with managing the product life cycle
ED.7 Manage Product Life Cycle
Manage Production Network Cycle Time
The average time associated with managing the production network
EM.7 Manage Production Network
Manage Production Performance Cycle Time
The average time associated with managing production performance
EM.2 Manage Production Performance
Manage Production Rules Cycle Time The average time associated with managing production rules
EM.1 Manage Production Rules
Manage Return Capital Assets Cycle Time
The average time associated with managing return capital assets
ER.5 Manage Return Capital Assets
Manage Return Data Collection Cycle Time
The average time associated with managing return data collection
ER.3 Manage Return Data Collection
Manage Return Inventory Cycle Time The average time associated with managing return inventory
ER.4 Manage Return Inventory
Manage Return Network Configuration Cycle Time
The average time associated with managing the return network configuration
ER.7 Manage Return Network Configuration
Manage Return Regulatory Requirements and Compliance Cycle Time
The average time associated with compliance and regulatory requirements for return products
ER.8 Manage Return Regulatory Requirements
Manage Return Transportation Cycle Time
The average time associated with managing return transportation
ER.6 Manage Return Transportation
Manage Sourcing Business Rules Cycle Time
The average time associated with managing source business rules
ES.1 Manage Sourcing Business Rules
Manage Supplier Agreements Cycle Time
The average time associated with managing supplier agreements
ES.9 Manage Supplier Agreements
Manage Supplier Network Cycle Time The average time associated with managing the supplier network
ES.7 Manage Supplier Network
Manage Transportation (WIP) Cycle Time
The average time associated with managing (WIP) transportation
EM.6 Manage Transportation
Manage Transportation Cycle Time The average time associated with managing transportation
ED.6 Manage Transportation
Negotiate & Receive Contract Cycle Time
The average time associated with negotiating and receiving a contract
D3.2 Negotiate & Receive Contract
Obtain & Respond to Request for Quote (RFQ) / Request for Proposal (RFP) Cycle Time
The average time associated with obtaining and responding to RFQs/RFPs
D3.1 Obtain and Respond to RFP/RFQ
Order Entry and Maintenance Costs Includes costs for maintaining the customer database, credit check, accepting new orders and adding them to the order system as well as later order modifications.
D1.2, D2.2
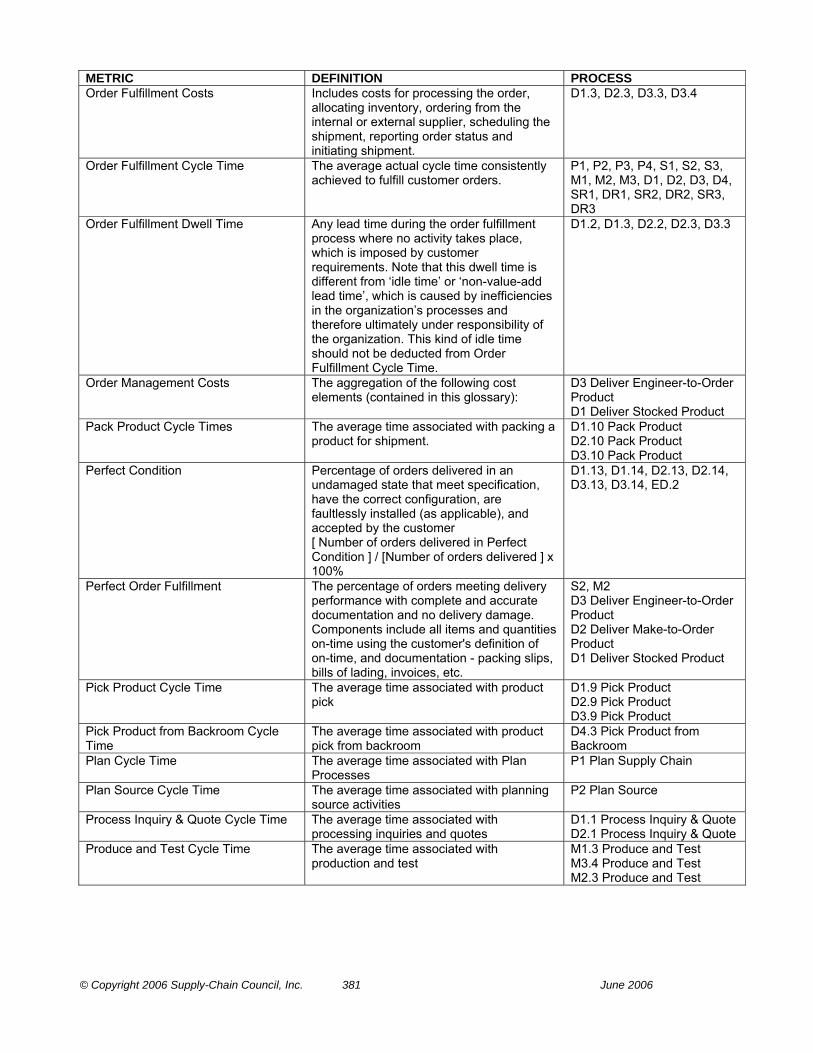
© Copyright 2006 Supply-Chain Council, Inc. 381 June 2006
METRIC DEFINITION PROCESS Order Fulfillment Costs Includes costs for processing the order,
allocating inventory, ordering from the internal or external supplier, scheduling the shipment, reporting order status and initiating shipment.
D1.3, D2.3, D3.3, D3.4
Order Fulfillment Cycle Time The average actual cycle time consistently achieved to fulfill customer orders.
P1, P2, P3, P4, S1, S2, S3, M1, M2, M3, D1, D2, D3, D4, SR1, DR1, SR2, DR2, SR3, DR3
Order Fulfillment Dwell Time Any lead time during the order fulfillment process where no activity takes place, which is imposed by customer requirements. Note that this dwell time is different from ‘idle time’ or ‘non-value-add lead time’, which is caused by inefficiencies in the organization’s processes and therefore ultimately under responsibility of the organization. This kind of idle time should not be deducted from Order Fulfillment Cycle Time.
D1.2, D1.3, D2.2, D2.3, D3.3
Order Management Costs The aggregation of the following cost elements (contained in this glossary):
D3 Deliver Engineer-to-Order Product D1 Deliver Stocked Product
Pack Product Cycle Times The average time associated with packing a product for shipment.
D1.10 Pack Product D2.10 Pack Product D3.10 Pack Product
Perfect Condition Percentage of orders delivered in an undamaged state that meet specification, have the correct configuration, are faultlessly installed (as applicable), and accepted by the customer [ Number of orders delivered in Perfect Condition ] / [Number of orders delivered ] x 100%
D1.13, D1.14, D2.13, D2.14, D3.13, D3.14, ED.2
Perfect Order Fulfillment The percentage of orders meeting delivery performance with complete and accurate documentation and no delivery damage. Components include all items and quantities on-time using the customer's definition of on-time, and documentation - packing slips, bills of lading, invoices, etc.
S2, M2 D3 Deliver Engineer-to-Order Product D2 Deliver Make-to-Order Product D1 Deliver Stocked Product
Pick Product Cycle Time The average time associated with product pick
D1.9 Pick Product D2.9 Pick Product D3.9 Pick Product
Pick Product from Backroom Cycle Time
The average time associated with product pick from backroom
D4.3 Pick Product from Backroom
Plan Cycle Time The average time associated with Plan Processes
P1 Plan Supply Chain
Plan Source Cycle Time The average time associated with planning source activities
P2 Plan Source
Process Inquiry & Quote Cycle Time The average time associated with processing inquiries and quotes
D1.1 Process Inquiry & Quote D2.1 Process Inquiry & Quote
Produce and Test Cycle Time The average time associated with production and test
M1.3 Produce and Test M3.4 Produce and Test M2.3 Produce and Test

© Copyright 2006 Supply-Chain Council, Inc. 382 June 2006
METRIC DEFINITION PROCESS Product Acquisition Costs Product acquisition costs include costs
incurred for the production of product: sum of product management and planning, supplier quality engineering, inbound freight and duties, receiving and product storage, incoming inspection, product process engineering and tooling costs.
S3 Source Engineer-to-Order Product S2 Source Make-to-Order Product S1 Source Stocked Product
Receive & Verify Product by Customer Cycle Time
The average time associated with receiving and verifying an order at the customer site
D1.13 Receive & Verify Product by Customer D2.13 Receive & Verify Product by Customer D3.13 Receive & Verify Product by Customer
Receive Defective Product Cycle Time
The average time associated with receiving defective product returns from the customer
DR1.3 Receive Defective Product
Receive Excess Product Cycle Time The average time associated with receiving excess product returns from the customer
DR3.3 Receive Excess Product
Receive MRO Product Cycle Time The average time associated with receiving MRO product returns from the customer
DR2.3 Receive MRO Product
Receive Product at Store Cycle Time The average time associated with receiving product at the customer store
D4.2 Receive Product at Store
Receive Product from Source or Make Cycle Time
The average time associated with receiving a transfer of product to deliver processes from source or make
D1.8 Receive Product from Source or Make D2.8 Receive Product from Source or Make D3.8 Receive Product from Source or Make
Receive, Configure, Enter & Validate Order Cycle Time
The average time associated with receiving and verifying an order at the customer site
D2.2 Receive, Configure, Enter and Validate Order
Receive, Enter & Validate Order Cycle Time
The average time associated with receiving and verifying an order at the customer site
D1.2 Receive, Enter & Validate Order
Receiving Product Cycle Time Total elapsed time from time product is received to time it is passed to next process
S3.4 Receive Product S2.2 Receive Product S1.2 Receive Product
Release Finished Product to Deliver Cycle Time
The average time associated with releasing finished product to deliver
M2.6 Release Finished Product to Deliver M1.6 Release Product to Deliver M3.7 Release Product to Deliver
Reserve Inventory & Determine Delivery Date Cycle Time
The average time associated with reserving inventory and determining a delivery date
D1.3 Reserve Inventory & Determine Delivery Date
Return on Supply Chain Fixed Assets Return on Supply Chain Fixed Assets measures the return an organization receives on its invested capital in supply chain fixed assets. This includes the fixed assets used in Plan, Source, Make, Deliver, and Return.
P1, P2, P3, P4, S1, S2, S3, M1, M2, M3, D1, D2, D3, D4, SR1, DR1, SR2, DR2, SR3, DR3
Return on Working Capital Return on working capital is a measurement which assesses the magnitude of investment relative to a company’s working capital position verses the revenue generated from a supply chain. Components include accounts receivable, accounts payable, inventory, supply chain revenue, cost of goods sold and supply chain management costs.
P1, P2, P3, P4, S1, S2, S3, M1, M2, M3, D1, D2, D3, D4, SR1, DR1, SR2, DR2, SR3, DR3
Route Shipments Cycle Time The average time associated with routing shipments
D3.6 Route Shipments D2.6 Route Shipments D1.6 Route Shipments
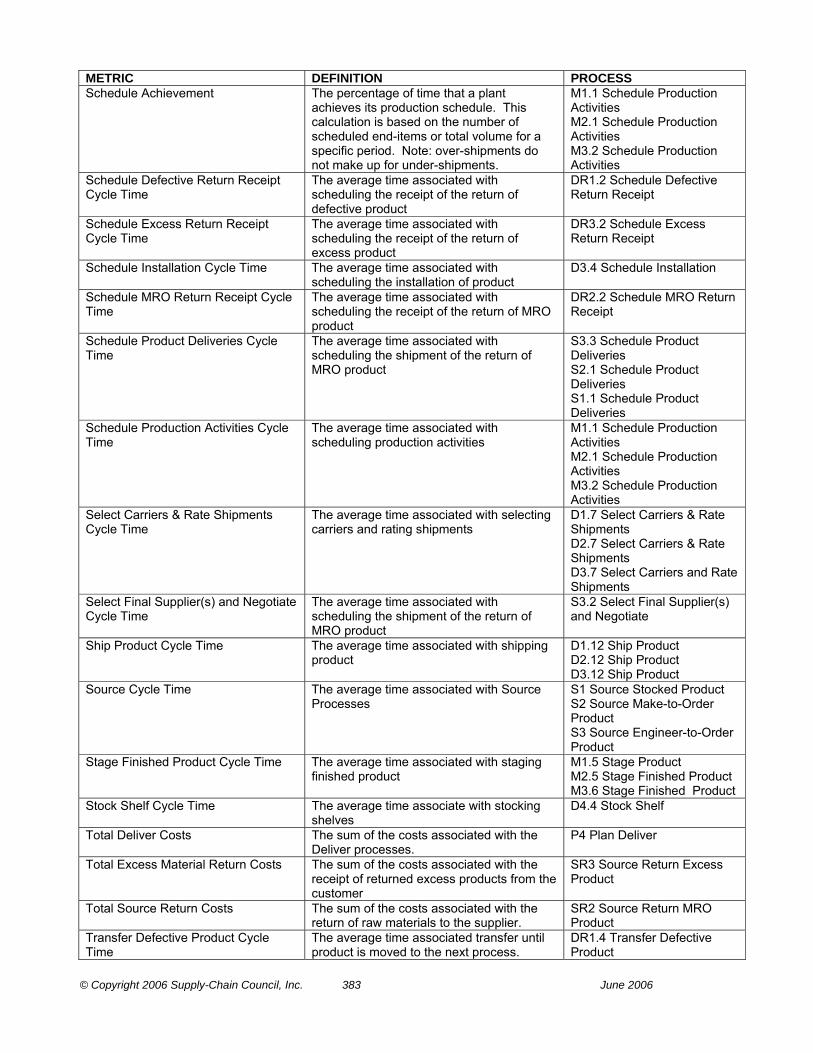
© Copyright 2006 Supply-Chain Council, Inc. 383 June 2006
METRIC DEFINITION PROCESS Schedule Achievement The percentage of time that a plant
achieves its production schedule. This calculation is based on the number of scheduled end-items or total volume for a specific period. Note: over-shipments do not make up for under-shipments.
M1.1 Schedule Production Activities M2.1 Schedule Production Activities M3.2 Schedule Production Activities
Schedule Defective Return Receipt Cycle Time
The average time associated with scheduling the receipt of the return of defective product
DR1.2 Schedule Defective Return Receipt
Schedule Excess Return Receipt Cycle Time
The average time associated with scheduling the receipt of the return of excess product
DR3.2 Schedule Excess Return Receipt
Schedule Installation Cycle Time The average time associated with scheduling the installation of product
D3.4 Schedule Installation
Schedule MRO Return Receipt Cycle Time
The average time associated with scheduling the receipt of the return of MRO product
DR2.2 Schedule MRO Return Receipt
Schedule Product Deliveries Cycle Time
The average time associated with scheduling the shipment of the return of MRO product
S3.3 Schedule Product Deliveries S2.1 Schedule Product Deliveries S1.1 Schedule Product Deliveries
Schedule Production Activities Cycle Time
The average time associated with scheduling production activities
M1.1 Schedule Production Activities M2.1 Schedule Production Activities M3.2 Schedule Production Activities
Select Carriers & Rate Shipments Cycle Time
The average time associated with selecting carriers and rating shipments
D1.7 Select Carriers & Rate Shipments D2.7 Select Carriers & Rate Shipments D3.7 Select Carriers and Rate Shipments
Select Final Supplier(s) and Negotiate Cycle Time
The average time associated with scheduling the shipment of the return of MRO product
S3.2 Select Final Supplier(s) and Negotiate
Ship Product Cycle Time The average time associated with shipping product
D1.12 Ship Product D2.12 Ship Product D3.12 Ship Product
Source Cycle Time The average time associated with Source Processes
S1 Source Stocked Product S2 Source Make-to-Order Product S3 Source Engineer-to-Order Product
Stage Finished Product Cycle Time The average time associated with staging finished product
M1.5 Stage Product M2.5 Stage Finished Product M3.6 Stage Finished Product
Stock Shelf Cycle Time The average time associate with stocking shelves
D4.4 Stock Shelf
Total Deliver Costs The sum of the costs associated with the Deliver processes.
P4 Plan Deliver
Total Excess Material Return Costs The sum of the costs associated with the receipt of returned excess products from the customer
SR3 Source Return Excess Product
Total Source Return Costs The sum of the costs associated with the return of raw materials to the supplier.
SR2 Source Return MRO Product
Transfer Defective Product Cycle Time
The average time associated transfer until product is moved to the next process.
DR1.4 Transfer Defective Product
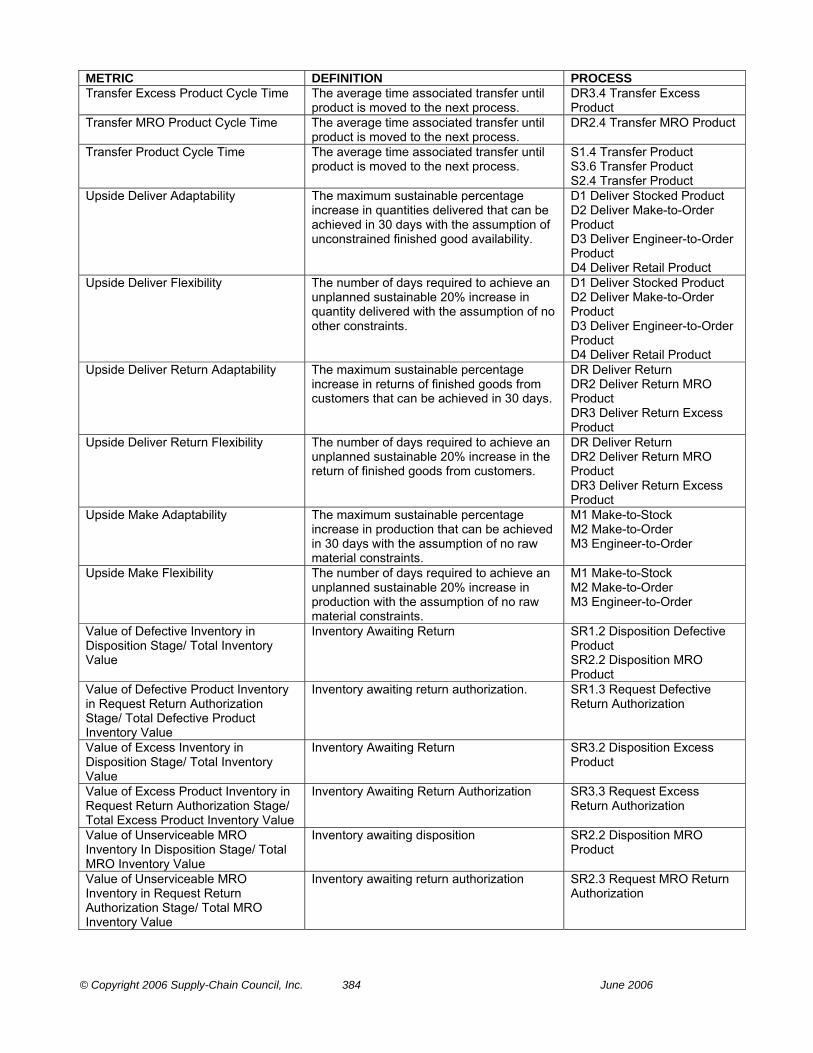
© Copyright 2006 Supply-Chain Council, Inc. 384 June 2006
METRIC DEFINITION PROCESS Transfer Excess Product Cycle Time The average time associated transfer until
product is moved to the next process. DR3.4 Transfer Excess Product
Transfer MRO Product Cycle Time The average time associated transfer until product is moved to the next process.
DR2.4 Transfer MRO Product
Transfer Product Cycle Time The average time associated transfer until product is moved to the next process.
S1.4 Transfer Product S3.6 Transfer Product S2.4 Transfer Product
Upside Deliver Adaptability The maximum sustainable percentage increase in quantities delivered that can be achieved in 30 days with the assumption of unconstrained finished good availability.
D1 Deliver Stocked Product D2 Deliver Make-to-Order Product D3 Deliver Engineer-to-Order Product D4 Deliver Retail Product
Upside Deliver Flexibility The number of days required to achieve an unplanned sustainable 20% increase in quantity delivered with the assumption of no other constraints.
D1 Deliver Stocked Product D2 Deliver Make-to-Order Product D3 Deliver Engineer-to-Order Product D4 Deliver Retail Product
Upside Deliver Return Adaptability The maximum sustainable percentage increase in returns of finished goods from customers that can be achieved in 30 days.
DR Deliver Return DR2 Deliver Return MRO Product DR3 Deliver Return Excess Product
Upside Deliver Return Flexibility The number of days required to achieve an unplanned sustainable 20% increase in the return of finished goods from customers.
DR Deliver Return DR2 Deliver Return MRO Product DR3 Deliver Return Excess Product
Upside Make Adaptability The maximum sustainable percentage increase in production that can be achieved in 30 days with the assumption of no raw material constraints.
M1 Make-to-Stock M2 Make-to-Order M3 Engineer-to-Order
Upside Make Flexibility The number of days required to achieve an unplanned sustainable 20% increase in production with the assumption of no raw material constraints.
M1 Make-to-Stock M2 Make-to-Order M3 Engineer-to-Order
Value of Defective Inventory in Disposition Stage/ Total Inventory Value
Inventory Awaiting Return SR1.2 Disposition Defective Product SR2.2 Disposition MRO Product
Value of Defective Product Inventory in Request Return Authorization Stage/ Total Defective Product Inventory Value
Inventory awaiting return authorization. SR1.3 Request Defective Return Authorization
Value of Excess Inventory in Disposition Stage/ Total Inventory Value
Inventory Awaiting Return SR3.2 Disposition Excess Product
Value of Excess Product Inventory in Request Return Authorization Stage/ Total Excess Product Inventory Value
Inventory Awaiting Return Authorization SR3.3 Request Excess Return Authorization
Value of Unserviceable MRO Inventory In Disposition Stage/ Total MRO Inventory Value
Inventory awaiting disposition SR2.2 Disposition MRO Product
Value of Unserviceable MRO Inventory in Request Return Authorization Stage/ Total MRO Inventory Value
Inventory awaiting return authorization SR2.3 Request MRO Return Authorization

© Copyright 2006 Supply-Chain Council, Inc. 385 June 2006
METRIC DEFINITION PROCESS Verify Product Cycle Time The average time associated with verifying
raw material product S3.5 Verify Product S2.3 Verify Product S1.3 Verify Product
Warranty and Returns Number of returns within the warranty period. Warranty is a commitment, either expressed or implied that a certain fact regarding the subject matter of a contract is presently true or will be true.
M1.3, M1.4
Warranty Costs Warranty costs include materials, labor and problem diagnosis for product defects.
M1, M1.3, M1.4, M2, M2.3, M2.4, M3, M3.4, M3.5
Yield The ratio of usable output from a process to its input.
M2 Make-to-Order M2.3 Produce and Test M1.3 Produce and Test M3.4 Produce and Test M1 Make-to-Stock M3 Engineer-to-Order
Yield Variability The condition that occurs when the output of a process is not consistently repeatable either in quantity, quality, or combination of these.
M1.3 Produce and Test M3.4 Produce and Test M2.3 Produce and Test

© Copyright 2006 Supply-Chain Council, Inc. 386 June 2006
BEST PRACTICES BEST PRACTICE DEFINITION PROCESS ABC Classification None identified EP.7 Manage Planning
Configuration Ability to Track Component/Sub-Component Manufacturing Country of Origin
Component/lot tracking (lot trace-ability) ED.8 Manage Import/Export Requirements ES.8 Manage Import/Export Requirements
Accurate and Approved Process Plans, Routings, Specifications and Procedures
Electronic document management M1.4 Package M2.4 Package
Accurate and Approved Process Plans/Specifications
Electronic document management M1.3 Produce and Test M2.3 Produce and Test
Accurate and Approved Work Instructions/Process Plans
Electronic document management that maintains current Standard Operating Procedures (SOP)
M2 Make-to-Order M1 Make-to-Stock
Accurate and Low Cost Batch Records for Regulatory Compliance
Electronic batch records M2.6 Release Product to Deliver M3.7 Release Product to Deliver M1.6 Release Product to Deliver M2.6 Release Finished Product to Deliver
Accurate and Low Cost Batch/Configuration Records for Warranty and Regulatory Tracking
Electronic batch recording/configuration M2 Make-to-Order M1 Make-to-Stock M2.3 Produce and Test M1.3 Produce and Test M1.4 Package M2.4 Package
Additional Capacity for Overflow Demand
Outsource manufacturing and work force augmentation providers connected to production schedules via the internet.
M1.1 Schedule Production Activities M2.1 Schedule Production Activities M3.2 Schedule Production Activities
Advance Planning Engines Applied to Returns
Advanced math model "solvers" that optimize / minimize constraints, routing, restocking priorities and costs.
P5.3 Balance Return Resources with Return Requirements
Advanced Ship Notices Allow for Tight Synchronization between Source and Make Processes
Blanket order support with scheduling interfaces to external supplier systems
S1.1 Schedule Product Deliveries S2.1 Schedule Product Deliveries S3.3 Schedule Product Deliveries
Advanced Shipping Notice Integrated data sharing with repair facility. SR2.5 Return MRO Product SR1.5 Return Defective Product SR3.5 Return Excess Product
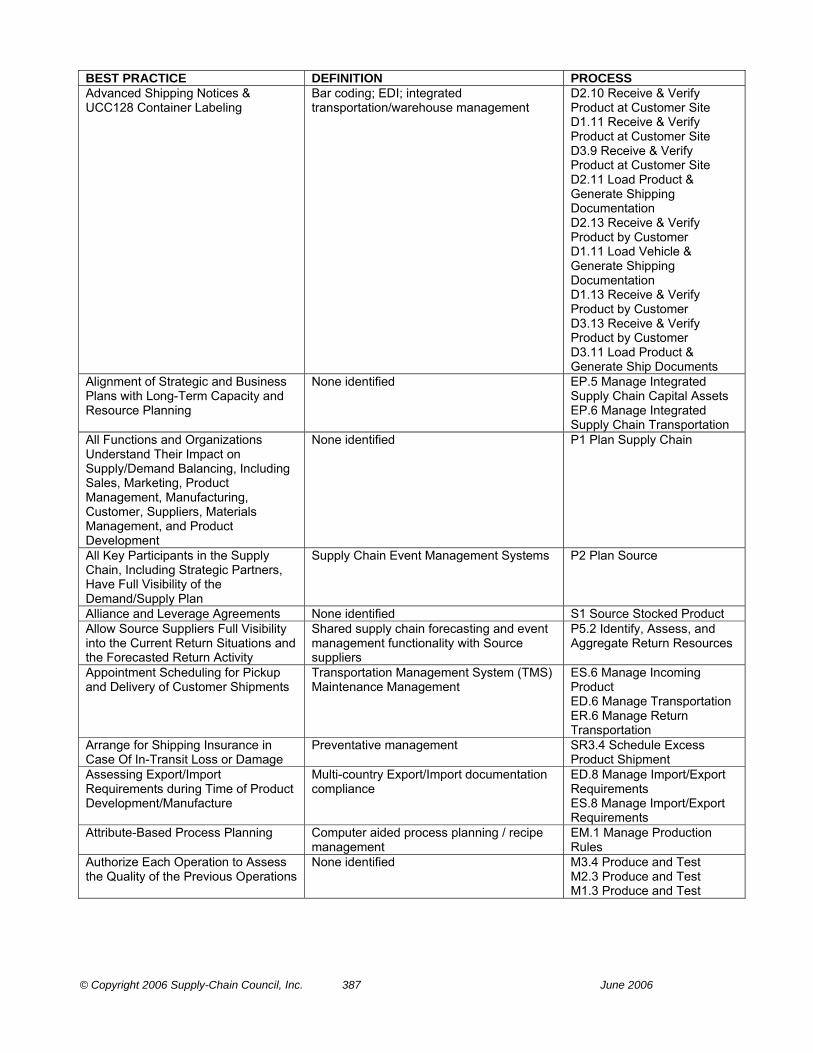
© Copyright 2006 Supply-Chain Council, Inc. 387 June 2006
BEST PRACTICE DEFINITION PROCESS Advanced Shipping Notices & UCC128 Container Labeling
Bar coding; EDI; integrated transportation/warehouse management
D2.10 Receive & Verify Product at Customer Site D1.11 Receive & Verify Product at Customer Site D3.9 Receive & Verify Product at Customer Site D2.11 Load Product & Generate Shipping Documentation D2.13 Receive & Verify Product by Customer D1.11 Load Vehicle & Generate Shipping Documentation D1.13 Receive & Verify Product by Customer D3.13 Receive & Verify Product by Customer D3.11 Load Product & Generate Ship Documents
Alignment of Strategic and Business Plans with Long-Term Capacity and Resource Planning
None identified EP.5 Manage Integrated Supply Chain Capital Assets EP.6 Manage Integrated Supply Chain Transportation
All Functions and Organizations Understand Their Impact on Supply/Demand Balancing, Including Sales, Marketing, Product Management, Manufacturing, Customer, Suppliers, Materials Management, and Product Development
None identified P1 Plan Supply Chain
All Key Participants in the Supply Chain, Including Strategic Partners, Have Full Visibility of the Demand/Supply Plan
Supply Chain Event Management Systems P2 Plan Source
Alliance and Leverage Agreements None identified S1 Source Stocked Product Allow Source Suppliers Full Visibility into the Current Return Situations and the Forecasted Return Activity
Shared supply chain forecasting and event management functionality with Source suppliers
P5.2 Identify, Assess, and Aggregate Return Resources
Appointment Scheduling for Pickup and Delivery of Customer Shipments
Transportation Management System (TMS) Maintenance Management
ES.6 Manage Incoming Product ED.6 Manage Transportation ER.6 Manage Return Transportation
Arrange for Shipping Insurance in Case Of In-Transit Loss or Damage
Preventative management SR3.4 Schedule Excess Product Shipment
Assessing Export/Import Requirements during Time of Product Development/Manufacture
Multi-country Export/Import documentation compliance
ED.8 Manage Import/Export Requirements ES.8 Manage Import/Export Requirements
Attribute-Based Process Planning Computer aided process planning / recipe management
EM.1 Manage Production Rules
Authorize Each Operation to Assess the Quality of the Previous Operations
None identified M3.4 Produce and Test M2.3 Produce and Test M1.3 Produce and Test

© Copyright 2006 Supply-Chain Council, Inc. 388 June 2006
BEST PRACTICE DEFINITION PROCESS Automated Configuration Management
Configuration M3.1 Finalize Engineering D2.2 Receive, Configure, Enter and Validate Order M3.1 Finalize Production Engineering
Automated Conformance Monitoring And Control
Internal automatic notification of conformance, including holding of product until requirements are met
EM.8 Manage Regulatory Compliance
Automated Conversion of Engineering Drawings into Product Specifications
None identified M3.1 Finalize Engineering M3.1 Finalize Production Engineering
Automated Data Entry Scanning with RFID/Bar-codes systems ED.5 Manage Deliver Capital Assets ER.5 Manage Return Capital Assets
Automated Directed Picking A pick list displayed on a handheld device that directs picks and relieves inventory from backroom locations
D4.3 Pick Product from Backroom
Automated Disposition Instructions for Returns Based on Data Interchange with Strategic Providers
Advanced planning and scheduling capability coupled with decision support logic.
ER.5 Manage Return Capital Assets
Automated Documentation for International Shipments
Transportation Management System (TMS) Maintenance Management
ES.6 Manage Incoming Product ED.6 Manage Transportation ER.6 Manage Return Transportation
Automated Engineering Specifications Automated Intelligence (Heuristic) - based engineering specifications system
EM.1 Manage Production Rules
Automated Inventory Visibility and Planning System to Highlight Inventory in Excess of Requirements
Automated inventory planning package linked to real time demand data and inventory business rules.
SR3.1 Identify Excess Product Condition
Automated Links To Existing CAD & CAM Information
Electronic hypertext or links to existing database of detail/parts/setup sketches/drawings
EM.1 Manage Production Rules
Automated Notification of Laboratory Regarding Sample Availability
Interface between production system and LIMS
M2.6 Release Product to Deliver M3.7 Release Product to Deliver M1.6 Release Product to Deliver M2.6 Release Finished Product to Deliver
Automated Pick List System generated pick-lists based on picking / batching rules.
D4.2 Receive Product at Store D4.1 Generate Stocking Schedule
Automated Registry of Inventory Return Locations by Item to Speed Identification of Proper Return Location
None identified SR3.2 Disposition Excess Product
Automated Replenishment of Back Stock Based on Minimum Stocking Levels
None identified D4.3 Pick Product from Backroom
Automated Statistical Process Control (SPC)
None identified S2 Source Make-to-Order Product
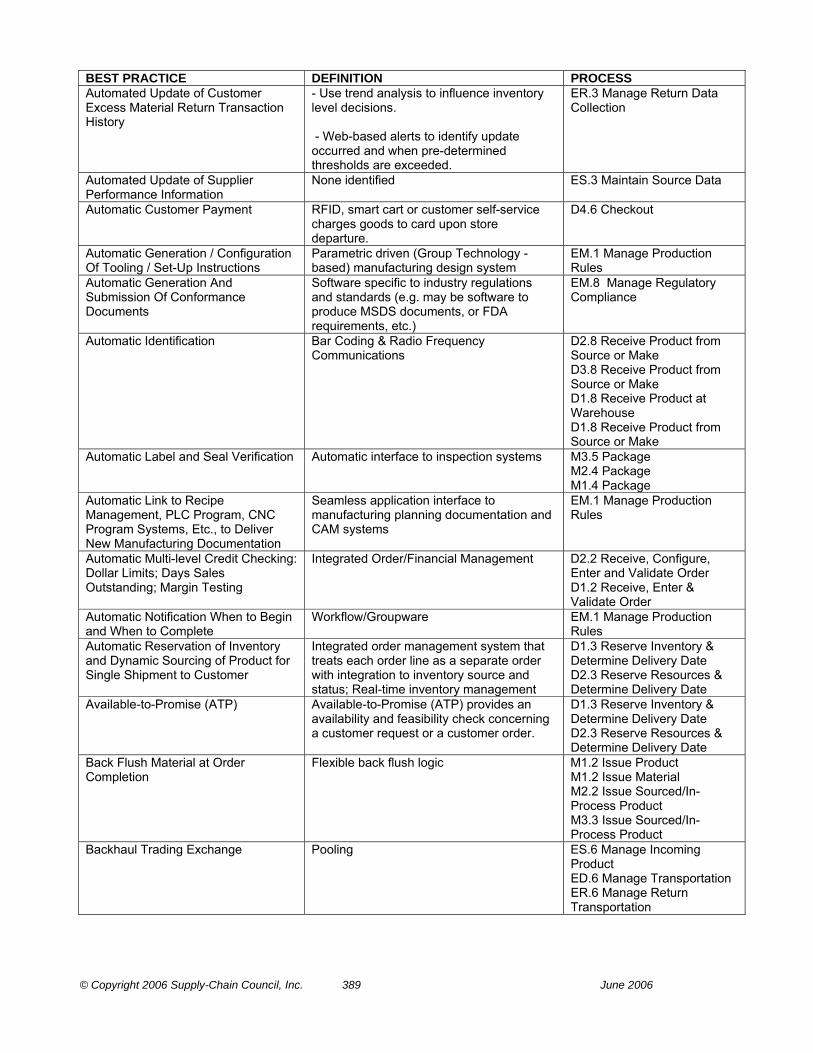
© Copyright 2006 Supply-Chain Council, Inc. 389 June 2006
BEST PRACTICE DEFINITION PROCESS Automated Update of Customer Excess Material Return Transaction History
- Use trend analysis to influence inventory level decisions. - Web-based alerts to identify update occurred and when pre-determined thresholds are exceeded.
ER.3 Manage Return Data Collection
Automated Update of Supplier Performance Information
None identified ES.3 Maintain Source Data
Automatic Customer Payment RFID, smart cart or customer self-service charges goods to card upon store departure.
D4.6 Checkout
Automatic Generation / Configuration Of Tooling / Set-Up Instructions
Parametric driven (Group Technology - based) manufacturing design system
EM.1 Manage Production Rules
Automatic Generation And Submission Of Conformance Documents
Software specific to industry regulations and standards (e.g. may be software to produce MSDS documents, or FDA requirements, etc.)
EM.8 Manage Regulatory Compliance
Automatic Identification Bar Coding & Radio Frequency Communications
D2.8 Receive Product from Source or Make D3.8 Receive Product from Source or Make D1.8 Receive Product at Warehouse D1.8 Receive Product from Source or Make
Automatic Label and Seal Verification Automatic interface to inspection systems M3.5 Package M2.4 Package M1.4 Package
Automatic Link to Recipe Management, PLC Program, CNC Program Systems, Etc., to Deliver New Manufacturing Documentation
Seamless application interface to manufacturing planning documentation and CAM systems
EM.1 Manage Production Rules
Automatic Multi-level Credit Checking: Dollar Limits; Days Sales Outstanding; Margin Testing
Integrated Order/Financial Management D2.2 Receive, Configure, Enter and Validate Order D1.2 Receive, Enter & Validate Order
Automatic Notification When to Begin and When to Complete
Workflow/Groupware EM.1 Manage Production Rules
Automatic Reservation of Inventory and Dynamic Sourcing of Product for Single Shipment to Customer
Integrated order management system that treats each order line as a separate order with integration to inventory source and status; Real-time inventory management
D1.3 Reserve Inventory & Determine Delivery Date D2.3 Reserve Resources & Determine Delivery Date
Available-to-Promise (ATP) Available-to-Promise (ATP) provides an availability and feasibility check concerning a customer request or a customer order.
D1.3 Reserve Inventory & Determine Delivery Date D2.3 Reserve Resources & Determine Delivery Date
Back Flush Material at Order Completion
Flexible back flush logic M1.2 Issue Product M1.2 Issue Material M2.2 Issue Sourced/In-Process Product M3.3 Issue Sourced/In-Process Product
Backhaul Trading Exchange Pooling ES.6 Manage Incoming Product ED.6 Manage Transportation ER.6 Manage Return Transportation
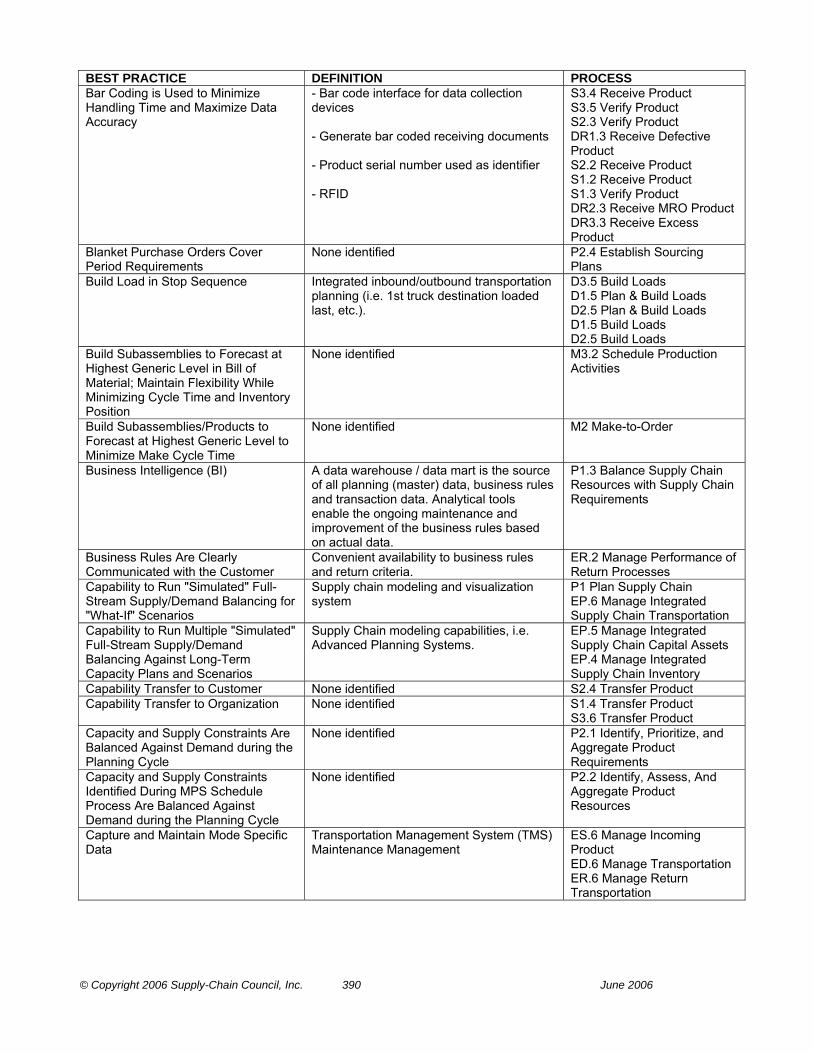
© Copyright 2006 Supply-Chain Council, Inc. 390 June 2006
BEST PRACTICE DEFINITION PROCESS Bar Coding is Used to Minimize Handling Time and Maximize Data Accuracy
- Bar code interface for data collection devices - Generate bar coded receiving documents - Product serial number used as identifier - RFID
S3.4 Receive Product S3.5 Verify Product S2.3 Verify Product DR1.3 Receive Defective Product S2.2 Receive Product S1.2 Receive Product S1.3 Verify Product DR2.3 Receive MRO Product DR3.3 Receive Excess Product
Blanket Purchase Orders Cover Period Requirements
None identified P2.4 Establish Sourcing Plans
Build Load in Stop Sequence Integrated inbound/outbound transportation planning (i.e. 1st truck destination loaded last, etc.).
D3.5 Build Loads D1.5 Plan & Build Loads D2.5 Plan & Build Loads D1.5 Build Loads D2.5 Build Loads
Build Subassemblies to Forecast at Highest Generic Level in Bill of Material; Maintain Flexibility While Minimizing Cycle Time and Inventory Position
None identified M3.2 Schedule Production Activities
Build Subassemblies/Products to Forecast at Highest Generic Level to Minimize Make Cycle Time
None identified M2 Make-to-Order
Business Intelligence (BI) A data warehouse / data mart is the source of all planning (master) data, business rules and transaction data. Analytical tools enable the ongoing maintenance and improvement of the business rules based on actual data.
P1.3 Balance Supply Chain Resources with Supply Chain Requirements
Business Rules Are Clearly Communicated with the Customer
Convenient availability to business rules and return criteria.
ER.2 Manage Performance of Return Processes
Capability to Run "Simulated" Full-Stream Supply/Demand Balancing for "What-If" Scenarios
Supply chain modeling and visualization system
P1 Plan Supply Chain EP.6 Manage Integrated Supply Chain Transportation
Capability to Run Multiple "Simulated" Full-Stream Supply/Demand Balancing Against Long-Term Capacity Plans and Scenarios
Supply Chain modeling capabilities, i.e. Advanced Planning Systems.
EP.5 Manage Integrated Supply Chain Capital Assets EP.4 Manage Integrated Supply Chain Inventory
Capability Transfer to Customer None identified S2.4 Transfer Product Capability Transfer to Organization None identified S1.4 Transfer Product
S3.6 Transfer Product Capacity and Supply Constraints Are Balanced Against Demand during the Planning Cycle
None identified P2.1 Identify, Prioritize, and Aggregate Product Requirements
Capacity and Supply Constraints Identified During MPS Schedule Process Are Balanced Against Demand during the Planning Cycle
None identified P2.2 Identify, Assess, And Aggregate Product Resources
Capture and Maintain Mode Specific Data
Transportation Management System (TMS) Maintenance Management
ES.6 Manage Incoming Product ED.6 Manage Transportation ER.6 Manage Return Transportation
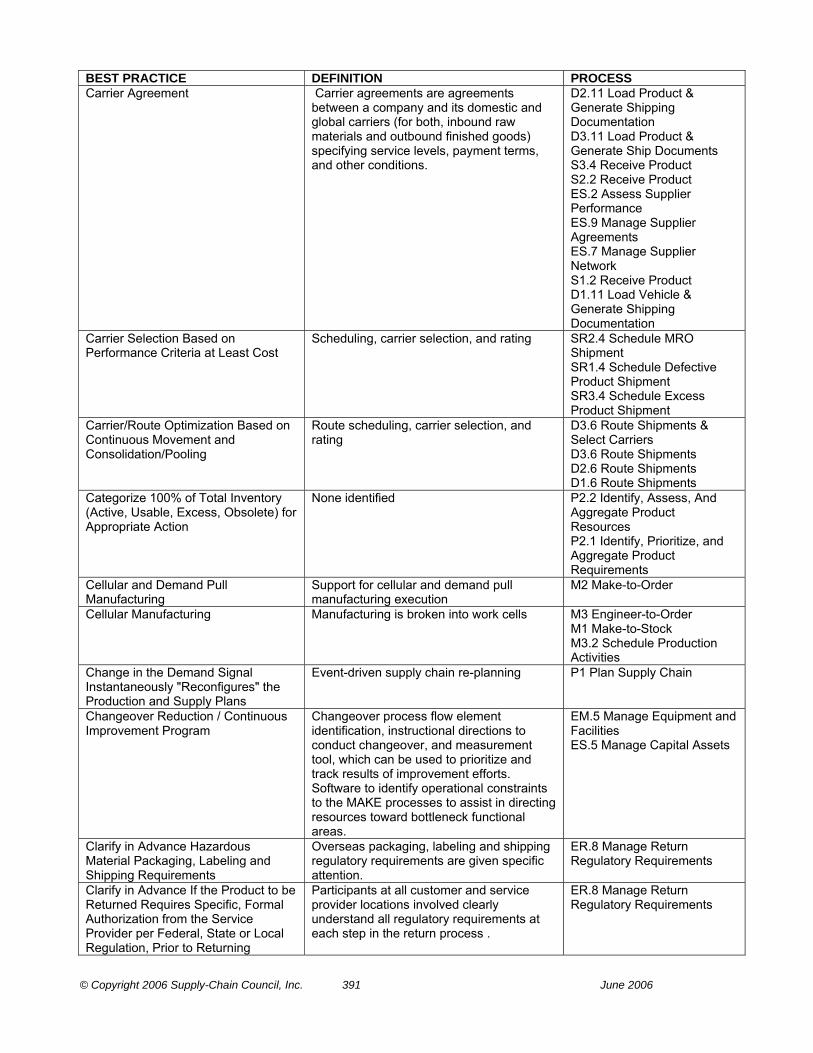
© Copyright 2006 Supply-Chain Council, Inc. 391 June 2006
BEST PRACTICE DEFINITION PROCESS Carrier Agreement Carrier agreements are agreements
between a company and its domestic and global carriers (for both, inbound raw materials and outbound finished goods) specifying service levels, payment terms, and other conditions.
D2.11 Load Product & Generate Shipping Documentation D3.11 Load Product & Generate Ship Documents S3.4 Receive Product S2.2 Receive Product ES.2 Assess Supplier Performance ES.9 Manage Supplier Agreements ES.7 Manage Supplier Network S1.2 Receive Product D1.11 Load Vehicle & Generate Shipping Documentation
Carrier Selection Based on Performance Criteria at Least Cost
Scheduling, carrier selection, and rating SR2.4 Schedule MRO Shipment SR1.4 Schedule Defective Product Shipment SR3.4 Schedule Excess Product Shipment
Carrier/Route Optimization Based on Continuous Movement and Consolidation/Pooling
Route scheduling, carrier selection, and rating
D3.6 Route Shipments & Select Carriers D3.6 Route Shipments D2.6 Route Shipments D1.6 Route Shipments
Categorize 100% of Total Inventory (Active, Usable, Excess, Obsolete) for Appropriate Action
None identified P2.2 Identify, Assess, And Aggregate Product Resources P2.1 Identify, Prioritize, and Aggregate Product Requirements
Cellular and Demand Pull Manufacturing
Support for cellular and demand pull manufacturing execution
M2 Make-to-Order
Cellular Manufacturing Manufacturing is broken into work cells M3 Engineer-to-Order M1 Make-to-Stock M3.2 Schedule Production Activities
Change in the Demand Signal Instantaneously "Reconfigures" the Production and Supply Plans
Event-driven supply chain re-planning P1 Plan Supply Chain
Changeover Reduction / Continuous Improvement Program
Changeover process flow element identification, instructional directions to conduct changeover, and measurement tool, which can be used to prioritize and track results of improvement efforts. Software to identify operational constraints to the MAKE processes to assist in directing resources toward bottleneck functional areas.
EM.5 Manage Equipment and Facilities ES.5 Manage Capital Assets
Clarify in Advance Hazardous Material Packaging, Labeling and Shipping Requirements
Overseas packaging, labeling and shipping regulatory requirements are given specific attention.
ER.8 Manage Return Regulatory Requirements
Clarify in Advance If the Product to be Returned Requires Specific, Formal Authorization from the Service Provider per Federal, State or Local Regulation, Prior to Returning
Participants at all customer and service provider locations involved clearly understand all regulatory requirements at each step in the return process .
ER.8 Manage Return Regulatory Requirements

© Copyright 2006 Supply-Chain Council, Inc. 392 June 2006
BEST PRACTICE DEFINITION PROCESS Clarify Point of Contact and Return Location
Electronic rules for business relationships and transactions.
SR1.3 Request Defective Return Authorization SR3.3 Request Excess Return Authorization
Collaboration among Operations Strategy Team
Supply Chain Advanced Planning Systems Supply Chain Integration Systems Integration between supply chain advanced planning and ERP execution systems Supply Chain Capacity Planning Systems
P1.4 Establish Supply Chain Plans P1.1 Identify, Prioritize, and Aggregate Supply Chain Requirements
Collaborative Planning, Forecasting, Replenishment (CPFR)
Collaborative Planning, Forecasting and Replenishment is a concept that allows collaborative processes across the supply chain, using a set of process and technology models.... (From www.cpfr.org/intro.html)
P1 Plan Supply Chain
Collaborative Planning/Scheduling Interactive, on-line planning/scheduling systems. Capacity planning systems with accurate production capability data.
EM.7 Manage Production Network
Collaborative Review and Agreement of Business Rules Prior to Contract Execution
Web based access to current spend data available from enterprise to part level
ES.1 Manage Sourcing Business Rules
Combine Consolidation Needs with Other Products/Divisions/Companies
None identified D1.4 Consolidate Orders
Communicate with Customer before the Return to Establish What Types of Returns Are Acceptable
None identified DR3.1 Authorize Excess Product Return DR1.1 Authorize Defective Product Return DR2.1 Authorize MRO Product Return
Comparative Analysis of Supplier Performance is Used in Sourcing Decisions
Software application with data analysis capability
ES.2 Assess Supplier Performance
Compare Local Customs Requirements to Your Process Procedures to Ensure All Requirements Are Accounted for Before Shipping
None Identified ER.8 Manage Return Regulatory Requirements
Complete Lot History Inventory by lot of sourced/in-process or discrete order /usage reporting by lot or discrete order
M1.2 Issue Product M1.2 Issue Material M2.2 Issue Sourced/In-Process Product
Comprehensive History of Customer Interactions Including Order History, Claims, Problems, Etc.
None identified ED.3 Manage Deliver Information
Concurrent Engineering is Used to Tightly Link Sourcing into the Product Development Process Make/Buy Decision Process (Outsourcing vs. In Sourcing)
None identified S3.1 Identify Sources of Supply
Confirm All Documentation and Inspection Requirements Before Shipping
None Identified ER.8 Manage Return Regulatory Requirements

© Copyright 2006 Supply-Chain Council, Inc. 393 June 2006
BEST PRACTICE DEFINITION PROCESS Confirm Asset Return Condition Codes Are Clearly Understood by All Employees, Especially Those Who Are New to the Process
None identified SR1.2 Disposition Defective Product
Confirm Changes in Condition Code Policies Are Promptly Communicated to All Employees and Supply-Chain Partners.
None identified SR1.2 Disposition Defective Product
Consideration of Supplier's Material Availability in Company's Supply Resources (Including Supplier's Production Plans & Capability, Inventory, and Delivery Plans)
Digital linkage to supplier quoting, planning, configuration and customer service applications
P3.1 Identify, Prioritize, and Aggregate Production Requirements
Consignment Agreements Are Used to Reduce Assets and Cycle Time While Increasing the Availability of Critical Items
Consignment inventory management S1.1 Schedule Product Deliveries S2.1 Schedule Product Deliveries S3.3 Schedule Product Deliveries
Consolidate Orders by Customer, Source, Traffic Lane, Carrier, Etc.
Integrated load planning and building with warehouse management
D2.4 Consolidate Orders D1.4 Consolidate Orders
Consolidate Shipments Through Cross Docking - Coordinate with Other Shipments
None Identified ER.6 Manage Return Transportation
Consolidation of Carriers Transportation modeling and rate analysis D3.6 Route Shipments & Select Carriers D3.6 Route Shipments D2.6 Route Shipments D1.6 Route Shipments
Consolidation of Inbound and Outbound Requirements
Integrated inbound/outbound transportation planning
D1.5 Plan & Build Loads D3.5 Plan & Build Loads and Shipments D2.5 Plan & Build Loads D1.5 Build Loads D3.5 Build Loads D2.5 Build Loads
Consolidation of Return Carriers Outbound logistics software to assist with route.
SR2.4 Schedule MRO Shipment SR1.4 Schedule Defective Product Shipment SR3.4 Schedule Excess Product Shipment
Continuous Improvement Historical trending, cause and effect analysis, and Key Performance Indicators Scheduling reviews of processes for possible improvements
EM.3 Manage MAKE Information
Continuous Improvement and Development is Driven and Measured through the Performance Review Process
None identified ES.2 Assess Supplier Performance
Continuous Improvement is Planned through Process Reviews and Customer Feedback
Avenue to receive customer comments. ER.2 Manage Performance of Return Processes
Continuous Replenishment Programs; Vendor Managed Inventory, Telemetry to Automatically Communicate Replenishment of Chemicals
Integrated demand/deployment planning to customer location driven by POS; Customer movement data
D2.2 Receive, Configure, Enter and Validate Order D1.2 Receive, Enter & Validate Order
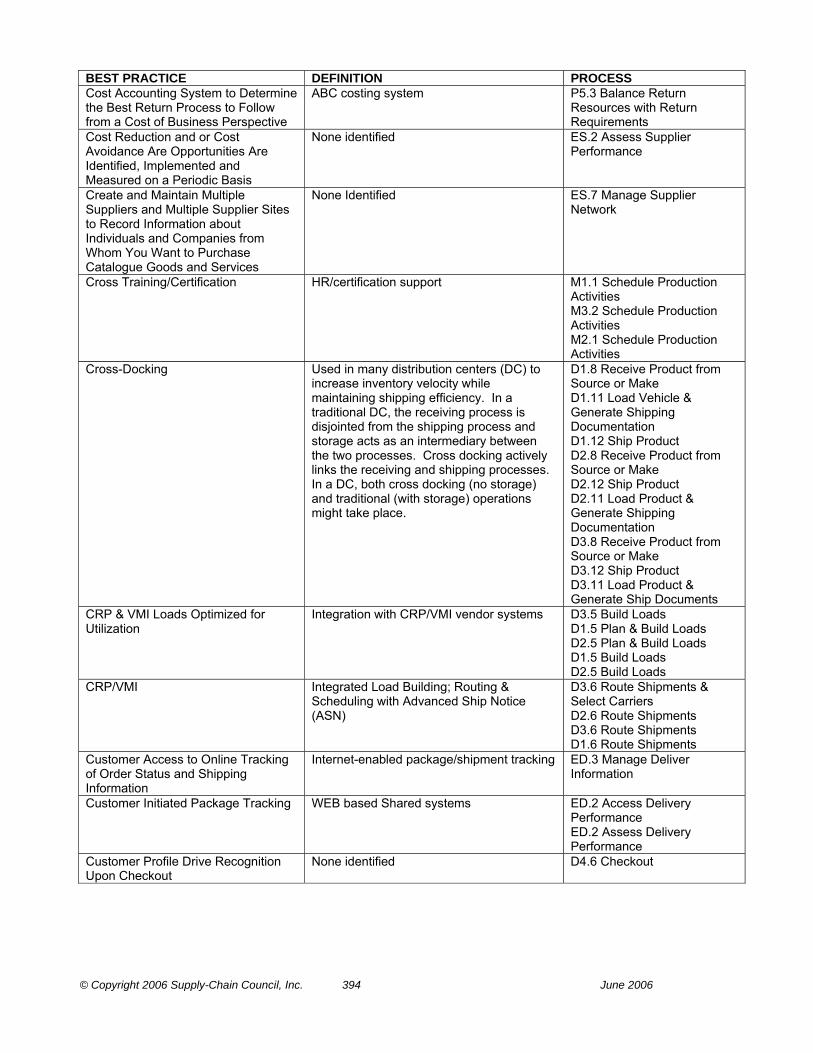
© Copyright 2006 Supply-Chain Council, Inc. 394 June 2006
BEST PRACTICE DEFINITION PROCESS Cost Accounting System to Determine the Best Return Process to Follow from a Cost of Business Perspective
ABC costing system P5.3 Balance Return Resources with Return Requirements
Cost Reduction and or Cost Avoidance Are Opportunities Are Identified, Implemented and Measured on a Periodic Basis
None identified ES.2 Assess Supplier Performance
Create and Maintain Multiple Suppliers and Multiple Supplier Sites to Record Information about Individuals and Companies from Whom You Want to Purchase Catalogue Goods and Services
None Identified ES.7 Manage Supplier Network
Cross Training/Certification HR/certification support M1.1 Schedule Production Activities M3.2 Schedule Production Activities M2.1 Schedule Production Activities
Cross-Docking Used in many distribution centers (DC) to increase inventory velocity while maintaining shipping efficiency. In a traditional DC, the receiving process is disjointed from the shipping process and storage acts as an intermediary between the two processes. Cross docking actively links the receiving and shipping processes. In a DC, both cross docking (no storage) and traditional (with storage) operations might take place.
D1.8 Receive Product from Source or Make D1.11 Load Vehicle & Generate Shipping Documentation D1.12 Ship Product D2.8 Receive Product from Source or Make D2.12 Ship Product D2.11 Load Product & Generate Shipping Documentation D3.8 Receive Product from Source or Make D3.12 Ship Product D3.11 Load Product & Generate Ship Documents
CRP & VMI Loads Optimized for Utilization
Integration with CRP/VMI vendor systems D3.5 Build Loads D1.5 Plan & Build Loads D2.5 Plan & Build Loads D1.5 Build Loads D2.5 Build Loads
CRP/VMI Integrated Load Building; Routing & Scheduling with Advanced Ship Notice (ASN)
D3.6 Route Shipments & Select Carriers D2.6 Route Shipments D3.6 Route Shipments D1.6 Route Shipments
Customer Access to Online Tracking of Order Status and Shipping Information
Internet-enabled package/shipment tracking ED.3 Manage Deliver Information
Customer Initiated Package Tracking WEB based Shared systems ED.2 Access Delivery Performance ED.2 Assess Delivery Performance
Customer Profile Drive Recognition Upon Checkout
None identified D4.6 Checkout

© Copyright 2006 Supply-Chain Council, Inc. 395 June 2006
BEST PRACTICE DEFINITION PROCESS Customer Relationship and Digital Linkages (XML, EDI, Etc.) Provide Accurate Visibility into Actual Demand via Customer Forecasts, Product Plans, Production Plans, and Inventory Positions
Tightly integrated supply chain or demand planning with point of sale and customer inventory systems
P4.1 Identify, Prioritize, and Aggregate Delivery Requirements
Customer Relationship Management (CRM)
Software that provides customer input and keeps the customer informed about the planning of the production and delivery process by managing all contacts and communication with the customer thorough all channels including internet and traditional sales and customer service channels.
P1.3 Balance Supply Chain Resources with Supply Chain Requirements
Customer Sends Receiving Advanced Shipment Notification Prior to Shipment
Electronically link Return authorization, Return schedule and shipping documents. .
DR3.3 Receive Excess Product DR1.3 Receive Defective Product DR2.3 Receive MRO Product
Customer Service Data Validation Including Geo-Coding
None identified ED.3 Manage Deliver Information
Data Accessibility across the Enterprise for Visibility by Discrete Business Units
Web based access to various levels of enterprise data
ES.3 Maintain Source Data ER.3 Manage Return Data Collection
Defective Products Scheduling Identifies Next Destination (Source, Make, or Deliver) on Return Authorization
Utilize electronic links DR1.4 Transfer Defective Product
Defined Stocking Levels and Criteria None identified D4.3 Pick Product from Backroom
Deliveries Are Balanced Throughout Each Working Day and Throughout the Week
None identified S3.5 Verify Product S3.4 Receive Product S2.3 Verify Product S1.2 Receive Product S2.2 Receive Product S1.3 Verify Product
Delivery Schedules Are Collaboratively Developed with Customers
Web-based access to plant scheduling status, collaborative data-sharing environment.
M2 Make-to-Order M3 Engineer-to-Order
Demand Planning, Demand Flow Leadership
Software that provides multiple data models including the business rules and metrics for the entire supply chain planning process. Algorithms use the business rules and metrics as the drivers for the planning engine.
P1.3 Balance Supply Chain Resources with Supply Chain Requirements
Demand Priorities Reflecting Strategic Customer Relationships as Business Policies Are Automatically Followed in Allocating Resources; First-In-First-Out (FIFO) is Utilized as the Default Scheduling Priority
Rules-based distribution planning system Trading partner agreements
P4.3 Balance Delivery Resources and Capabilities with Delivery Requirements
Demand Pull Mechanisms Repetitive scheduling and sequencing M2.1 Schedule Production Activities M3.2 Schedule Production Activities

© Copyright 2006 Supply-Chain Council, Inc. 396 June 2006
BEST PRACTICE DEFINITION PROCESS Demand-Pull Manufacturing, Including Active Reduction of Manufacturing Systems Time and WIP Through the Use of Demand-Pull Mechanisms and Visual Controls
Support of demand-pull mechanisms (Kanban, replenishment signals, etc.) based on rate schedules and user-defined minimum/maximum trigger points
M1.1 Schedule Production Activities M3 Engineer-to-Order M1 Make-to-Stock M2.1 Schedule Production Activities
Demand-Pull Mechanisms; Kanban Replenishment Signals from Stockroom, Intermediate Products, or Subassembly Area
None identified M1.2 Issue Product M1.2 Issue Material M2.2 Issue Sourced/In-Process Product M3.3 Issue Sourced/In-Process Product
Design For Production Table of manufacturing capacities or design envelops (capacities; envelop sizes; tank, vessel or batch sizes)
EM.1 Manage Production Rules
Design/Upgrade Production Equipment to Maximize Flexibility and Avoid Line Stoppages
Machine productivity and downtime monitoring
M3.4 Produce and Test
Develop and Clarify Mutually Understood Cycle Times to Process Return Authorizations
Clarification as to who will pay in-bound and out-bound freight cost.
SR1.3 Request Defective Return Authorization SR3.3 Request Excess Return Authorization
Develop Local Receiving Process Close to Repair
Minimize time spent in product movement. DR3.3 Receive Excess Product DR1.3 Receive Defective Product DR2.3 Receive MRO Product
Develop Proactive Transit Damage Programs
None Identified ER.6 Manage Return Transportation
Digital Linkage (EDI, XML, Etc.) is Used to Provide Real-Time Demand Information and Handle Routine Transactions
None identified P2.4 Establish Sourcing Plans
Digital Links (XML Based, EDI. Etc.) Among Supply Chain Members
Real-time exchange of supply chain information between supply chain members collaborative planning systems, Internet Trading Exchanges, B2B Integration and Application Server Systems
P1.2 Identify, Assess, And Aggregate Supply Chain Resources P1.4 Establish Supply Chain Plans P1.1 Identify, Prioritize, and Aggregate Supply Chain Requirements P1.2 Identify, Assess, and Aggregate Supply Chain Resources
Direct Connection to Customs Clearance
Electronic documentation submission via EDI and/or internet.
ED.8 Manage Import/Export Requirements ES.8 Manage Import/Export Requirements
Direct Ship from Factory to Customer/Channel
Share production status with customers and transportation providers via web-based tools. Auto-Tendering for direct ship utilizing EDI/XML protocols.
M3.6 Stage Product M2.5 Stage Product M3.6 Stage Finished Product M1.5 Stage Product M2.5 Stage Finished Product
Direct Transfer of Documents to Recipient and Forwarder Direct Transfer of Documents to Recipient and Forwarder
Electronic documentation submission via EDI and/or internet.
ED.8 Manage Import/Export Requirements ES.8 Manage Import/Export Requirements

© Copyright 2006 Supply-Chain Council, Inc. 397 June 2006
BEST PRACTICE DEFINITION PROCESS Distinct and Consistent Linkages Exist to Ensure Disruptions and Opportunities in Material Resources Are Quickly and Accurately Communicated and Acted Upon
Bi-directional Digital Links (XML, EDI, etc) or Internet procurement networks to customer service linkage
P2 Plan Source P4 Plan Deliver
Distinct and Consistent Linkages Exist to Ensure that Disruptions and Opportunities in Production Are Quickly and Accurately Communicated and Responses Made
Multi-plant supply/demand planning and execution
P3 Plan Make
Document Control Control who can create, revise and access information
EM.1 Manage Production Rules
Documents Generated Automatically During Shipment Preparation.
Electronic documentation submission via EDI and/or internet.
ED.8 Manage Import/Export Requirements ES.8 Manage Import/Export Requirements
Download P.O. & Advanced Ship Notices for Automated Receiving and Put Away
Integration with Procurement Systems & Electronic Commerce with Vendors
D2.8 Receive Product from Source or Make D3.8 Receive Product from Source or Make D1.8 Receive Product at Warehouse D1.8 Receive Product from Source or Make
Drive Deliveries Directly to Stock or Point-Of-Use in Manufacturing to Reduce Costs and Cycle Time
Pay on receipt Specify delivery location and time (to the minute) Specify delivery sequence
S2.4 Transfer Product S1.4 Transfer Product S3.6 Transfer Product
Drive Returns Directly to Return Stock Point of Disposition to Reduce Cost and Cycle Time
Specify return disposition location and time. SR1.2 Disposition Defective Product SR3.2 Disposition Excess Product
Drum-Buffer-Rope Scheduling Technique
(DBR, also referred to as Synchronous Manufacturing or Constraint Management) A technique used to manage resources to maximize throughput.
M1.1 Schedule Production Activities M2.1 Schedule Production Activities M3.2 Schedule Production Activities
Dunnage Control System data field to specify where the part / product shipping container should be removed. Best practice is to remove the dunnage as soon as possible unless part / product damage will result. Reuse of intermediate WIP containers for finished goods.
EM.4 Manage In-Process Products (WIP)
Dynamic Deployment Based on Constraint Based Planning and Optimal Scheduling
Advanced planning and scheduling logic with constraint, cost, and resource optimization
D2.3 Reserve Resources & Determine Delivery Date
Dynamic Location Assignment Including Lot Control, Zoned Picking, Quality Assurance
Real time inventory control, stock locator, and rules based picking logic
D2.8 Receive Product from Source or Make D2.8 Pick Staged Product D3.7 Pick Staged Product D1.9 Pick Product D2.9 Pick Product D3.9 Pick Product

© Copyright 2006 Supply-Chain Council, Inc. 398 June 2006
BEST PRACTICE DEFINITION PROCESS Dynamic Location Assignment Including Lot Control, Zoned Put Away, Quality Assurance, ABC Frequency of Access
Real time inventory control, stock locator, and rules based put away logic
D3.8 Receive Product from Source or Make D1.8 Receive Product at Warehouse D1.8 Receive Product from Source or Make
Dynamic Return Restocking Management
Dynamic prioritization of restocking plans in order to rapidly re-sell products that are in demand thus reducing new inventory demand.
P5.3 Balance Return Resources with Return Requirements
Dynamic Simulation of Picking Requirements Optimized for Labor, Cost, and Time
Rules based picking logic and simulation D3.7 Pick Staged Product D2.8 Pick Staged Product D1.9 Pick Product D3.9 Pick Product D2.9 Pick Product
EDI Links between Manufacturing and Distributor to Achieve Visibility of Complete Finished Goods Inventory and Expected Shipments
None identified D1.3 Reserve Inventory & Determine Delivery Date
EDI Links Integrate Supplier Resource Information (Inventory, Capacity Availability, Etc.) with Own Resources
Inter-company resource planning with EDI/Internet communication
P2 Plan Source
Efficient and Effective Benchmarking Process Leveraging Cross Industry Metrics and Definitions
None identified EP.2 Manage Performance of Supply Chain
Efficient Consumer Response (ECR); Quick Response
Demand Planning, Deployment, Scheduling D1 Deliver Stocked Product
Electronic Catalogues/Malls None identified D1 Deliver Stocked Product Electronic Commerce (Customer Visibility of Stock Availability, Use of Hand-Held Terminals for Direct Order Entry, Confirmation, Credit Approval), On-Line Stock Check and Reservation of Inventory
EDI applications and integrated order management
D2.2 Receive, Configure, Enter and Validate Order D1.2 Receive, Enter & Validate Order
Electronic Data Interchange Can Be Used To Send Rfqs and Technical Information to and from Potential Suppliers to Determine Supplier Capability to Fulfill Requirements So that They May Be Added to Supplier Network
Electronic Data Interchange ES.7 Manage Supplier Network S3.2 Select Final Supplier(s) and Negotiate
Electronic Data Interchange is Used to Send Technical Information to and from Potential Suppliers
None identified S3.1 Identify Sources of Supply
Electronic Documentation and Imaging
Graphical display of drawings, diagrams, recipes/formulas, specifications, instructions, etc., to all users
EM.1 Manage Production Rules
Electronic Generation and Download of Shipping Documents
None identified D2.11 Load Product & Generate Shipping Documentation D3.11 Load Product & Generate Ship Documents D1.11 Load Vehicle & Generate Shipping Documentation

© Copyright 2006 Supply-Chain Council, Inc. 399 June 2006
BEST PRACTICE DEFINITION PROCESS Electronic Manifest and Electronic Billing
Transportation Management System (TMS) Maintenance Management
ES.6 Manage Incoming Product ED.6 Manage Transportation ER.6 Manage Return Transportation
Electronic Matching Between POS Data and Store Inventory (Shelves and Back Room)
Integrated Software Systems P4.1 Identify, Prioritize, and Aggregate Delivery Requirements
Electronic Material Move Transactions
Automated process control and/or barcode data collection
M1.2 Issue Product M3.6 Stage Product M2.5 Stage Product M1.2 Issue Material M3.6 Stage Finished Product M2.5 Stage Finished Product M3.3 Issue Sourced/In-Process Product M2.2 Issue Sourced/In-Process Product M1.5 Stage Product
Electronic Reminders of Possible Scheduled Maintenance
Pull signals. ER.1 Manage Business Rules for Return Processes
Electronic Sourcing and Negotiation Business Rules for electronic sourcing process and hierarchy
ES.1 Manage Sourcing Business Rules ES.9 Manage Supplier Agreements
Electronic Transfer of Shipment Information to Finance
None identified D3.11 Invoice & Receive Payment D1.13, Invoice & Receive Payment D2.12 Invoice & Receive Payment D3.15 Invoice D2.15 Invoice D1.15 Invoice
Electronically Track Shipment from Customer to Service Provider
None Identified DR3.3 Receive Excess Product DR1.3 Receive Defective Product DR2.3 Receive MRO Product
Eliminate "Special Deals" Sales to Reduce Returns and Improve Forecast Accuracy (Reduces Uncertainty, Lowers Safety Stock Requirements, Cheaper to Administer)
None identified P4.1 Identify, Prioritize, and Aggregate Delivery Requirements
Enable Customer-Service Representatives to Complete the Bill Of Lading for the Customer Including Carrier Routing, Weight, Description and Class to Minimize Guesswork & Wrong Estimates
Clarification of policy if authorizations are not processed within the expected cycle time.
SR1.3 Request Defective Return Authorization SR3.3 Request Excess Return Authorization
Enable Real-Time Visibility into Backlog, Order Status, Shipments, Scheduled Material Receipts, Customer Credit History, and Current Inventory Positions
None identified D2.2 Receive, Configure, Enter and Validate Order D1.2 Receive, Enter & Validate Order
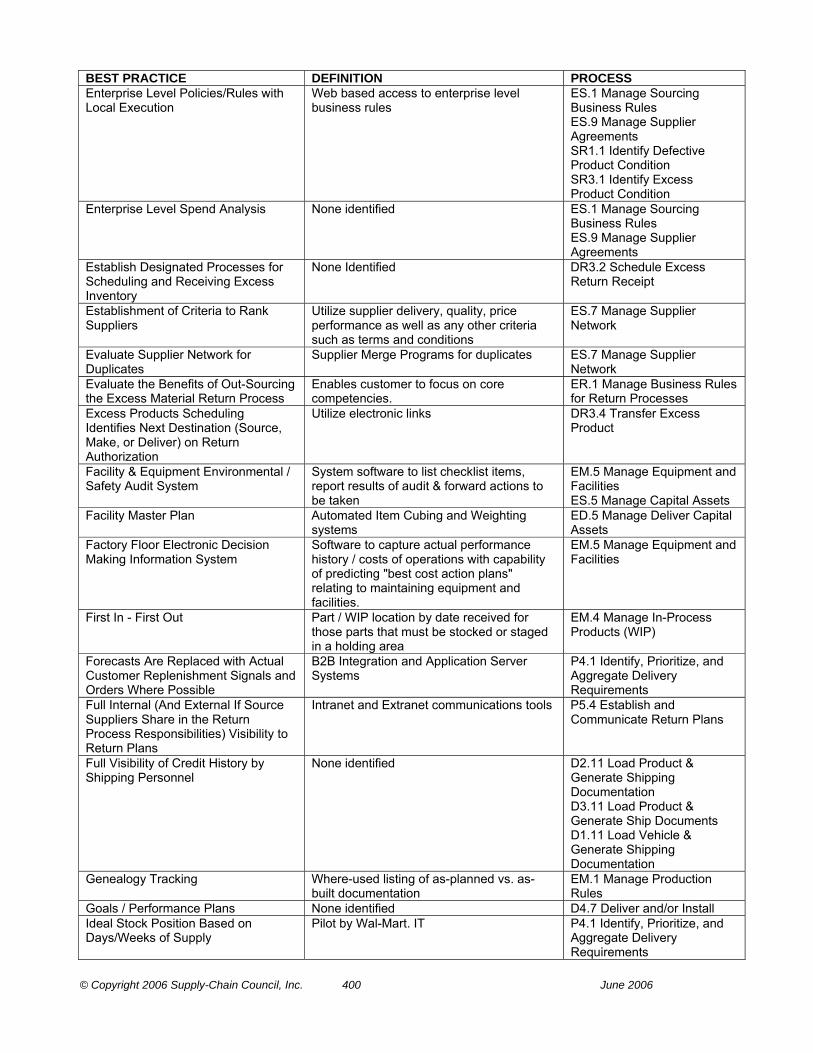
© Copyright 2006 Supply-Chain Council, Inc. 400 June 2006
BEST PRACTICE DEFINITION PROCESS Enterprise Level Policies/Rules with Local Execution
Web based access to enterprise level business rules
ES.1 Manage Sourcing Business Rules ES.9 Manage Supplier Agreements SR1.1 Identify Defective Product Condition SR3.1 Identify Excess Product Condition
Enterprise Level Spend Analysis None identified ES.1 Manage Sourcing Business Rules ES.9 Manage Supplier Agreements
Establish Designated Processes for Scheduling and Receiving Excess Inventory
None Identified DR3.2 Schedule Excess Return Receipt
Establishment of Criteria to Rank Suppliers
Utilize supplier delivery, quality, price performance as well as any other criteria such as terms and conditions
ES.7 Manage Supplier Network
Evaluate Supplier Network for Duplicates
Supplier Merge Programs for duplicates ES.7 Manage Supplier Network
Evaluate the Benefits of Out-Sourcing the Excess Material Return Process
Enables customer to focus on core competencies.
ER.1 Manage Business Rules for Return Processes
Excess Products Scheduling Identifies Next Destination (Source, Make, or Deliver) on Return Authorization
Utilize electronic links DR3.4 Transfer Excess Product
Facility & Equipment Environmental / Safety Audit System
System software to list checklist items, report results of audit & forward actions to be taken
EM.5 Manage Equipment and Facilities ES.5 Manage Capital Assets
Facility Master Plan Automated Item Cubing and Weighting systems
ED.5 Manage Deliver Capital Assets
Factory Floor Electronic Decision Making Information System
Software to capture actual performance history / costs of operations with capability of predicting "best cost action plans" relating to maintaining equipment and facilities.
EM.5 Manage Equipment and Facilities
First In - First Out Part / WIP location by date received for those parts that must be stocked or staged in a holding area
EM.4 Manage In-Process Products (WIP)
Forecasts Are Replaced with Actual Customer Replenishment Signals and Orders Where Possible
B2B Integration and Application Server Systems
P4.1 Identify, Prioritize, and Aggregate Delivery Requirements
Full Internal (And External If Source Suppliers Share in the Return Process Responsibilities) Visibility to Return Plans
Intranet and Extranet communications tools P5.4 Establish and Communicate Return Plans
Full Visibility of Credit History by Shipping Personnel
None identified D2.11 Load Product & Generate Shipping Documentation D3.11 Load Product & Generate Ship Documents D1.11 Load Vehicle & Generate Shipping Documentation
Genealogy Tracking Where-used listing of as-planned vs. as-built documentation
EM.1 Manage Production Rules
Goals / Performance Plans None identified D4.7 Deliver and/or Install Ideal Stock Position Based on Days/Weeks of Supply
Pilot by Wal-Mart. IT P4.1 Identify, Prioritize, and Aggregate Delivery Requirements

© Copyright 2006 Supply-Chain Council, Inc. 401 June 2006
BEST PRACTICE DEFINITION PROCESS Identification of Suppliers Who Will Participate in Consignment Inventory Programs
Consignment Inventory Management ES.7 Manage Supplier Network
Identification of Suppliers Who Will Participate in Kanban Programs
Electronic Kanban Support ES.7 Manage Supplier Network
Identification of Suppliers Who Will Participate in Procurement Split (Two or More Suppliers Sharing Purchase Requirements) Programs
None identified ES.7 Manage Supplier Network
Identification of Suppliers Who Will Participate in Vendor Managed Inventory (VMI) Programs
Supplier managed inventories with scheduling interfaces to external supplier systems to replenish
ES.7 Manage Supplier Network
Implement Employee Involvement Programs
None Identified M2 Make-to-Order M1 Make-to-Stock M3.4 Produce and Test
Incorporates leading practices such as Efficient Consumer Response, Collaborative Planning, Forecasting, and Replenishment, Vendor Managed Inventory, and real time point of consumption reporting.
None Identified EP.7 Manage Planning Configuration
In-Process Product (WIP) Handling Rules
Tracking, genealogy EM.4 Manage In-Process Products (WIP)
Integrate Return Planning with Maintenance and Inventory Planning to Optimize the System
Both customer and Service Provider departments are alerted at the same time and viewing the same information.
DR1.2 Schedule Defective Return Receipt DR2.2 Schedule MRO Return Receipt
Integrated Business and Supply-Chain Planning Processes Where Cross-Functional Input is Leveraged to Set Business Rules
Supply Chain performance dashboard capability.
EP.1 Manage Business Rules for PLAN Processes
Integrated Credit Checking Interface to supplier's shipping system to financials
D2.11 Load Product & Generate Shipping Documentation D1.11 Load Vehicle & Generate Shipping Documentation D3.11 Load Product & Generate Ship Documents
Integrated Demand and Supply Planning - Demand Planning, Supply Planning and especially the Supply Plan Execution Are no longer disconnected. All required planning and execution data is integrated and shared in between all functional areas within an organization.
Memory based planning systems provide one single data model and data mart (including the business rules) for the entire supply chain planning and execution process. Algorithms use the business rules as the driver for the planning engine.
EP.3 Manage PLAN Data Collection
Integrated Edit at Order Entry Time Customer Master Record ED.1 Manage Deliver Business Rules
Integrated Facility Management None identified ED.7 Manage Product Life Cycle
Integrated Order Management, Warehouse Management, and Transportation Management Systems View for analysis for all orders and shipments the following data: Logistics, Product, Cost, GL Charging
Transportation Management System (TMS) Maintenance Management
ES.6 Manage Incoming Product ED.6 Manage Transportation ER.6 Manage Return Transportation
Integrated Transportation Visibility - Advanced shipping notices - Real time shipping tracking
ER.5 Manage Return Capital Assets
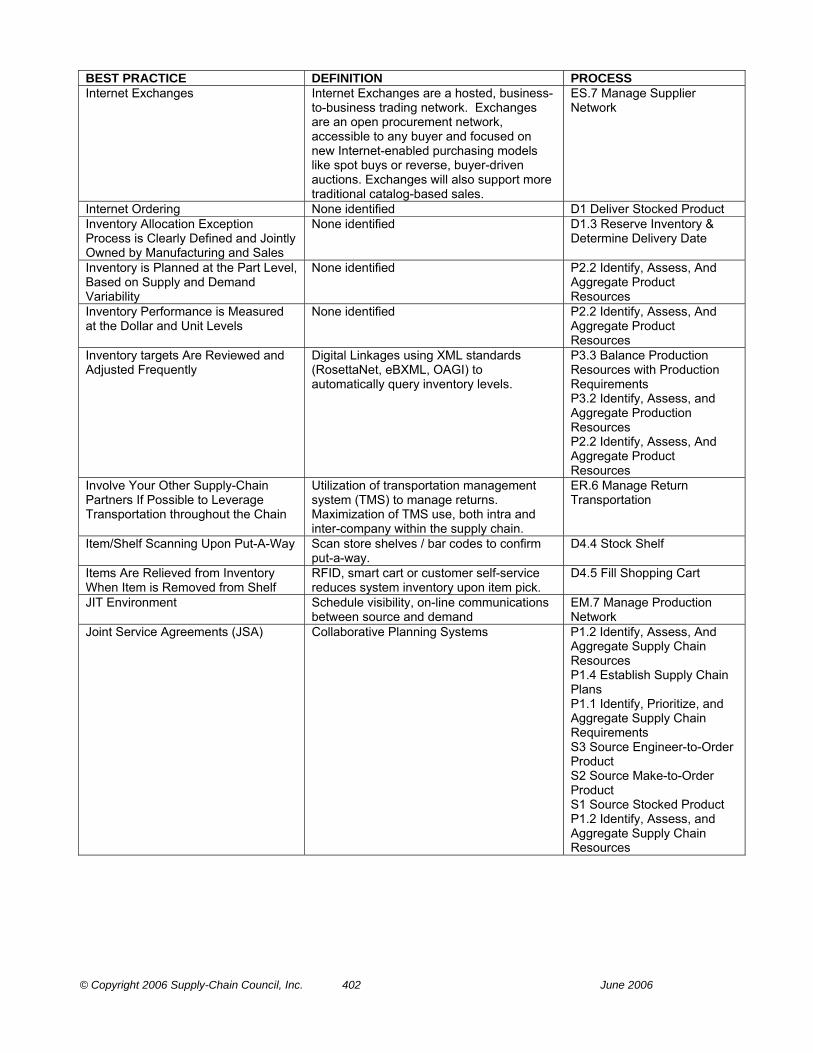
© Copyright 2006 Supply-Chain Council, Inc. 402 June 2006
BEST PRACTICE DEFINITION PROCESS Internet Exchanges Internet Exchanges are a hosted, business-
to-business trading network. Exchanges are an open procurement network, accessible to any buyer and focused on new Internet-enabled purchasing models like spot buys or reverse, buyer-driven auctions. Exchanges will also support more traditional catalog-based sales.
ES.7 Manage Supplier Network
Internet Ordering None identified D1 Deliver Stocked Product Inventory Allocation Exception Process is Clearly Defined and Jointly Owned by Manufacturing and Sales
None identified D1.3 Reserve Inventory & Determine Delivery Date
Inventory is Planned at the Part Level, Based on Supply and Demand Variability
None identified P2.2 Identify, Assess, And Aggregate Product Resources
Inventory Performance is Measured at the Dollar and Unit Levels
None identified P2.2 Identify, Assess, And Aggregate Product Resources
Inventory targets Are Reviewed and Adjusted Frequently
Digital Linkages using XML standards (RosettaNet, eBXML, OAGI) to automatically query inventory levels.
P3.3 Balance Production Resources with Production Requirements P3.2 Identify, Assess, and Aggregate Production Resources P2.2 Identify, Assess, And Aggregate Product Resources
Involve Your Other Supply-Chain Partners If Possible to Leverage Transportation throughout the Chain
Utilization of transportation management system (TMS) to manage returns. Maximization of TMS use, both intra and inter-company within the supply chain.
ER.6 Manage Return Transportation
Item/Shelf Scanning Upon Put-A-Way Scan store shelves / bar codes to confirm put-a-way.
D4.4 Stock Shelf
Items Are Relieved from Inventory When Item is Removed from Shelf
RFID, smart cart or customer self-service reduces system inventory upon item pick.
D4.5 Fill Shopping Cart
JIT Environment Schedule visibility, on-line communications between source and demand
EM.7 Manage Production Network
Joint Service Agreements (JSA) Collaborative Planning Systems P1.2 Identify, Assess, And Aggregate Supply Chain Resources P1.4 Establish Supply Chain Plans P1.1 Identify, Prioritize, and Aggregate Supply Chain Requirements S3 Source Engineer-to-Order Product S2 Source Make-to-Order Product S1 Source Stocked Product P1.2 Identify, Assess, and Aggregate Supply Chain Resources
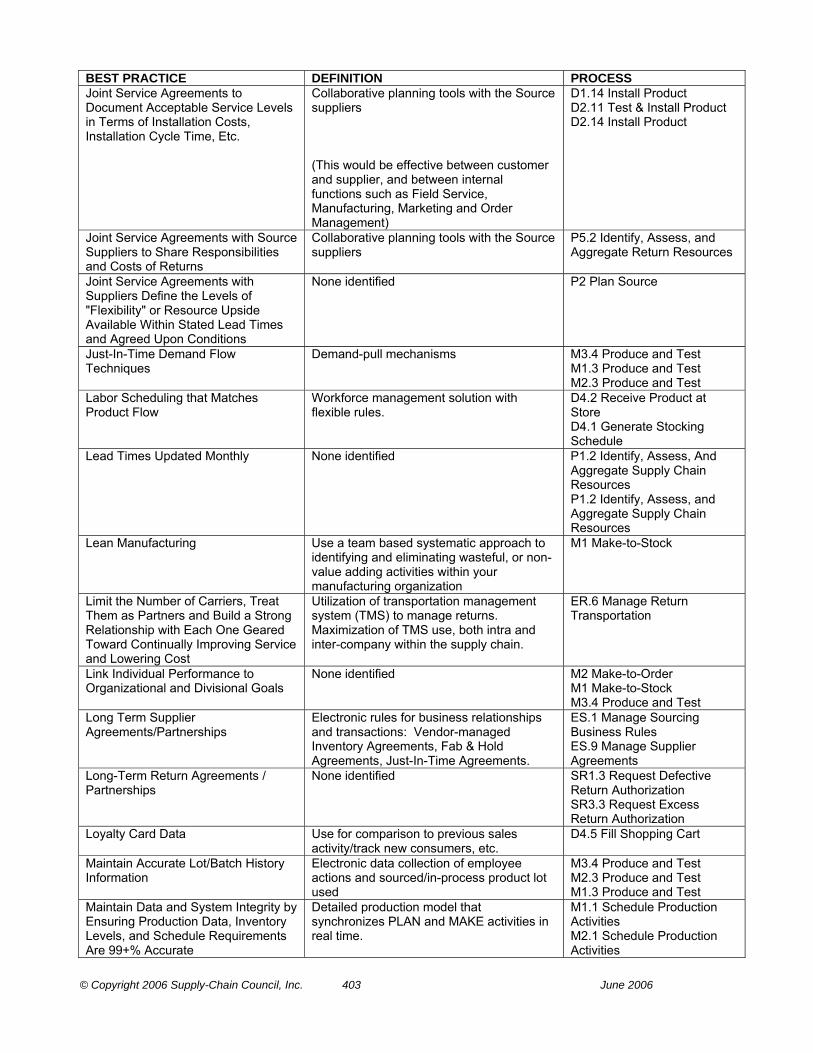
© Copyright 2006 Supply-Chain Council, Inc. 403 June 2006
BEST PRACTICE DEFINITION PROCESS Joint Service Agreements to Document Acceptable Service Levels in Terms of Installation Costs, Installation Cycle Time, Etc.
Collaborative planning tools with the Source suppliers (This would be effective between customer and supplier, and between internal functions such as Field Service, Manufacturing, Marketing and Order Management)
D1.14 Install Product D2.11 Test & Install Product D2.14 Install Product
Joint Service Agreements with Source Suppliers to Share Responsibilities and Costs of Returns
Collaborative planning tools with the Source suppliers
P5.2 Identify, Assess, and Aggregate Return Resources
Joint Service Agreements with Suppliers Define the Levels of "Flexibility" or Resource Upside Available Within Stated Lead Times and Agreed Upon Conditions
None identified P2 Plan Source
Just-In-Time Demand Flow Techniques
Demand-pull mechanisms M3.4 Produce and Test M1.3 Produce and Test M2.3 Produce and Test
Labor Scheduling that Matches Product Flow
Workforce management solution with flexible rules.
D4.2 Receive Product at Store D4.1 Generate Stocking Schedule
Lead Times Updated Monthly None identified P1.2 Identify, Assess, And Aggregate Supply Chain Resources P1.2 Identify, Assess, and Aggregate Supply Chain Resources
Lean Manufacturing Use a team based systematic approach to identifying and eliminating wasteful, or non-value adding activities within your manufacturing organization
M1 Make-to-Stock
Limit the Number of Carriers, Treat Them as Partners and Build a Strong Relationship with Each One Geared Toward Continually Improving Service and Lowering Cost
Utilization of transportation management system (TMS) to manage returns. Maximization of TMS use, both intra and inter-company within the supply chain.
ER.6 Manage Return Transportation
Link Individual Performance to Organizational and Divisional Goals
None identified M2 Make-to-Order M1 Make-to-Stock M3.4 Produce and Test
Long Term Supplier Agreements/Partnerships
Electronic rules for business relationships and transactions: Vendor-managed Inventory Agreements, Fab & Hold Agreements, Just-In-Time Agreements.
ES.1 Manage Sourcing Business Rules ES.9 Manage Supplier Agreements
Long-Term Return Agreements / Partnerships
None identified SR1.3 Request Defective Return Authorization SR3.3 Request Excess Return Authorization
Loyalty Card Data Use for comparison to previous sales activity/track new consumers, etc.
D4.5 Fill Shopping Cart
Maintain Accurate Lot/Batch History Information
Electronic data collection of employee actions and sourced/in-process product lot used
M3.4 Produce and Test M2.3 Produce and Test M1.3 Produce and Test
Maintain Data and System Integrity by Ensuring Production Data, Inventory Levels, and Schedule Requirements Are 99+% Accurate
Detailed production model that synchronizes PLAN and MAKE activities in real time.
M1.1 Schedule Production Activities M2.1 Schedule Production Activities
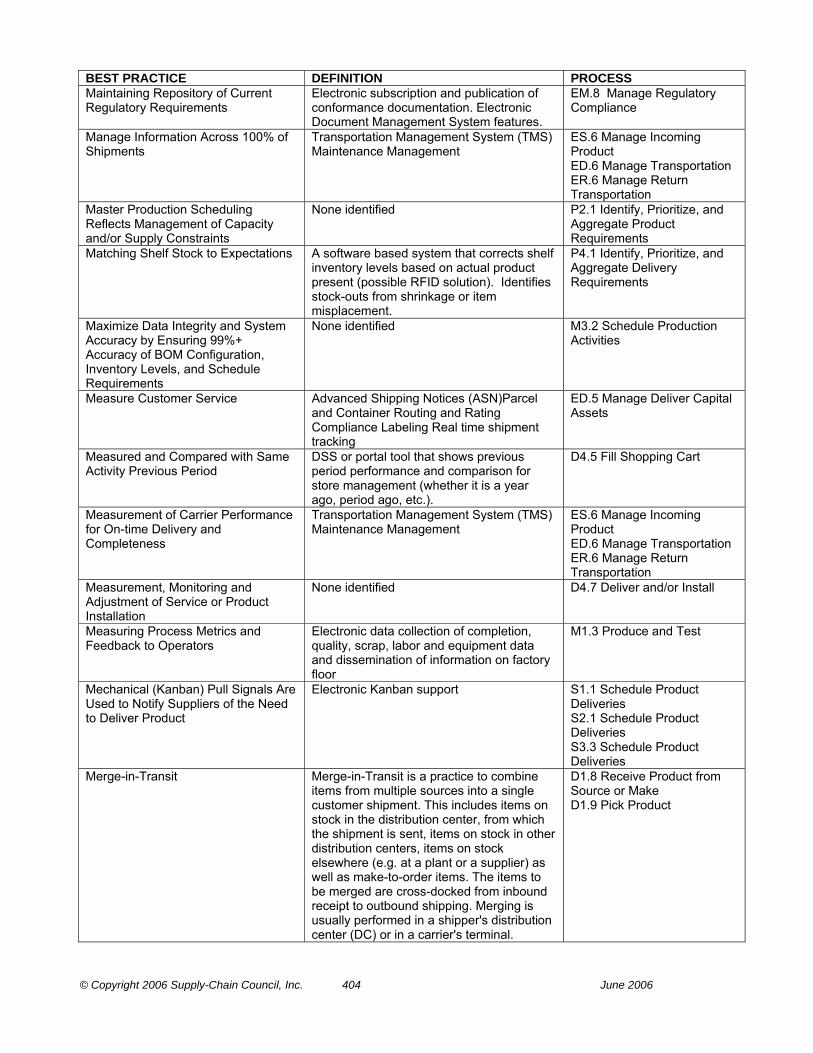
© Copyright 2006 Supply-Chain Council, Inc. 404 June 2006
BEST PRACTICE DEFINITION PROCESS Maintaining Repository of Current Regulatory Requirements
Electronic subscription and publication of conformance documentation. Electronic Document Management System features.
EM.8 Manage Regulatory Compliance
Manage Information Across 100% of Shipments
Transportation Management System (TMS) Maintenance Management
ES.6 Manage Incoming Product ED.6 Manage Transportation ER.6 Manage Return Transportation
Master Production Scheduling Reflects Management of Capacity and/or Supply Constraints
None identified P2.1 Identify, Prioritize, and Aggregate Product Requirements
Matching Shelf Stock to Expectations A software based system that corrects shelf inventory levels based on actual product present (possible RFID solution). Identifies stock-outs from shrinkage or item misplacement.
P4.1 Identify, Prioritize, and Aggregate Delivery Requirements
Maximize Data Integrity and System Accuracy by Ensuring 99%+ Accuracy of BOM Configuration, Inventory Levels, and Schedule Requirements
None identified M3.2 Schedule Production Activities
Measure Customer Service Advanced Shipping Notices (ASN)Parcel and Container Routing and Rating Compliance Labeling Real time shipment tracking
ED.5 Manage Deliver Capital Assets
Measured and Compared with Same Activity Previous Period
DSS or portal tool that shows previous period performance and comparison for store management (whether it is a year ago, period ago, etc.).
D4.5 Fill Shopping Cart
Measurement of Carrier Performance for On-time Delivery and Completeness
Transportation Management System (TMS) Maintenance Management
ES.6 Manage Incoming Product ED.6 Manage Transportation ER.6 Manage Return Transportation
Measurement, Monitoring and Adjustment of Service or Product Installation
None identified D4.7 Deliver and/or Install
Measuring Process Metrics and Feedback to Operators
Electronic data collection of completion, quality, scrap, labor and equipment data and dissemination of information on factory floor
M1.3 Produce and Test
Mechanical (Kanban) Pull Signals Are Used to Notify Suppliers of the Need to Deliver Product
Electronic Kanban support S1.1 Schedule Product Deliveries S2.1 Schedule Product Deliveries S3.3 Schedule Product Deliveries
Merge-in-Transit Merge-in-Transit is a practice to combine items from multiple sources into a single customer shipment. This includes items on stock in the distribution center, from which the shipment is sent, items on stock in other distribution centers, items on stock elsewhere (e.g. at a plant or a supplier) as well as make-to-order items. The items to be merged are cross-docked from inbound receipt to outbound shipping. Merging is usually performed in a shipper's distribution center (DC) or in a carrier's terminal.
D1.8 Receive Product from Source or Make D1.9 Pick Product
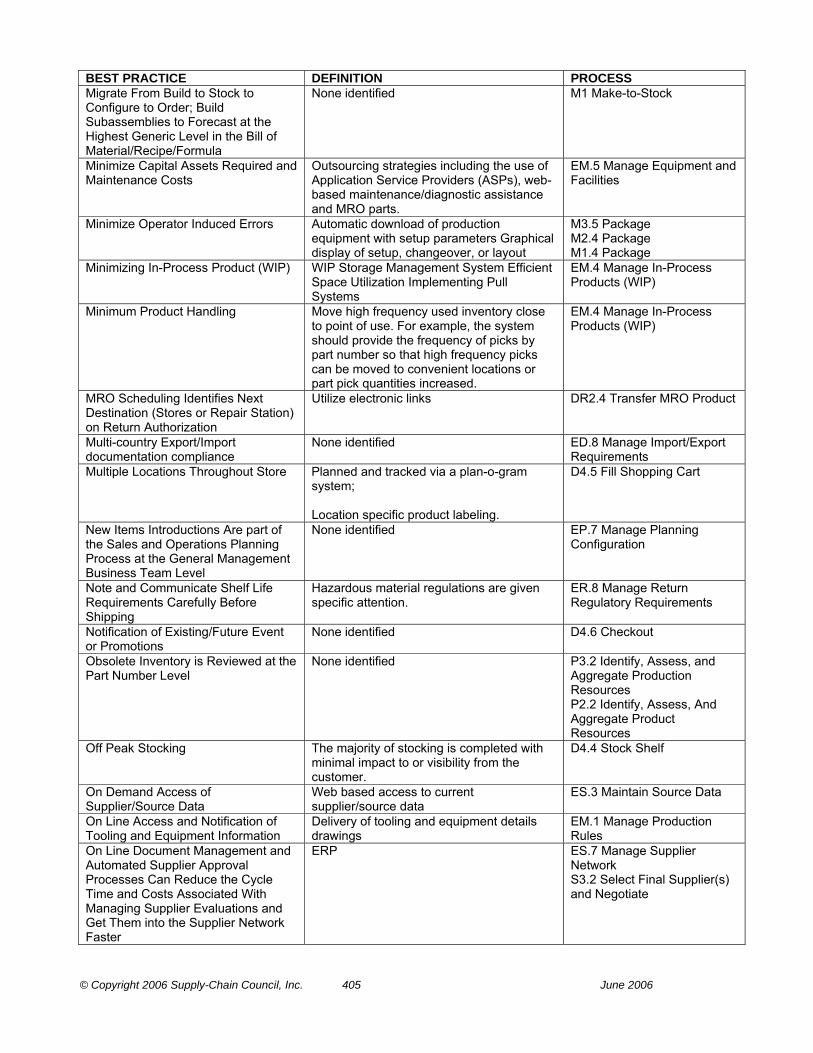
© Copyright 2006 Supply-Chain Council, Inc. 405 June 2006
BEST PRACTICE DEFINITION PROCESS Migrate From Build to Stock to Configure to Order; Build Subassemblies to Forecast at the Highest Generic Level in the Bill of Material/Recipe/Formula
None identified M1 Make-to-Stock
Minimize Capital Assets Required and Maintenance Costs
Outsourcing strategies including the use of Application Service Providers (ASPs), web-based maintenance/diagnostic assistance and MRO parts.
EM.5 Manage Equipment and Facilities
Minimize Operator Induced Errors Automatic download of production equipment with setup parameters Graphical display of setup, changeover, or layout
M3.5 Package M2.4 Package M1.4 Package
Minimizing In-Process Product (WIP) WIP Storage Management System Efficient Space Utilization Implementing Pull Systems
EM.4 Manage In-Process Products (WIP)
Minimum Product Handling Move high frequency used inventory close to point of use. For example, the system should provide the frequency of picks by part number so that high frequency picks can be moved to convenient locations or part pick quantities increased.
EM.4 Manage In-Process Products (WIP)
MRO Scheduling Identifies Next Destination (Stores or Repair Station) on Return Authorization
Utilize electronic links DR2.4 Transfer MRO Product
Multi-country Export/Import documentation compliance
None identified ED.8 Manage Import/Export Requirements
Multiple Locations Throughout Store Planned and tracked via a plan-o-gram system; Location specific product labeling.
D4.5 Fill Shopping Cart
New Items Introductions Are part of the Sales and Operations Planning Process at the General Management Business Team Level
None identified EP.7 Manage Planning Configuration
Note and Communicate Shelf Life Requirements Carefully Before Shipping
Hazardous material regulations are given specific attention.
ER.8 Manage Return Regulatory Requirements
Notification of Existing/Future Event or Promotions
None identified D4.6 Checkout
Obsolete Inventory is Reviewed at the Part Number Level
None identified P3.2 Identify, Assess, and Aggregate Production Resources P2.2 Identify, Assess, And Aggregate Product Resources
Off Peak Stocking The majority of stocking is completed with minimal impact to or visibility from the customer.
D4.4 Stock Shelf
On Demand Access of Supplier/Source Data
Web based access to current supplier/source data
ES.3 Maintain Source Data
On Line Access and Notification of Tooling and Equipment Information
Delivery of tooling and equipment details drawings
EM.1 Manage Production Rules
On Line Document Management and Automated Supplier Approval Processes Can Reduce the Cycle Time and Costs Associated With Managing Supplier Evaluations and Get Them into the Supplier Network Faster
ERP ES.7 Manage Supplier Network S3.2 Select Final Supplier(s) and Negotiate

© Copyright 2006 Supply-Chain Council, Inc. 406 June 2006
BEST PRACTICE DEFINITION PROCESS On Line RFQ Processes Linked into the Document Management Process Reduces Cycle Time and Product Management Costs
None identified S3.1 Identify Sources of Supply S3.2 Select Final Supplier(s) and Negotiate
On-Demand Access of Production Information
Data Collection and Display Systems designed for efficient performance of value-added operations in production. This could include using PLC, Machine Interface, bar code, Radio Frequency Communication, Radio Frequency Identification, Magnetic Stripe, Smart Cards, etc., to enable data collection
EM.3 Manage MAKE Information
On-Demand Access to Available to Promise (ATP), Production Schedules and Inventory Status by Internal Operations and Customers
None identified EM.3 Manage MAKE Information
On-Line Availability to Supplier Financials to Determine Potential Supplier Viability to be Added to Supplier Network
Internet web sites for financial evaluation ES.7 Manage Supplier Network S3.2 Select Final Supplier(s) and Negotiate
Online Real-Time Customer Entry and Edit
On-line Customer Service Module CRM (Customer resource Management) software is getting a big push in the E-Commerce/E-Business areas and generally provides a means to fulfill this requirement
ED.3 Manage Deliver Information
On-Line Rule Base None identified ED.1 Manage Deliver Business Rules
On-Line Visibility of All Supply-Chain Demand Requirements and Resources, both Currently Available and Committed (Pegged)
Enterprise resource planning system Customer relationship management system
P1 Plan Supply Chain
Operations and Network Analysis None identified ED.7 Manage Product Life Cycle
Optimize Packing No packing and unpacking time required. Recyclable or no containers where appropriate. No discarded material.
EM.4 Manage In-Process Products (WIP)
Optimized Supply-Chain Processes, Optimized Supplier Count, Supplier and Part Rationalization
Web based access to preferred and recommended suppliers, supplier performance data & spend data stratified by commodity, business unit/site, supplier, part type, process type
ES.1 Manage Sourcing Business Rules ES.9 Manage Supplier Agreements
Order Entry is Organized by Customer Segment Customers Receive Differentiated Service Based on Volume of Business Customer Team is Empowered to Fully Service Customer Requests, Including Formal Orders and Ad Hoc Requests Customers Have One Point of Contact for All Products
None identified D2.2 Receive, Configure, Enter and Validate Order
Organize to Enhance Flexibility: Few Job Classifications, Self-Directed Work Force, Flat Management Structure, Cross-Functional Work Teams
Support for modular skills inventory with links to training databases, compensations systems, and operator instructions
M2 Make-to-Order M3 Engineer-to-Order M1 Make-to-Stock
Outsource If Not a Core Competency Use 4PL to manage and move. ER.5 Manage Return Capital Assets
Packaging Operation is an Integral Part of the Overall Production Process
None identified M3.5 Package M1.4 Package M2.4 Package

© Copyright 2006 Supply-Chain Council, Inc. 407 June 2006
BEST PRACTICE DEFINITION PROCESS Paperless Order Tracking and Customer Visibility of Orders
Electronic dispatch and data collection with external interface to internet.
M1 Make-to-Stock M2 Make-to-Order M3 Engineer-to-Order
Paperless Production Control Electronic dispatch of operations M3.4 Produce and Test M3.5 Package M1.4 Package M2.4 Package M1.3 Produce and Test M2.3 Produce and Test
Paperless Production Order and Inventory Tracking
Electronic dispatch and data collection. Allow customer access to production status and inventories using internet technologies and web site features.
M1 Make-to-Stock
Partnership with Outside Design Firms to Provide Skills and Capacity, as Needed
None identified D3.1 Obtain and Respond to RFP/RFQ
Pay on Receipt Electronic Invoice Processing S3.7 Authorize Supplier Payment S1.5 Authorize Supplier Payment S2.5 Authorize Supplier Payment
Performance Expectations and Business Rules Are Clearly Communicated Prior to the Initiation of Business with the Supplier
Web based access / availability to business rules and performance criteria
ES.2 Assess Supplier Performance
Performance Results that Are Compared to Benchmarks (i.e. Capacity, Scheduling) and Readily Available to Employees
Data warehouse, report writing, real time database and Executive Information systems that are easily accessible. Use of web-based technologies for dissemination of information.
M1 Make-to-Stock
Periodic Review of Metrics and Strategy with Comparisons to Industry Benchmarks
Real time view of data. ED.4 Manage Finished Goods Inventories ES.4 Manage Product Inventory ER.4 Manage Return Inventory
Periodic Review of Standards Process for establishing and maintaining review schedules
EM.2 Manage Production Performance
Planning and Forecasting Outsourced Return process
Collaborative planning and forecasting with RETURN outsourcing partners (3PL, reverse drop shippers, etc.)
P5 Plan Return
Planogram Flexibility for Seasonal/Promotional changes
None identified P4.1 Identify, Prioritize, and Aggregate Delivery Requirements
Plans that Violate Business Rules (e.g. Joint Service Agreements) Are Addressed Cross-Functionally, Considering Total Business Impacts (Revenue, Cost, Quality, Customer Service, Etc.)
None identified P4.4 Establish Delivery Plans
Plans Which Do Not Violate Business Rules Are Communicated Openly and Cross-Functionally for Execution
None identified P4.4 Establish Delivery Plans
Posted Performance Results Data warehouse, report writing, real time data base and EI systems
M2 Make-to-Order M3 Engineer-to-Order M1 Make-to-Stock

© Copyright 2006 Supply-Chain Council, Inc. 408 June 2006
BEST PRACTICE DEFINITION PROCESS Postponement Postponement (delayed differentiation) is a
supply chain concept where a product is kept as long as possible in a generic state. Differentiation of the generic product into a specific end-product is shifted closer to the consumer by postponing identify changes, such as assembly or packaging, to the last possible supply chain location.
D1 Deliver Stocked Product D2 Deliver Make-to-Order Product M1 Make-to-Stock M2 Make-to-Order S1 Source Stocked Product S2 Source Make-to-Order Product
Postponement and Pre-Kitting Of Accessories into Modular Packages that Allow Flexibility While Maintaining Control
None identified M1.4 Package M3.5 Package M2.4 Package
Pre-Certify Supplier Capability to Send Return Products Correctly to Minimize the Need for Receipt Verification
- Push inspection to SOURCE - Receiving quality criteria connected to ISO 9000 practices
DR3.3 Receive Excess Product DR1.3 Receive Defective Product DR2.3 Receive MRO Product
Pre-Defined Manufacturing Design Rules
Libraries of manufacturing capabilities or design envelopes
EM.1 Manage Production Rules
Predictive Maintenance Monitoring (Heat, Noise, Lubrication Composition & Vibration)
Database for equipment to contain expected results of analysis, allow entry of test readings, and have capability of generating desired reports, which could highlight suggested actions based upon readings obtained, track maintenance completed, contain a help-file to be consulted
EM.5 Manage Equipment and Facilities
Priority-Based Inventory Reservations, for Key Customers, with FIFO Allocation for All Others
None identified D1.3 Reserve Inventory & Determine Delivery Date
Proactive Education of Customers to Set Expectations and Encourage Close Working Relationships (Knowledge of Long-Lead Items, Visibility to Supply Resources, Agreement on Levels of Flexibility)
None identified P4 Plan Deliver
Produce Products to Unique Customer Requirements
Order entry specifications linked to manufacturing order
M2 Make-to-Order
Product Data Management & Electronic Document Management Are Used to Manage Technical Documents and Requirements for Engineer to Order Product
None identified S3.1 Identify Sources of Supply
Product Design Collaboration with Customers
On-line design tools facilitated by internet connections.
M3 Engineer-to-Order
Production Level Loading Capacity planning M2 Make-to-Order M1 Make-to-Stock
Production Reporting/Status Real time monitoring of production status and In-Process Product (WIP)
EM.7 Manage Production Network
Proof of Performance (Promotion Management)
Scan store shelves / bar codes to confirm put-a-way. Scan using handheld and match with ad.
D4.4 Stock Shelf
Provide Continuous Formal Training to Employees
Examples would be TQM, Six Sigma. M1.3 Produce and Test M2 Make-to-Order M1 Make-to-Stock M3.4 Produce and Test
Provide Product or Service Training to Employees or FAQ's Online
None identified D4.7 Deliver and/or Install
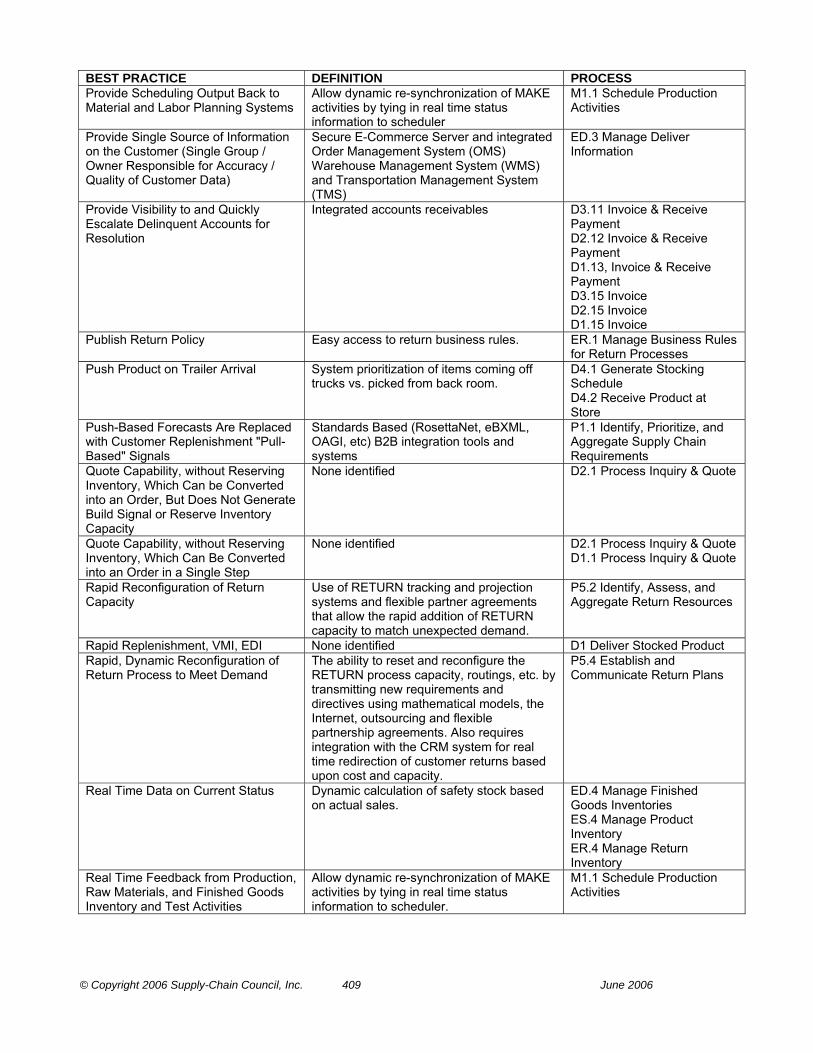
© Copyright 2006 Supply-Chain Council, Inc. 409 June 2006
BEST PRACTICE DEFINITION PROCESS Provide Scheduling Output Back to Material and Labor Planning Systems
Allow dynamic re-synchronization of MAKE activities by tying in real time status information to scheduler
M1.1 Schedule Production Activities
Provide Single Source of Information on the Customer (Single Group / Owner Responsible for Accuracy / Quality of Customer Data)
Secure E-Commerce Server and integrated Order Management System (OMS) Warehouse Management System (WMS) and Transportation Management System (TMS)
ED.3 Manage Deliver Information
Provide Visibility to and Quickly Escalate Delinquent Accounts for Resolution
Integrated accounts receivables D3.11 Invoice & Receive Payment D2.12 Invoice & Receive Payment D1.13, Invoice & Receive Payment D3.15 Invoice D2.15 Invoice D1.15 Invoice
Publish Return Policy Easy access to return business rules. ER.1 Manage Business Rules for Return Processes
Push Product on Trailer Arrival System prioritization of items coming off trucks vs. picked from back room.
D4.1 Generate Stocking Schedule D4.2 Receive Product at Store
Push-Based Forecasts Are Replaced with Customer Replenishment "Pull-Based" Signals
Standards Based (RosettaNet, eBXML, OAGI, etc) B2B integration tools and systems
P1.1 Identify, Prioritize, and Aggregate Supply Chain Requirements
Quote Capability, without Reserving Inventory, Which Can be Converted into an Order, But Does Not Generate Build Signal or Reserve Inventory Capacity
None identified D2.1 Process Inquiry & Quote
Quote Capability, without Reserving Inventory, Which Can Be Converted into an Order in a Single Step
None identified D2.1 Process Inquiry & Quote D1.1 Process Inquiry & Quote
Rapid Reconfiguration of Return Capacity
Use of RETURN tracking and projection systems and flexible partner agreements that allow the rapid addition of RETURN capacity to match unexpected demand.
P5.2 Identify, Assess, and Aggregate Return Resources
Rapid Replenishment, VMI, EDI None identified D1 Deliver Stocked Product Rapid, Dynamic Reconfiguration of Return Process to Meet Demand
The ability to reset and reconfigure the RETURN process capacity, routings, etc. by transmitting new requirements and directives using mathematical models, the Internet, outsourcing and flexible partnership agreements. Also requires integration with the CRM system for real time redirection of customer returns based upon cost and capacity.
P5.4 Establish and Communicate Return Plans
Real Time Data on Current Status Dynamic calculation of safety stock based on actual sales.
ED.4 Manage Finished Goods Inventories ES.4 Manage Product Inventory ER.4 Manage Return Inventory
Real Time Feedback from Production, Raw Materials, and Finished Goods Inventory and Test Activities
Allow dynamic re-synchronization of MAKE activities by tying in real time status information to scheduler.
M1.1 Schedule Production Activities

© Copyright 2006 Supply-Chain Council, Inc. 410 June 2006
BEST PRACTICE DEFINITION PROCESS Real Time Package Tracking Tracking and tracing ED.2 Access Delivery
Performance ED.2 Assess Delivery Performance
Real Time Performance Measurement Reporting Systems
Systems to collect production information online generate reports upon request by operators, and track progress against schedule and standards.
EM.2 Manage Production Performance
Real Time quality control techniques Electronic collection of quality data and on-line SPC.
M3.4 Produce and Test M2.3 Produce and Test M1.3 Produce and Test
Real Time Return Anticipation Having real time data on return demand and including it in the plan and forecast. Requires a connection with customers, call centers or CRM system, possibly to the store level with retail returns. The return demand needs to be included in the production plan as soon as possible because upon repair it may be the next piece of serviceable inventory to satisfy demand.
P5.1 Assess, and Aggregate Return Requirements
Real Time Statistical Control Techniques
Electronic collection of defect data and on-line SPC.
M3.4 Produce and Test M1.3 Produce and Test M2.3 Produce and Test
Real-Time Optimized Shipment Method Selection (Air Parcel, Ground Parcel, LTL, etc.) Based on Customer Service Requirements
Transportation Management System (TMS) Maintenance Management
ES.6 Manage Incoming Product ED.6 Manage Transportation ER.6 Manage Return Transportation
Real-Time Shipment Tracking, (via internet)
Transportation Management System (TMS) Maintenance Management
ES.6 Manage Incoming Product ED.6 Manage Transportation ER.6 Manage Return Transportation
Re-Balancing of Full-Stream Supply/Demand on a Daily Basis, Including Source-Make-Deliver Resources and Requirements from "Customers' Customer to Suppliers' Supplier"
Enterprise-wide planning system customer Relationship Systems
P1 Plan Supply Chain
Receivers on the Dock Communicate Directly with the Buyer to Efficiently Resolve Any Discrepancies
Buyer's name for every receipt is clearly visible on Receiver.
DR3.3 Receive Excess Product DR1.3 Receive Defective Product DR2.3 Receive MRO Product
Receiving Equipment and Packaging Materials to Transfer Product Are Planned for In Advance and Readily Available When Needed
Include packaging materials in inventory management system and treat as any other inventory to minimize potential of stock-out.
DR3.4 Transfer Excess Product DR1.4 Transfer Defective Product DR2.4 Transfer MRO Product
Reduce Chances of Operator Error Automatic download of production equipment with batch recipes/part programs
M2.3 Produce and Test M1.3 Produce and Test
Reduce In-Process Product (WIP) Handling
Reduction of WIP handling through automation (i.e. AGVs and ASRS) and process improvement (i.e. reduction of handling steps, shorter move paths)
EM.6 Manage Transportation
Reduce Non-Value Added Activities, Including Queue, Move, and Set-Up Times
Use principals of Lean Manufacturing. M3.4 Produce and Test M2.3 Produce and Test M1.3 Produce and Test
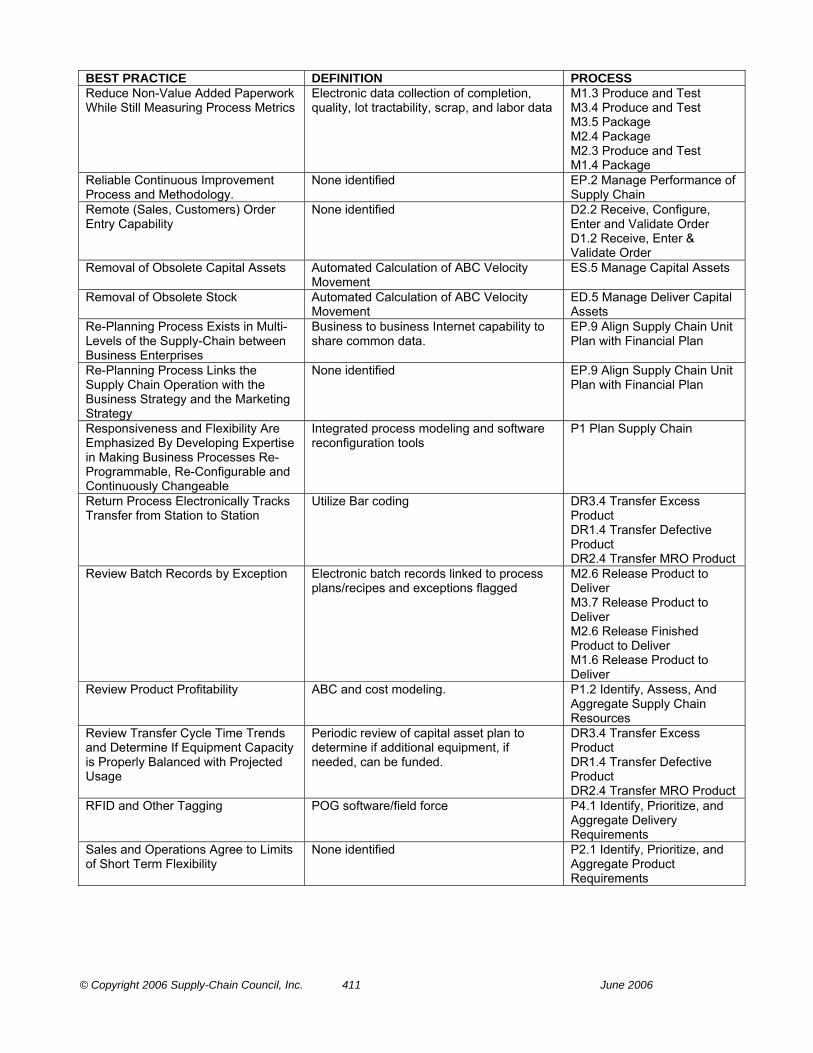
© Copyright 2006 Supply-Chain Council, Inc. 411 June 2006
BEST PRACTICE DEFINITION PROCESS Reduce Non-Value Added Paperwork While Still Measuring Process Metrics
Electronic data collection of completion, quality, lot tractability, scrap, and labor data
M1.3 Produce and Test M3.4 Produce and Test M3.5 Package M2.4 Package M2.3 Produce and Test M1.4 Package
Reliable Continuous Improvement Process and Methodology.
None identified EP.2 Manage Performance of Supply Chain
Remote (Sales, Customers) Order Entry Capability
None identified D2.2 Receive, Configure, Enter and Validate Order D1.2 Receive, Enter & Validate Order
Removal of Obsolete Capital Assets Automated Calculation of ABC Velocity Movement
ES.5 Manage Capital Assets
Removal of Obsolete Stock Automated Calculation of ABC Velocity Movement
ED.5 Manage Deliver Capital Assets
Re-Planning Process Exists in Multi-Levels of the Supply-Chain between Business Enterprises
Business to business Internet capability to share common data.
EP.9 Align Supply Chain Unit Plan with Financial Plan
Re-Planning Process Links the Supply Chain Operation with the Business Strategy and the Marketing Strategy
None identified EP.9 Align Supply Chain Unit Plan with Financial Plan
Responsiveness and Flexibility Are Emphasized By Developing Expertise in Making Business Processes Re-Programmable, Re-Configurable and Continuously Changeable
Integrated process modeling and software reconfiguration tools
P1 Plan Supply Chain
Return Process Electronically Tracks Transfer from Station to Station
Utilize Bar coding DR3.4 Transfer Excess Product DR1.4 Transfer Defective Product DR2.4 Transfer MRO Product
Review Batch Records by Exception Electronic batch records linked to process plans/recipes and exceptions flagged
M2.6 Release Product to Deliver M3.7 Release Product to Deliver M2.6 Release Finished Product to Deliver M1.6 Release Product to Deliver
Review Product Profitability ABC and cost modeling. P1.2 Identify, Assess, And Aggregate Supply Chain Resources
Review Transfer Cycle Time Trends and Determine If Equipment Capacity is Properly Balanced with Projected Usage
Periodic review of capital asset plan to determine if additional equipment, if needed, can be funded.
DR3.4 Transfer Excess Product DR1.4 Transfer Defective Product DR2.4 Transfer MRO Product
RFID and Other Tagging POG software/field force P4.1 Identify, Prioritize, and Aggregate Delivery Requirements
Sales and Operations Agree to Limits of Short Term Flexibility
None identified P2.1 Identify, Prioritize, and Aggregate Product Requirements

© Copyright 2006 Supply-Chain Council, Inc. 412 June 2006
BEST PRACTICE DEFINITION PROCESS Sales and Operations Planning (S&OP)
A process to develop tactical plans that provide management the ability to strategically direct its businesses to achieve competitive advantage on a continuous basis by integrating customer-focused marketing plans for new and existing products with the management of the supply chain. The process brings together all the plans for the business (sales, marketing, development, manufacturing, sourcing, and financial) into one integrated set of plans. It is performed at least once a month and is reviewed by management at an aggregate (product family) level. The process must reconcile all supply, demand, and new-product plans at both the detail and aggregate levels and tie to the business plan. It is the definitive statement of the company's plans for the near to intermediate term, covering a horizon sufficient to plan for resources and to support the annual business planning process. Executed properly, the sales and operation planning process links the strategic plans for the business with its execution and reviews performance measurements for continuous improvement. (From APICS online dictionary.)
P1 Plan Supply Chain
Scan Displays for Promotion Conformance
D4.4 Stock Shelf
Scan Displays for Promotion Conformance
None identified
Schedule Includes Preventative Maintenance Program
Interface between maintenance management system and scheduling system
M1.1 Schedule Production Activities M2.1 Schedule Production Activities M3.2 Schedule Production Activities
Schedule Minimizes Changeover Costs between Products
Algorithms that manage set up times/costs, cleaning times, and ideal job sequences (e.g., color sequencing light to dark)
M3.2 Schedule Production Activities
Schedule Optimizes Use of Shared Resources Such as Tooling and Production Equipment
Scheduling utilizing optimization techniques Required production resources included in routing/process instructions
M1.1 Schedule Production Activities M3.2 Schedule Production Activities M2.1 Schedule Production Activities
Schedule Reflects Current Plant Status (Equipment Availability, Other Jobs and Resource Availability) On Line
Schedule undated by on line reporting and status systems and re-sequence activities
M1.1 Schedule Production Activities M3.2 Schedule Production Activities M2.1 Schedule Production Activities
Segregate In-Bound Carcass Return Cost from Other Transportation Costs
None Identified ER.6 Manage Return Transportation
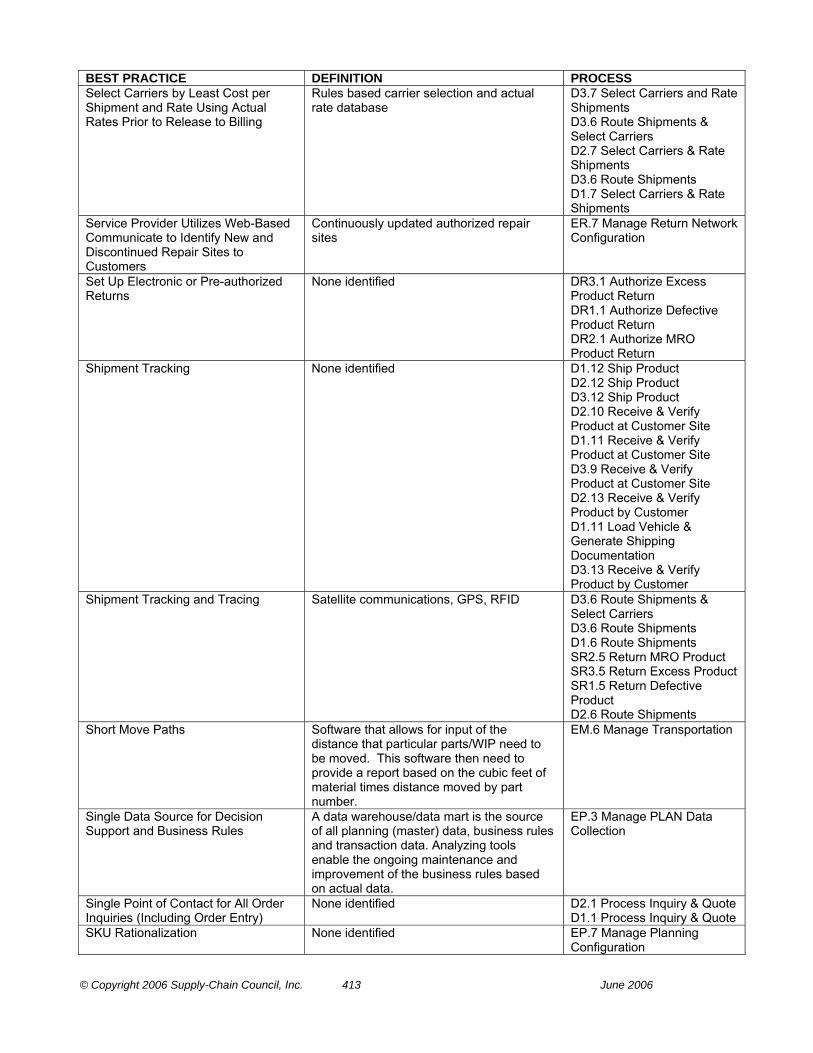
© Copyright 2006 Supply-Chain Council, Inc. 413 June 2006
BEST PRACTICE DEFINITION PROCESS Select Carriers by Least Cost per Shipment and Rate Using Actual Rates Prior to Release to Billing
Rules based carrier selection and actual rate database
D3.7 Select Carriers and Rate Shipments D3.6 Route Shipments & Select Carriers D2.7 Select Carriers & Rate Shipments D3.6 Route Shipments D1.7 Select Carriers & Rate Shipments
Service Provider Utilizes Web-Based Communicate to Identify New and Discontinued Repair Sites to Customers
Continuously updated authorized repair sites
ER.7 Manage Return Network Configuration
Set Up Electronic or Pre-authorized Returns
None identified DR3.1 Authorize Excess Product Return DR1.1 Authorize Defective Product Return DR2.1 Authorize MRO Product Return
Shipment Tracking None identified D1.12 Ship Product D2.12 Ship Product D3.12 Ship Product D2.10 Receive & Verify Product at Customer Site D1.11 Receive & Verify Product at Customer Site D3.9 Receive & Verify Product at Customer Site D2.13 Receive & Verify Product by Customer D1.11 Load Vehicle & Generate Shipping Documentation D3.13 Receive & Verify Product by Customer
Shipment Tracking and Tracing Satellite communications, GPS, RFID D3.6 Route Shipments & Select Carriers D3.6 Route Shipments D1.6 Route Shipments SR2.5 Return MRO Product SR3.5 Return Excess Product SR1.5 Return Defective Product D2.6 Route Shipments
Short Move Paths Software that allows for input of the distance that particular parts/WIP need to be moved. This software then need to provide a report based on the cubic feet of material times distance moved by part number.
EM.6 Manage Transportation
Single Data Source for Decision Support and Business Rules
A data warehouse/data mart is the source of all planning (master) data, business rules and transaction data. Analyzing tools enable the ongoing maintenance and improvement of the business rules based on actual data.
EP.3 Manage PLAN Data Collection
Single Point of Contact for All Order Inquiries (Including Order Entry)
None identified D2.1 Process Inquiry & Quote D1.1 Process Inquiry & Quote
SKU Rationalization None identified EP.7 Manage Planning Configuration

© Copyright 2006 Supply-Chain Council, Inc. 414 June 2006
BEST PRACTICE DEFINITION PROCESS Sound Project Management Process and Methodology
None identified EP.2 Manage Performance of Supply Chain
Specific Changes to the Plan Are Agreed to Cross-Functionally, According to Defined Business Rules
None identified P4.4 Establish Delivery Plans
Stage Product or Service Adoption None identified D4.7 Deliver and/or Install Staging Based on In-store Zones Items are staged for re-stocking based on
zones within the store. This minimizes restocking effort.
D4.3 Pick Product from Backroom
Standard Inventory Policy to Determine Excess
None Identified ER.1 Manage Business Rules for Return Processes
Standard Operating Procedures and Methodology
None identified ED.5 Manage Deliver Capital Assets ED.7 Manage Product Life Cycle
Standards and Measurements Aligned to Maximize Supply Chain Performance
Internal/external benchmarking, industry standards, customer/supplier alignment agreements, visibility of key performance indicators
EM.2 Manage Production Performance
Statistical Test Count The Statistical Test Count (STC) process is a method of validating inventory on-hand values by physically counting and reconciling a statistical sample of the entire inventory population. This sample is then extrapolated across the inventory population, which provides an indicative measure of entire inventory population. Furthermore, with extrapolation the net and gross percentage of error is determined.
EM.4 Manage In-Process Products (WIP) ED.4 Manage Finished Goods Inventories ES.4 Manage Product Inventory ER.4 Manage Return Inventory
Stocking is Completed in Zones Each area of the store has its own stocking plan and items are routed specifically to that area.
D4.4 Stock Shelf
Storage and Configuration Management for Release and Revision Control of Final Documents
Product data management (PDM) or Electronic Data Management (EDM) feature set
EM.1 Manage Production Rules
Storage Location Zoning Automated or Optimized Slotting (Storage Location) Systems
ED.5 Manage Deliver Capital Assets
Strategic Safety Stock of Selected Materials, Items, or Subassemblies to Decouple Sourced Product Issuance Cycle Time from Supplier Lead Time
Use of safety stock algorithms to minimize stock levels.
M1.2 Issue Product M1.2 Issue Material M2.2 Issue Sourced/In-Process Product M3.3 Issue Sourced/In-Process Product
Strategic Sales and Operations Planning Process in Place and Managed at the Executive Level
None identified EP.9 Align Supply Chain Unit Plan with Financial Plan
Substitution Trained staff or automated systems (Internet) that recommend up-sell, cross-sell, and/or substitution See Up and cross selling
D4.5 Fill Shopping Cart
Supplier "Cost of Nonconformance" Data is Collected, Analyzed and Used in Performance Reporting
Software application to automate data collection and reporting
ES.2 Assess Supplier Performance
Supplier and Material Rationalization Web based access to supplier/source data ES.3 Maintain Source Data

© Copyright 2006 Supply-Chain Council, Inc. 415 June 2006
BEST PRACTICE DEFINITION PROCESS Supplier Certification Programs Are Used to Reduce (Skip Lot) or Eliminate Receiving Inspection
Skip lot/sampling inspection logic S3.5 Verify Product S3.4 Receive Product S1.3 Verify Product S2.2 Receive Product S1.2 Receive Product S2.3 Verify Product
Supplier Certification Programs Can Reduce the Cycle Time for Certifying Existing Suppliers to Provide New Technologies
None identified ES.7 Manage Supplier Network S3.2 Select Final Supplier(s) and Negotiate
Supplier Delivers Directly to Point of Use
Electronic Tag tracking to Point of Use (POU) destination
S3.5 Verify Product S2.3 Verify Product S1.3 Verify Product
Supplier Delivers Directly to Point of Use - (Dock to Line or End Destination)
Electronic Tag tracking to Point of Use (POU) destination
S3.4 Receive Product S1.2 Receive Product S2.2 Receive Product
Supplier Delivery to Production Process at Point of Use
EDI link to supplier's sales order and inventory systems
M1.2 Issue Product M1.2 Issue Material M2.2 Issue Sourced/In-Process Product M3.3 Issue Sourced/In-Process Product
Supplier Development Programs Are Used to Get Local Suppliers to Invest in Developing New Technologies
None identified S3.1 Identify Sources of Supply
Supplier Managed Inventory of Parts E.D.I. linkage of Inventory Information EM.5 Manage Equipment and Facilities
Supplier Performance Assessment System
“Assess Supplier Performance” is the process of measuring actual supplier performance against internal and/or external standards, providing feedback to achieve and maintain the performance required to meet the customers’ business and/or competitive needs.
ES.2 Assess Supplier Performance
Supplier Performance Data is Collected, Analyzed and Reported to Suppliers Online and Real-Time through Extranet Applications
Web based relational database / management application
ES.2 Assess Supplier Performance
Supplier Replaces Defective Material at Customer's Facility with Good Product as Required
Electronic Tag tracking to Point of Use (POU) destination
S3.5 Verify Product S1.3 Verify Product S2.3 Verify Product
Suppliers Are Evaluated, Selected and Qualified with Criteria Matched to Business Requirements and Competitive Needs
None identified ES.2 Assess Supplier Performance
Suppliers Share Responsibility for Balancing Supply and Demand through Joint Service Agreements
None identified P2.3 Balance Product Resources with Product Requirements
Supply Chain Advance Planning System
Collaboration among Supply Chain partners extends outwards to customers, spanning the supply chain. Planning Re-planning Business Rules Plan Changes
P1.4 Establish Supply Chain Plans P1.1 Identify, Prioritize, and Aggregate Supply Chain Requirements
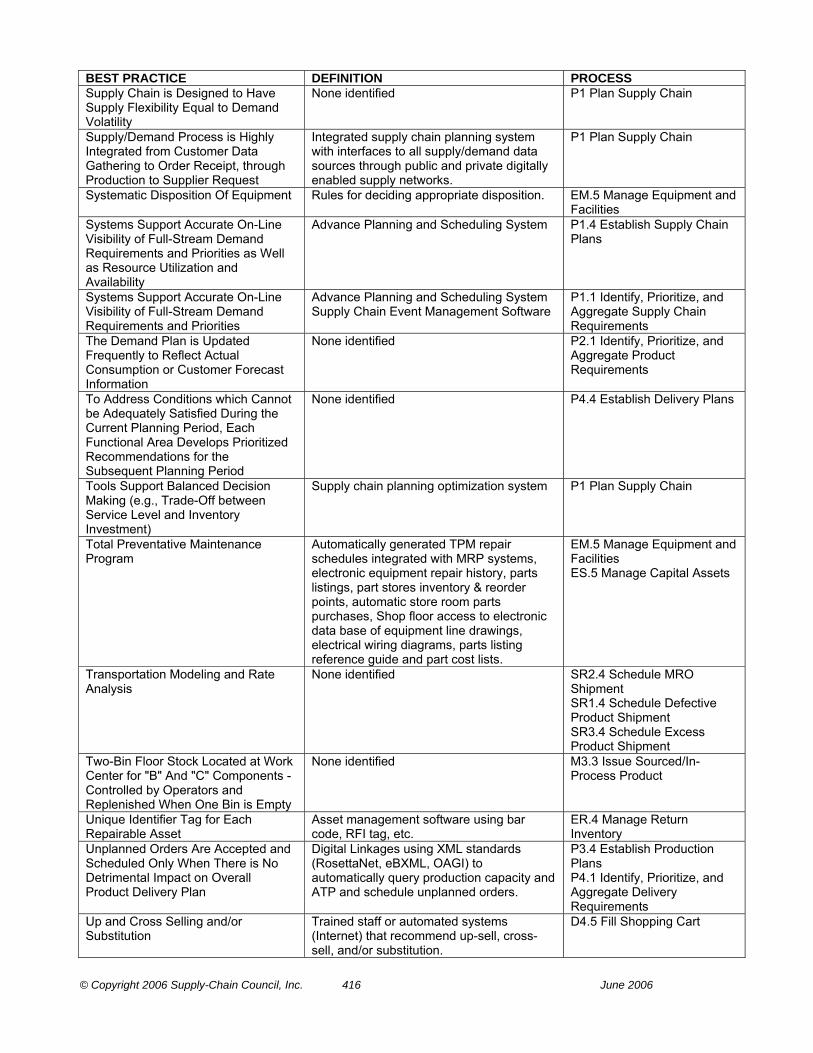
© Copyright 2006 Supply-Chain Council, Inc. 416 June 2006
BEST PRACTICE DEFINITION PROCESS Supply Chain is Designed to Have Supply Flexibility Equal to Demand Volatility
None identified P1 Plan Supply Chain
Supply/Demand Process is Highly Integrated from Customer Data Gathering to Order Receipt, through Production to Supplier Request
Integrated supply chain planning system with interfaces to all supply/demand data sources through public and private digitally enabled supply networks.
P1 Plan Supply Chain
Systematic Disposition Of Equipment Rules for deciding appropriate disposition. EM.5 Manage Equipment and Facilities
Systems Support Accurate On-Line Visibility of Full-Stream Demand Requirements and Priorities as Well as Resource Utilization and Availability
Advance Planning and Scheduling System P1.4 Establish Supply Chain Plans
Systems Support Accurate On-Line Visibility of Full-Stream Demand Requirements and Priorities
Advance Planning and Scheduling System Supply Chain Event Management Software
P1.1 Identify, Prioritize, and Aggregate Supply Chain Requirements
The Demand Plan is Updated Frequently to Reflect Actual Consumption or Customer Forecast Information
None identified P2.1 Identify, Prioritize, and Aggregate Product Requirements
To Address Conditions which Cannot be Adequately Satisfied During the Current Planning Period, Each Functional Area Develops Prioritized Recommendations for the Subsequent Planning Period
None identified P4.4 Establish Delivery Plans
Tools Support Balanced Decision Making (e.g., Trade-Off between Service Level and Inventory Investment)
Supply chain planning optimization system P1 Plan Supply Chain
Total Preventative Maintenance Program
Automatically generated TPM repair schedules integrated with MRP systems, electronic equipment repair history, parts listings, part stores inventory & reorder points, automatic store room parts purchases, Shop floor access to electronic data base of equipment line drawings, electrical wiring diagrams, parts listing reference guide and part cost lists.
EM.5 Manage Equipment and Facilities ES.5 Manage Capital Assets
Transportation Modeling and Rate Analysis
None identified SR2.4 Schedule MRO Shipment SR1.4 Schedule Defective Product Shipment SR3.4 Schedule Excess Product Shipment
Two-Bin Floor Stock Located at Work Center for "B" And "C" Components - Controlled by Operators and Replenished When One Bin is Empty
None identified M3.3 Issue Sourced/In-Process Product
Unique Identifier Tag for Each Repairable Asset
Asset management software using bar code, RFI tag, etc.
ER.4 Manage Return Inventory
Unplanned Orders Are Accepted and Scheduled Only When There is No Detrimental Impact on Overall Product Delivery Plan
Digital Linkages using XML standards (RosettaNet, eBXML, OAGI) to automatically query production capacity and ATP and schedule unplanned orders.
P3.4 Establish Production Plans P4.1 Identify, Prioritize, and Aggregate Delivery Requirements
Up and Cross Selling and/or Substitution
Trained staff or automated systems (Internet) that recommend up-sell, cross-sell, and/or substitution.
D4.5 Fill Shopping Cart
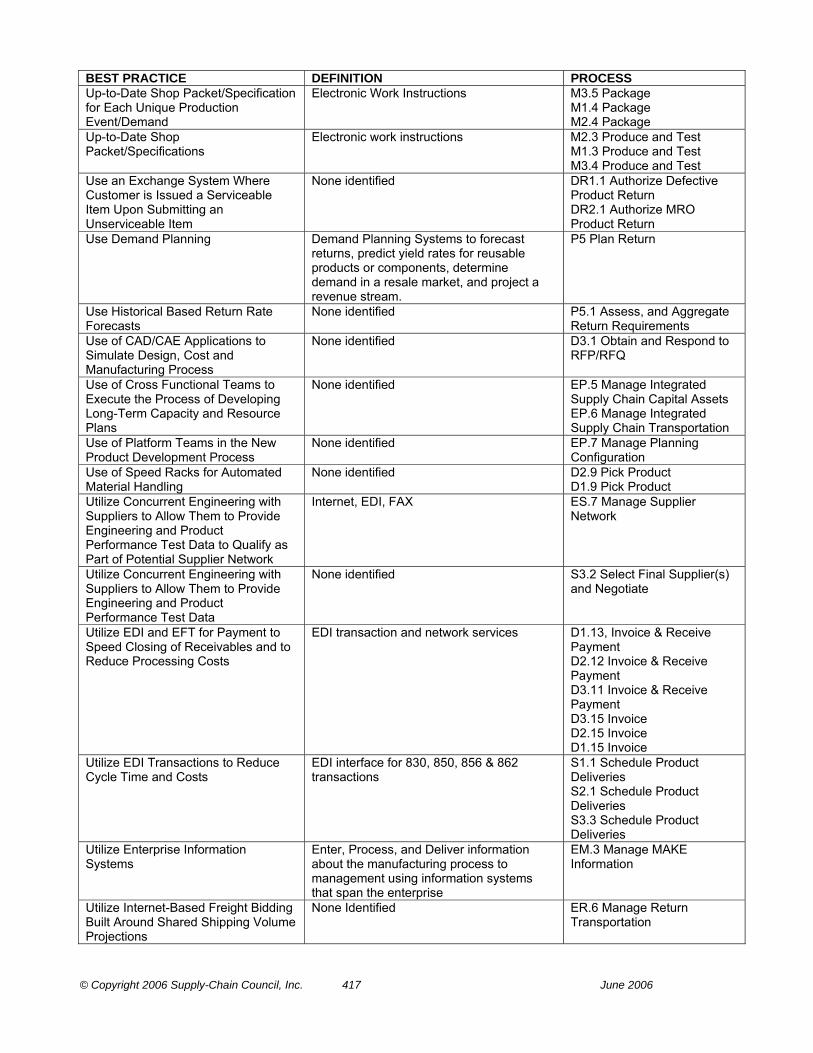
© Copyright 2006 Supply-Chain Council, Inc. 417 June 2006
BEST PRACTICE DEFINITION PROCESS Up-to-Date Shop Packet/Specification for Each Unique Production Event/Demand
Electronic Work Instructions M3.5 Package M1.4 Package M2.4 Package
Up-to-Date Shop Packet/Specifications
Electronic work instructions M2.3 Produce and Test M1.3 Produce and Test M3.4 Produce and Test
Use an Exchange System Where Customer is Issued a Serviceable Item Upon Submitting an Unserviceable Item
None identified DR1.1 Authorize Defective Product Return DR2.1 Authorize MRO Product Return
Use Demand Planning Demand Planning Systems to forecast returns, predict yield rates for reusable products or components, determine demand in a resale market, and project a revenue stream.
P5 Plan Return
Use Historical Based Return Rate Forecasts
None identified P5.1 Assess, and Aggregate Return Requirements
Use of CAD/CAE Applications to Simulate Design, Cost and Manufacturing Process
None identified D3.1 Obtain and Respond to RFP/RFQ
Use of Cross Functional Teams to Execute the Process of Developing Long-Term Capacity and Resource Plans
None identified EP.5 Manage Integrated Supply Chain Capital Assets EP.6 Manage Integrated Supply Chain Transportation
Use of Platform Teams in the New Product Development Process
None identified EP.7 Manage Planning Configuration
Use of Speed Racks for Automated Material Handling
None identified D2.9 Pick Product D1.9 Pick Product
Utilize Concurrent Engineering with Suppliers to Allow Them to Provide Engineering and Product Performance Test Data to Qualify as Part of Potential Supplier Network
Internet, EDI, FAX ES.7 Manage Supplier Network
Utilize Concurrent Engineering with Suppliers to Allow Them to Provide Engineering and Product Performance Test Data
None identified S3.2 Select Final Supplier(s) and Negotiate
Utilize EDI and EFT for Payment to Speed Closing of Receivables and to Reduce Processing Costs
EDI transaction and network services D1.13, Invoice & Receive Payment D2.12 Invoice & Receive Payment D3.11 Invoice & Receive Payment D3.15 Invoice D2.15 Invoice D1.15 Invoice
Utilize EDI Transactions to Reduce Cycle Time and Costs
EDI interface for 830, 850, 856 & 862 transactions
S1.1 Schedule Product Deliveries S2.1 Schedule Product Deliveries S3.3 Schedule Product Deliveries
Utilize Enterprise Information Systems
Enter, Process, and Deliver information about the manufacturing process to management using information systems that span the enterprise
EM.3 Manage MAKE Information
Utilize Internet-Based Freight Bidding Built Around Shared Shipping Volume Projections
None Identified ER.6 Manage Return Transportation

© Copyright 2006 Supply-Chain Council, Inc. 418 June 2006
BEST PRACTICE DEFINITION PROCESS Utilize Invoice-less Freight Payment None Identified ER.6 Manage Return
Transportation Utilize Real-World Cases in Employee Training
None Identified ER.1 Manage Business Rules for Return Processes
Utilize Web-Based Collaboration between Asset Manager and Repair Sites Regarding Capacity and Scheduling
Total return asset visibility throughout the network
ER.7 Manage Return Network Configuration
Utilize Web-Based Collaboration between Customer and Service Provider on In-Bound Return Forecasts and Asset Tracking
Shared return forecasts ER.7 Manage Return Network Configuration
Utilize Web-Based Collaboration to Identify Potential New Repair Sites Prior to Their Selection
Shared knowledge of resource availability and bottlenecks
ER.7 Manage Return Network Configuration
Value Pricing Based on "Cost to Serve"; EDLP; Cost Plus Pricing
Activity Based Costing; Integrated Order Management by Customer by Line Item
D2.2 Receive, Configure, Enter and Validate Order D1.2 Receive, Enter & Validate Order
Vendor Managed Inventory VMI is a concept for planning and control of inventory, in which the supplier has access to the customer’s inventory data and is responsible for maintaining the inventory level required by the customer. Re-supply is performed by the vendor through regularly scheduled reviews of the on-site inventory. The on-site inventory is counted, damaged or outdated goods are removed, and the inventory is restocked to predefined levels.
D1.5 Build Loads D1.6 Route Shipments D2.6 Route Shipments D3.5 Build Loads P1 Plan Supply Chain S3.4 Receive Product EM.4 Manage In-Process Products (WIP) S2.2 Receive Product S1.2 Receive Product ES.4 Manage Product Inventory M1 Make-to-Stock P4.1 Identify, Prioritize, and Aggregate Delivery Requirements
View for Analysis for All Orders and Shipments the Following Data: Logistics, Product, Cost, GL Charging
Transportation Management System (TMS) Maintenance Management
ED.6 Manage Transportation ER.6 Manage Return Transportation
Wave picking A practice used in many DC operations to increase labor picking productivity and reduce the labor cost per pick. In some DC’s, orders are scheduled to be picked when they are received. Wave picking consolidates orders into “waves” where multiple orders with similar characteristics are picked at one time. Orders can be consolidated by customer, geography, or any other criteria that makes sense for the DC operation.
D1.9 Pick Product

© Copyright 2006 Supply-Chain Council, Inc. 419 June 2006
INPUTS AND OUTPUTS INPUT / OUTPUT DEFINITION Actual Sales History Amount of past sales spanning any specified period of time (weeks, months,
years, etc.) and expressed in any specified increments (per day, week, month, year, etc.)
Actual Shrink Reductions of actual quantities of items in stock, in process, or in transit. The loss may be caused by scrap, theft, deterioration, evaporation, etc.
Advanced Ship Notice An EDI notification of shipment of product.
Air, Ground....Carrier Rate Tables Rates charged by common carriers to move goods, or freight.
Approved Contract Acceptance of an agreement between two or more competent persons or companies to perform or not to perform specific acts or services or to deliver merchandise. A contract may be oral or written.
Approved Item Master The "master" record for an item. Typically, it contains identifying and descriptive data and control values (lead times, lot sizes, etc.) and may contain data on inventory status, requirements, planned orders, and costs. Item records are linked by bill of material records (or product structure records), thus defining the bill of material.
Assorted by Shelf Order The function of physically separating a homogeneous subgroup from a heterogeneous population of items
Authorization to Return to Service Permission to return to service an item that has been repaired and found to be within specifications and operable.
Authorization to Scrap Permission to scrap material or item outside of specifications and possessing characteristics that make rework impractical.
Available to Promise Date The uncommitted portion of a company's inventory and planned production maintained in the master schedule to support customer-order promising. The ATP quantity is the uncommitted inventory balance in the first period and is normally calculated for each period in which an MPS receipt is scheduled. In the first period, ATP includes on-hand inventory less customer orders that are due and overdue
Benchmark Data A set of measurements (or metrics) that is used to establish goals for improvements in processes, functions, products, and so on Benchmark measures are often derived from other firms that display "best in class" achievement
Bill of Materials The Bill of Materials is a structured list of all the materials or parts needed to produce a particular finished product, assembly, subassembly, manufactured part, whether purchased or not.
Booked Order The process of accepting and translating what a customer wants into terms used by the manufacturer or distributor. The commitment should be based on the available-to-promise line (ATP) in the master schedule. This can be as simple as creating shipping documents for finished goods in a make-to-stock environment, or it might be a more complicated series of activities, including design efforts for make-to-order products
Budget Constraints A plan that includes an estimate of future costs and revenues related to expected activities. The budget serves as pattern for and a control over future operations.
Budgets A plan that includes an estimate of future costs and revenues related to expected activities. The budget serves as a pattern for and a control over future operations.

© Copyright 2006 Supply-Chain Council, Inc. 420 June 2006
INPUT / OUTPUT DEFINITION Business Plan A document resulting from a process of linking the long-range strategy with
projections of revenue, activity, cost and profit. This process develops objectives usually accompanied by budgets, projected balance sheet, and a cash flow statement.
Business Rules for Return Processes Rules for conducting business, i.e. developing and maintaining customer and channel performance standards of an return processes such as service levels, given service requirements by supply chain stakeholders/trading partners. Business rules align Return process policies with business strategy, goals, and objectives.
Business Rules for Source Processes Rules that are translated into guidelines and policies for conducting business within the enterprise and other legal entities. Sourcing business rules include: supplier selection and negotiation processes, fulfillment and delivery performance and relationship definition for specific levels of collaboration and partnership.
Capacity Constraints A capacity constraint is said to exist when the available capacity at a resource may be insufficient to meet the workload necessary to support the desired throughput. A capacity constraint is often a bottleneck.
Capacity Requirements The resources needed to produce the projected level of work required from a facility over a time horizon. Capacity requirements are usually expressed in terms of hours of work or, when units consume similar resources at the same rate, units of production.
Capital Assets Physical objects that are held by an organization for its production potential and that costs more than some threshold value (APICS)
Completed Proposal A document submitted in response to the a request for proposal from a customer with all the terms and conditions of sale of a product or service
Configuration Rules The rules for the management of product configuration, which includes the management of critical sub processes needed to manage the life cycle of individual item numbers including item masters, routings, rationalization, and bill of materials.
Conformance Plan Courses of action and processes that are established to meet the requirements placed on production by external entities.
Conformance Rules An affirmative indication or judgment that a product or service has met criteria translated into rules for meeting external regulatory requirements
Consistently High Adoption Rates Indication of product and service quality, i.e. customer satisfaction.
Consolidated Orders The process of analyzing orders to determine the groupings that result in least cost/best service fulfillment and transportation.
Consolidated Product Packages and lots that move from suppliers to a carrier terminal and are sorted and then combined with similar shipments from other suppliers for travel to their final destination.
Continuous Improvement Process A process that identifies opportunities for performance improvement and facilitates their realization through the use of metrics, process development methodologies/approaches, project management principles, and reporting tools that support strategic and business plans.
Contract Carrier Rates The rates charged by a carrier that does not serve the general public, but provides transportation for hire for one or a limited number of shippers under a specific contract.
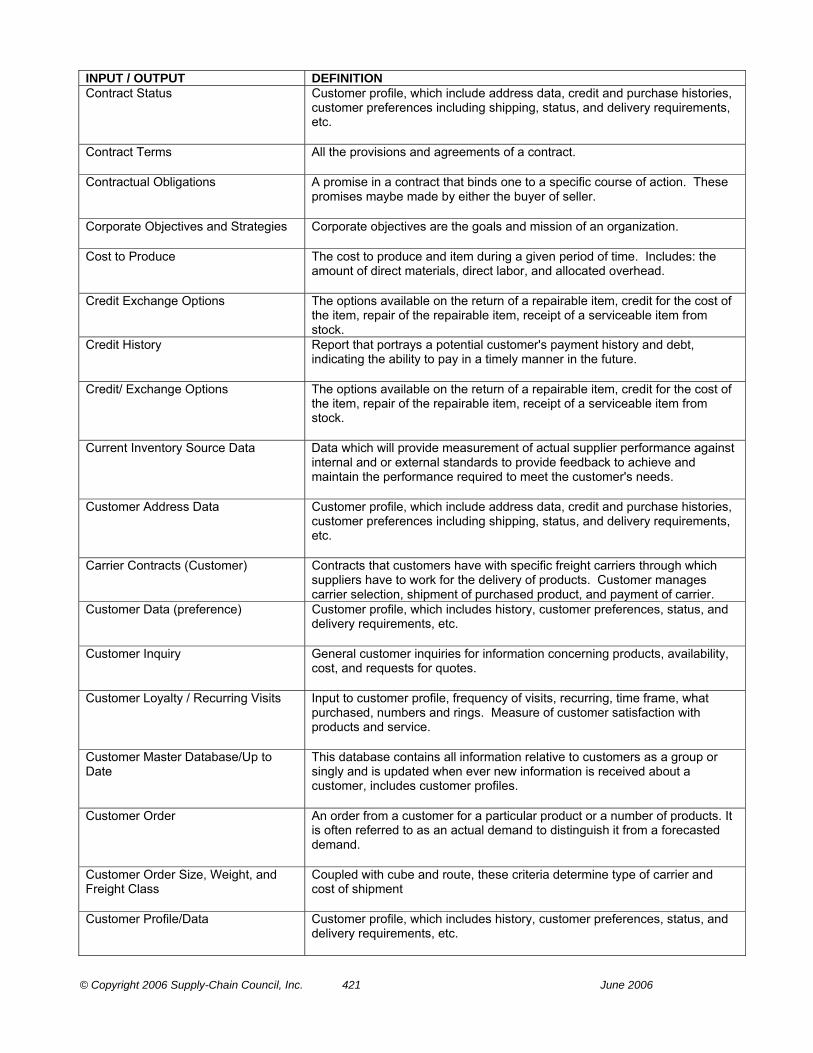
© Copyright 2006 Supply-Chain Council, Inc. 421 June 2006
INPUT / OUTPUT DEFINITION Contract Status Customer profile, which include address data, credit and purchase histories,
customer preferences including shipping, status, and delivery requirements, etc.
Contract Terms All the provisions and agreements of a contract.
Contractual Obligations A promise in a contract that binds one to a specific course of action. These promises maybe made by either the buyer of seller.
Corporate Objectives and Strategies Corporate objectives are the goals and mission of an organization.
Cost to Produce The cost to produce and item during a given period of time. Includes: the amount of direct materials, direct labor, and allocated overhead.
Credit Exchange Options The options available on the return of a repairable item, credit for the cost of the item, repair of the repairable item, receipt of a serviceable item from stock.
Credit History Report that portrays a potential customer's payment history and debt, indicating the ability to pay in a timely manner in the future.
Credit/ Exchange Options The options available on the return of a repairable item, credit for the cost of the item, repair of the repairable item, receipt of a serviceable item from stock.
Current Inventory Source Data Data which will provide measurement of actual supplier performance against internal and or external standards to provide feedback to achieve and maintain the performance required to meet the customer's needs.
Customer Address Data Customer profile, which include address data, credit and purchase histories, customer preferences including shipping, status, and delivery requirements, etc.
Carrier Contracts (Customer) Contracts that customers have with specific freight carriers through which suppliers have to work for the delivery of products. Customer manages carrier selection, shipment of purchased product, and payment of carrier.
Customer Data (preference) Customer profile, which includes history, customer preferences, status, and delivery requirements, etc.
Customer Inquiry General customer inquiries for information concerning products, availability, cost, and requests for quotes.
Customer Loyalty / Recurring Visits Input to customer profile, frequency of visits, recurring, time frame, what purchased, numbers and rings. Measure of customer satisfaction with products and service.
Customer Master Database/Up to Date
This database contains all information relative to customers as a group or singly and is updated when ever new information is received about a customer, includes customer profiles.
Customer Order An order from a customer for a particular product or a number of products. It is often referred to as an actual demand to distinguish it from a forecasted demand.
Customer Order Size, Weight, and Freight Class
Coupled with cube and route, these criteria determine type of carrier and cost of shipment
Customer Profile/Data Customer profile, which includes history, customer preferences, status, and delivery requirements, etc.

© Copyright 2006 Supply-Chain Council, Inc. 422 June 2006
INPUT / OUTPUT DEFINITION Customer Quote A statement of price, terms of sale, and description of goods or services
offered by a supplier to a prospective purchaser; a bid. When given in response to an inquiry, it is usually considered an offer to sell.
Customer Replenish Signal A requirement for product from a distribution location to a source location. Customer Requirements The part of the supply chain requirements related to the customer's needs,
including sales forecasts and actual orders and backorders
Customer Service Requirements Supply chain requirements related to the customer's needs, including service requirements, sales forecasts and actual orders/backorders.
Daily Replenishment Requirements Resources needed to meet Item stocking schedule requirement.
Daily Shipment Volume Daily Shipment Volume categorized by customer, source, traffic lane, carrier, etc.
Data About Return Capabilities Information required in the process of integrating and maintaining the accuracy of return execution.
Data Cleansing Procedure The procedure that outlines the cleansing of return data to insure its validity and accuracy during the return process.
Data System Requirements List of requirements of the data system that insure cleansed data is compatible and usable, or the data system requirements to fully automate the return process.
DC/Vendor Lead Time The amount of time that normally elapses between the time an order is received and the time the order is shipped.
DC/Vendor Transit Time A standard allowance that is assumed on any given order for the movement of items from one operation to the next.
Defective Product Disposition Request
The customer request for disposition instructions for a defective product from the appropriate source.
Defective Product Return Authorization Request
The customer request for disposition instructions for a defective product from the appropriate source.
Defective Product Return Authorization Response
The approved or disapproved Return Product Authorization (RPA) for excess inventory, unserviceable products and/or serviceable or obsolete products as defined by the terms and conditions of a customer/supplier contract.
Defective Products Maintenance, Repair and Overhaul spare parts used to support of operations and maintenance.
Deliver Contract Terms The process of making a delivery commitment. For make-to-order products, this usually involves a check of uncommitted material and availability of capacity, often as represented by the master schedule available-to-promise.
Deliver Return Requirements A determination or projection of the requirements the supply chain must meet in the handling and execution of returns. (i.e. quantity, mix, timing)
Delivered End Items Products that have been acknowledged as received by the customer. Delivery Date Those stocks or items on hand used to support production (raw materials
and work in process items), supporting activities (maintenance, repairs and operating supplies), and customer service (finished goods and spare parts). Determination of the time required from the receipt of the order until the item should be delivered.

© Copyright 2006 Supply-Chain Council, Inc. 423 June 2006
INPUT / OUTPUT DEFINITION Delivery Performance The process of measuring actual supplier performance against internal
and/or external standards, providing feedback to achieve and maintain the performance required to meet the customers' business and/or competitive needs.
Delivery Plans A plan for a course of action over specified time periods that involves a projected appropriation of supply resources to meet delivery requirements.
Delivery Requirements As a whole with constituent parts, all sources of demand in the delivery of a product or service.
Delivery Resources and Capabilities As a whole with constituent parts, all things that add value in the delivery of a product.
Duty Drawback Claims Claims for the refund of duties as a result of a ruling by the a government agency.
Engineering Design Final drawings, specifications, formulas, part programs, etc.that describe requirements of a product. The design process consists of translating a set of functional requirements into an operational product, process, or service.
Enterprise Distribution Model Model of the distribution enterprise including the flows, processes, inputs, outputs, metrics, and best business practices.
EOQ/ESQ's Economic Order Quantity - Result of a calculation that determines the most cost effective to quantity to order or produce. Economic Shipping Quantity - Result of a calculation that determines the most cost effective quantity to ship.
Equipment and Facilities Characteristics
Equipment and facility traits and specifications required to meet external entities requirements.
Equipment and Facilities Maintenance History
The process of documenting of the timing and maintenance of equipment and facilities including required repairs, alterations, calibration, servicing, replacement of parts and other miscellaneous items to maintain production capability of the manufacturing fixed asset base
Equipment and Facilities Monitoring Information
Data gathered by measuring, examining, testing, or gauging one or more characteristics of equipment and facilities and comparing it to planned.
Equipment and Facilities Replacement and Disposition Plans
Actions relating to the planning, financing and disposition of capital outlays for such purposes as the purchase of new equipment, the introduction of new product lines, and the modernization of plant facilities
Equipment and Facilities Schedules and Plans
Time-phased plans of present and future load (capacity required) on all resources (Equipment and Facilities) based on the planned and released supply authorizations (i.e., orders) and the planned capacity (capacity available) of these resources over a span of time.
ETO Proposal A proposal that may contain final drawings, specifications, formulas, part programs, etc.that describe requirements of a product
ETO Request for Proposal A document used to solicit vendor responses when the functional requirements and features are known.
ETO Spec or Design A clear, complete and accurate statement or drawing of the technical requirements of a material, item or service, and of the procedure to determine if the requirements are met.
Excess Product Disposition Request Request disposition instructions for an excess item from the Supplier.
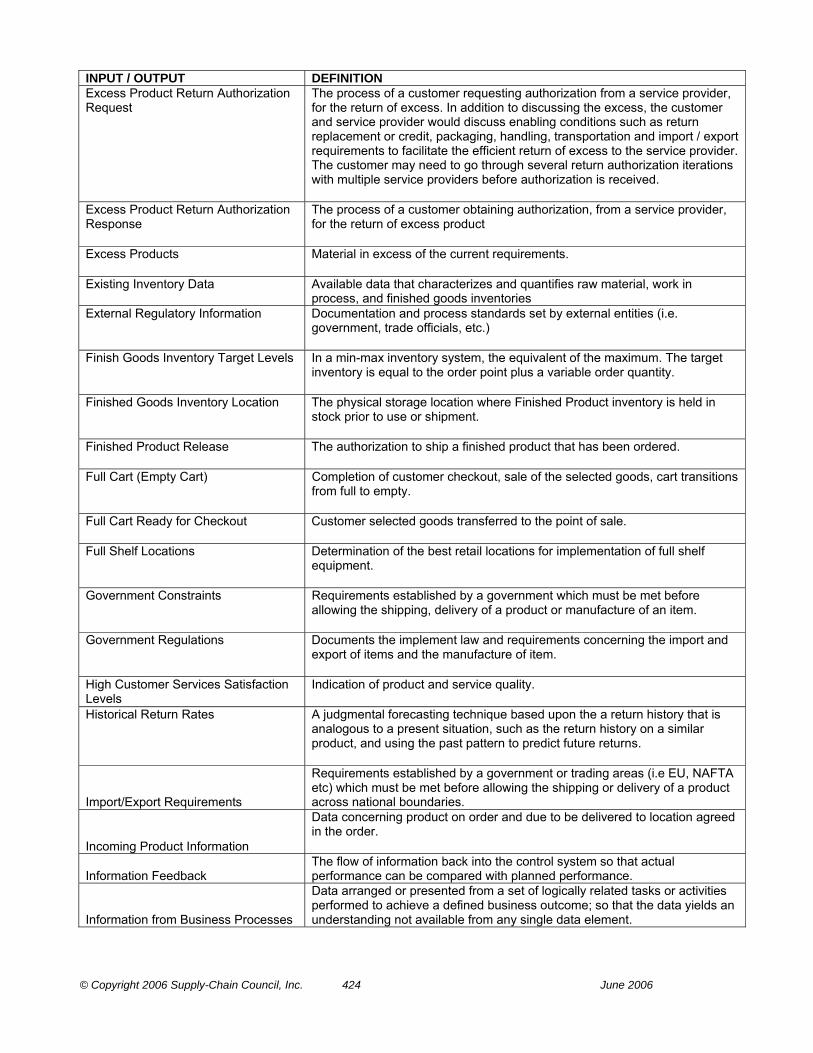
© Copyright 2006 Supply-Chain Council, Inc. 424 June 2006
INPUT / OUTPUT DEFINITION Excess Product Return Authorization Request
The process of a customer requesting authorization from a service provider, for the return of excess. In addition to discussing the excess, the customer and service provider would discuss enabling conditions such as return replacement or credit, packaging, handling, transportation and import / export requirements to facilitate the efficient return of excess to the service provider. The customer may need to go through several return authorization iterations with multiple service providers before authorization is received.
Excess Product Return Authorization Response
The process of a customer obtaining authorization, from a service provider, for the return of excess product
Excess Products Material in excess of the current requirements.
Existing Inventory Data Available data that characterizes and quantifies raw material, work in process, and finished goods inventories
External Regulatory Information Documentation and process standards set by external entities (i.e. government, trade officials, etc.)
Finish Goods Inventory Target Levels In a min-max inventory system, the equivalent of the maximum. The target inventory is equal to the order point plus a variable order quantity.
Finished Goods Inventory Location The physical storage location where Finished Product inventory is held in stock prior to use or shipment.
Finished Product Release The authorization to ship a finished product that has been ordered.
Full Cart (Empty Cart) Completion of customer checkout, sale of the selected goods, cart transitions from full to empty.
Full Cart Ready for Checkout Customer selected goods transferred to the point of sale.
Full Shelf Locations Determination of the best retail locations for implementation of full shelf equipment.
Government Constraints Requirements established by a government which must be met before allowing the shipping, delivery of a product or manufacture of an item.
Government Regulations Documents the implement law and requirements concerning the import and export of items and the manufacture of item.
High Customer Services Satisfaction Levels
Indication of product and service quality.
Historical Return Rates A judgmental forecasting technique based upon the a return history that is analogous to a present situation, such as the return history on a similar product, and using the past pattern to predict future returns.
Import/Export Requirements
Requirements established by a government or trading areas (i.e EU, NAFTA etc) which must be met before allowing the shipping or delivery of a product across national boundaries.
Incoming Product Information
Data concerning product on order and due to be delivered to location agreed in the order.
Information Feedback The flow of information back into the control system so that actual performance can be compared with planned performance.
Information from Business Processes
Data arranged or presented from a set of logically related tasks or activities performed to achieve a defined business outcome; so that the data yields an understanding not available from any single data element.

© Copyright 2006 Supply-Chain Council, Inc. 425 June 2006
INPUT / OUTPUT DEFINITION
Information Infrastructure Plan
A plan outlining the processes required for managing, collecting, maintaining, and communicating information and masterdata to support planning and execution processes.
Information Needed to Create and Maintain IT
Interrelated computer hardware and software along with people and processes designed for the collection, processing, and dissemination of information for planning, decision making, and control.
Information Needs Analysis
Specifying the inputs, files, processing, businesss rules and outputs for a new system, but without expressing computer alternatives and technical details.
Installed Product
The process of preparing, testing and installing the product at the customer site. The standalone product is fully functional upon completion, but there may be requirment for subseqent integration.
Integrated Supply Chain Plan
Communication of courses of action over the appropriate time-defined planning horizon and interval, representing a projected appropriation of supply chain resource and input material to meet supply-chain requirements as they affect the customer.
Internal Capacity The organic capability of an organization to produce output per time period.
Inventory
In business management, inventory consists of a list of goods and materials held available in stock. Also, those stocks or items used to support production (raw materials and work-in-process items), supporting activities (maintenance, repair, and operating supplies), and customer service (finished goods and spare parts)
Inventory Availability
Those stocks or items on hand used to support production (raw materials and work in process items), supporting activities (maintenance, repairs and operating supplies), and customer service (finished goods and spare parts).
Inventory Availability/Delivery Date
Those stocks or items on hand used to support production (raw materials and work in process items), supporting activities (maintenance, repairs and operating supplies), and customer service (finished goods and spare parts). Determination of the time required from the receipt of the order until the item should be delivered.
Inventory Capacity Maximum rate of output for the inventory managment and warehouse process
Inventory in Stock Stored products or service parts ready for sale, as distinguished from stores, which are usually components or raw materials.
Inventory Rules
The rules that determining the desired levels of items, whether raw materials, work in process, or finished products including order quantities and safety stock levels.
Inventory Status
A periodic report showing the inventory on hand and usually showing the inventory on order and some sales or usage history for the products that are covered in the stock status report.
Inventory Strategy
The total supply chain inventory strategy. Contains the plan for total inventory limits or levels (including Raw Material, Work In Process, Finished and Purchased Finished Goods) including replenishment models, ownership, product mix, and stocking locations, both inter and intra company.
Item Master
A record of specific information for each product, which defines the system parameters with which to effectively plan and execute using ERP (MRP, etc) systems.
Item Pick Sheet for Stocking Schedule
A document that lists the material to be picked to meet the schedule for the planned movement of material from a bulk storage area to an order pick storage area.
Item Stocking Requirements
The activities and techniques of determining the desired levels of items, whether raw materials, work in process, or finished products. Demand for inventory maybe dependant or independent. Inventory functions are anticipation, hedge, cycle (lot size), fluctuation (safety, buffer or reserve), transportation (pipeline), an service parts.
Load Information Information relative to a load that is built and shipped, i.e. customer, items, destinations, weight, etc

© Copyright 2006 Supply-Chain Council, Inc. 426 June 2006
INPUT / OUTPUT DEFINITION
Load, Shipping, Verify, and Credit Information
The function that performs tasks for the outgoing shipment of parts, components, and products. It includes packaging, marking, weighing, and loading for shipment. Also, verify the shipment and customer credit information.
Loaded Retail Cart or Pallet Customer selected retail finished goods transferred to the point of sale.
Location of Customers
Customer profile, which includes address and location data, credit and purchase histories, customer preferences including shipping, status, and delivery requirements, etc.
Logistics Selection Carrier selection and management for inbound or outbound shipments (linked to terms of delivery)
Lost or Dropped Shopping Carts
On-line orders that are missing due to internet, software, or hardware malfunctions.
Low Rates of Failure Indication of quality in workmanship and design. Loyalty Customer Profile Changes More units, higher average ring, etc.
Make/Buy Decision
The output of the process used to determine whether a demand will be supplied with internal capacity or purchased through contract manufacturing and/or contracted services externally.
Manage Integrated Supply Chain Inventory Information
Managing the flow of raw materials and products in a supply chain based on uncertain demand for the finished products
Manage Regulatory Return Policy The process of identifying and complying with regulatory documentation and process standards set by external entities (i.e. government, trade officials, etc.) when planning for the Return and Recovery of Assets.
Management Process Reports Reports which provide management with the process information required to evaluate prescribed activities to ensure that the stated objectives of a project, manufactured good, or service are achieved.
Manufacturer's Recommended Maintenance Schedules & Specifications
The scheduled activities, including adjustments, replacements, and basic cleanliness, that are recommended by the manufacturer to forestall machine breakdowns.
Markdown Plans Part of the Market Plan, which establishes an allowance or deduction, granted by the seller to the buyer, usually when the buyer meets certain stipulated conditions that reduce the price of the products purchased. For example, based upon paying early, buying in quantity, etc.
Merchandise Category/Classification The categorization of goods based upon the range of specifications met during the manufacturing process.
Merchandising Plan (SUPPLIER) The merchandising plan includes the current market position, opportunity and issue analysis, merchandising objectives and strategies, action plans, programs, projects, budgets, and pro forma profit and loss statement and management controls.
Methods, Procedures, Processes Methods, procedures and processes required to produce distinct items, such as parts that retain their identity through the transformation process and are intended to be completed after receipt of a customer order, including custom products that are designed, developed, and produced in response to a specific customer request.
MRO Disposition Request Request disposition instructions for an MRO item from the Supplier.
MRO Parts Availability The on-hand MRO inventory balance minus allocations, reservations, backorders, and (usually) quantities held for quality problems.
MRO Product Return Capabilities See “Product Return Capagilities” MRO Products Maintenance, Repair and Overhaul spare parts used to support of operations
and maintenance.

© Copyright 2006 Supply-Chain Council, Inc. 427 June 2006
INPUT / OUTPUT DEFINITION MRO Return Authorization Request The process of a customer requesting authorization from a service provider,
for the return of an MRO product. In addition to discussing the MRO issue, the customer and service provider would discuss enabling conditions such as return replacement or credit, packaging, handling, transportation and import / export requirements to facilitate the efficient return of the MRO product to the service provider. The customer may need to go through several return authorization iterations with multiple service providers before authorization is received.
MRO Return Authorization Response The process of a customer obtaining authorization, from a service provider, for the return of an MRO product
On-demand Replenishment Requirements
Requirements for the triggering of material movement to a work center only when that work center is ready to begin the next job.
On-Order/Backorder An unfilled customer order or commitment. A backorder is an immediate (or past due) demand against an item whose inventory is insufficient to satisfy the demand.
Optional Payment Payment at the time of order, maybe partial or in full. Order Backlog Orders that have been received and entered into the order processing
system and are in a queue waiting to be processed and shipped. Order Information The function encompasses receiving and entering all data necessary on
orders, so the order can be finalized and entered into the order system. Order Quote (CUSTOMER) A statement of price, terms of sale, and description of goods or services
offered by a supplier to a prospective purchaser; a bid. When given in response to an inquiry, it is usually considered an offer to sell.
Order Rules Rules for the function that encompasses receiving, entering, and promising orders from customers, distribution centers, and interplant operations.
Order Signal Reserved inventory and/or planned capacity and delivery date for a specific order.
Outsource Plan A plan that describes how a company will utilize third party business partners to provide products and services which the company chooses not to provide with internal capacity. Outsource Plans can vary in detail from simple policy statements to highly detailed plans with specifics about the third party business partners, specifications for products and services, performance expectations, and contract considerations.
Parts and Services Consumed The items and services utilized to manufacture a product. Payment Receipt of payment for goods and services per contract or purchase order. Payment Terms The process of authorizing payments and paying suppliers for product or
services. This process includes invoice collection, invoice matching and the issuance of checks.
Plan and Build Loads Information Transportation modes are selected and efficient loads are built. Planning Data Execution information necessary to plan the balance of supply chain
resources to demand requirements at both the highest aggregate and lowest SKU planning levels.
Planning Decision Policies Any company policies that affect how a planning process is defined, approved, and performed.
Plan-o-gram Data Data required to develop and build a Plan-O-Gram display to help minimize setup time by showing specific placement of all items, by product number, on the display.
Point of Sale Data (Daily) The relief of inventory and computation of sales data at the time and place of the sales, generally (may be manual) through the use of bar-coding, or magnetic media and equipment.
Preventative Maintenance and Calibration Schedule
Planned and scheduled activities, including adjustments, replacements, and basic cleanliness, that forestall machine and facility breakdowns. Also, the established frequency to change and maintain parts, based on failure consequences, with frequency set per part or machine type. (Well cared for equipment and facilities will last longer and cause fewer problems.)
Process Procedures A planned series of actions or operations that advances returns from one stage to another, or established procedures to manage and execute all activities in the process.

© Copyright 2006 Supply-Chain Council, Inc. 428 June 2006
INPUT / OUTPUT DEFINITION Procurement Signal (Supplier) Any signal that indicates when to produce or transport Items in a pull
replenishment system, or the signal that sends the estimated need of parts or services to the supplier.
Product The end object of a transformation process that includes physical objects, information or services.
Product Availability Availability of a product by location that is reserved, scheduled or available for sale, or the number of products ready to be or planned to be shipped to the specific customer or market at the specific time.
Product Data (linked/related SKU's) The properties and characteristics of a product (e.g. the part number and a text description of the product) and the relationships to other items in the product family and linked / related SKU's.
Product Design The product design is the translation of a set of functional requirements into an operational product that meets both the enterprise and customer expectations.
Product Design/Claims The product design is the translation of a set of functional requirements into an operational product that meets both the enterprise and customer expectations. Claims are marketing information provided as to performance, etc. Claims from the users of the product indicate a need to change the product design
Product Design/Quality A product design approach that uses quality measures to capture the extent to which the design meets the needs of the target market (customer attributes), as well as its actual performance, aesthetics, and cost.
Product Inventory Location The physical storage location where product inventory is held in stock prior to use or shipment.
Product Inventory Target Levels The target for the total product inventory, including e.g. raw material, work in progress and finished goods.
Product Location Information Attributes of the product's storage location. Product Mix and Plans The proportion of individual products that make up the total production or
sales volume and plan that authorizes the factory to manufacture a certain quantity of a specific item, or the portfolio of products the company has to cover the targeted customer need and the plans of how to manage that portfolio.
Product On Order Product on order with a selected source. Product Requirements As a whole with constituent parts, all sources of demand for a product or
service in the supply chain. Product Return Capabilities The capability of a system or resources to produce a quantity output in a
particular time period; and, any element or factor that constrains the system or resources from achieving a higher level of performance in respect to its goal. The ability the supply chain has to return products in a valid and accurate way.
Product Routings Product routings represent the way products are made and are integrated with the Bill of Materials. Key elements of proper Routings include proper sequence of operations, work center identification, relevant tolerances, run times, lot size and setups. The equivalent concepts for services are the workflow processes and rules.
Product Sources As a whole with constituent parts, all material and other resources used to add value in the supply chain for a product or services.
Product/Category Lifecycle The time from initial research and development to the time at which the sales and support of the product to customers are withdrawn.
Production Capacity (JN list calls Capability)
The highest, sustainable output rate which can be achieved with the current product specifications, product mix, worker effort, plant, and equipment.
Production Orders Planned A statement of the output of a production facility for a specified period, comparing planned to actual production.
Production Plans A master production plan used to allocate capacity among manufacturing resources and schedule finite manufacturing activities or executing the performance of a service. Production Plan includes production capability.

© Copyright 2006 Supply-Chain Council, Inc. 429 June 2006
INPUT / OUTPUT DEFINITION Production Quality and Policies The operational techniques and planned and systematic activities used to
fulfill requirements for quality in the production process, or the quality of the production, as defined by the company. For example, a percentage of parts produced without a need for adjustment or repair. The production policy indicates standard rules on how the production quality should be secured.
Production Resources As a whole with constituent parts, all things that add value in the creation of a product or performance of a service.
Production Rules The rules directing or regulating the movement of goods through the entire manufacturing and repair cycle (parameters of production) from the requisitioning of raw material to the delivery of the finished products.
Production Schedule A plan that authorizes the factory to manufacture or repair a certain quantity of a specific item.
Production Status Feedback on the production schedule allowing for corrective action to a production problem, or an indication of how far in the production process a specific part has progressed
Projected Delivery Requirements The company's goal for the time to ship the product after the receipt of a customer's order. The policy is sometimes stated as "our quoted delivery time," or an estimate of the customer delivery requirements of a product or service, e.g. which kind of packaging, should the parts be shipped one by one or in bulks etc.
Projected Internal and External Capacity
An estimate of the amount of product or service a particular part of the business (internal capacity) or a third party business partner (external capacity) is capable of producing over a particular period of time when all factors that control the production processes are working optimally.
Promotion Event Calendar Time phased promotion / event tasks where the product offering is communicated to the customer and includes public relations, advertising, sales promotions, and other tools to persuade customers to purchase the product offering during the year.
Promotion/Event Plans Promotion activities - other than advertising, publicity, and personal selling - that stimulate, interest, trial or purchase by final customers or others in the marketing channel.
Promotional Plan The plan for a promotional product offering and how it is communicated to the customer and includes public relations, advertising, sales promotions, and other tools to persuade customers to purchase the product offering
Purchase History The amount of purchased products for a certain time in history per specific intervals
Quality and Delivery Performance The process of measuring actual supplier performance against internal and/or external standards, providing feedback to achieve and maintain the performance required to meet the customers' business and/or competitive needs. Or, the extent to which the supplier delivers according to quality specification (e.g. product quality, logistic quality) and to delivery specification (in time, correct packaging etc). Sometimes these two metrics are connected in one.
Rated Carrier Data Contract rates and tariffs from carriers by commodity, lane, mode, etc. for shipments.
Rated Shipments Shipments subject to defined and established rates Receipt Data A collection of related receipt data records organized in a specific manner. Receipt Discrepancy Notification Notification of a discrepancy relating to a receipt, including: damage,
packaging, quantity, etc. Receipt Verification Acknowledgement that the product received conforms to specified
requirements and criteria. Regulatory Requirements Requirements dictated by process standards set by external entities (i.e.
government, trade officials, etc.). Replenishment Quantities In a fixed-reorder quantity system of inventory control, the fixed quantity that
should be ordered each time the available stock (on-hand plus on-order) falls to or below the reorder point.
Replenishment Signal Any signal that indicates when to produce or transport Items in a pull replenishment system.
Reports, Information, and Documents Collecting data and organizing, arranging or presenting the data so that they yield an understanding not available from any single data element.
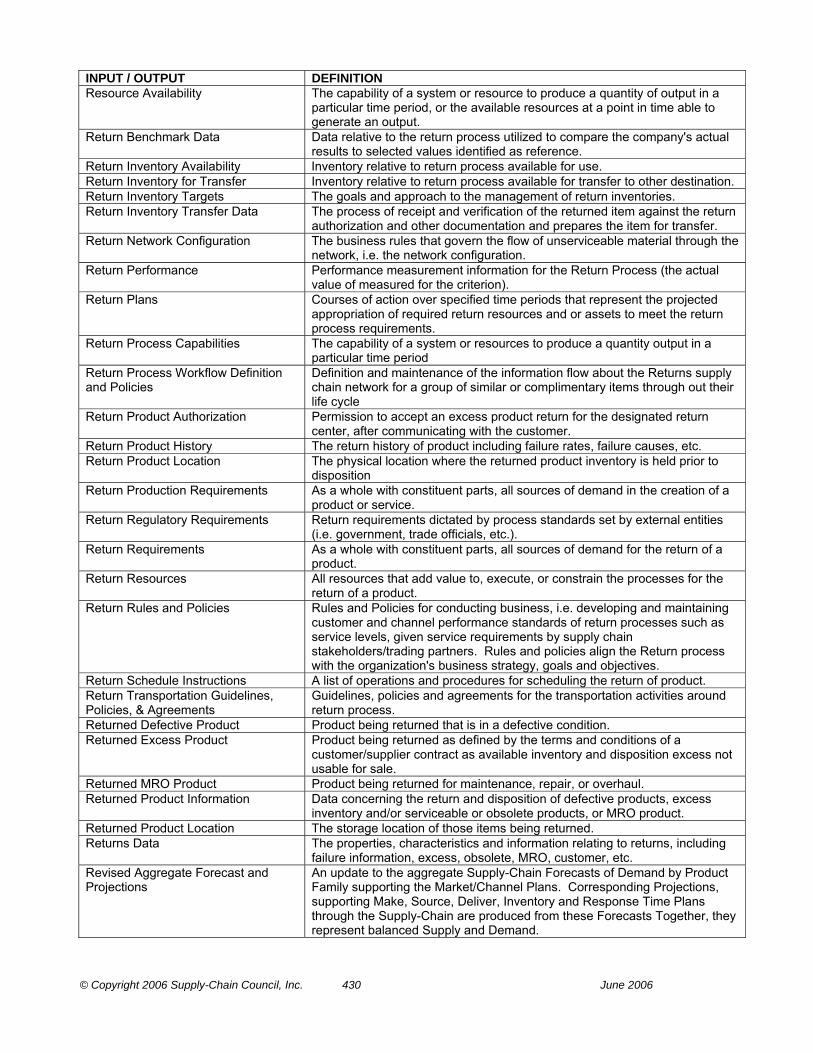
© Copyright 2006 Supply-Chain Council, Inc. 430 June 2006
INPUT / OUTPUT DEFINITION Resource Availability The capability of a system or resource to produce a quantity of output in a
particular time period, or the available resources at a point in time able to generate an output.
Return Benchmark Data Data relative to the return process utilized to compare the company's actual results to selected values identified as reference.
Return Inventory Availability Inventory relative to return process available for use. Return Inventory for Transfer Inventory relative to return process available for transfer to other destination. Return Inventory Targets The goals and approach to the management of return inventories. Return Inventory Transfer Data The process of receipt and verification of the returned item against the return
authorization and other documentation and prepares the item for transfer. Return Network Configuration The business rules that govern the flow of unserviceable material through the
network, i.e. the network configuration. Return Performance Performance measurement information for the Return Process (the actual
value of measured for the criterion). Return Plans Courses of action over specified time periods that represent the projected
appropriation of required return resources and or assets to meet the return process requirements.
Return Process Capabilities The capability of a system or resources to produce a quantity output in a particular time period
Return Process Workflow Definition and Policies
Definition and maintenance of the information flow about the Returns supply chain network for a group of similar or complimentary items through out their life cycle
Return Product Authorization Permission to accept an excess product return for the designated return center, after communicating with the customer.
Return Product History The return history of product including failure rates, failure causes, etc. Return Product Location The physical location where the returned product inventory is held prior to
disposition Return Production Requirements As a whole with constituent parts, all sources of demand in the creation of a
product or service. Return Regulatory Requirements Return requirements dictated by process standards set by external entities
(i.e. government, trade officials, etc.). Return Requirements As a whole with constituent parts, all sources of demand for the return of a
product. Return Resources All resources that add value to, execute, or constrain the processes for the
return of a product. Return Rules and Policies Rules and Policies for conducting business, i.e. developing and maintaining
customer and channel performance standards of return processes such as service levels, given service requirements by supply chain stakeholders/trading partners. Rules and policies align the Return process with the organization's business strategy, goals and objectives.
Return Schedule Instructions A list of operations and procedures for scheduling the return of product. Return Transportation Guidelines, Policies, & Agreements
Guidelines, policies and agreements for the transportation activities around return process.
Returned Defective Product Product being returned that is in a defective condition. Returned Excess Product Product being returned as defined by the terms and conditions of a
customer/supplier contract as available inventory and disposition excess not usable for sale.
Returned MRO Product Product being returned for maintenance, repair, or overhaul. Returned Product Information Data concerning the return and disposition of defective products, excess
inventory and/or serviceable or obsolete products, or MRO product. Returned Product Location The storage location of those items being returned. Returns Data The properties, characteristics and information relating to returns, including
failure information, excess, obsolete, MRO, customer, etc. Revised Aggregate Forecast and Projections
An update to the aggregate Supply-Chain Forecasts of Demand by Product Family supporting the Market/Channel Plans. Corresponding Projections, supporting Make, Source, Deliver, Inventory and Response Time Plans through the Supply-Chain are produced from these Forecasts Together, they represent balanced Supply and Demand.

© Copyright 2006 Supply-Chain Council, Inc. 431 June 2006
INPUT / OUTPUT DEFINITION Revised Business Assumptions An update to the expected cause and effect statements that are the base for
the Revised Aggregate Forecast and Projections. These are reviewed periodically with actual results to verify the linkage of actual cause and effect.
Revised Capital Plan A revision to plan for capital expenditures necessitated by either changes in specific business plans or factors and assumptions affecting a business plan.
RFQ/RFP Request for Quote - A document used to solicit vendor responses when a product has been selected and price quotations are needed from several vendors. Request for Proposal - A document used to solicit vendor responses when the functional requirements and features are known but no specific product is in mind.
Routing Guide Information used to select modes, transportation lanes, available carriers, etc. Listing or routes, carriers & rates.
Satisfied Customer Customers who are satisfied with the product or service delivered by the suppliers, including the aspects such as time, quality, cost, etc.
Scheduled Defective Product Return Planned or scheduled returning of material deemed defective for some certain time or times
Scheduled Deliveries The required or agreed time or rate of delivery of goods or services purchased for a future period.
Scheduled Excess Product Return Planned or scheduled returning of material deemed in excess of current requirements for some certain time or times.
Scheduled Installation The process of evaluating the design and build schedules relative to customer requested installation date to determine installation schedule.
Scheduled MRO Return Planned or scheduled act of installing something for some certain time or times.
Scheduled Receipts Product due to arrive. Scrap Authorization Permission to scrap material or item outside of specifications and possessing
characteristics that make rework impractical. Service Levels Performance targets in service related measures (i.e. delivery performance,
lead times, etc.) compared to the established service requirements. Service levels are established by balancing requirements against operational strategy.
Service Requirements A set of minimum acceptable values that describe service requirements of a particular industry, channel, and/or customer segment.
Shipment Documents Legal documentation of the contents of a shipment (e.g. way bill, bill of lading, export papers, etc....).
Shipment Routes Routes for shipping by consolidating loads. Shipments Transactions related to sending the product to the customer. Shipping Documents Legal documentation of the contents of a shipment (e.g. way bill, bill of
lading, export papers, etc....). Shipping Export Parameters and Documentation
Shipping and documentation requirements established by a government which must be met before allowing the shipping or delivery of a product across national boundaries.
Shipping History The transaction history of the physical shipment of an item to another internal location or to a customer.
Shipping Parameters and Documentation
Shipping parameters, such as weight, size, cube and route decide carrier and cost. Legal documentation of the contents of a shipment (e.g. way bill, bill of lading, export papers, etc.) are required.
Shipping Preferences (Customer) Customer preferences including shipping, status, and delivery requirements, etc., and customer profile, which includes address data, credit and purchase histories,
Shipping Schedules (internal or 3PL) Scheduling of direct deliveries of material to a specified location on a plant floor near the operation where it is to be used.
Ship-to Data Data about the destination of a retun delivery. Source Execution Data Data which will provide measurement of actual supplier performance against
internal and or external standards to provide feedback to achieve and maintain the performance required to meet the customer's needs.
Source Return Requirements All sources of demand in the Source Return of a product or service. Sourcing Plans An aggregate material requirements plan used to schedule material
deliveries to meet production plan.

© Copyright 2006 Supply-Chain Council, Inc. 432 June 2006
INPUT / OUTPUT DEFINITION Standard Practices/Rules Industry established common practices, rules, and methods of doing
business. Stocking Requirements The activities and techniques of determining the desired levels of items,
whether raw materials, work in process, or finished products. Demand for inventory may be dependant or independent. Inventory functions are anticipation, hedge, cycle (lot size), fluctuation (safety, buffer or reserve), transportation (pipeline), and service parts.
Stocking Schedule A timetable for the planned movement of material from a bulk storage area to an order pick storage area.
Stock-out History History of a lack of materials, components, or finished goods that are ordered.
Store Allocation Instructions A list of operations and procedures for allocating storage needs for items in inventory.
Store Shelf Inventory Counts The determination of inventory quantity by actual count. Physical inventories can be taken on a continuous, periodic or annual basis.
Strategic Plan A longer range, high-level plan that describes how a company intends to conduct business. Improve its market and competitive position, and increase its earnings performance.
Successful Installation / Live System The installation of product is completed at the customer site, and the product is fully functional.
Supplier Agreement An agreement between supplier and purchaser to perform or not to perform specific acts or services or to deliver merchandise, such as purchase order or supplier contract.
Supplier Data Data or information about the supplier. This data can be organizational , product, information , financial. Structured supplier data is needed to set up and implement ERP or similar systems.
Supplier Performance The results of measuring the actual supplier performance on cost, quality, engineering, purchasing, and so on, based on an agreed set of measurements.
Supply Chain Execution Data Information necessary to plan the balance of supply chain resources to demand requirements at both the highest aggregate and lowest SKU planning levels.
Supply Chain Performance Improvement Plan
A plan that describes goals and objectives for a supply chain and the steps that will be taken to reach those goals and objectives from the current performance levels.
Supply Chain Plans Courses of action over specified time periods that represent a projected appropriation of total supply-chain resources to meet total supply-chain demand requirements.
Supply Chain Requirements Sources of demand for the integrated supply chain of a product or service at the appropriate level, horizon and interval.
Supply Chain Resources As a whole with constituent parts, all sources of supply that are required to add value in the supply chain of a product or service at the appropriate level, horizon and interval.
Supply-Chain Performance Metrics Standard measures that indicate how well a supply chain performs within certain categories of performance known as Performance Attributes, e.g. delivery reliability, flexibility and responsiveness, cost, and asset management.
Systems Capability The capability of a system to perform its expected function Tariffs and Duties (External) Charges established by a government which must be met before allowing the
shipping or delivery of a product across national boundaries. Transferred Product Product being tranferred to the appropriate stocking location within the
supply chain. Transportation Capacity The capability of a trasportation system to perform it's function. Valid Returns Request Requests for returns that are valid. Validated Order An order that has had the instructions / requirements validated i.e. the
information that the order contains is accurate, consistent with previous information and does not violate business policies or rules. Note 1 - this does not make the order "committed" there may be other tasks to be performed before a commitment can be made. Note 2 - this order could be customer, internal, purchase or production.

© Copyright 2006 Supply-Chain Council, Inc. 433 June 2006
INPUT / OUTPUT DEFINITION Validated Return Material Authorization
A validated and approved Return Product Authorization (RPA).
Vendor Merchandising / Co-op advertising agreements
The plan for a promotional product offering and how it is communicated to the customer and includes public relations, advertising, sales promotions, and other tools to persuade customers to purchase the product offering.
Vendor/DC inventory availability Vendor/DC inventory available to a customer to supply demands. (Where the customer has access to the supplier's inventory and the supplier has access to the customer's requirements and inventory or vendor managed inventory).
Warehouse Operating Constraints Warehouse constraints are those storage items that impact on the supply chain efficiency, including material handling equipment and personnel, equipment maintenance, building maintenance, and security personnel.
Warranty Data All data relevant to a warranty claim for a customer for replacement, repair or credit because the product received did not meet a commitment, either expressed or implied, concerning a certain fact regarding the product
WIP Handling Rules, Move Information and Methods
The rules for handling WIP items in the production and repair process. These rules include the movement and accounting for in-process items between work locations, in inventory, and movement inventory.
WIP Inventory Location Location of inventory that is specified as "work in progress". This can be intermediate storage in a manufacturing facility prior to final packaging or can be a class of materials waiting final transformation to finished products.
WIP Location Rules The process and rules for establishing and maintaining in-process item inventory ownership and stocking locations.
WIP Move Information and Methods The process of recording and tracking the movement of WIP items through the production and repair process. This process includes item stocking and accounting requirements.
Year-to-Year for Like SKU/Subclass The sales or demand history that is analogous to the present situation for similar products, a SKU / Subclass.
© Copyright 2006 Supply-Chain Council, Inc. 434 June 2006
APPENDIX A METRICS Performance Attributes and Associated Level 1 Metrics
Performance Attribute Performance Attribute Definition Level 1 Metric Supply Chain Reliability
The performance of the supply chain in delivering: the correct product, to the correct place, at the correct time, in the correct condition and packaging, in the correct quantity, with the correct documentation, to the correct customer.
Perfect Order Fulfillment
Supply Chain Responsiveness
The speed at which a supply chain provides products to the customer.
Order Fulfillment Cycle Time
Upside Supply Chain Flexibility Upside Supply Chain Adaptability
Supply Chain Flexibility
The agility of a supply chain in responding to marketplace changes to gain or maintain competitive advantage. Downside Supply Chain Adaptability
Supply Chain Management Cost Supply Chain Costs The costs associated with operating the supply chain. Cost of Goods Sold
Cash-to-Cash Cycle Time Return on Supply Chain Fixed Assets
Supply Chain Asset Management
The effectiveness of an organization in managing assets to support demand satisfaction. This includes the management of all assets: fixed and working capital. Return on Working Capital
Performance Attributes and Level 1 Metrics Level 1 Metrics are primary, high level measures that may cross multiple SCOR processes. Level 1 Metrics do not necessarily relate to a SCOR Level 1 process (PLAN, SOURCE, MAKE, DELIVER, RETURN).
Performance Attributes Level 1 Metrics Customer-Facing Internal-Facing Reliability Responsiveness Flexibility Costs Assets Perfect Order Fulfillment x Order Fulfillment Cycle Time x Upside Supply Chain Flexibility x Upside Supply Chain Adaptability x Downside Supply Chain Adaptability
x
Supply Chain Management Cost x Cost of Goods Sold x Cash-To-Cash Cycle Time x Return on Supply Chain Fixed Assets
x Return on Working Capital x

© Copyright 2006 Supply-Chain Council, Inc. 435 June 2006
Key to Template for Appendix A Specification: This template was used to develop the hierarchical structure between SCOR level 1, 2, and 3 metrics. Metric Definition Intended to provide clear, concise, benchmarkable, definitions of the metric. Hierarchical Metric Structure These diagrams express the hierarchical structure of metrics from different levels by digraph. A causal link (arrow) from one metric A to another metric B means that metric A could affect metric B. For a level 1 metric, it needs to drill down to level 2 metrics. For a level 2 metric, it needs to drill down to level 3 metrics, and also, should roll up to level 1 metrics (dashed link). * The dashed line boxes represent optional metrics associated with the Level 3 processes. Qualitative Relationship Description If the relationships between metrics cannot clearly quantitatively expressed by mathematical equations, qualitative description of the relationships is required. Quantitative Relationship (optional, if calculable) Lists the quantitative relationships between metrics by mathematical equations, if calculable. Calculation Provides an operable method to calculate the metric, typically a formula. Data Collection Illustrates how to collect data for metric calculation. Discussion Additional descriptions which are necessary.
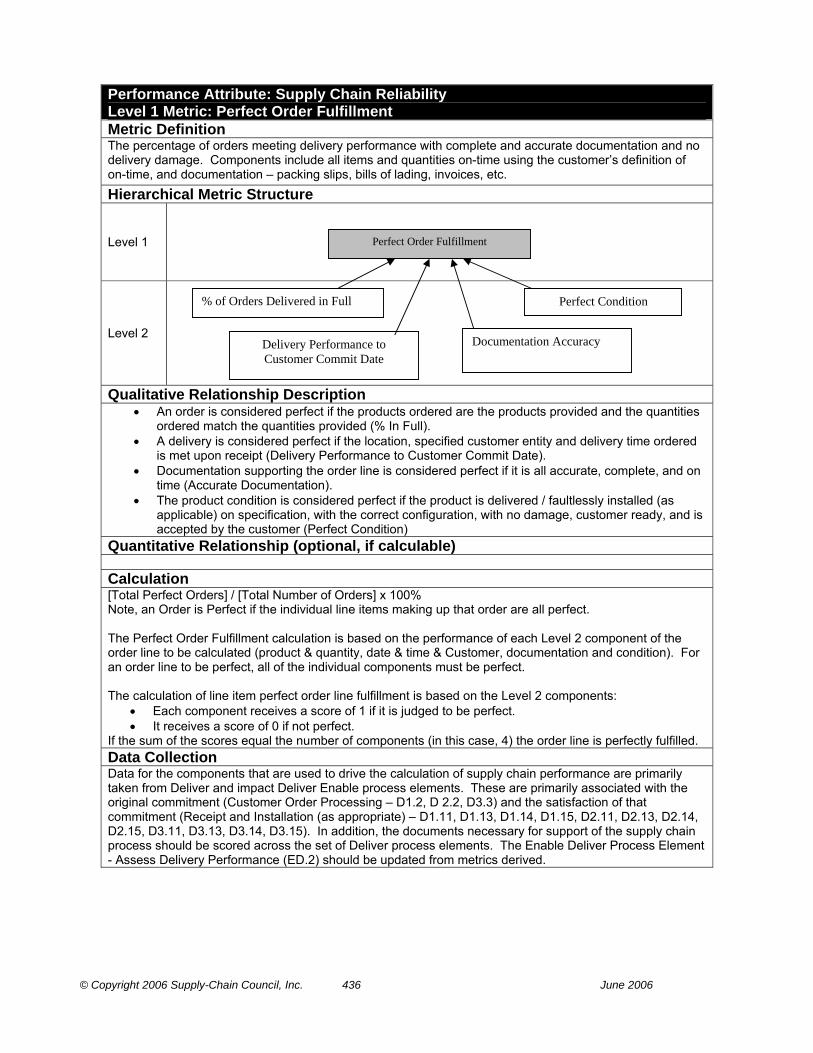
© Copyright 2006 Supply-Chain Council, Inc. 436 June 2006
Performance Attribute: Supply Chain Reliability Level 1 Metric: Perfect Order Fulfillment Metric Definition The percentage of orders meeting delivery performance with complete and accurate documentation and no delivery damage. Components include all items and quantities on-time using the customer’s definition of on-time, and documentation – packing slips, bills of lading, invoices, etc. Hierarchical Metric Structure
Level 1
Level 2
Qualitative Relationship Description • An order is considered perfect if the products ordered are the products provided and the quantities
ordered match the quantities provided (% In Full). • A delivery is considered perfect if the location, specified customer entity and delivery time ordered
is met upon receipt (Delivery Performance to Customer Commit Date). • Documentation supporting the order line is considered perfect if it is all accurate, complete, and on
time (Accurate Documentation). • The product condition is considered perfect if the product is delivered / faultlessly installed (as
applicable) on specification, with the correct configuration, with no damage, customer ready, and is accepted by the customer (Perfect Condition)
Quantitative Relationship (optional, if calculable) Calculation [Total Perfect Orders] / [Total Number of Orders] x 100% Note, an Order is Perfect if the individual line items making up that order are all perfect. The Perfect Order Fulfillment calculation is based on the performance of each Level 2 component of the order line to be calculated (product & quantity, date & time & Customer, documentation and condition). For an order line to be perfect, all of the individual components must be perfect. The calculation of line item perfect order line fulfillment is based on the Level 2 components:
• Each component receives a score of 1 if it is judged to be perfect. • It receives a score of 0 if not perfect.
If the sum of the scores equal the number of components (in this case, 4) the order line is perfectly fulfilled. Data Collection Data for the components that are used to drive the calculation of supply chain performance are primarily taken from Deliver and impact Deliver Enable process elements. These are primarily associated with the original commitment (Customer Order Processing – D1.2, D 2.2, D3.3) and the satisfaction of that commitment (Receipt and Installation (as appropriate) – D1.11, D1.13, D1.14, D1.15, D2.11, D2.13, D2.14, D2.15, D3.11, D3.13, D3.14, D3.15). In addition, the documents necessary for support of the supply chain process should be scored across the set of Deliver process elements. The Enable Deliver Process Element - Assess Delivery Performance (ED.2) should be updated from metrics derived.
Perfect Condition
Perfect Order Fulfillment
Delivery Performance to Customer Commit Date
% of Orders Delivered in Full
Documentation Accuracy

© Copyright 2006 Supply-Chain Council, Inc. 437 June 2006
Discussion The performance of the supply chain is considered “perfect” if the original commitment made to a customer is met through the supply chain. An order is defined as a collection of one or more order lines representing a request to deliver specified quantities of goods or to render specific services. The order can further be defined as a request (with a specific identifier as a reference) to deliver specified items or to render specific services with specific prices, dates, and quantities. Commitments are made to a customer at the order line level, where an order line is defined as a line representing a commitment on a sales order. An order line always references a product or service. For an order to be considered perfect the following standards must be met:
• Delivered complete; all items on the order line are delivered in the quantities specified • Delivered on time to the initial commitment date, using the customer’s definition of on-time delivery • Documentation supporting the order including packing slips, bills of lading, invoices, quality
certifications, etc., is complete and accurate • Faultlessly installed (as applicable), correct configuration, customer-ready and accepted, no
damage, on specification Orders canceled by the customer are excluded from the metric. Order changes initiated by the customer and agreed to by the supplier supersede initial commitments and form a new comparative basis for the metric. Often for date and quantity issues (and occasionally product), a range rather than a strict value is used. This is acknowledged as a standard practice; in those situations the standard measured is considered to be met perfectly if the range specified is satisfied. The term “customer-ready” for the perfect condition standard may imply a subjective component based on the customer’s satisfaction. Although condition may not be as rigorously measured as time or quantity it should be considered as a component if available, especially since this attribute measures performance of the supply chain which is, of course, ultimately measured by its customers. It should also be noted that a corresponding evaluation of suppliers’ performances could be determined by extending these standards to each supplier’s ability to source products.
© Copyright 2006 Supply-Chain Council, Inc. 438 June 2006
Performance Attribute: Supply Chain Reliability Level 2 Metric: % of Orders In Full Metric Definition Percentage of orders which all of the items are received by customer in the quantities committed
Hierarchical Metric Structure
Level 1
Level 2
Level 3
Qualitative Relationship Description An order is considered delivered “in full” if:
• All items ordered are the items actually provided, and no extra items are provided • All quantities received by the customer match the order quantities (within mutually agreed
tolerances) Quantitative Relationship (optional, if calculable) Calculation [Total number of orders delivered in full] / [Total number of orders delivered] x 100%
Data Collection Data for the components that are used to drive the calculation of % In Full are primarily associated with the original order processing step of ‘Reserve inventory and Determine Delivery Date’ (D1.3, D2.3 & D3.3), inventory availability (M1.1, M2.1, M3.1) including inventory location accuracy, (ED.4), and the satisfaction of that commitment through the shipment and customer receiving processes (D 1.12, D1.13, D2.12, D.2.13, D3.12, D3.13) Discussion Order quantities are based on item / quantity original commitments agreed to by the customer. Orders canceled by the customer are excluded from the metric. Order changes initiated by the customer and agreed to by the supplier supersede original commitments and form a new comparative basis for the metric. This metric has no “timing” element, such that orders deliberately split by the supplier should still be considered “in full” so long as all metric criteria are met. In some cases, such as for supplying bulk materials, committed quantities refer to a range that is acceptable to the customer rather than a strict value. Several SCOR diagnostic metrics exist that can be used to focus “% In Full” improvement efforts. Some of these include:
• % Orders Scheduled to Requested Quantity • Schedule Achievement • Yield variability • Planned Shipment Fill Rate (not yet defined) • % Stock Outs (not yet defined) • Inventory Cycle Count Accuracy (not yet defined)
Orders may not be filled completely to the customer’s original request quantity due to the inability to
Delivery Item Accuracy
% of Orders Delivered in Full
Delivery Quantity Accuracy
Perfect Order Fulfillment

© Copyright 2006 Supply-Chain Council, Inc. 439 June 2006
schedule to the initial request. Breakdown may also occur from the inventory availability (including stock outs for MTS and schedule achievement for MTO and ETO) and inventory location accuracy. Lastly, a deviation from the shipment plan may lead to inability to fulfill an order completely.

© Copyright 2006 Supply-Chain Council, Inc. 440 June 2006
Performance Attribute: Supply Chain Reliability Level 2 Metric: Delivery Performance to Customer Commit Date Metric Definition The percentage of orders that are fulfilled on the customer’s originally scheduled or committed date
Hierarchical Metric Structure
Level 1
Level 2
Level 3
Qualitative Relationship Description An order is considered delivered to the original Customer commitment date if:
• The order is received on time as defined by the customer • The delivery is made to the correct location and Customer entity
Quantitative Relationship (optional, if calculable) Calculation [Total number of orders delivered on the original commitment date] / [Total number of orders delivered] x 100% Data Collection Data for the components that are used to drive the calculation of Delivery Performance to Customer Commit Date are primarily associated with the original order processing step of ‘Reserve inventory and Determine Delivery date’ (D1.3, D2.3 & D3.3), and the satisfaction of that commitment through the shipment and customer receiving processes (D 1.12, D1.13, D2.12, D2.13, D3.12, D3.13). Discussion Order delivery performance from a timing perspective is based on original commitments agreed to by the customer. The acceptable window for delivering on time should be defined in the customer’ service level agreement. Orders canceled by the customer are excluded from the metric. Order changes impacting the timing of a delivery that are initiated by the customer and agreed to by the supplier supersede original commitments and form a new comparative basis for the metric. The original commitment date can refer to a range, rather than a strict date and time, that is acceptable to the customer (e.g. advanced shipments). This metric has no “In Full” element, such that partial deliveries can still be considered as meeting the Customer Commit Date so long as all metric criteria are met. Measuring the frequency of accepting the customer’s original request date, vs. commit date, can be an important measure of customer satisfaction. Several SCOR diagnostic metrics exist that can be used to focus delivery performance improvement efforts. Some of these include:
• % Orders Scheduled to Request • % Orders Shipped on time (not yet defined) • Carrier Performance Reliability (not yet defined)
Orders may not be delivered to the Customer Commit Date due to breakdowns in the order fulfillment and shipment process (e.g. Transportation availability). Orders may also be delivered late due to carrier delivery performance / issues.
Delivery Performance to Customer Commit Date
Customer Commit Date Achievement Time Customer Receiving
Perfect Order Fulfillment
Delivery Location Accuracy

© Copyright 2006 Supply-Chain Council, Inc. 441 June 2006
Performance Attribute: Supply Chain Reliability Level 2 Metric: Perfect Condition Metric Definition Percentage of orders delivered in an undamaged state that meet specification, have the correct configuration, are faultlessly installed (as applicable), and accepted by the customer
Hierarchical Metric Structure
Level 1
Level 2
Level 3
Qualitative Relationship Description An order is considered to be delivered in perfect condition if all items meet the following criteria:
• Undamaged • Meet specification and has correct configuration (as applicable) • Faultlessly installed (as applicable) and accepted by the customer • Not returned for repair or replacement (within the warranty period)
Quantitative Relationship (optional, if calculable) Calculation [ Number of orders delivered in Perfect Condition ] / [Number of orders delivered ] x 100%
Data Collection Data for the components that are used to drive the calculation of “Perfect Condition” are primarily associated with the receipt, installation (as applicable) and satisfaction of the order commitment (D1.13, D1.14, D2.13, D2.14, D3.13, D3.14). The Enable Deliver Process Element - Assess Delivery Performance (ED.2) should be updated to reflect this metric and its components. This data is typically available from a complaints, claims, or warranty/returns database.
Orders Delivered Damage Free Conformance
Perfect Condition
Warranty & Returns
% Faultless Installations
Perfect Order Fulfillment
Orders Delivered Defect Free Conformance
% Orders Received Damage Free

© Copyright 2006 Supply-Chain Council, Inc. 442 June 2006
Discussion This metric, calculated at the order level, assesses the quality of products delivered through the supply chain from the customer’s perspective. Justified and non-justified product quality issues, claims and returns within the warranty period are included and count against this metric. Improving this metric lowers the supply chain cost associated with claims and returns. Several SCOR diagnostic metrics exist that can be used to focus Perfect Condition improvement efforts. Some of these include:
• Cost of Noncompliance • Damage and Shrinkage • Scrap Expense • Warranty Costs • Yield Variability

© Copyright 2006 Supply-Chain Council, Inc. 443 June 2006
Performance Attribute: Supply Chain Reliability Level 2 Metric: Documentation Accuracy Metric Definition Percentage of orders with accurate documentation supporting the order, including packing slips, bills of lading, invoices, etc.
Hierarchical Metric Structure
Level 1
Level 2
Level 3
Qualitative Relationship Description An order is considered to have accurate documentation when the following are accepted by the customer:
• Shipping documentation • Payment documentation • Compliance documentation • Other required documentation
All documentation must be complete, correct, and readily available when and how expected by the customer, Government and other supply chain regulatory entities.
Quantitative Relationship (optional, if calculable) Calculation [Total number of orders delivered with accurate documentation] / [Total number of orders delivered] x 100% Document supporting the order includes:
• Shipping documentation: o Packing slips (Customers) o Bill of lading (Carriers) o Government or Customs documentation / forms
• Payment Documentation: o Invoice o Contractual outline agreement
• Compliance documentation o Material Safety Data Sheets
• Other required documentation o Quality certification
Shipping Documentation Accuracy
Documentation Accuracy
Perfect Order Fulfillment
Compliance Documentation Accuracy Other Required Documentation Accuracy
Payment Documentation Accuracy

© Copyright 2006 Supply-Chain Council, Inc. 444 June 2006
Data Collection Data for the components that are used to drive the calculation of Accurate Documentation are primarily associated with the Deliver processing step of ‘Load Product & Generate Shipping Documentation’ (D1.11, D2.11, D3.11), and ‘Invoice’ (D1.15, D2.15, D3.15). The data collection step is part of Assess Delivery Performance (ED2) and Manage Deliver Information (ED3) Discussion This metric is calculated at the order level. The timeliness and quality of the documentation is measured from the perspective of the customer, Government, and other regulatory entities. Documentation may be late or incomplete due to the inability to prepare / process the correct documentation on time. Inaccurate or late shipping documentation may prevent the product to be loaded or shipped, increase the customs delay, and delay the customer’s acceptance of the order. Inaccurate or late invoices may also lead to the inability to fulfill the customer request. The definition encompasses On time and Accurate documentation. However, on-time documentation implies a scheduled ship date and scheduled invoice date. Accurate documentation metrics are similar to what exists for SOURCE process metrics Possible diagnostic metrics that can be used to focus Accurate Documentation improvement efforts include:
• % orders documentation (shipping and invoice) processed on time • % faultless invoices

© Copyright 2006 Supply-Chain Council, Inc. 445 June 2006
Performance Attribute: Supply Chain Responsiveness Level 1 Metric: Order Fulfillment Cycle Time Metric Definition The average actual cycle time consistently achieved to fulfill customer orders. For each individual order, this cycle time starts from the order receipt and ends with customer acceptance of the order. Hierarchical Metric Structure
Level 1
Level 2
Qualitative Relationship Description
Quantitative Relationship (optional, if calculable) Order Fulfillment Cycle Time ≈ Source Cycle Time + Make Cycle Time + Deliver Cycle Time Calculation [Sum Actual Cycle Times For All Orders Delivered] / [Total Number Of Orders Delivered]
Data Collection Data for the components that are used to drive the calculation of responsiveness are taken from the Source, Make and Deliver process elements. Discussion The order fulfillment cycle time as captured from the moment a customer places the order to the moment the order is fulfilled is considered to be a ‘gross’ cycle time. It represents all the time passed between these two events, regardless of whether this represented cycle time for the activities performed by the organisation to fulfill the order (both value-add and non-value-add) or dwell time because the order was placed well in advance by the customer. As such, this gross order fulfillment cycle time does not truly reflect the responsiveness of the organisation. Take for example an organisation that needs six days to fulfill a certain customer order. If the customer places the order one day in advance, the gross order fulfillment cycle time will be seven days. If the customer places the order 3 months ahead (pre-ordering), the gross fulfillment cycle time will be 96 days. However, the fact that the customer pre-orders does not reduce the responsiveness of the organisation. On the contrary, one can argue that it may increase the ability of the organisation to meet that order as it allows the organisation to plan ahead and fulfill the order in a more optimal way. The responsiveness of the organisation is determined by the cumulative cycle time for all activities that are required to fulfill the order, but should exclude any dwell time where no activity takes place. Therefore the definition of Order Fulfillment Cycle Time consists of a ‘gross’ component and a ‘net’ component named Order Fulfillment Process Time, according to the following formula: Order Fulfillment Cycle Time = Order Fulfillment Process Time + Order Fulfillment Dwell Time. Note that dwell time will equal 0 for companies who do not utilize this metric, so Order Fulfillment Cycle Time will equal Order Fulfillment Process Time. Order fulfillment dwell time is defined as ‘any lead time during the order fulfillment process where no activity takes place, which is imposed by customer requirements’. Note that this dwell time is different from ‘idle time’ or ‘non-value-add lead time’, which is caused by inefficiencies in the organization’s processes and therefore ultimately under responsibility of the organisation. This kind of idle time should not be deducted
Order Fulfillment Cycle Time
Source Cycle Time Make Cycle Time Deliver Cycle Time
© Copyright 2006 Supply-Chain Council, Inc. 446 June 2006
from the gross order fulfillment cycle time. Dwell time is mostly associated with the ordering process, where a customer may place an order in advance to reserve capacity/materials etc, but where the actual steps in the order fulfillment process take place later on. It is also common in the delivery process where the organisation may be in principle ready to ship the product/service, but is requested by the customer to wait (for example to follow a certain shipment schedule). Note that for those organisations where dwell time does not play a role, the dwell time can be taken as zero days which results in the net order fulfillment cycle time to be equal to the gross order fulfillment cycle time For benchmarking purposes it is recommended to use the Order Fulfillment Process Time, as this is the cycle time reflecting most accurately the responsiveness of the organisation. It will also ensure that those organisations in industries where dwell time is a factor can be benchmarked against organisations in industries where dwell time does not play a role. The concept of dwell time applies not only to the level 1 metric, but also to all lower level metrics. This means that each lower level metric can have a gross component, consisting of the net component and dwell time. Because the lower level metrics are hierarchical (the cumulative sum of cycle times at level 2 or 3 should be equal to the cycle time at level 1), the cumulative sum of dwell times at level 2 or 3 should total up to the dwell time at level 1.
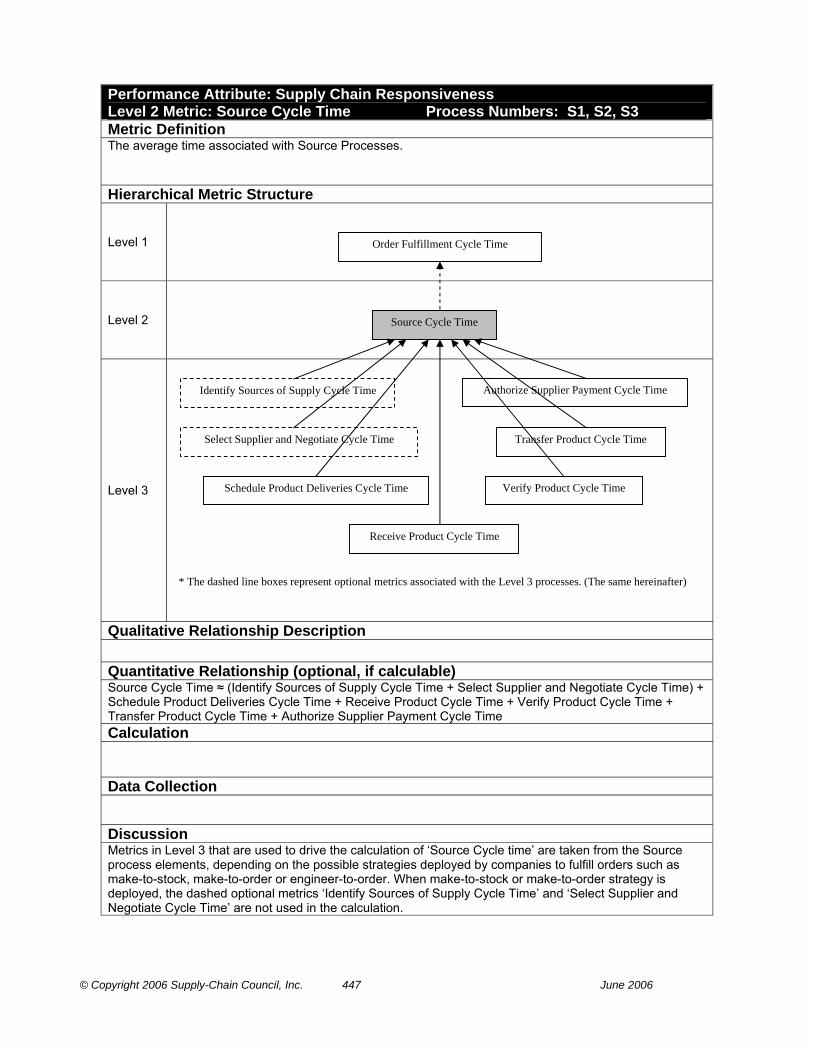
© Copyright 2006 Supply-Chain Council, Inc. 447 June 2006
Performance Attribute: Supply Chain Responsiveness Level 2 Metric: Source Cycle Time Process Numbers: S1, S2, S3 Metric Definition The average time associated with Source Processes.
Hierarchical Metric Structure
Level 1
Level 2
Level 3
Qualitative Relationship Description Quantitative Relationship (optional, if calculable) Source Cycle Time ≈ (Identify Sources of Supply Cycle Time + Select Supplier and Negotiate Cycle Time) + Schedule Product Deliveries Cycle Time + Receive Product Cycle Time + Verify Product Cycle Time + Transfer Product Cycle Time + Authorize Supplier Payment Cycle Time Calculation
Data Collection
Discussion Metrics in Level 3 that are used to drive the calculation of ‘Source Cycle time’ are taken from the Source process elements, depending on the possible strategies deployed by companies to fulfill orders such as make-to-stock, make-to-order or engineer-to-order. When make-to-stock or make-to-order strategy is deployed, the dashed optional metrics ‘Identify Sources of Supply Cycle Time’ and ‘Select Supplier and Negotiate Cycle Time’ are not used in the calculation.
Schedule Product Deliveries Cycle Time
Source Cycle Time
Receive Product Cycle Time
Verify Product Cycle Time
Transfer Product Cycle Time
Authorize Supplier Payment Cycle Time
Order Fulfillment Cycle Time
Identify Sources of Supply Cycle Time
Select Supplier and Negotiate Cycle Time
* The dashed line boxes represent optional metrics associated with the Level 3 processes. (The same hereinafter)
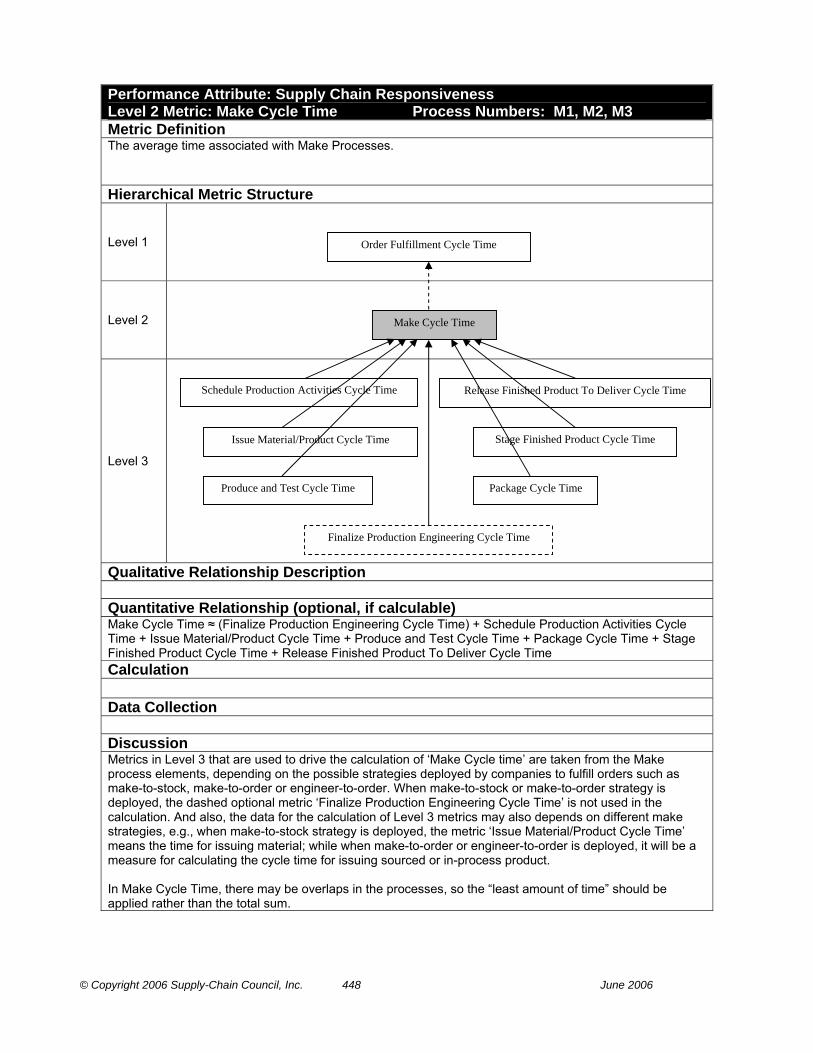
© Copyright 2006 Supply-Chain Council, Inc. 448 June 2006
Performance Attribute: Supply Chain Responsiveness Level 2 Metric: Make Cycle Time Process Numbers: M1, M2, M3 Metric Definition The average time associated with Make Processes.
Hierarchical Metric Structure
Level 1
Level 2
Level 3
Qualitative Relationship Description Quantitative Relationship (optional, if calculable) Make Cycle Time ≈ (Finalize Production Engineering Cycle Time) + Schedule Production Activities Cycle Time + Issue Material/Product Cycle Time + Produce and Test Cycle Time + Package Cycle Time + Stage Finished Product Cycle Time + Release Finished Product To Deliver Cycle Time Calculation Data Collection Discussion Metrics in Level 3 that are used to drive the calculation of ‘Make Cycle time’ are taken from the Make process elements, depending on the possible strategies deployed by companies to fulfill orders such as make-to-stock, make-to-order or engineer-to-order. When make-to-stock or make-to-order strategy is deployed, the dashed optional metric ‘Finalize Production Engineering Cycle Time’ is not used in the calculation. And also, the data for the calculation of Level 3 metrics may also depends on different make strategies, e.g., when make-to-stock strategy is deployed, the metric ‘Issue Material/Product Cycle Time’ means the time for issuing material; while when make-to-order or engineer-to-order is deployed, it will be a measure for calculating the cycle time for issuing sourced or in-process product. In Make Cycle Time, there may be overlaps in the processes, so the “least amount of time” should be applied rather than the total sum.
Schedule Production Activities Cycle Time
Make Cycle Time
Order Fulfillment Cycle Time
Issue Material/Product Cycle Time
Produce and Test Cycle Time Package Cycle Time
Stage Finished Product Cycle Time
Release Finished Product To Deliver Cycle Time
Finalize Production Engineering Cycle Time
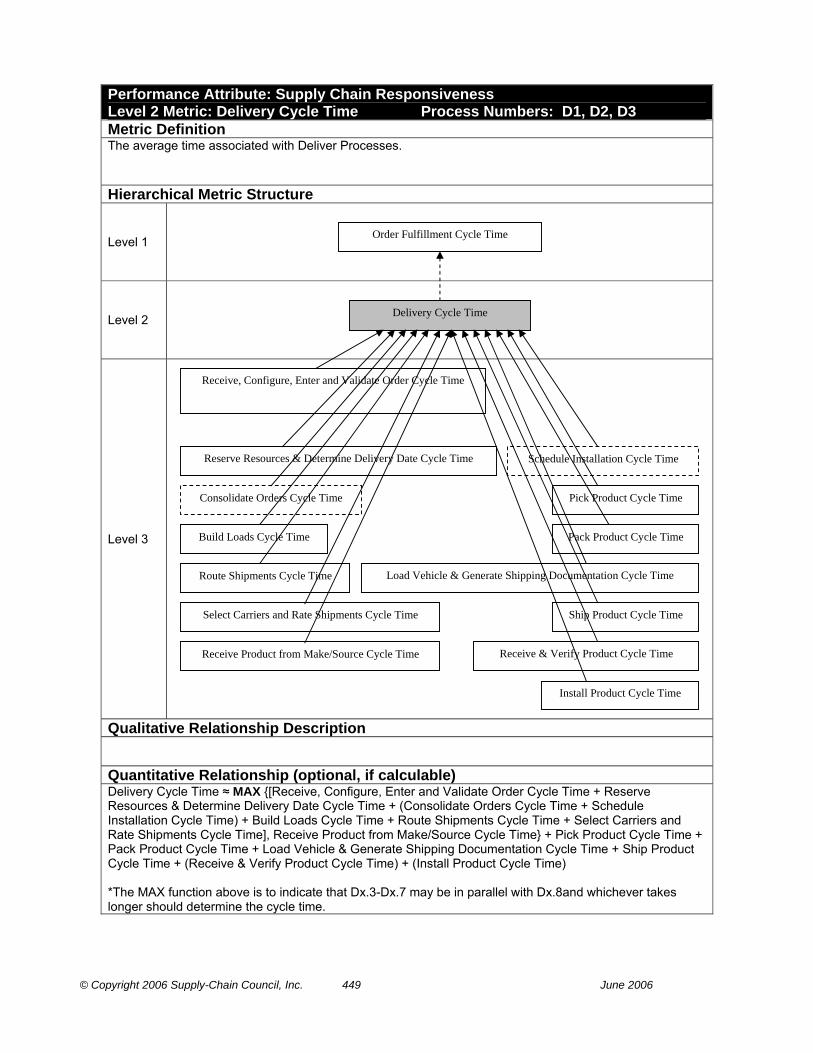
© Copyright 2006 Supply-Chain Council, Inc. 449 June 2006
Performance Attribute: Supply Chain Responsiveness Level 2 Metric: Delivery Cycle Time Process Numbers: D1, D2, D3 Metric Definition The average time associated with Deliver Processes.
Hierarchical Metric Structure
Level 1
Level 2
Level 3
Qualitative Relationship Description
Quantitative Relationship (optional, if calculable) Delivery Cycle Time ≈ MAX {[Receive, Configure, Enter and Validate Order Cycle Time + Reserve Resources & Determine Delivery Date Cycle Time + (Consolidate Orders Cycle Time + Schedule Installation Cycle Time) + Build Loads Cycle Time + Route Shipments Cycle Time + Select Carriers and Rate Shipments Cycle Time], Receive Product from Make/Source Cycle Time} + Pick Product Cycle Time + Pack Product Cycle Time + Load Vehicle & Generate Shipping Documentation Cycle Time + Ship Product Cycle Time + (Receive & Verify Product Cycle Time) + (Install Product Cycle Time) *The MAX function above is to indicate that Dx.3-Dx.7 may be in parallel with Dx.8and whichever takes longer should determine the cycle time.
Receive, Configure, Enter and Validate Order Cycle Time
Delivery Cycle Time
Order Fulfillment Cycle Time
Reserve Resources & Determine Delivery Date Cycle Time
Consolidate Orders Cycle Time
Build Loads Cycle Time
Route Shipments Cycle Time
Select Carriers and Rate Shipments Cycle Time
Receive Product from Make/Source Cycle Time
Pick Product Cycle Time
Pack Product Cycle Time
Load Vehicle & Generate Shipping Documentation Cycle Time
Ship Product Cycle Time
Receive & Verify Product Cycle Time
Install Product Cycle Time
Schedule Installation Cycle Time

© Copyright 2006 Supply-Chain Council, Inc. 450 June 2006
Calculation Data Collection Discussion Metrics in Level 3 that are used to drive the calculation of ‘Deliver Cycle time’ are taken from the Deliver process elements, depending on the possible strategies deployed by companies to fulfill orders such as make-to-stock, make-to-order or engineer-to-order. When make-to-stock or make-to-order strategy is deployed, the optional metric ‘Schedule Installation Cycle Time’ is not used in the calculation, otherwise the metric ‘Consolidate Orders Cycle Time’ will not be used. And also, the data for the calculation of Level 3 metrics may also depends on different make strategies, e.g., when make-to-stock strategy is deployed, the metric ‘Receive, Configure, Enter and Validate Order Cycle Time’ may not include the Configure process.
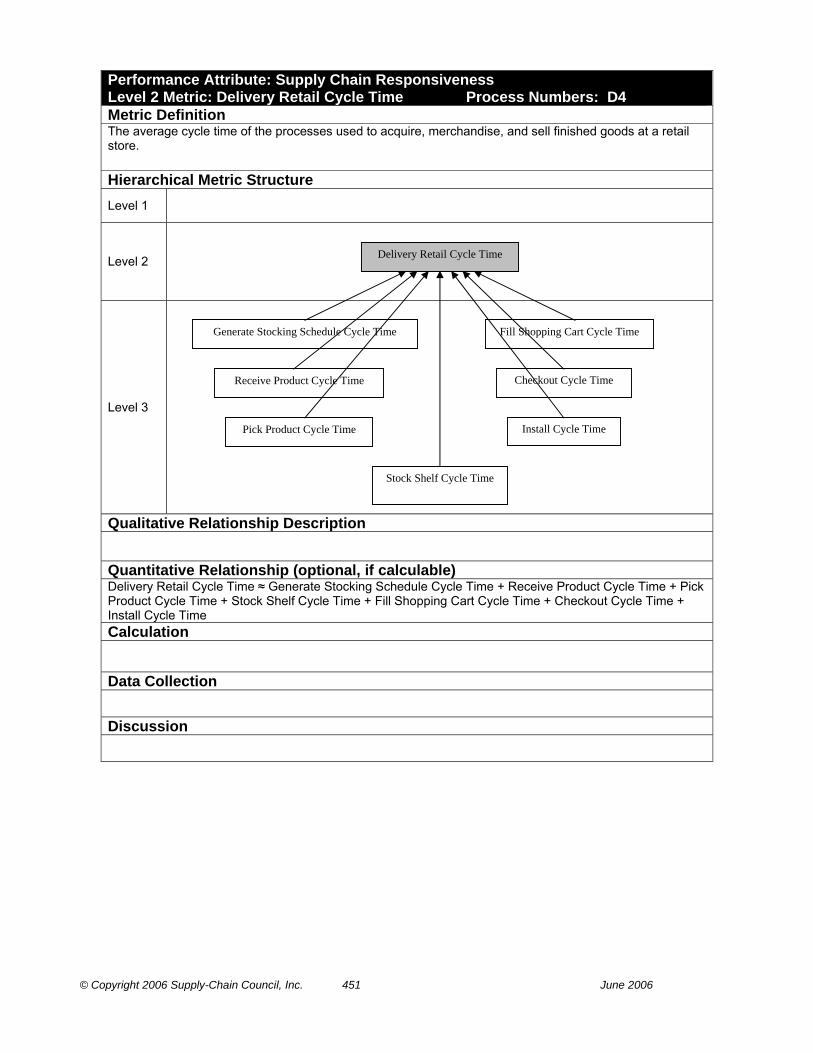
© Copyright 2006 Supply-Chain Council, Inc. 451 June 2006
Performance Attribute: Supply Chain Responsiveness Level 2 Metric: Delivery Retail Cycle Time Process Numbers: D4 Metric Definition The average cycle time of the processes used to acquire, merchandise, and sell finished goods at a retail store.
Hierarchical Metric Structure Level 1
Level 2
Level 3
Qualitative Relationship Description
Quantitative Relationship (optional, if calculable) Delivery Retail Cycle Time ≈ Generate Stocking Schedule Cycle Time + Receive Product Cycle Time + Pick Product Cycle Time + Stock Shelf Cycle Time + Fill Shopping Cart Cycle Time + Checkout Cycle Time + Install Cycle Time Calculation
Data Collection
Discussion
Delivery Retail Cycle Time
Receive Product Cycle Time
Pick Product Cycle Time
Stock Shelf Cycle Time
Fill Shopping Cart Cycle Time Generate Stocking Schedule Cycle Time
Checkout Cycle Time
Install Cycle Time

© Copyright 2006 Supply-Chain Council, Inc. 452 June 2006
Performance Attribute: Supply Chain Flexibility Level 1 Metric: Upside Supply Chain Flexibility Metric Definition The number of days required to achieve an unplanned sustainable 20% increase in quantities delivered. Note - 20% is a number provided for benchmarking purposes. For some industries and some organizations 20% may be in some cases unobtainable or in others too conservative. Note - component metrics (Upside Source Flexibility, Upside Make Flexibility, etc) can be improved in parallel and as a result, this calculation requires the result to be the least amount of time to achieve the desired result). Hierarchical Metric Structure
Level 1
Level 2
Qualitative Relationship Description Calculation: Total elapsed days between the occurrence of the unplanned event and the achievement of sustained plan, source, make, deliver and return performance. Note: Elapsed days are not necessarily the sum of days required for all activities as some may occur simultaneously. Upside Source Flexibility: The number of days required to achieve an unplanned sustainable 20% increase in quantity of raw materials. Upside Make Flexibility: The number of days required to achieve an unplanned sustainable 20% increase in production with the assumption of no raw material constraints. Upside Deliver Flexibility: The number of days required to achieve an unplanned sustainable 20% increase in quantity delivered with the assumption of no other constraints. Upside Source Return Flexibility: The number of days required to achieve an unplanned sustainable 20% increase in the return of raw materials to suppliers. Upside Deliver Return Flexibility: The number of days required to achieve an unplanned sustainable 20% increase in the return of finished goods from customers. Quantitative Relationship (optional, if calculable) Calculation The calculation of supply chain flexibility requires the calculation to be the least time required to achieve the unplanned sustainable increase when considering Source, Make, and Deliver components. For example, if it requires 90 days achieve a 20% increase in raw material volume, 60 days for adding capital to support production, and no time to increase the ability to deliver, upside supply chain flexibility would be 90 days (if production changes can run concurrently with material acquisition activities) or as much as 150 days if production changes and material acquisition changes must run sequentially.
Upside Supply Chain Flexibility
Upside Make Flexibility
Upside Deliver Return Flexibility
Upside Source Flexibility
Upside Deliver Flexibility
Upside Source Return Flexibility

© Copyright 2006 Supply-Chain Council, Inc. 453 June 2006
Data Collection Data for the components that are used to drive the calculation of supply chain flexibility are taken from the actual planning activities incurred in devising the actions to be taken and the execution activities themselves. Neither the complete set of activities nor any given subset of those activities can be identified except in either contingency plans (in which case they are hypothetical), special analytical simulations conducted for the purpose of predicting total elapsed time, or after the fact (when they have actually occurred and are unlikely to reoccur in the same combination). Flexibility measures are assumption based or based on historic events. Some elements can be measured and taken as a basis for further considerations, e.g. Discussion Certainly enterprises deal with change all the time. In most cases, these changes are minor deviations from the “norm” or fleeting “blips” in the marketplace. Also, certainly, most supply chains move through these changes almost effortlessly and, in this regard, demonstrate equivalent flexibility. In many extreme cases, however, it is possible that a particular supply chain has reached a condition of relative rigidity (say, at capacity or rigid, constraining agreements with partners) and a seemingly minor increase in production requirement can consume much time and effort as the supply chain struggles to restore its capability to perform. It is evidenced that enterprises engaged in appropriate business risk and competitive contingency planning activities will usually be in a better position to optimize overall supply chain performance and these activities are presented as best practices later in this document. When change is known in advance (such as Wal-Mart requiring RFID devices on all delivered cases, or a major sourcing change is planned to occur), and is incorporated in the enterprise’s operating plan, then the time incurred to undertake the adaptation isn’t necessarily a reflection of the supply chain’s flexibility. While flexibility is still addressed, it is frequently clouded by other considerations in the operating plan. Unplanned change is the primary consideration in measuring the supply chain’s flexibility.
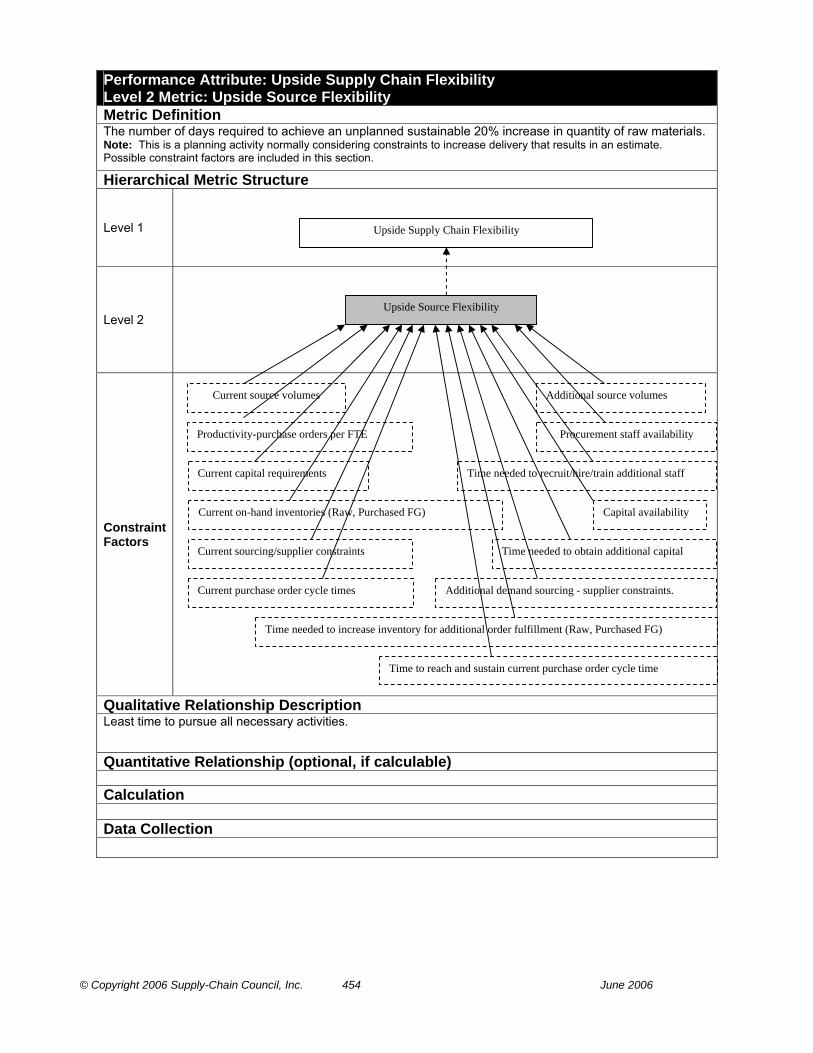
© Copyright 2006 Supply-Chain Council, Inc. 454 June 2006
Performance Attribute: Upside Supply Chain Flexibility Level 2 Metric: Upside Source Flexibility Metric Definition The number of days required to achieve an unplanned sustainable 20% increase in quantity of raw materials. Note: This is a planning activity normally considering constraints to increase delivery that results in an estimate. Possible constraint factors are included in this section.
Hierarchical Metric Structure
Level 1
Level 2
Constraint Factors
Qualitative Relationship Description Least time to pursue all necessary activities.
Quantitative Relationship (optional, if calculable) Calculation Data Collection
Upside Supply Chain Flexibility
Upside Source Flexibility
Current source volumes
Current capital requirements
Current sourcing/supplier constraints
Current purchase order cycle times
Current on-hand inventories (Raw, Purchased FG) Capital availability
Additional source volumes
Additional demand sourcing - supplier constraints.
Productivity-purchase orders per FTE Procurement staff availability
Time needed to recruit/hire/train additional staff
Time needed to obtain additional capital
Time to reach and sustain current purchase order cycle time
Time needed to increase inventory for additional order fulfillment (Raw, Purchased FG)

© Copyright 2006 Supply-Chain Council, Inc. 455 June 2006
Discussion Source: Input Current elements needed to fully understand future requirements, to establish 20% gap, based on the question “How long will it take for the company to sustain a 20% increase in quantities sourced?”. These elements are mainly output metrics from other attributes . . . responsiveness, reliability, cost, asset management.
Demand o Current source volumes
Amount of each item purchased Staffing o Staff needed to meet current demand
Productivity-purchase orders per FTE Needed, but may be underutilized
Capital o Current capital requirements
Credit line Cash on hand Accounting procedures
Materials o All else equal in make, deliver, return, current inventory on hand (raw material and purchased
finished goods), including safety stock required to sustain current order fulfillment. Assuming optimized inventory practices (no excess inventory)
o Current sourcing/supplier constraints Current contract terms. Nature of items; commodity/sole source.
Cycle Time o Current procurement cycle time
Time to place a purchase order Supplier lead time
Source: Resource Availability Assessment & Ramp-up/Lead Time Elements needed to establish 20% delta in resources and what is required to meet the 20% delta based on the question “How long will it take for the company to sustain a 20% increase in quantities sourced?”
Demand: o Additional source volume Staffing o Staff availability in procurement (underutilized FTE’s) o Amount of time needed to recruit/hire/train additional staff to fill gap between underutilized FTE’s
and staff needed to sustain 20% increase in quantities delivered Capital o Current capital availability
Credit line Cash on hand Accounting procedures
o Amount of time needed to obtain capital to fill gap between current capital availability and capital needed to sustain 20% increase in quantities ordered
Materials o Sourcing Constraints
Time required in negotiating new source/volume contracts/terms Time required to find/obtain additional sources
o All else equal in make, deliver, return, amount of time needed to obtain, deliver and phase in inventory (raw material and purchased finished goods) for order fulfillment, including safety stock to sustain 20% increase in quantities sourced.
Cycle Time o Amount of time needed to reach and sustain current procurement cycle time
Time to place a purchase order Supplier lead time

© Copyright 2006 Supply-Chain Council, Inc. 456 June 2006
Performance Attribute: Upside Supply Chain Flexibility Level 2 Metric: Upside Make Flexibility Metric Definition The number of days required to achieve an unplanned sustainable 20% increase in production with the assumption of no raw material constraints. Note: This is a planning activity normally considering constraints to increase delivery that results in an estimate.
Hierarchical Metric Structure
Level 1
Level 2
Constraint Factors
Qualitative Relationship Description Least time to pursue all necessary activities.
Upside Supply Chain Flexibility
Upside Make Flexibility
Current inventory on hand (WIP, FG)
Current internal equipment capacity utilization
Capital availability
Time needed to obtain additional capital
Direct labor availability
Percent of labor used in manufacturing, not used in direct activity
Time needed to recruit/hire/train additional labor
Supplemental outsource/lease availability
Time needed to obtain supplemental outsourced or leased resources or facilities
Productivity-units/orders produced per FTE
Current capital requirements
Time needed to increase inventory (WIP, FG) for additional order fulfillment
Current manufacturing order cycle time
Internal and External manufacturing equipment capacity needed for current make volume
Time to reach and sustain current manufacturing order cycle time
Internal and External facilities/, storage capacity needed for current make volume
Time needed to obtain additional equipment
Time needed to obtain additional internal space
Current internal facility/storage capacity utilization
Current make volume Additional make volume

© Copyright 2006 Supply-Chain Council, Inc. 457 June 2006
Quantitative Relationship (optional, if calculable)

© Copyright 2006 Supply-Chain Council, Inc. 458 June 2006
Calculation
Data Collection
Discussion Make: Input Current elements needed to fully understand future requirements, to establish 20% gap, based on the question “How long will it take for the company to sustain a 20% increase in quantities produced?”. These elements are mainly output metrics from other attributes . . . responsiveness, reliability, cost, asset management.
Demand o Current make volumes
Amount of each item manufactured Labor o Labor needed to meet current demand
Productivity-units/orders per FTE Needed, but may be underutilized
Capital/Assets o Internal and External (outsourced) capacity needed for current demand throughput
Facilities, space Manufacturing equipment, materials handling and packaging equipment, etc. Needed, but may be underutilized
o Current capital requirements Credit line Cash on hand Accounting procedures Finance Procedures (outsource vs. in-source, make vs. buy, lease vs. purchase)
Materials o All else equal in source, deliver and return, current inventory on hand (WIP and finished goods),
including safety stock required to sustain current order fulfillment. Assuming optimized inventory practices (no excess inventory)
Cycle Time o Current manufacturing cycle time (all else equal including procurement order cycle time and
supplier lead time) Make: Resource Availability Assessment & Ramp-up/Lead Time Elements needed to establish 20% delta in resources and what is required to meet the 20% delta based on the question “How long will it take for the company to sustain a 20% increase in quantities produced?”
Demand: o Additional make volume Labor o Direct labor availability and percent of labor used in manufacturing, not used in direct activity
(underutilized FTE’s) o Amount of time needed to recruit/hire/train additional labor to fill gap between underutilized FTE’s
and labor needed to sustain 20% increase in quantities manufactured Capital/Assets o Current Internal Capacity utilization
Facilities, space Manufacturing equipment, materials handling and packaging equipment, etc.
o Current capital availability Credit line Cash on hand Accounting procedures Finance Procedures (outsource vs. in-source, lease vs. purchase)
o Amount of time needed to obtain capital to fill gap between underutilized asset capacity and assets needed to sustain 20% increase in quantities delivered
o Amount of time needed to obtain assets/capacity to fill gap between underutilized asset capacity and assets needed to sustain 20% increase in quantities delivered
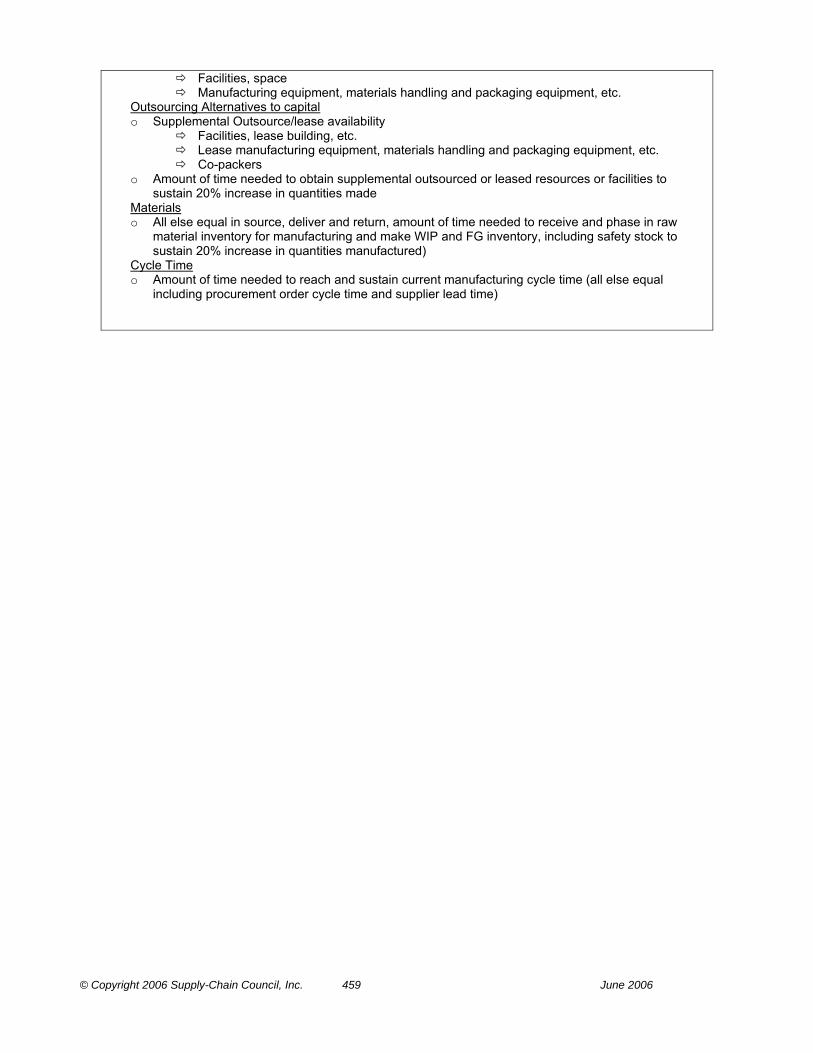
© Copyright 2006 Supply-Chain Council, Inc. 459 June 2006
Facilities, space Manufacturing equipment, materials handling and packaging equipment, etc.
Outsourcing Alternatives to capital o Supplemental Outsource/lease availability
Facilities, lease building, etc. Lease manufacturing equipment, materials handling and packaging equipment, etc. Co-packers
o Amount of time needed to obtain supplemental outsourced or leased resources or facilities to sustain 20% increase in quantities made
Materials o All else equal in source, deliver and return, amount of time needed to receive and phase in raw
material inventory for manufacturing and make WIP and FG inventory, including safety stock to sustain 20% increase in quantities manufactured)
Cycle Time o Amount of time needed to reach and sustain current manufacturing cycle time (all else equal
including procurement order cycle time and supplier lead time)
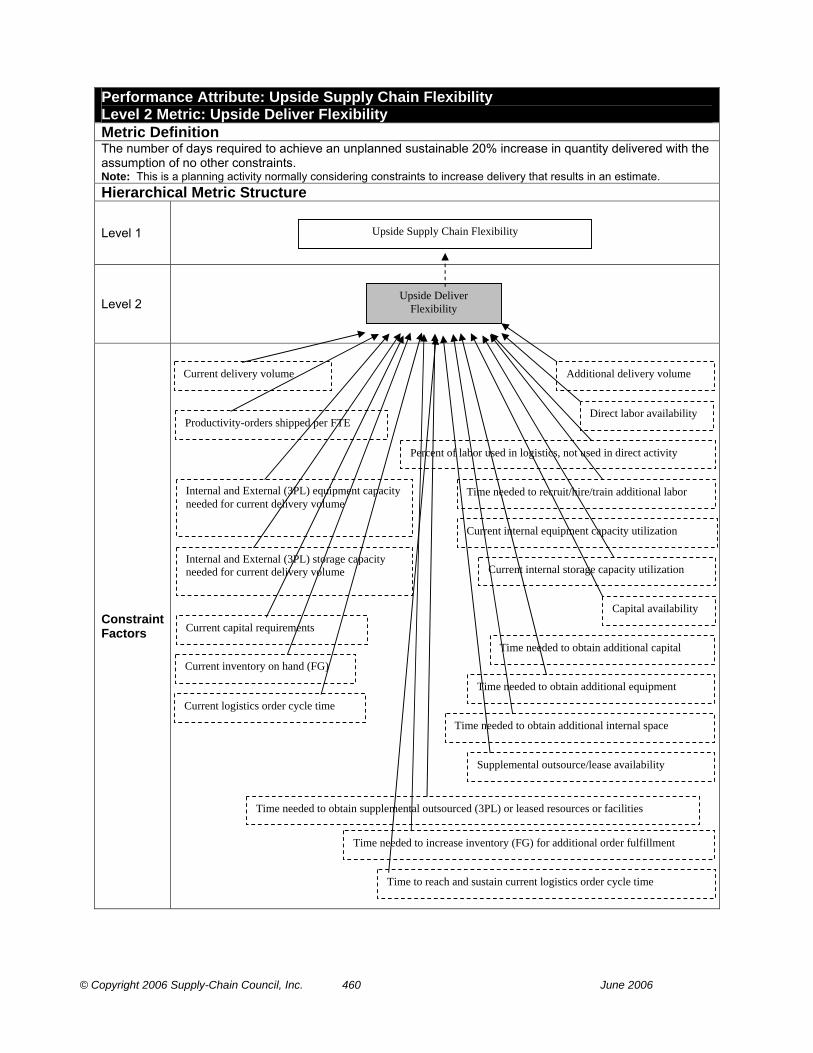
© Copyright 2006 Supply-Chain Council, Inc. 460 June 2006
Performance Attribute: Upside Supply Chain Flexibility Level 2 Metric: Upside Deliver Flexibility Metric Definition The number of days required to achieve an unplanned sustainable 20% increase in quantity delivered with the assumption of no other constraints. Note: This is a planning activity normally considering constraints to increase delivery that results in an estimate. Hierarchical Metric Structure
Level 1
Level 2
Constraint Factors
Upside Deliver Flexibility
Upside Supply Chain Flexibility
Current inventory on hand (FG)
Current internal equipment capacity utilization
Capital availability
Time needed to obtain additional capital
Direct labor availability
Percent of labor used in logistics, not used in direct activity
Time needed to recruit/hire/train additional labor
Supplemental outsource/lease availability
Time needed to obtain supplemental outsourced (3PL) or leased resources or facilities
Productivity-orders shipped per FTE
Current capital requirements
Time needed to increase inventory (FG) for additional order fulfillment
Current logistics order cycle time
Internal and External (3PL) equipment capacity needed for current delivery volume
Time to reach and sustain current logistics order cycle time
Internal and External (3PL) storage capacity needed for current delivery volume
Time needed to obtain additional equipment
Time needed to obtain additional internal space
Current internal storage capacity utilization
Current delivery volume Additional delivery volume
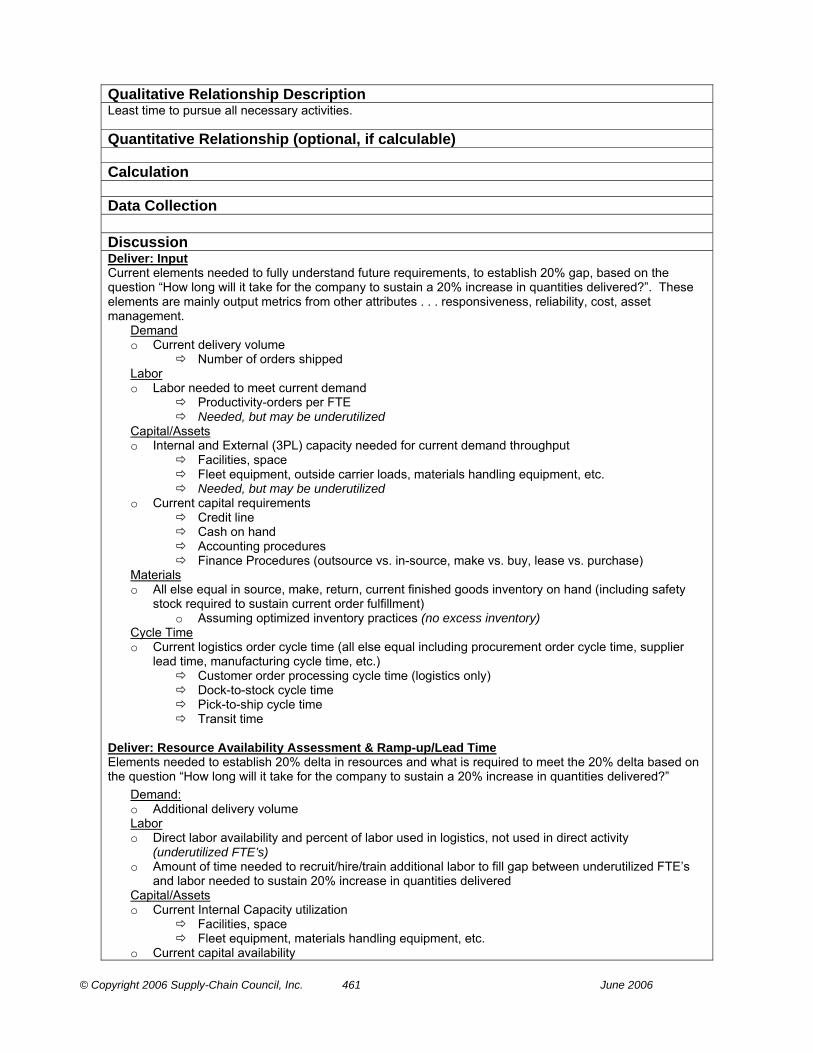
© Copyright 2006 Supply-Chain Council, Inc. 461 June 2006
Qualitative Relationship Description Least time to pursue all necessary activities.
Quantitative Relationship (optional, if calculable) Calculation Data Collection
Discussion Deliver: Input Current elements needed to fully understand future requirements, to establish 20% gap, based on the question “How long will it take for the company to sustain a 20% increase in quantities delivered?”. These elements are mainly output metrics from other attributes . . . responsiveness, reliability, cost, asset management.
Demand o Current delivery volume
Number of orders shipped Labor o Labor needed to meet current demand
Productivity-orders per FTE Needed, but may be underutilized
Capital/Assets o Internal and External (3PL) capacity needed for current demand throughput
Facilities, space Fleet equipment, outside carrier loads, materials handling equipment, etc. Needed, but may be underutilized
o Current capital requirements Credit line Cash on hand Accounting procedures Finance Procedures (outsource vs. in-source, make vs. buy, lease vs. purchase)
Materials o All else equal in source, make, return, current finished goods inventory on hand (including safety
stock required to sustain current order fulfillment) o Assuming optimized inventory practices (no excess inventory)
Cycle Time o Current logistics order cycle time (all else equal including procurement order cycle time, supplier
lead time, manufacturing cycle time, etc.) Customer order processing cycle time (logistics only) Dock-to-stock cycle time Pick-to-ship cycle time Transit time
Deliver: Resource Availability Assessment & Ramp-up/Lead Time Elements needed to establish 20% delta in resources and what is required to meet the 20% delta based on the question “How long will it take for the company to sustain a 20% increase in quantities delivered?”
Demand: o Additional delivery volume Labor o Direct labor availability and percent of labor used in logistics, not used in direct activity
(underutilized FTE’s) o Amount of time needed to recruit/hire/train additional labor to fill gap between underutilized FTE’s
and labor needed to sustain 20% increase in quantities delivered Capital/Assets o Current Internal Capacity utilization
Facilities, space Fleet equipment, materials handling equipment, etc.
o Current capital availability
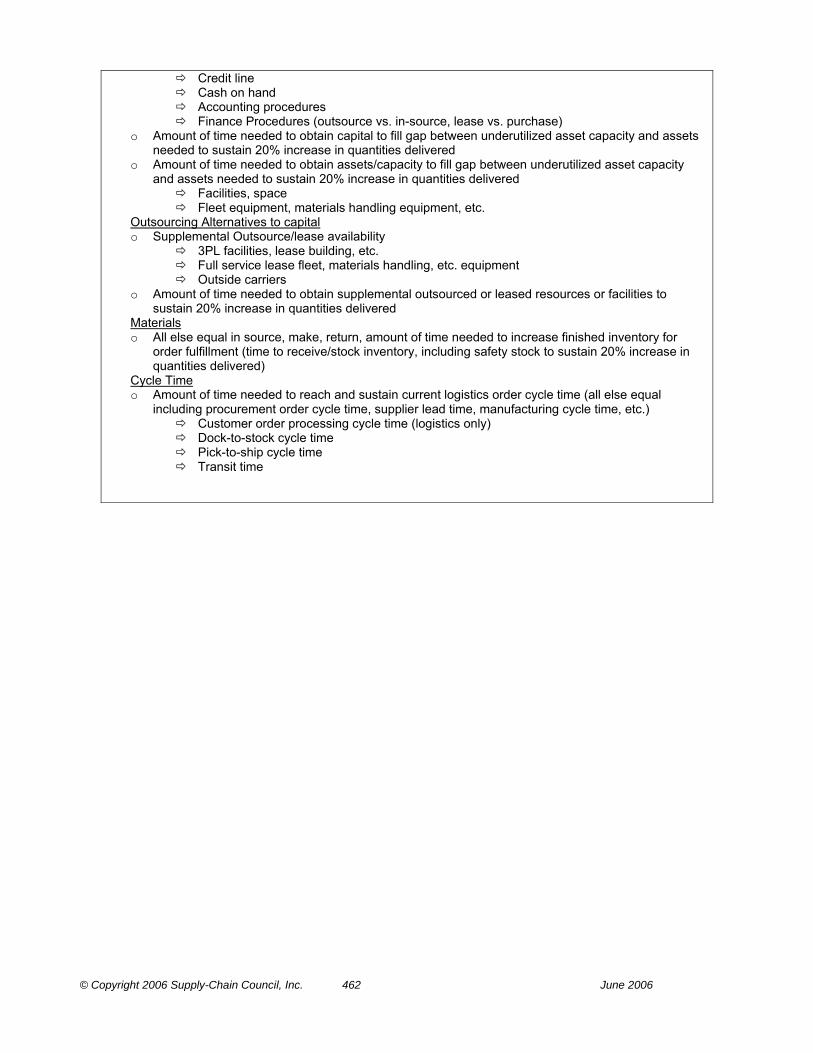
© Copyright 2006 Supply-Chain Council, Inc. 462 June 2006
Credit line Cash on hand Accounting procedures Finance Procedures (outsource vs. in-source, lease vs. purchase)
o Amount of time needed to obtain capital to fill gap between underutilized asset capacity and assets needed to sustain 20% increase in quantities delivered
o Amount of time needed to obtain assets/capacity to fill gap between underutilized asset capacity and assets needed to sustain 20% increase in quantities delivered
Facilities, space Fleet equipment, materials handling equipment, etc.
Outsourcing Alternatives to capital o Supplemental Outsource/lease availability
3PL facilities, lease building, etc. Full service lease fleet, materials handling, etc. equipment Outside carriers
o Amount of time needed to obtain supplemental outsourced or leased resources or facilities to sustain 20% increase in quantities delivered
Materials o All else equal in source, make, return, amount of time needed to increase finished inventory for
order fulfillment (time to receive/stock inventory, including safety stock to sustain 20% increase in quantities delivered)
Cycle Time o Amount of time needed to reach and sustain current logistics order cycle time (all else equal
including procurement order cycle time, supplier lead time, manufacturing cycle time, etc.) Customer order processing cycle time (logistics only) Dock-to-stock cycle time Pick-to-ship cycle time Transit time
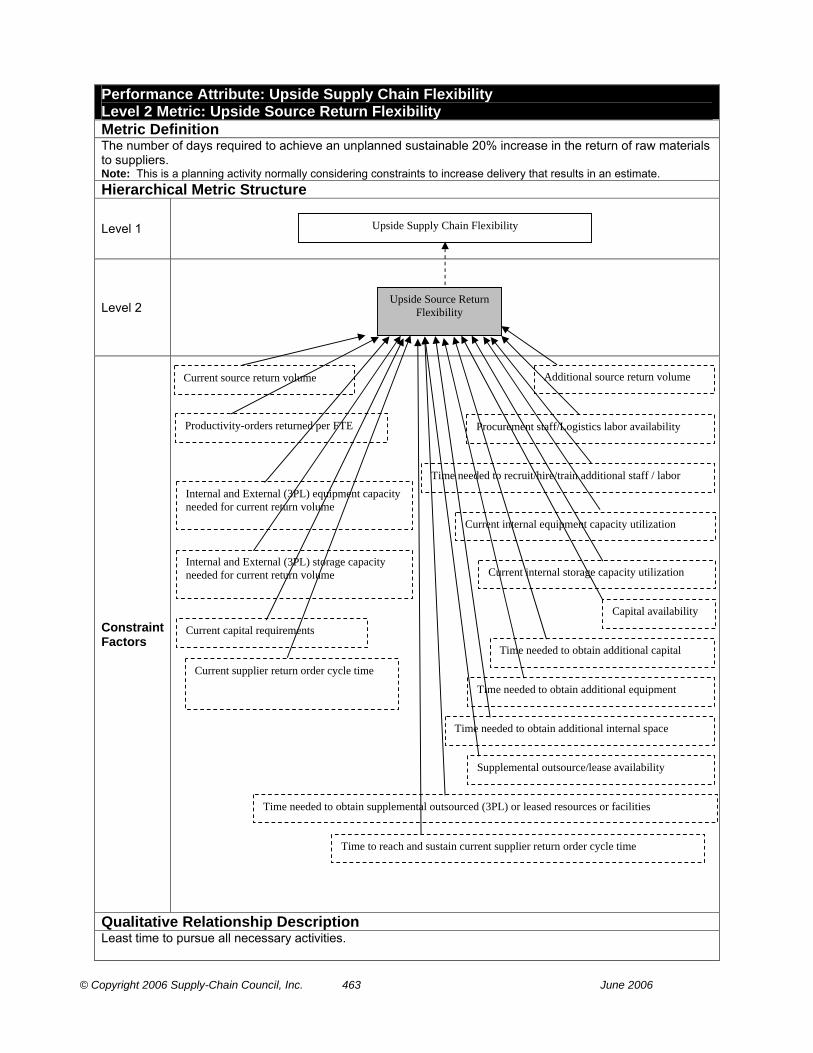
© Copyright 2006 Supply-Chain Council, Inc. 463 June 2006
Performance Attribute: Upside Supply Chain Flexibility Level 2 Metric: Upside Source Return Flexibility Metric Definition The number of days required to achieve an unplanned sustainable 20% increase in the return of raw materials to suppliers. Note: This is a planning activity normally considering constraints to increase delivery that results in an estimate. Hierarchical Metric Structure
Level 1
Level 2
Constraint Factors
Qualitative Relationship Description Least time to pursue all necessary activities.
Upside Supply Chain Flexibility
Upside Source Return Flexibility
Current internal equipment capacity utilization
Capital availability
Time needed to obtain additional capital
Procurement staff/Logistics labor availability
Time needed to recruit/hire/train additional staff / labor
Supplemental outsource/lease availability
Time needed to obtain supplemental outsourced (3PL) or leased resources or facilities
Productivity-orders returned per FTE
Current capital requirements
Current supplier return order cycle time
Internal and External (3PL) equipment capacity needed for current return volume
Time to reach and sustain current supplier return order cycle time
Internal and External (3PL) storage capacity needed for current return volume
Time needed to obtain additional equipment
Time needed to obtain additional internal space
Current internal storage capacity utilization
Current source return volume Additional source return volume

© Copyright 2006 Supply-Chain Council, Inc. 464 June 2006
Quantitative Relationship (optional, if calculable)

© Copyright 2006 Supply-Chain Council, Inc. 465 June 2006
Calculation Data Collection
Discussion Source Return: Input Assuming no supplier constraints, current elements needed to fully understand future requirements, to establish 20% gap, based on the question “How long will it take for the company to sustain a 20% increase in quantities returned to suppliers?” These elements are mainly output metrics from other attributes . . . responsiveness, reliability, cost, asset management.
Demand o Current return volume
Number of orders returned Staff / Labor o Procurement Staff / Logistics Labor needed to meet current returned volume
Productivity-orders returned per FTE Needed, but may be underutilized
Capital/Assets o Internal and External (3PL) capacity needed for current return throughput
Facilities, space Fleet equipment, outside carrier loads, materials handling equipment, etc. Needed, but may be underutilized
o Current capital requirements Credit line Cash on hand Accounting procedures Finance Procedures (outsource vs. in-source, lease vs. purchase)
Cycle Time o Current supplier return order cycle time
Supplier return order processing cycle time (procurement and logistics) Pick-to-ship cycle time Transit time
Source Return: Resource Availability Assessment & Ramp-up/Lead Time Assuming no supplier constraints, elements needed to establish 20% delta in resources and what is required to meet the 20% delta based on the question “How long will it take for the company to sustain a 20% increase in quantities returned to suppliers?”
Demand: o Additional supplier return volume Staff / Labor o Procurement staff / Logistics labor availability (underutilized FTE’s) o Amount of time needed to recruit/hire/train additional staff / labor to fill gap between underutilized
FTE’s and staff / labor needed to sustain 20% increase in quantities returned to suppliers Capital/Assets o Current Internal Capacity utilization
Facilities, space Fleet equipment, materials handling equipment, etc.
o Current capital availability Credit line Cash on hand Accounting procedures Finance Procedures (outsource vs. in-source, lease vs. purchase)
o Amount of time needed to obtain capital to fill gap between underutilized asset capacity and assets needed to sustain 20% increase in quantities returned to suppliers
o Amount of time needed to obtain assets/capacity to fill gap between underutilized asset capacity and assets needed to sustain 20% increase in quantities returned to suppliers
Facilities, space Fleet equipment, materials handling equipment, etc.
Outsourcing Alternatives to capital

© Copyright 2006 Supply-Chain Council, Inc. 466 June 2006
o Supplemental Outsource/lease availability 3PL facilities, lease building, etc. Full service lease fleet, materials handling, etc. equipment Outside carriers
o Amount of time needed to obtain supplemental outsourced or leased resources or facilities to sustain 20% increase in quantities returned to suppliers
Cycle Time o Amount of time needed to reach and sustain current supplier return order cycle time
Supplier return order processing cycle time (procurement and logistics) Pick-to-ship cycle time Transit time
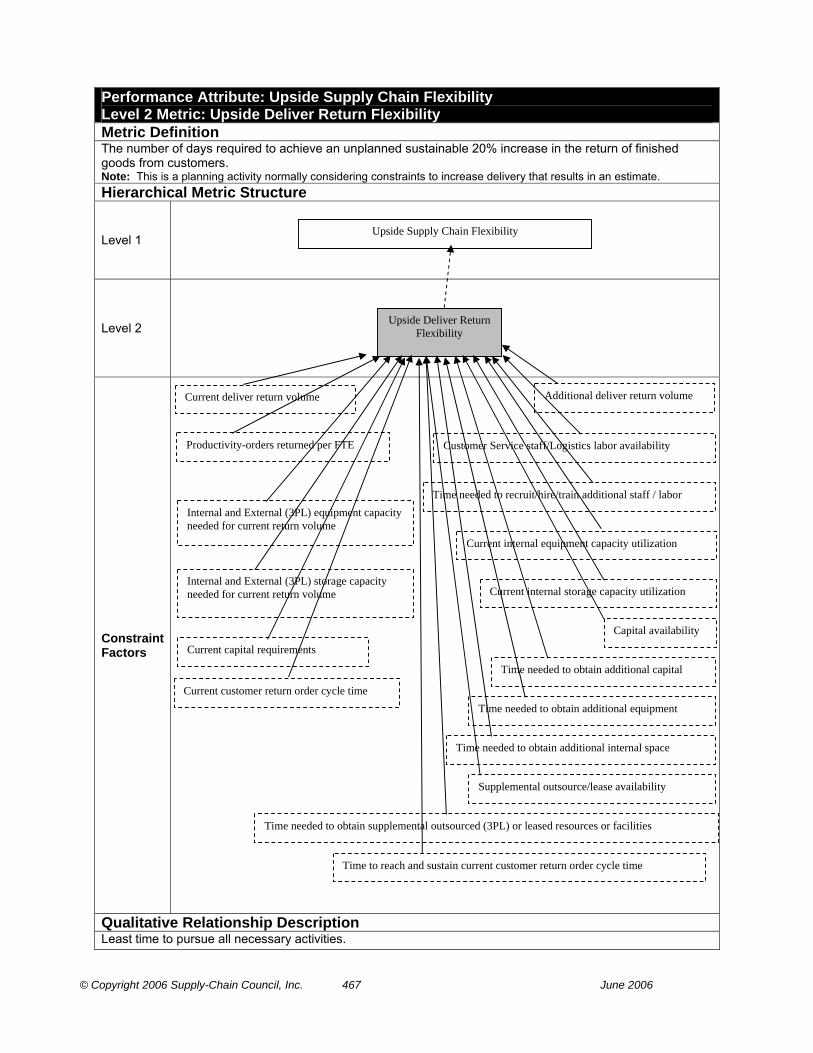
© Copyright 2006 Supply-Chain Council, Inc. 467 June 2006
Performance Attribute: Upside Supply Chain Flexibility Level 2 Metric: Upside Deliver Return Flexibility Metric Definition The number of days required to achieve an unplanned sustainable 20% increase in the return of finished goods from customers. Note: This is a planning activity normally considering constraints to increase delivery that results in an estimate. Hierarchical Metric Structure
Level 1
Level 2
Constraint Factors
Qualitative Relationship Description Least time to pursue all necessary activities.
Upside Supply Chain Flexibility
Upside Deliver Return Flexibility
Current internal equipment capacity utilization
Capital availability
Time needed to obtain additional capital
Customer Service staff/Logistics labor availability
Time needed to recruit/hire/train additional staff / labor
Supplemental outsource/lease availability
Time needed to obtain supplemental outsourced (3PL) or leased resources or facilities
Productivity-orders returned per FTE
Current capital requirements
Current customer return order cycle time
Internal and External (3PL) equipment capacity needed for current return volume
Time to reach and sustain current customer return order cycle time
Internal and External (3PL) storage capacity needed for current return volume
Time needed to obtain additional equipment
Time needed to obtain additional internal space
Current internal storage capacity utilization
Current deliver return volume Additional deliver return volume

© Copyright 2006 Supply-Chain Council, Inc. 468 June 2006
Quantitative Relationship (optional, if calculable) Calculation Data Collection Discussion Deliver Return: Input Assuming no customer constraints, current elements needed to fully understand future requirements, to establish 20% gap, based on the question “How long will it take for the company to sustain a 20% increase in quantities returned from customers?” These elements are mainly output metrics from other attributes . . . responsiveness, reliability, cost, asset management.
Demand o Current return volume
Number of orders returned Staff / Labor o Customer Service Staff / Logistics Labor needed to meet current returned volume
Productivity-orders returned per FTE Needed, but may be underutilized
Capital/Assets o Internal and External (3PL) capacity needed for current return throughput
Facilities, space Fleet equipment, outside carrier loads, materials handling equipment, etc. Needed, but may be underutilized
o Current capital requirements Credit line Cash on hand Accounting procedures Finance Procedures (outsource vs. in-source, lease vs. purchase)
Cycle Time o Current customer return order cycle time
Customer return order processing cycle time (customer service and logistics) Transit time Return processing and disposition cycle time
Deliver Return: Resource Availability Assessment & Ramp-up/Lead Time Assuming no customer constraints, elements needed to establish 20% delta in resources and what is required to meet the 20% delta based on the question “How long will it take for the company to sustain a 20% increase in quantities returned to suppliers?”
Demand: o Additional customer return volume Staff / Labor o Customer Service staff / Logistics labor availability (underutilized FTE’s) o Amount of time needed to recruit/hire/train additional staff / labor to fill gap between underutilized
FTE’s and staff / labor needed to sustain 20% increase in quantities returned from customers Capital/Assets o Current Internal Capacity utilization
Facilities, space Fleet equipment, materials handling equipment, etc.
o Current capital availability Credit line Cash on hand Accounting procedures Finance Procedures (outsource vs. in-source, lease vs. purchase)
o Amount of time needed to obtain capital to fill gap between underutilized asset capacity and assets needed to sustain 20% increase in quantities returned from customers
o Amount of time needed to obtain assets/capacity to fill gap between underutilized asset capacity and assets needed to sustain 20% increase in quantities returned from customers
Facilities, space Fleet equipment, materials handling equipment, etc.
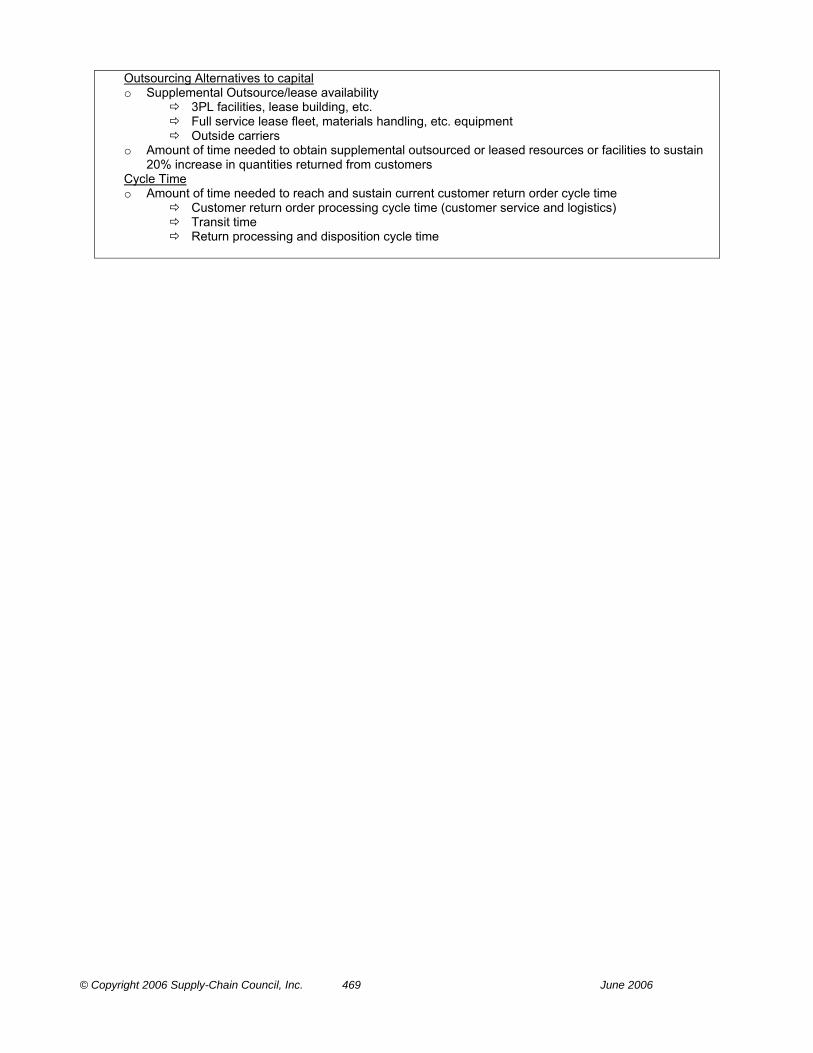
© Copyright 2006 Supply-Chain Council, Inc. 469 June 2006
Outsourcing Alternatives to capital o Supplemental Outsource/lease availability
3PL facilities, lease building, etc. Full service lease fleet, materials handling, etc. equipment Outside carriers
o Amount of time needed to obtain supplemental outsourced or leased resources or facilities to sustain 20% increase in quantities returned from customers
Cycle Time o Amount of time needed to reach and sustain current customer return order cycle time
Customer return order processing cycle time (customer service and logistics) Transit time Return processing and disposition cycle time

© Copyright 2006 Supply-Chain Council, Inc. 470 June 2006
Performance Attribute: Supply Chain Flexibility Level 1 Metric: Upside Supply Chain Adaptability Metric Definition The maximum sustainable percentage increase in quantity delivered that can be achieved in 30 days. Note: 30 days is an arbitrary number provided for benchmarking purposes. For some industries and some organizations 30 days may be in some cases unobtainable or in others too conservative. Note: Component metrics (Upside Source Adaptability, Upside Make Adaptability, etc) can be improved in parallel and as a result, this calculation requires the result to be the least increase in quantity sustainable in 30 days Hierarchical Metric Structure
Level 1
Level 2
Qualitative Relationship Description Note: The calculation of Supply Chain Adaptability requires the calculation to be the least quantity sustainable when considering Source, Make, Deliver and Return components. Upside Source Adaptability: The maximum sustainable percentage increase in raw material quantities that can be acquired/received in 30 days. Upside Make Adaptability: The maximum sustainable percentage increase in production that can be achieved in 30 days with the assumption of no raw material constraints. Upside Deliver Adaptability: The maximum sustainable percentage increase in quantities delivered that can be achieved in 30 days with the assumption of unconstrained finished good availability. Upside Source Return Adaptability: The maximum sustainable percentage increase in returns of raw materials to suppliers that can be achieved in 30 days with the assumption of unconstrained finished goods availability. Upside Deliver Return Adaptability: The maximum sustainable percentage increase in returns of finished goods from customers that can be achieved in 30 days. Quantitative Relationship (optional, if calculable) Upside Source Adaptability + Upside Make Adaptability + Upside Deliver Adaptability Calculation
Data Collection Adaptability measures are assumption based or based on historic events. Some elements can be measured and taken as a basis for further considerations. Adaptability measures are based on the actual number of returns compared to the maximum number of returns which can be achieved within 30 days. The weakest component determines the overall volume.
Upside Make Adaptability
Upside Deliver Adaptability
Upside Source Return Adaptability
Upside Source Adaptability
Upside Deliver Return Adaptability
Upside Supply Chain Adaptability

© Copyright 2006 Supply-Chain Council, Inc. 471 June 2006
Discussion The calculation of Supply Chain Adaptability requires the calculation to be the least quantity sustainable when considering Source, Make, Deliver and Return components.
P&L Impact Revenue COGS SGA
Balance Sheet Impact Inventory
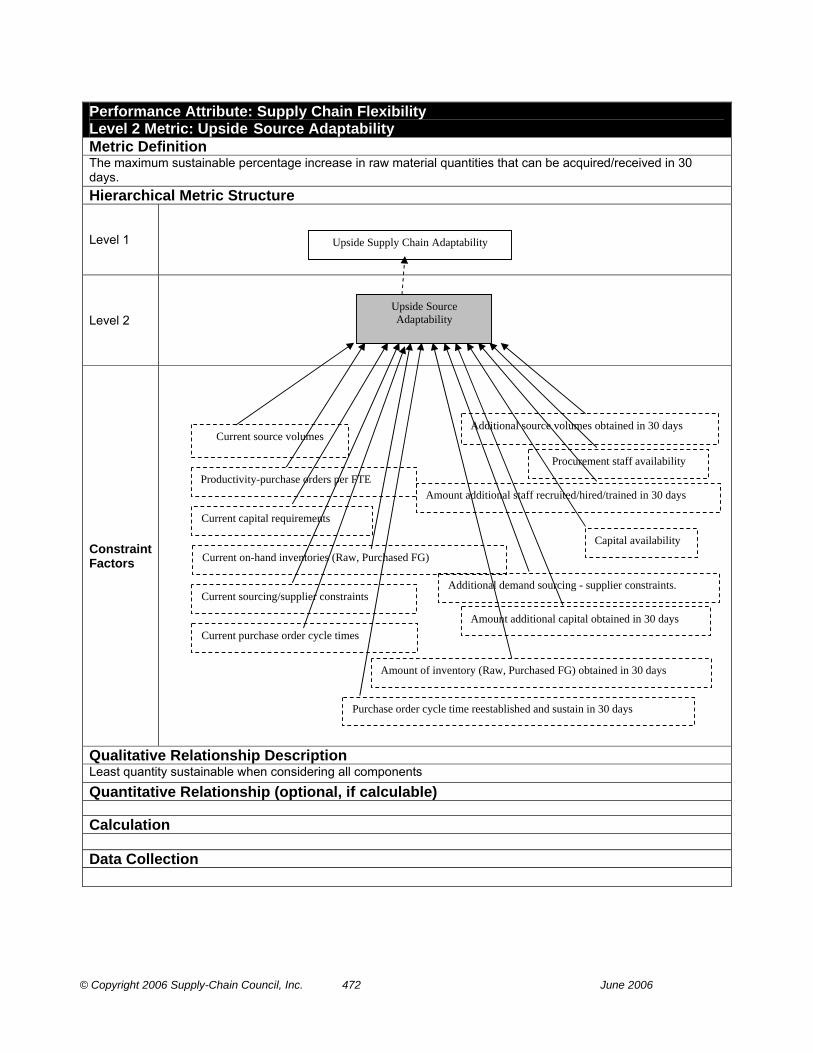
© Copyright 2006 Supply-Chain Council, Inc. 472 June 2006
Performance Attribute: Supply Chain Flexibility Level 2 Metric: Upside Source Adaptability Metric Definition The maximum sustainable percentage increase in raw material quantities that can be acquired/received in 30 days. Hierarchical Metric Structure
Level 1
Level 2
Constraint Factors
Qualitative Relationship Description Least quantity sustainable when considering all components
Quantitative Relationship (optional, if calculable) Calculation Data Collection
Upside Source Adaptability
Upside Supply Chain Adaptability
Current source volumes
Current capital requirements
Current sourcing/supplier constraints
Current purchase order cycle times
Current on-hand inventories (Raw, Purchased FG)Capital availability
Additional source volumes obtained in 30 days
Additional demand sourcing - supplier constraints.
Productivity-purchase orders per FTEProcurement staff availability
Amount additional staff recruited/hired/trained in 30 days
Amount additional capital obtained in 30 days
Purchase order cycle time reestablished and sustain in 30 days
Amount of inventory (Raw, Purchased FG) obtained in 30 days

© Copyright 2006 Supply-Chain Council, Inc. 473 June 2006
Discussion Source: Input Current elements needed to fully understand future requirements, to establish the volume delta that can be sustained based on the question “How much of an increase in quantities sourced (expressed as a percentage) can the company sustain, given 30 days?” These elements are mainly output metrics from other attributes . . . responsiveness, reliability, cost, asset management.
Demand o Current source volumes
Amount of each item purchased Staffing o Staff needed to meet current demand
Productivity-purchase orders per FTE Needed, but may be underutilized
Capital o Current capital requirements
Credit line Cash on hand Accounting procedures
Materials o All else equal in make, deliver, return, current inventory on hand (raw material and purchased
finished goods), including safety stock required to sustain current order fulfillment. Assuming optimized inventory practices (no excess inventory)
o Current sourcing/supplier constraints Current contract terms. Nature of items; commodity/sole source.
Cycle Time o Current procurement cycle time
Time to place a purchase order Supplier lead time
Source: Resource Availability Assessment & Ramp-up/Lead Time Elements needed to establish delta in resources and what can be ramped up and sustained within 30 days based on the question “How much of an increase in quantities sourced (expressed as a percentage) can the company sustain, given 30 days”
Demand: o Additional source volume to be determined given ramped up resources below Staffing o Staff availability in procurement (underutilized FTE’s) o How much staff can be recruited/hired and trained fill gap between underutilized FTE’s and FTE’s
needed to increase and sustain quantities sourced given 30 days Capital o Current capital availability
Credit line Cash on hand Accounting procedures
o How much capital can be obtained to increase quantities sourced given 30 days Materials o Sourcing Constraints
Time required in negotiating new source/volume contracts/terms Time required to find/obtain additional sources
o All else equal in make, deliver, return, how much inventory (raw material and purchased finished goods) can be obtained, delivered and phased in and sustained for order fulfillment, including safety stock given 30 days.
Cycle Time o Procurement order cycle time reestablished and sustained for increased quantities sourced given
30 days. Time to place a purchase order Supplier lead time

© Copyright 2006 Supply-Chain Council, Inc. 474 June 2006
Performance Attribute: Supply Chain Flexibility Level 2 Metric: Upside Make Adaptability Metric Definition The maximum sustainable percentage increase in production that can be achieved in 30 days with the assumption of no raw material constraints.
Hierarchical Metric Structure
Level 1
Level 2
Constraint Factors
Qualitative Relationship Description Least quantity sustainable when considering all components
Upside Supply Chain Adaptability
Upside Make Adaptability
Current inventory on hand (WIP, FG)
Current internal equipment capacity utilization
Capital availability
Amount additional capital obtained in 30 days
Direct labor availability
Percent of labor used in manufacturing, not used in direct activity
Amount additional labor recruited/hired/trained in 30 days
Supplemental outsource/lease availability
Amount supplemental outsourced or leased resources or facilities obtained in 30 days
Productivity-units/orders produced per FTE
Current capital requirements
Amount additional inventory (raw) received and made (WIP, FG) in 30 days
Current manufacturing order cycle time
Internal and External manufacturing equipment capacity needed for current make volume
Manufacturing cycle time reestablished and sustained in 30 days
Internal and External facilities/, storage capacity needed for current make volume
Amount additional equipment obtained in 30 days
Amount additional internal space obtained in 30 days
Current internal facility/storage capacity utilization
Current make volume Additional make volume
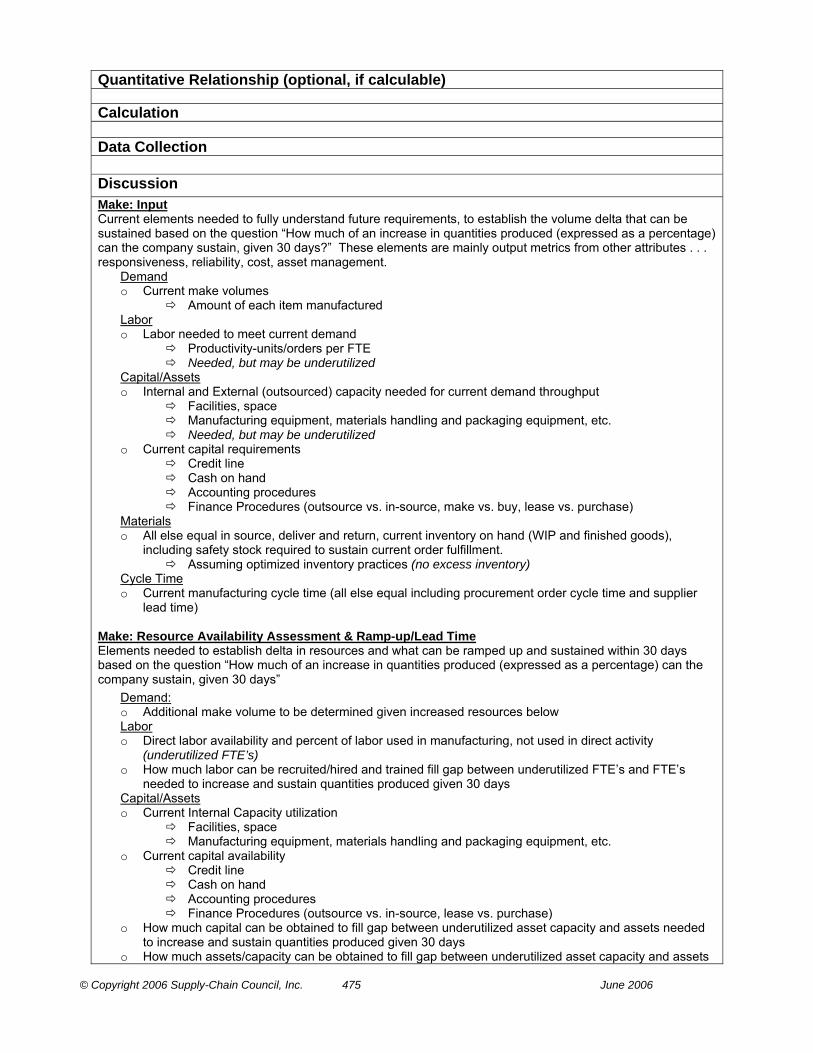
© Copyright 2006 Supply-Chain Council, Inc. 475 June 2006
Quantitative Relationship (optional, if calculable) Calculation Data Collection
Discussion Make: Input Current elements needed to fully understand future requirements, to establish the volume delta that can be sustained based on the question “How much of an increase in quantities produced (expressed as a percentage) can the company sustain, given 30 days?” These elements are mainly output metrics from other attributes . . . responsiveness, reliability, cost, asset management.
Demand o Current make volumes
Amount of each item manufactured Labor o Labor needed to meet current demand
Productivity-units/orders per FTE Needed, but may be underutilized
Capital/Assets o Internal and External (outsourced) capacity needed for current demand throughput
Facilities, space Manufacturing equipment, materials handling and packaging equipment, etc. Needed, but may be underutilized
o Current capital requirements Credit line Cash on hand Accounting procedures Finance Procedures (outsource vs. in-source, make vs. buy, lease vs. purchase)
Materials o All else equal in source, deliver and return, current inventory on hand (WIP and finished goods),
including safety stock required to sustain current order fulfillment. Assuming optimized inventory practices (no excess inventory)
Cycle Time o Current manufacturing cycle time (all else equal including procurement order cycle time and supplier
lead time) Make: Resource Availability Assessment & Ramp-up/Lead Time Elements needed to establish delta in resources and what can be ramped up and sustained within 30 days based on the question “How much of an increase in quantities produced (expressed as a percentage) can the company sustain, given 30 days”
Demand: o Additional make volume to be determined given increased resources below Labor o Direct labor availability and percent of labor used in manufacturing, not used in direct activity
(underutilized FTE’s) o How much labor can be recruited/hired and trained fill gap between underutilized FTE’s and FTE’s
needed to increase and sustain quantities produced given 30 days Capital/Assets o Current Internal Capacity utilization
Facilities, space Manufacturing equipment, materials handling and packaging equipment, etc.
o Current capital availability Credit line Cash on hand Accounting procedures Finance Procedures (outsource vs. in-source, lease vs. purchase)
o How much capital can be obtained to fill gap between underutilized asset capacity and assets needed to increase and sustain quantities produced given 30 days
o How much assets/capacity can be obtained to fill gap between underutilized asset capacity and assets
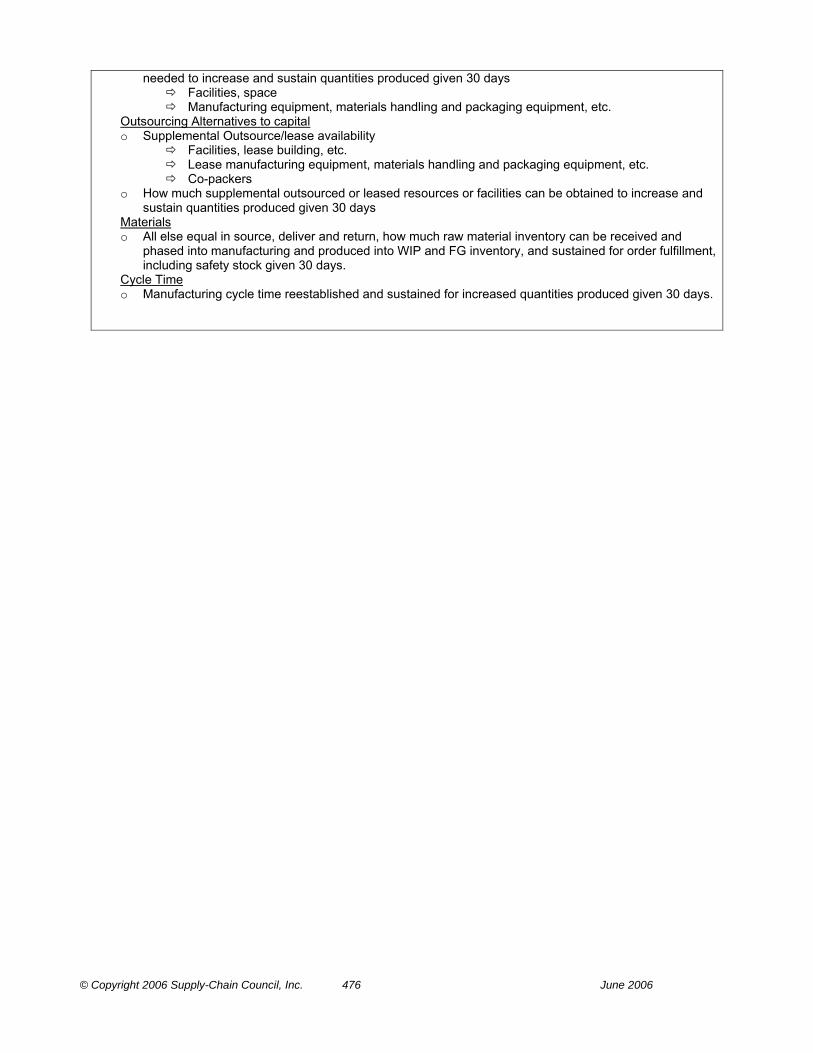
© Copyright 2006 Supply-Chain Council, Inc. 476 June 2006
needed to increase and sustain quantities produced given 30 days Facilities, space Manufacturing equipment, materials handling and packaging equipment, etc.
Outsourcing Alternatives to capital o Supplemental Outsource/lease availability
Facilities, lease building, etc. Lease manufacturing equipment, materials handling and packaging equipment, etc. Co-packers
o How much supplemental outsourced or leased resources or facilities can be obtained to increase and sustain quantities produced given 30 days
Materials o All else equal in source, deliver and return, how much raw material inventory can be received and
phased into manufacturing and produced into WIP and FG inventory, and sustained for order fulfillment, including safety stock given 30 days.
Cycle Time o Manufacturing cycle time reestablished and sustained for increased quantities produced given 30 days.

© Copyright 2006 Supply-Chain Council, Inc. 477 June 2006
Performance Attribute: Supply Chain Flexibility Level 2 Metric: Upside Deliver Adaptability Metric Definition The maximum sustainable percentage increase in quantities delivered that can be achieved in 30 days with the assumption of unconstrained finished good availability.
Hierarchical Metric Structure
Level 1
Level 2
Constraint Factors
Qualitative Relationship Description Least quantity sustainable when considering all components
Quantitative Relationship (optional, if calculable)
Upside Deliver Adaptability
Upside Supply Chain Adaptability
Current inventory on hand (FG)
Current internal equipment capacity utilization
Capital availability
Amount additional capital obtained in 30 days
Direct labor availability
Percent of labor used in logistics, not used in direct activity
Amount labor recruited/hired/trained in 30 days
Supplemental outsource/lease availability
Amount supplemental outsourced or leased resources or facilities obtained in 30 days
Productivity-orders shipped per FTE
Current capital requirements
Amount increase in inventory (FG) obtained in 30 days
Current logistics order cycle time
Internal and External (3PL) equipment capacity needed for current delivery volume
Logistics order cycle time reestablished and sustained in 30 days
Internal and External (3PL) storage capacity needed for current delivery volume
Amount of additional equipment obtained in 30 days
Amount of additional internal space obtained in 30 days
Current internal storage capacity utilization
Current delivery volume Additional delivery volume
© Copyright 2006 Supply-Chain Council, Inc. 478 June 2006
Calculation
© Copyright 2006 Supply-Chain Council, Inc. 479 June 2006
Data Collection Discussion Deliver: Input Current elements needed to fully understand future requirements, to establish the volume delta that can be sustained based on the question “How much of an increase in quantities delivered (expressed as a percentage) can the company sustain, given 30 days?” These elements are mainly output metrics from other attributes . . . responsiveness, reliability, cost, asset management.
Demand o Current delivery volume
Number of orders shipped Labor o Labor needed to meet current demand
Productivity-orders per FTE Needed, but may be underutilized
Capital/Assets o Internal and External (3PL) capacity needed for current demand throughput
Facilities, space Fleet equipment, outside carrier loads, materials handling equipment, etc. Needed, but may be underutilized
o Current capital requirements Credit line Cash on hand Accounting procedures Finance Procedures (outsource vs. in-source, make vs. buy, lease vs. purchase)
Materials o All else equal in source, make, return, current finished goods inventory on hand (including safety
stock required to sustain current order fulfillment) o Assuming optimized inventory practices (no excess inventory)
Cycle Time o Current logistics order cycle time (all else equal including procurement order cycle time, supplier
lead time, manufacturing cycle time, etc.) Customer order processing cycle time (logistics only) Dock-to-stock cycle time Pick-to-ship cycle time Transit time
Deliver: Resource Availability Assessment & Ramp-up/Lead Time Elements needed to establish delta in resources and what can be ramped up and sustained within 30 days based on the question “How much of an increase in quantities delivered (expressed as a percentage) can the company sustain, given 30 days”
Demand: o Additional delivery volume to be determined given increased resources below Labor o Direct labor availability and percent of labor used in logistics, not used in direct activity
(underutilized FTE’s) o How much labor can be recruited/hired and trained fill gap between underutilized FTE’s and FTE’s
needed to increase and sustain quantities delivered given 30 days Capital/Assets o Current Internal Capacity utilization
Facilities, space Fleet equipment, materials handling equipment, etc.
o Current capital availability Credit line Cash on hand Accounting procedures Finance Procedures (outsource vs. in-source, lease vs. purchase)
o How much capital can be obtained to fill gap between underutilized asset capacity and assets needed to increase and sustain quantities delivered given 30 days
© Copyright 2006 Supply-Chain Council, Inc. 480 June 2006
o How much assets/capacity can be obtained to fill gap between underutilized asset capacity and assets needed to increase and sustain quantities delivered given 30 days
Facilities, space Fleet equipment, materials handling equipment, etc.
Outsourcing Alternatives to capital o Supplemental Outsource/lease availability
3PL facilities, lease building, etc. Full service lease fleet, materials handling, etc. equipment Outside carriers
o How much supplemental outsourced or leased resources or facilities can be obtained to increase and sustain quantities delivered given 30 days
Materials o All else equal in source, make, return, amount of how much finished goods inventory can be
received/stocked, including safety stock to sustain quantities delivered given 30 days Cycle Time o Logistics cycle time reestablished and sustained for increased quantities delivered given 30 days
(all else equal including procurement order cycle time, supplier lead time, manufacturing cycle time, etc.)
Customer order processing cycle time (logistics only) Dock-to-stock cycle time Pick-to-ship cycle time Transit time
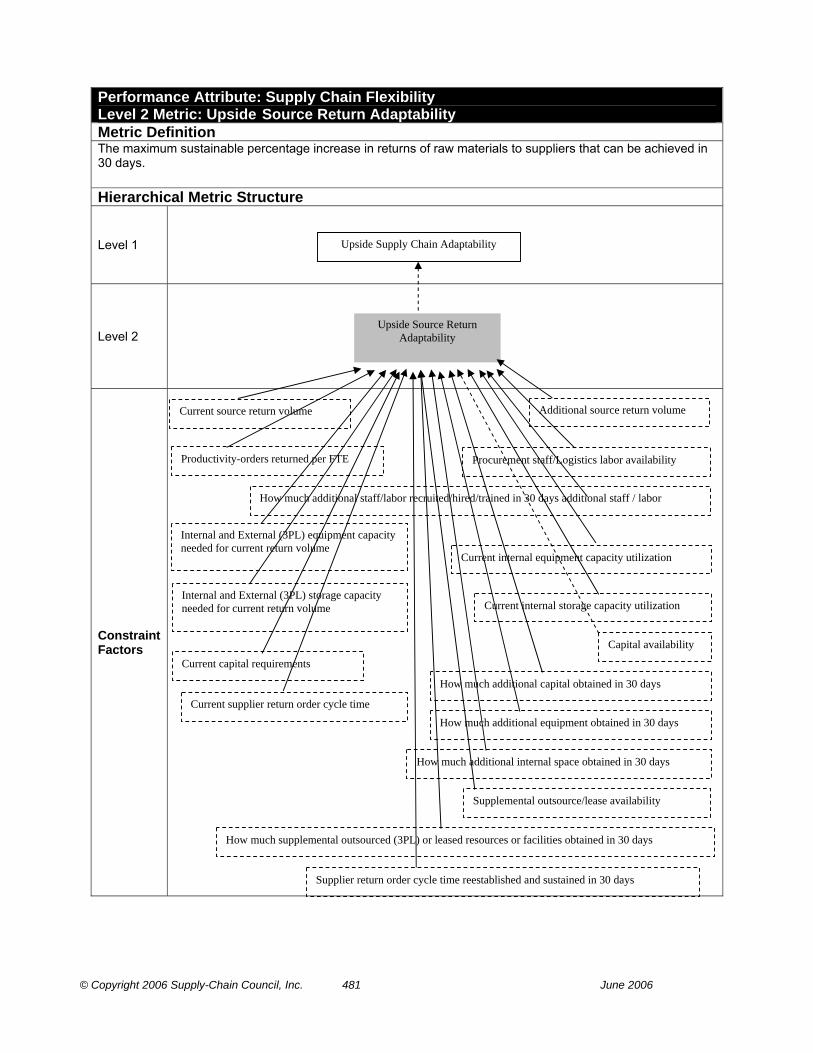
© Copyright 2006 Supply-Chain Council, Inc. 481 June 2006
Performance Attribute: Supply Chain Flexibility Level 2 Metric: Upside Source Return Adaptability Metric Definition The maximum sustainable percentage increase in returns of raw materials to suppliers that can be achieved in 30 days.
Hierarchical Metric Structure
Level 1
Level 2
Constraint Factors
Upside Source Return Adaptability
Upside Supply Chain Adaptability
Current internal equipment capacity utilization
Capital availability
How much additional capital obtained in 30 days
Procurement staff/Logistics labor availability
How much additional staff/labor recruited/hired/trained in 30 days additional staff / labor
Supplemental outsource/lease availability
How much supplemental outsourced (3PL) or leased resources or facilities obtained in 30 days
Productivity-orders returned per FTE
Current capital requirements
Current supplier return order cycle time
Internal and External (3PL) equipment capacity needed for current return volume
Supplier return order cycle time reestablished and sustained in 30 days
Internal and External (3PL) storage capacity needed for current return volume
How much additional equipment obtained in 30 days
How much additional internal space obtained in 30 days
Current internal storage capacity utilization
Current source return volume Additional source return volume
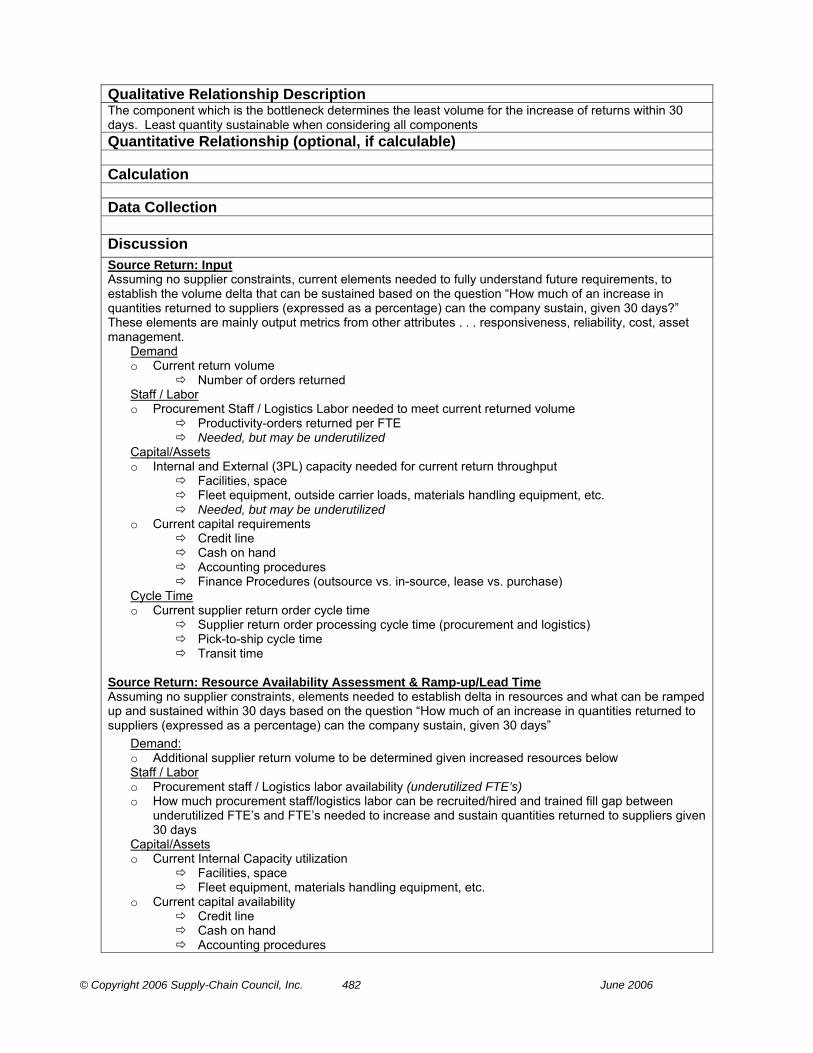
© Copyright 2006 Supply-Chain Council, Inc. 482 June 2006
Qualitative Relationship Description The component which is the bottleneck determines the least volume for the increase of returns within 30 days. Least quantity sustainable when considering all components Quantitative Relationship (optional, if calculable) Calculation Data Collection Discussion Source Return: Input Assuming no supplier constraints, current elements needed to fully understand future requirements, to establish the volume delta that can be sustained based on the question “How much of an increase in quantities returned to suppliers (expressed as a percentage) can the company sustain, given 30 days?” These elements are mainly output metrics from other attributes . . . responsiveness, reliability, cost, asset management.
Demand o Current return volume
Number of orders returned Staff / Labor o Procurement Staff / Logistics Labor needed to meet current returned volume
Productivity-orders returned per FTE Needed, but may be underutilized
Capital/Assets o Internal and External (3PL) capacity needed for current return throughput
Facilities, space Fleet equipment, outside carrier loads, materials handling equipment, etc. Needed, but may be underutilized
o Current capital requirements Credit line Cash on hand Accounting procedures Finance Procedures (outsource vs. in-source, lease vs. purchase)
Cycle Time o Current supplier return order cycle time
Supplier return order processing cycle time (procurement and logistics) Pick-to-ship cycle time Transit time
Source Return: Resource Availability Assessment & Ramp-up/Lead Time Assuming no supplier constraints, elements needed to establish delta in resources and what can be ramped up and sustained within 30 days based on the question “How much of an increase in quantities returned to suppliers (expressed as a percentage) can the company sustain, given 30 days”
Demand: o Additional supplier return volume to be determined given increased resources below Staff / Labor o Procurement staff / Logistics labor availability (underutilized FTE’s) o How much procurement staff/logistics labor can be recruited/hired and trained fill gap between
underutilized FTE’s and FTE’s needed to increase and sustain quantities returned to suppliers given 30 days
Capital/Assets o Current Internal Capacity utilization
Facilities, space Fleet equipment, materials handling equipment, etc.
o Current capital availability Credit line Cash on hand Accounting procedures

© Copyright 2006 Supply-Chain Council, Inc. 483 June 2006
Finance Procedures (outsource vs. in-source, lease vs. purchase) o How much capital can be obtained to fill gap between underutilized asset capacity and assets
needed to increase and sustain quantities returned to suppliers given 30 days o How much assets/capacity can be obtained to fill gap between underutilized asset capacity and
assets needed to increase and sustain quantities returned to suppliers given 30 days Facilities, space Fleet equipment, materials handling equipment, etc.
Outsourcing Alternatives to capital o Supplemental Outsource/lease availability
3PL facilities, lease building, etc. Full service lease fleet, materials handling, etc. equipment Outside carriers
o How much supplemental outsourced or leased resources or facilities can be obtained to increase and sustain quantities returned to suppliers given 30 days
Cycle Time o Source return cycle time reestablished and sustained for increased quantities returned to suppliers
given 30 days Supplier return order processing cycle time (procurement and logistics) Pick-to-ship cycle time Transit time
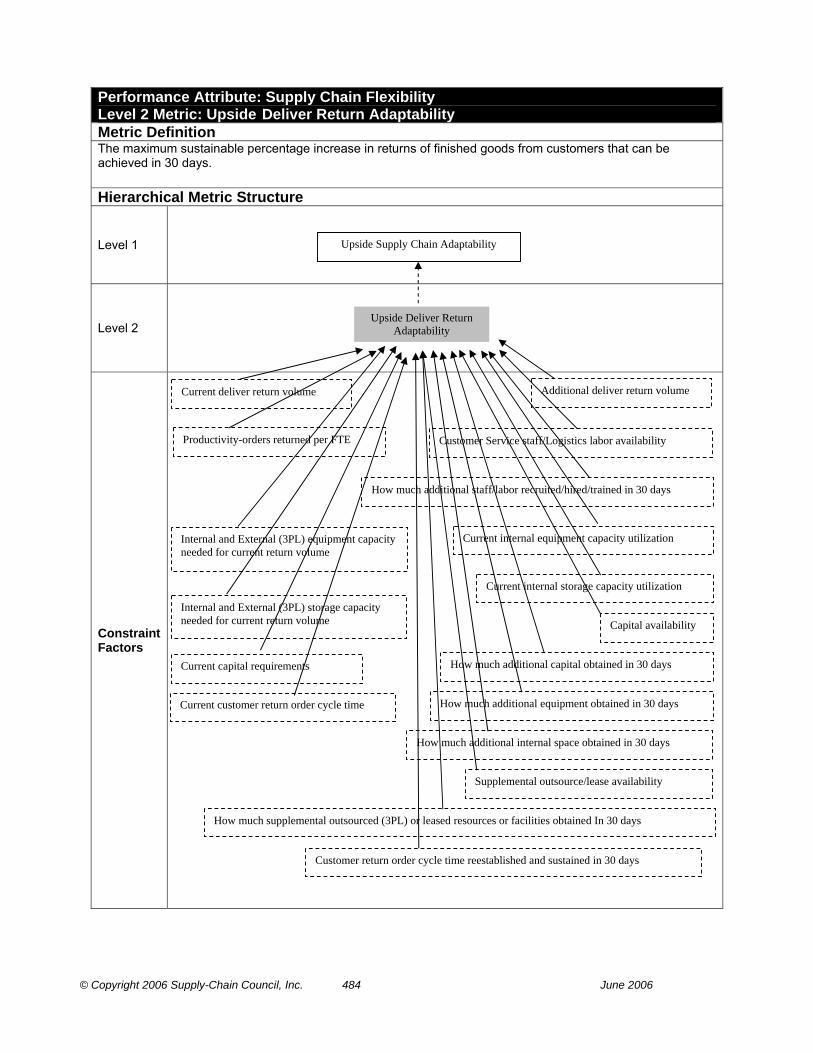
© Copyright 2006 Supply-Chain Council, Inc. 484 June 2006
Performance Attribute: Supply Chain Flexibility Level 2 Metric: Upside Deliver Return Adaptability Metric Definition The maximum sustainable percentage increase in returns of finished goods from customers that can be achieved in 30 days.
Hierarchical Metric Structure
Level 1
Level 2
Constraint Factors
Upside Deliver Return Adaptability
Upside Supply Chain Adaptability
Current internal equipment capacity utilization
Capital availability
How much additional capital obtained in 30 days
Customer Service staff/Logistics labor availability
How much additional staff/labor recruited/hired/trained in 30 days
Supplemental outsource/lease availability
How much supplemental outsourced (3PL) or leased resources or facilities obtained In 30 days
Productivity-orders returned per FTE
Current capital requirements
Current customer return order cycle time
Internal and External (3PL) equipment capacity needed for current return volume
Customer return order cycle time reestablished and sustained in 30 days
Internal and External (3PL) storage capacity needed for current return volume
How much additional equipment obtained in 30 days
How much additional internal space obtained in 30 days
Current internal storage capacity utilization
Current deliver return volume Additional deliver return volume
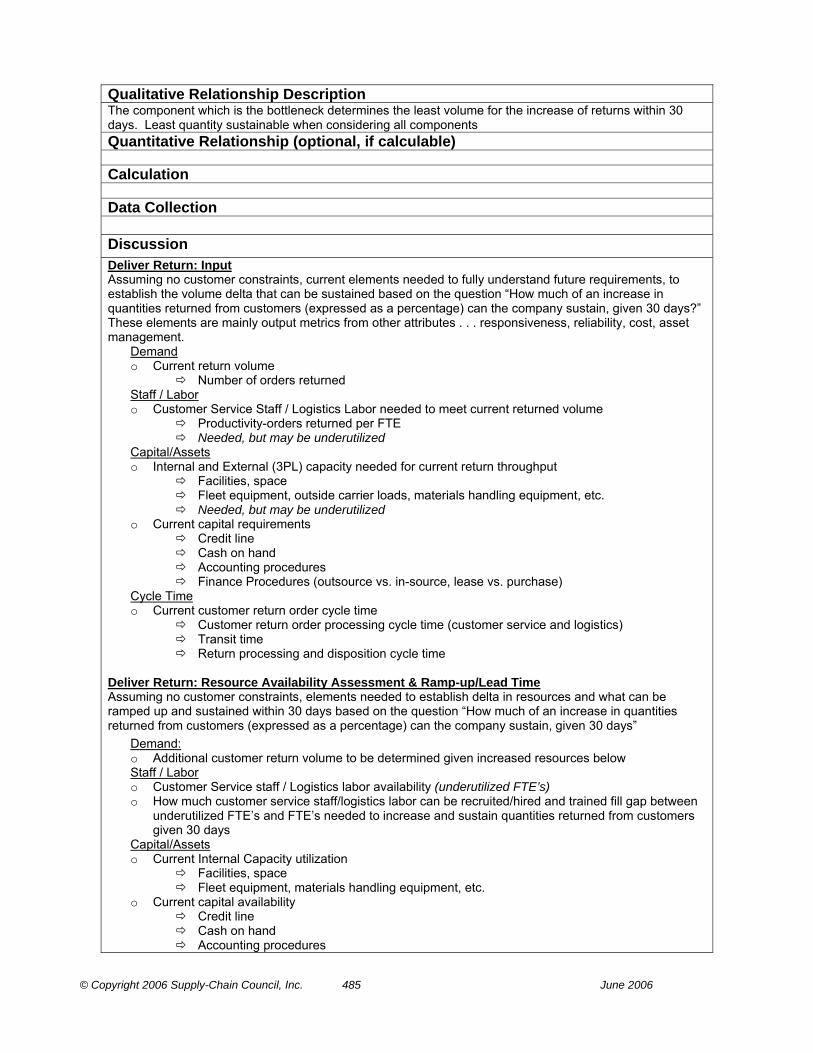
© Copyright 2006 Supply-Chain Council, Inc. 485 June 2006
Qualitative Relationship Description The component which is the bottleneck determines the least volume for the increase of returns within 30 days. Least quantity sustainable when considering all components Quantitative Relationship (optional, if calculable) Calculation Data Collection Discussion Deliver Return: Input Assuming no customer constraints, current elements needed to fully understand future requirements, to establish the volume delta that can be sustained based on the question “How much of an increase in quantities returned from customers (expressed as a percentage) can the company sustain, given 30 days?” These elements are mainly output metrics from other attributes . . . responsiveness, reliability, cost, asset management.
Demand o Current return volume
Number of orders returned Staff / Labor o Customer Service Staff / Logistics Labor needed to meet current returned volume
Productivity-orders returned per FTE Needed, but may be underutilized
Capital/Assets o Internal and External (3PL) capacity needed for current return throughput
Facilities, space Fleet equipment, outside carrier loads, materials handling equipment, etc. Needed, but may be underutilized
o Current capital requirements Credit line Cash on hand Accounting procedures Finance Procedures (outsource vs. in-source, lease vs. purchase)
Cycle Time o Current customer return order cycle time
Customer return order processing cycle time (customer service and logistics) Transit time Return processing and disposition cycle time
Deliver Return: Resource Availability Assessment & Ramp-up/Lead Time Assuming no customer constraints, elements needed to establish delta in resources and what can be ramped up and sustained within 30 days based on the question “How much of an increase in quantities returned from customers (expressed as a percentage) can the company sustain, given 30 days”
Demand: o Additional customer return volume to be determined given increased resources below Staff / Labor o Customer Service staff / Logistics labor availability (underutilized FTE’s) o How much customer service staff/logistics labor can be recruited/hired and trained fill gap between
underutilized FTE’s and FTE’s needed to increase and sustain quantities returned from customers given 30 days
Capital/Assets o Current Internal Capacity utilization
Facilities, space Fleet equipment, materials handling equipment, etc.
o Current capital availability Credit line Cash on hand Accounting procedures

© Copyright 2006 Supply-Chain Council, Inc. 486 June 2006
Finance Procedures (outsource vs. in-source, lease vs. purchase) o How much capital can be obtained to fill gap between underutilized asset capacity and assets
needed to increase and sustain quantities returned from customers given 30 days o How much assets/capacity can be obtained to fill gap between underutilized asset capacity and
assets needed to increase and sustain quantities returned from customers given 30 days Facilities, space Fleet equipment, materials handling equipment, etc.
Outsourcing Alternatives to capital o Supplemental Outsource/lease availability
3PL facilities, lease building, etc. Full service lease fleet, materials handling, etc. equipment Outside carriers
o How much supplemental outsourced or leased resources or facilities can be obtained to increase and sustain quantities returned from customers given 30 days
Cycle Time o Deliver return cycle time reestablished and sustained for increased quantities returned to suppliers
given 30 days o Customer return order processing cycle time (customer service and logistics)
Transit time Return processing and disposition cycle time

© Copyright 2006 Supply-Chain Council, Inc. 487 June 2006
Performance Attribute: Supply Chain Flexibility Level 1 Metric: Downside Supply Chain Adaptability Metric Definition The reduction in quantities ordered sustainable at 30 days prior to delivery with no inventory or cost penalties. Note: 30 days is an arbitrary number provided for benchmarking purposes. For some industries and some organizations 30 days may be in some cases unobtainable or in others too conservative. Hierarchical Metric Structure
Level 1
Level 2
Qualitative Relationship Description The calculation of downside supply chain adaptability requires the calculation to be based on the least reduction sustainable when considering Source, Make, and Deliver components. Downside Source Adaptability: The raw material quantity reduction sustainable at 30 days prior to delivery with no inventory or cost penalties. Downside Make Adaptability: The production reduction sustainable at 30 days prior to delivery with no inventory or cost penalties. Downside Deliver Adaptability: The reduction in delivered quantities sustainable at 30 days prior to delivery with no inventory or cost penalties. Quantitative Relationship (optional, if calculable) Downside Source Adaptability + Downside Make Adaptability + Downside Deliver Adaptability Calculation Data Collection
Adaptability measures are assumption based on historic events. Some elements can be measured and taken as a basis for further considerations.
Discussion The calculation of Supply Chain Adaptability requires the calculation to be the least quantity sustainable when considering Source, Make, Deliver and Return components.
P&L Impact Revenue COGS SGA
Balance Sheet Impact Inventory
Downside Supply Adaptability
Downside Source Adaptability
Downside Make Adaptability
Downside Deliver Adaptability
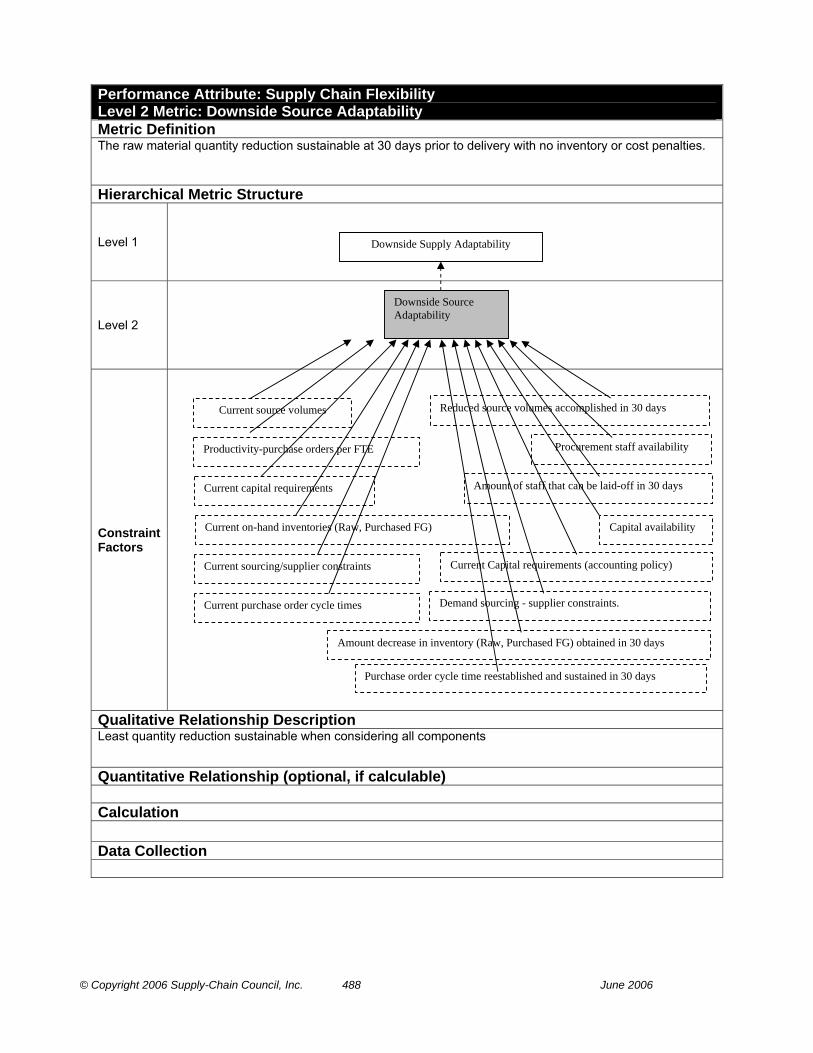
© Copyright 2006 Supply-Chain Council, Inc. 488 June 2006
Performance Attribute: Supply Chain Flexibility Level 2 Metric: Downside Source Adaptability Metric Definition The raw material quantity reduction sustainable at 30 days prior to delivery with no inventory or cost penalties.
Hierarchical Metric Structure
Level 1
Level 2
Constraint Factors
Qualitative Relationship Description Least quantity reduction sustainable when considering all components
Quantitative Relationship (optional, if calculable) Calculation Data Collection
Downside Source Adaptability
Downside Supply Adaptability
Current source volumes
Current capital requirements
Current sourcing/supplier constraints
Current purchase order cycle times
Current on-hand inventories (Raw, Purchased FG) Capital availability
Reduced source volumes accomplished in 30 days
Demand sourcing - supplier constraints.
Productivity-purchase orders per FTE Procurement staff availability
Amount of staff that can be laid-off in 30 days
Current Capital requirements (accounting policy)
Purchase order cycle time reestablished and sustained in 30 days
Amount decrease in inventory (Raw, Purchased FG) obtained in 30 days

© Copyright 2006 Supply-Chain Council, Inc. 489 June 2006
Discussion Source: Input Current elements needed to fully understand future requirements, to establish the volume delta that can be sustained based on the question “How much of a reduction in quantities sourced (expressed as a percentage) can the company sustain, given 30 days?” These elements are mainly output metrics from other attributes . . . responsiveness, reliability, cost, asset management.
Demand o Current source volumes
Amount of each item purchased Staffing o Staff needed to meet current demand
Productivity-purchase orders per FTE Needed, but may be underutilized
Capital o Current capital requirements
Accounting procedures Materials o All else equal in make, deliver, return, current inventory on hand (raw material and purchased
finished goods), including safety stock required to sustain current order fulfillment. Assuming optimized inventory practices (no excess inventory)
o Current sourcing/supplier constraints Current contract terms. Nature of items; commodity/sole source.
Cycle Time o Current procurement cycle time
Time to place a purchase order Supplier lead time
Source: Resource Availability Assessment & Ramp-down/Lead Time Elements needed to establish delta in resources and what can be ramped down and sustained at 30 days prior to delivery based on the question “How much of a decrease in quantities sourced (expressed as a percentage) can the company sustain without inventory or cost penalties, given 30 days notice prior to delivery”
Demand: o Reduced source volume to be determined given ramped down resources below Staffing o Staff availability in procurement (underutilized FTE’s) o How much staff can be laid-off or diverted to other activities, without cost penalty, to ramp down to
decreased quantities delivered given 30 days notice Capital o Current capital requirements
Accounting procedures for selling/diverting/recycling assets Materials o Sourcing Constraints
Time required in negotiating new source/volume contracts/terms Time required to ramp down supplier inventory
o How much inventory (raw material and purchased finished goods) can be returned, sold or diverted without cost penalty to ramp down to decreased quantities delivered given 30 days notice
Cycle Time o Procurement order cycle time reestablished and sustained for decreased quantities sourced given
30 days. Time to place a purchase order Supplier lead time

© Copyright 2006 Supply-Chain Council, Inc. 490 June 2006
Performance Attribute: Supply Chain Flexibility Level 2 Metric: Downside Make Adaptability Metric Definition The production reduction sustainable at 30 days prior to delivery with no inventory or cost penalties.
Hierarchical Metric Structure
Level 1
Level 2
Constraint Factors
Downside Supply Adaptability
Upside Make Adaptability
Productivity-units/orders produced per FTE
Current inventory on hand (WIP, FG)
Current internal equipment capacity utilization
Capital Requirements (Acct/Finance Policy)
Direct labor availability
Percent of labor used in manufacturing, not used in direct activity
Amount labor that can be laid off in 30 days
Supplemental outsource/lease termination ability
Amount supplemental outsourced or leased resources or facilities terminated in 30 days
Current capital requirements
Amount reduced in inventory made (WIP, FG) in 30 days
Current manufacturing order cycle time
Internal and External manufacturing equipment capacity needed for current make volume
Manufacturing cycle time reestablished and sustained in 30 days
Internal and External facilities/, storage capacity needed for current make volume
Amount of equipment recycled, diverted or sold in 30 days
Amount internal space subleased or sold in 30 days
Current internal facility/storage capacity utilization
Current make volume Reduced make volume
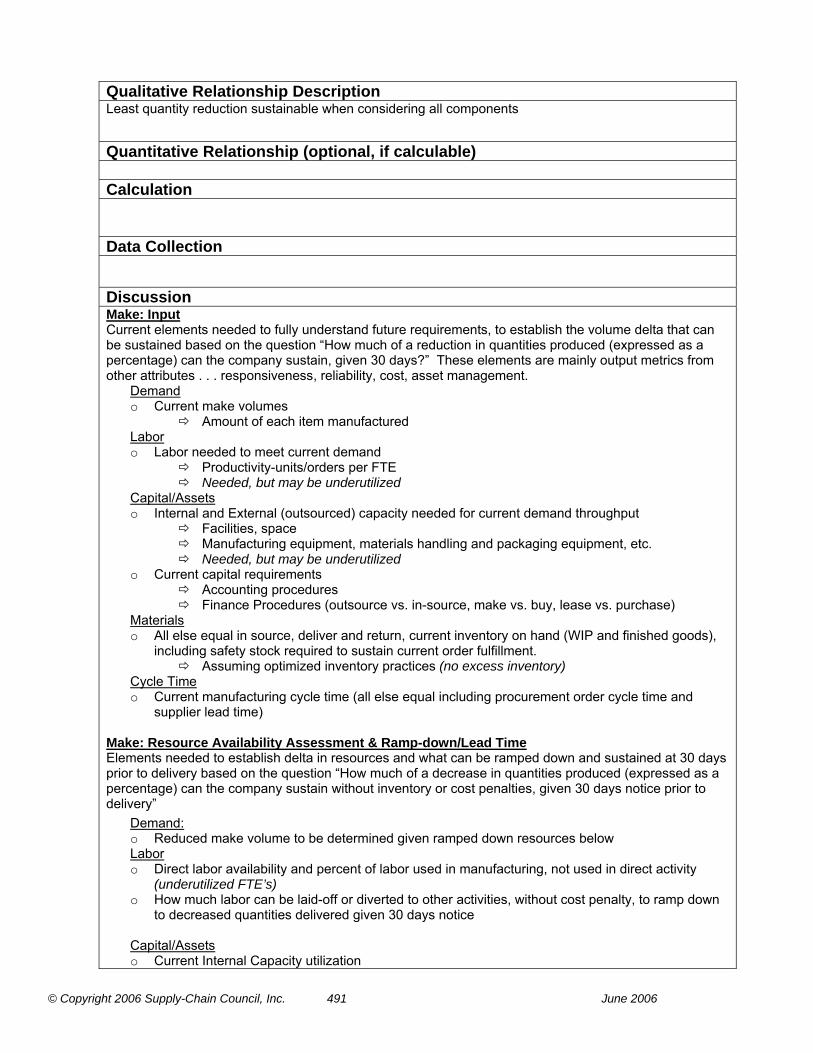
© Copyright 2006 Supply-Chain Council, Inc. 491 June 2006
Qualitative Relationship Description Least quantity reduction sustainable when considering all components
Quantitative Relationship (optional, if calculable) Calculation
Data Collection
Discussion Make: Input Current elements needed to fully understand future requirements, to establish the volume delta that can be sustained based on the question “How much of a reduction in quantities produced (expressed as a percentage) can the company sustain, given 30 days?” These elements are mainly output metrics from other attributes . . . responsiveness, reliability, cost, asset management.
Demand o Current make volumes
Amount of each item manufactured Labor o Labor needed to meet current demand
Productivity-units/orders per FTE Needed, but may be underutilized
Capital/Assets o Internal and External (outsourced) capacity needed for current demand throughput
Facilities, space Manufacturing equipment, materials handling and packaging equipment, etc. Needed, but may be underutilized
o Current capital requirements Accounting procedures Finance Procedures (outsource vs. in-source, make vs. buy, lease vs. purchase)
Materials o All else equal in source, deliver and return, current inventory on hand (WIP and finished goods),
including safety stock required to sustain current order fulfillment. Assuming optimized inventory practices (no excess inventory)
Cycle Time o Current manufacturing cycle time (all else equal including procurement order cycle time and
supplier lead time) Make: Resource Availability Assessment & Ramp-down/Lead Time Elements needed to establish delta in resources and what can be ramped down and sustained at 30 days prior to delivery based on the question “How much of a decrease in quantities produced (expressed as a percentage) can the company sustain without inventory or cost penalties, given 30 days notice prior to delivery”
Demand: o Reduced make volume to be determined given ramped down resources below Labor o Direct labor availability and percent of labor used in manufacturing, not used in direct activity
(underutilized FTE’s) o How much labor can be laid-off or diverted to other activities, without cost penalty, to ramp down
to decreased quantities delivered given 30 days notice
Capital/Assets o Current Internal Capacity utilization

© Copyright 2006 Supply-Chain Council, Inc. 492 June 2006
Facilities, space Manufacturing equipment, materials handling and packaging equipment, etc.
o Current capital requirements Accounting procedures for selling/diverting/recycling assets Finance Procedures (outsource vs. in-source, make vs. buy, lease vs. purchase) and
their effect upon ability to terminate leases or sell capital equipment assets. o How many capital equipment assets can be recycled, diverted or sold or subleased without cost
penalty, to ramp down to decreased quantities delivered given 30 days notice Facilities, space Manufacturing equipment, materials handling and packaging equipment, etc.
Outsourcing Alternatives to capital o Supplemental Outsource/lease availability
Facilities, lease building, etc. Lease manufacturing equipment, materials handling and packaging equipment, etc. Co-packers
o How much supplemental outsourced or leased resources or facilities can be terminated to ramp down to decreased quantities delivered given 30 days notice
Materials o All else equal in source, deliver and return, how much manufacturing quantities (WIP and FG
inventory), including safety stock can be ramped down to decreased order fulfillment quantities given 30 days notice.
Cycle Time o Manufacturing cycle time reestablished and sustained for decreased quantities produced given
30 days.

© Copyright 2006 Supply-Chain Council, Inc. 493 June 2006
Performance Attribute: Supply Chain Flexibility Level 2 Metric: Downside Deliver Adaptability Metric Definition Downside Deliver Adaptability = The reduction in delivered quantities sustainable at 30 days prior to delivery with no inventory or cost penalties. Hierarchical Metric Structure
Level 1
Level 2
Constraint Factors
Downside Deliver Adaptability
Downside Supply Adaptability
Current inventory on hand (FG)
Current internal equipment capacity utilization
Capital Requirements (Acct/Finance Policy)
Direct labor availability
Percent of labor used in logistics, not used in direct activity
Amount labor that can be laid off in 30 days
Supplemental outsource/lease termination ability
Amount supplemental outsourced or leased resources or facilities terminated in 30 days
Productivity-orders shipped per FTE
Current capital requirements
Amount decrease in inventory (FG) obtained in 30 days
Current logistics order cycle time
Internal and External (3PL) equipment capacity needed for current delivery volume
Logistics order cycle time reestablished and sustained in 30 days
Internal and External (3PL) storage capacity needed for current delivery volume
Amount of equipment recycled, diverted or sold in 30 days
Amount internal space subleased or sold in 30 days
Current internal storage capacity utilization
Current delivery volume Reduced delivery volume

© Copyright 2006 Supply-Chain Council, Inc. 494 June 2006
Qualitative Relationship Description Least quantity reduction sustainable when considering all components
Quantitative Relationship (optional, if calculable) Calculation
Data Collection
Discussion Deliver: Input Elements Current elements needed to fully understand future requirements, to establish what can be ramped down and sustained at 30 days prior to delivery, based on the question “How much of a decrease in quantities delivered (expressed as a percentage) can the company sustain without inventory or cost penalties, given 30 days notice prior to delivery?” These elements are mainly output metrics from other attributes . . . responsiveness, reliability, cost, asset management.
Demand o Current delivery volume
Number of orders shipped Labor o Labor needed to meet current demand
Productivity-orders per FTE Needed, but may be underutilized
Capital/Assets o Internal and External (3PL) capacity needed for current demand throughput
Facilities, space Fleet equipment, outside carrier loads, materials handling equipment, etc. Needed, but may be underutilized
o Current capital requirements Accounting procedures Finance Procedures (outsource vs. in-source, make vs. buy, lease vs. purchase)
Materials o All else equal in source, make, return, current finished goods inventory on hand (including safety
stock required to sustain current order fulfillment) o Assuming optimized inventory practices (no excess inventory)
Cycle Time o Current logistics order cycle time (all else equal including procurement order cycle time, supplier
lead time, manufacturing cycle time, etc.) Customer order processing cycle time (logistics only) Dock-to-stock cycle time Pick-to-ship cycle time Transit time
Deliver: Availability Assessment & Ramp-down/Lead Time Elements needed to establish delta in resources and what can be ramped down and sustained at 30 days prior to delivery based on the question “How much of a decrease in quantities delivered (expressed as a percentage) can the company sustain without inventory or cost penalties, given 30 days notice prior to delivery”
Demand: o Reduced delivery volume to be determined given ramped down resources below Labor o Direct labor availability and percent of labor used in logistics, not used in direct activity
(underutilized FTE’s)

© Copyright 2006 Supply-Chain Council, Inc. 495 June 2006
o How much labor can be laid-off or diverted to other activities, without cost penalty, to ramp down to decreased quantities delivered given 30 days notice
Capital/Assets o Current Internal Capacity utilization o Facilities, space
Fleet equipment, materials handling equipment, etc. o Current capital requirements
Accounting procedures for selling/diverting/recycling assets Finance Procedures (outsource vs. in-source, make vs. buy, lease vs. purchase) and their
effect upon ability to terminate leases or sell capital equipment assets. o How many capital equipment assets can be recycled, diverted or sold without cost penalty, to ramp
down to decreased quantities delivered given 30 days notice Facilities, space Fleet equipment, materials handling equipment, etc.
Outsourcing Alternatives to capital o Supplemental Outsource/lease availability
3PL facilities, lease building, etc. Full service lease fleet, materials handling, etc. equipment Outside carriers
o How much supplemental outsourced or leased resources or facilities agreements can be terminated to ramp down to decreased quantities delivered given 30 days notice
Materials o All else equal in source, make, return, how much inventory can be shipped or diverted without cost
penalty to ramp down to decreased quantities delivered given 30 days notice (all else equal in source and make, includes safety stock)
Cycle Time o Logistics cycle time reestablished and sustained for decreased quantities delivered given 30 days
(all else equal including procurement order cycle time, supplier lead time, manufacturing cycle time, etc.)
Customer order processing cycle time (logistics only) Dock-to-stock cycle time Pick-to-ship cycle time Transit time
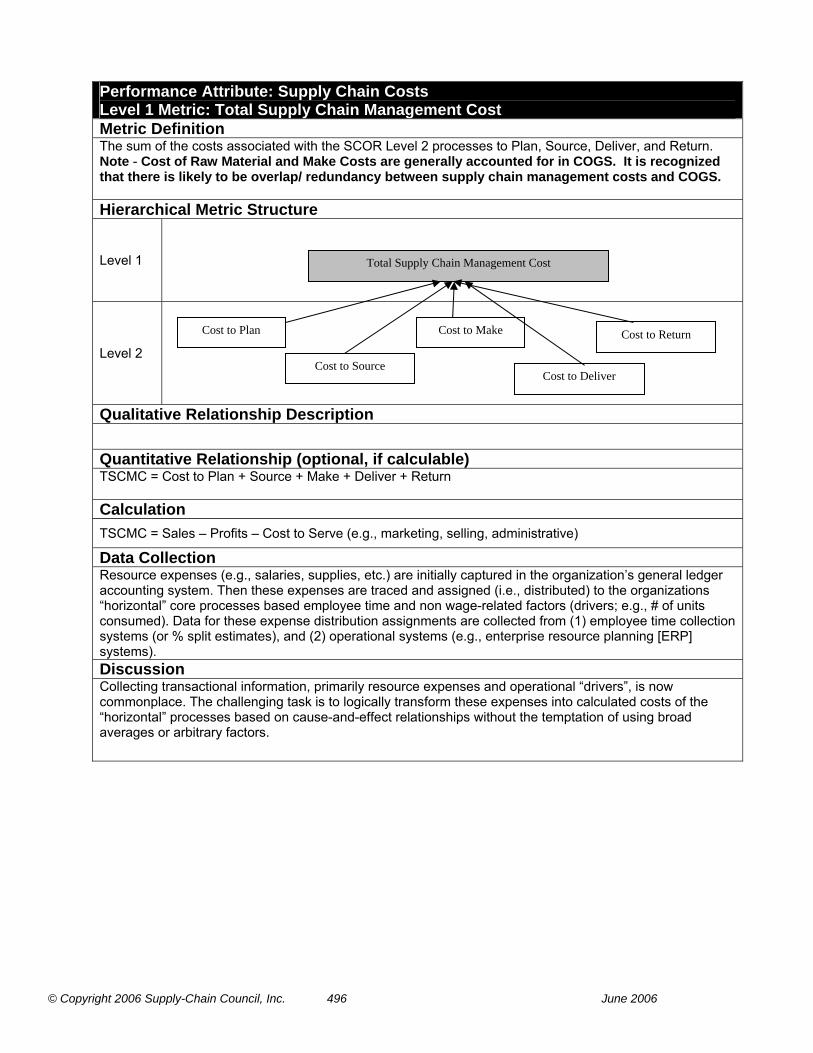
© Copyright 2006 Supply-Chain Council, Inc. 496 June 2006
Performance Attribute: Supply Chain Costs Level 1 Metric: Total Supply Chain Management Cost Metric Definition The sum of the costs associated with the SCOR Level 2 processes to Plan, Source, Deliver, and Return. Note - Cost of Raw Material and Make Costs are generally accounted for in COGS. It is recognized that there is likely to be overlap/ redundancy between supply chain management costs and COGS. Hierarchical Metric Structure
Level 1
Level 2
Qualitative Relationship Description
Quantitative Relationship (optional, if calculable) TSCMC = Cost to Plan + Source + Make + Deliver + Return Calculation TSCMC = Sales – Profits – Cost to Serve (e.g., marketing, selling, administrative)
Data Collection Resource expenses (e.g., salaries, supplies, etc.) are initially captured in the organization’s general ledger accounting system. Then these expenses are traced and assigned (i.e., distributed) to the organizations “horizontal” core processes based employee time and non wage-related factors (drivers; e.g., # of units consumed). Data for these expense distribution assignments are collected from (1) employee time collection systems (or % split estimates), and (2) operational systems (e.g., enterprise resource planning [ERP] systems). Discussion Collecting transactional information, primarily resource expenses and operational “drivers”, is now commonplace. The challenging task is to logically transform these expenses into calculated costs of the “horizontal” processes based on cause-and-effect relationships without the temptation of using broad averages or arbitrary factors.
Total Supply Chain Management Cost
Cost to Plan Cost to Make Cost to Return
Cost to Source Cost to Deliver

© Copyright 2006 Supply-Chain Council, Inc. 497 June 2006
Performance Attribute: Supply Chain Costs Level 2 Metric: Cost to Plan Process Number: P1, P2, P3, P4, P5 Metric Definition The sum of the costs associated with Plan.
Hierarchical Metric Structure
Level 1
Level 2
Level 3
Qualitative Relationship Description Quantitative Relationship (optional, if calculable) Cost to Plan = Sum of Cost to Plan (Plan + Source + Make + Deliver + Return) Calculation
Data Collection Resource expenses (e.g., salaries, supplies, etc.) are initially captured in the organization’s general ledger accounting system. Then these expenses are traced and assigned (i.e., distributed) to the organizations “horizontal” core processes based employee time and non wage-related factors (drivers; e.g., # of units consumed). Data for these expense distribution assignments are collected from (1) employee time collection systems (or % split estimates), and (2) operational systems (e.g., enterprise resource planning [ERP] systems). Discussion Collecting transactional information, primarily resource expenses and operational “drivers”, is now commonplace. The challenging task is to logically transform these expenses into calculated costs of the “horizontal” processes based on cause-and-effect relationships without the temptation of using broad averages or arbitrary factors.
Cost to Plan Source
Cost to Plan
Cost to Plan Make
Cost to Plan Deliver Cost to Plan Return
Cost to Plan Supply Chain
Total Supply Chain Management Cost (TSCMC)

© Copyright 2006 Supply-Chain Council, Inc. 498 June 2006
Performance Attribute: Supply Chain Costs Level 2 Metric: Cost to Source Process Number: S1, S2, S3 Metric Definition The sum of the costs associated with Source.
Hierarchical Metric Structure
Level 1
Level 2
Level 3
Qualitative Relationship Description
Quantitative Relationship (optional, if calculable) Cost to Source = Sum of Cost for (Supplier Management + Material Acquisition Management) Calculation - Supplier Management = material planning + planning procurement staff + supplier negotiation and qualification + etc. - Material Acquisition Management = bidding and quotations + ordering + receiving + incoming material inspection + material storage + payment authorization + sourcing business rules and rqmts. + inbound freight and duties + etc. Data Collection Resource expenses (e.g., salaries, supplies, etc.) are initially captured in the organization’s general ledger accounting system. Then these expenses are traced and assigned (i.e., distributed) to the organizations “horizontal” core processes based employee time and non wage-related factors (drivers; e.g., # of units consumed). Data for these expense distribution assignments are collected from (1) employee time collection systems (or % split estimates), and (2) operational systems (e.g., enterprise resource planning [ERP] systems). Discussion Collecting transactional information, primarily resource expenses and operational “drivers”, is now commonplace. The challenging task is to logically transform these expenses into calculated costs of the “horizontal” processes based on cause-and-effect relationships without the temptation of using broad averages or arbitrary factors.
Supplier Management (See processes under Source)
Cost to Source
Material Acquisition Management (See processes under Source)
Total Supply Chain Management Cost (TSCMC)
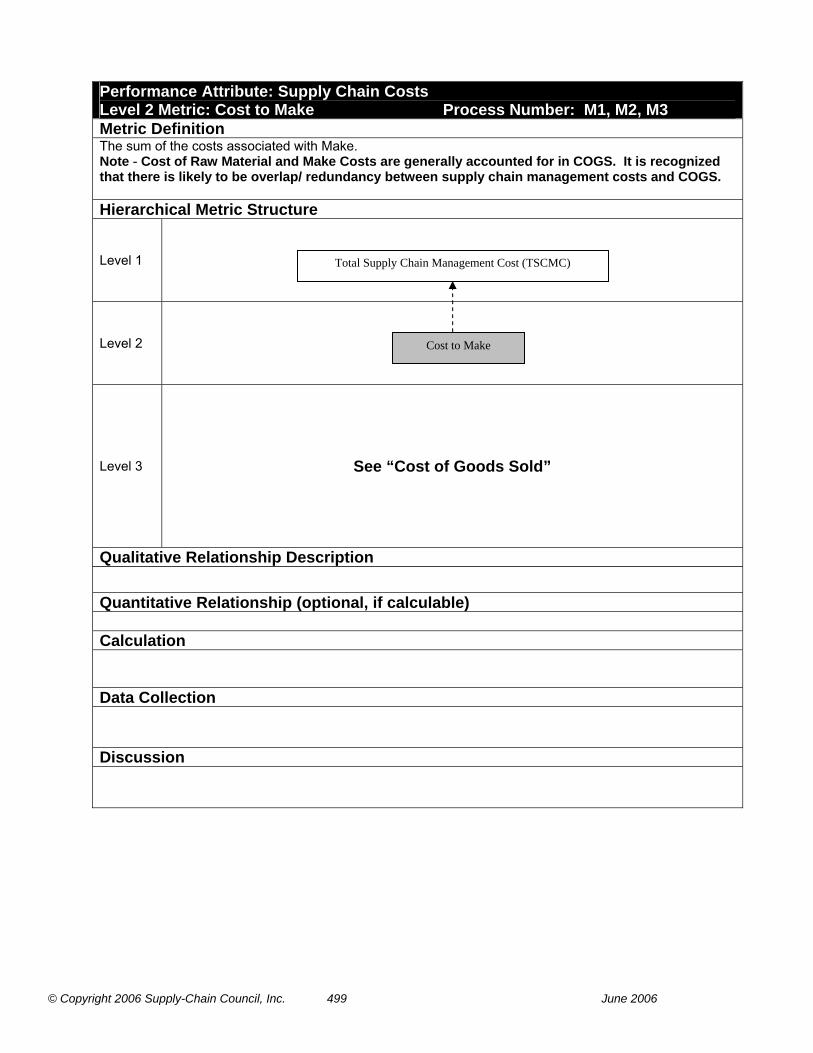
© Copyright 2006 Supply-Chain Council, Inc. 499 June 2006
Performance Attribute: Supply Chain Costs Level 2 Metric: Cost to Make Process Number: M1, M2, M3 Metric Definition The sum of the costs associated with Make. Note - Cost of Raw Material and Make Costs are generally accounted for in COGS. It is recognized that there is likely to be overlap/ redundancy between supply chain management costs and COGS. Hierarchical Metric Structure
Level 1
Level 2
Level 3 See “Cost of Goods Sold”
Qualitative Relationship Description Quantitative Relationship (optional, if calculable) Calculation
Data Collection
Discussion
Cost to Make
Total Supply Chain Management Cost (TSCMC)
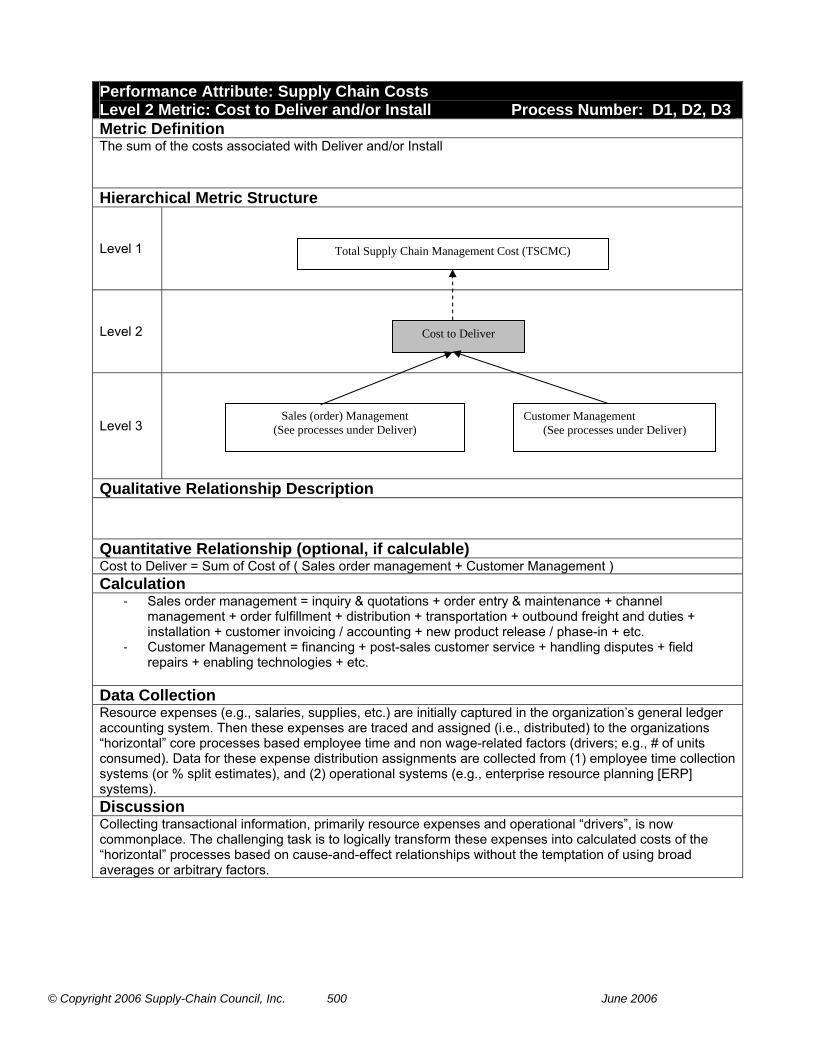
© Copyright 2006 Supply-Chain Council, Inc. 500 June 2006
Performance Attribute: Supply Chain Costs Level 2 Metric: Cost to Deliver and/or Install Process Number: D1, D2, D3 Metric Definition The sum of the costs associated with Deliver and/or Install
Hierarchical Metric Structure
Level 1
Level 2
Level 3
Qualitative Relationship Description
Quantitative Relationship (optional, if calculable) Cost to Deliver = Sum of Cost of ( Sales order management + Customer Management ) Calculation
- Sales order management = inquiry & quotations + order entry & maintenance + channel management + order fulfillment + distribution + transportation + outbound freight and duties + installation + customer invoicing / accounting + new product release / phase-in + etc.
- Customer Management = financing + post-sales customer service + handling disputes + field repairs + enabling technologies + etc.
Data Collection Resource expenses (e.g., salaries, supplies, etc.) are initially captured in the organization’s general ledger accounting system. Then these expenses are traced and assigned (i.e., distributed) to the organizations “horizontal” core processes based employee time and non wage-related factors (drivers; e.g., # of units consumed). Data for these expense distribution assignments are collected from (1) employee time collection systems (or % split estimates), and (2) operational systems (e.g., enterprise resource planning [ERP] systems). Discussion Collecting transactional information, primarily resource expenses and operational “drivers”, is now commonplace. The challenging task is to logically transform these expenses into calculated costs of the “horizontal” processes based on cause-and-effect relationships without the temptation of using broad averages or arbitrary factors.
Sales (order) Management (See processes under Deliver)
Cost to Deliver
Customer Management (See processes under Deliver)
Total Supply Chain Management Cost (TSCMC)

© Copyright 2006 Supply-Chain Council, Inc. 501 June 2006
Performance Attribute: Supply Chain Costs Level 2 Metric: Cost to Return Process Number: SRx, DRx Metric Definition Cost to Return Defective Product - The sum of the costs associated with returning a defective product to the supplier. Cost to Return Excess Product - The sum of the costs associated with returning excess product to the supplier. Cost to Return MRO Product - The sum of the costs associated with returning MRO product to the supplier. Hierarchical Metric Structure
Level 1
Level 2
Level 3
Qualitative Relationship Description Quantitative Relationship (optional, if calculable) Cost to Return = Sum of Cost to Return ( to Sources + from Customers ) Calculation
- Cost to Return to Source (SRx) = Verify Defective Product Costs + Disposition of Defective Product Costs + Identify MRO Condition Costs + Request MRO Return Authorization Costs + Schedule MRO Shipment Costs + Return MRO Product Costs + etc.
- Cost to Return From Customer (DRx) = Authorization Costs + Schedule Return Costs + Receive Costs + Authorize MRO Return Costs + Schedule MRO Return Costs + Receive MRO Return Costs + Transfer MRO Product Costs + etc.
Data Collection Resource expenses (e.g., salaries, supplies, etc.) are initially captured in the organization’s general ledger accounting system. Then these expenses are traced and assigned (i.e., distributed) to the organizations “horizontal” core processes based employee time and non wage-related factors (drivers; e.g., # of units consumed). Data for these expense distribution assignments are collected from (1) employee time collection systems (or % split estimates), and (2) operational systems (e.g., enterprise resource planning [ERP] systems). Discussion Collecting transactional information, primarily resource expenses and operational “drivers”, is now commonplace. The challenging task is to logically transform these expenses into calculated costs of the “horizontal” processes based on cause-and-effect relationships without the temptation of using broad averages or arbitrary factors.
Cost to Source Return
Cost to Return
Cost to Deliver Return
Total Supply Chain Management Cost (TSCMC)
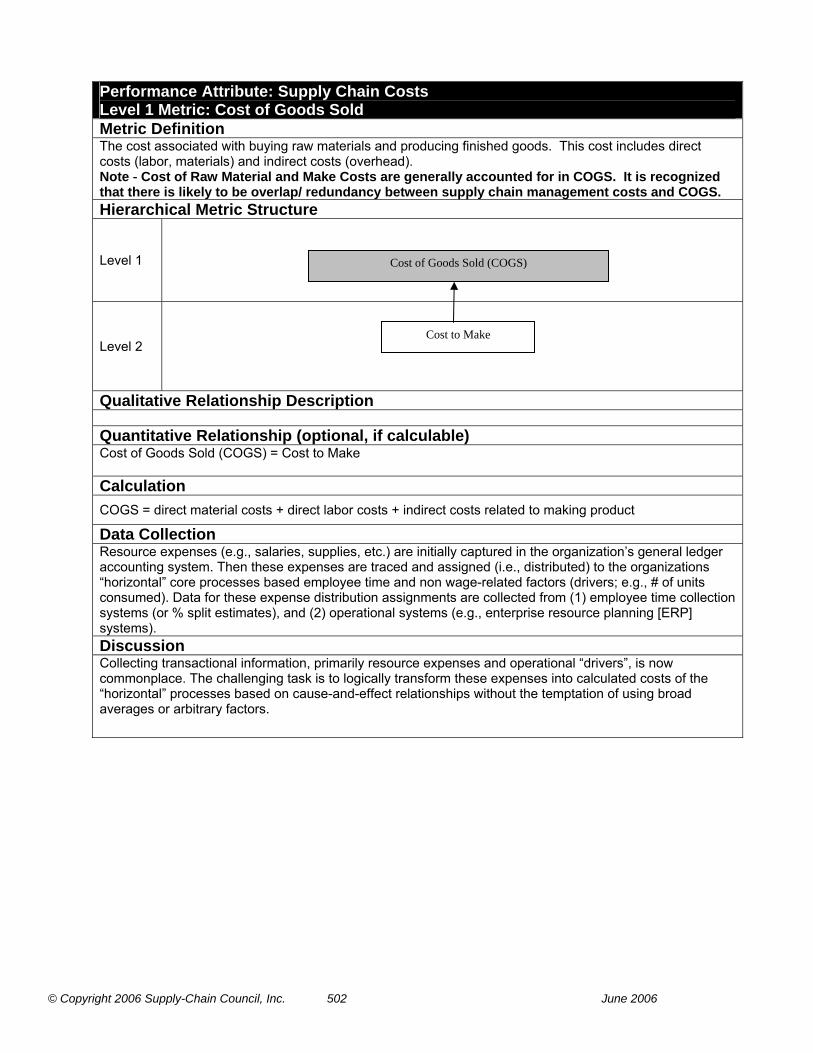
© Copyright 2006 Supply-Chain Council, Inc. 502 June 2006
Performance Attribute: Supply Chain Costs Level 1 Metric: Cost of Goods Sold Metric Definition The cost associated with buying raw materials and producing finished goods. This cost includes direct costs (labor, materials) and indirect costs (overhead). Note - Cost of Raw Material and Make Costs are generally accounted for in COGS. It is recognized that there is likely to be overlap/ redundancy between supply chain management costs and COGS. Hierarchical Metric Structure
Level 1
Level 2
Qualitative Relationship Description Quantitative Relationship (optional, if calculable) Cost of Goods Sold (COGS) = Cost to Make Calculation COGS = direct material costs + direct labor costs + indirect costs related to making product
Data Collection Resource expenses (e.g., salaries, supplies, etc.) are initially captured in the organization’s general ledger accounting system. Then these expenses are traced and assigned (i.e., distributed) to the organizations “horizontal” core processes based employee time and non wage-related factors (drivers; e.g., # of units consumed). Data for these expense distribution assignments are collected from (1) employee time collection systems (or % split estimates), and (2) operational systems (e.g., enterprise resource planning [ERP] systems). Discussion Collecting transactional information, primarily resource expenses and operational “drivers”, is now commonplace. The challenging task is to logically transform these expenses into calculated costs of the “horizontal” processes based on cause-and-effect relationships without the temptation of using broad averages or arbitrary factors.
Cost of Goods Sold (COGS)
Cost to Make

© Copyright 2006 Supply-Chain Council, Inc. 503 June 2006
Performance Attribute: Supply Chain Costs Level 2 Metric: Cost to Make Process Number: M1, M2, M3 Metric Definition The sum of the costs associated with Make.
Hierarchical Metric Structure
Level 1
Level 2
Level 3
Qualitative Relationship Description Quantitative Relationship (optional, if calculable) Cost to Make = Sum of Direct Material, Direct Labor, and Direct non-Material Product-related Cost (equipment) and of Indirect Product-related Cost Calculation Data Collection Resource expenses (e.g., salaries, supplies, etc.) are initially captured in the organization’s general ledger accounting system. Then these expenses are traced and assigned (i.e., distributed) to the organizations “horizontal” core processes based employee time and non wage-related factors (drivers; e.g., # of units consumed). Data for these expense distribution assignments are collected from (1) employee time collection systems (or % split estimates), and (2) operational systems (e.g., enterprise resource planning [ERP] systems). In some cases, (1) direct material data is maintained at the “unit level” in bills of material (BOMs) or recipe formulas; and (2) direct labor and direct non-material product (equipment) data is maintained at the “unit level” in labor/machine routings or process sheets. Discussion Collecting transactional information, primarily resource expenses and operational “drivers”, is now commonplace. The challenging task is to logically transform these expenses into calculated costs of (1) the “horizontal” processes (referenced in Lean environments as “value-stream mapping”), and (2) products (or intermediate outputs) – with both types of calculations based on cause-and-effect relationships without the temptation of using broad averages or arbitrary factors.
Direct Material Cost
Cost to Make
Direct Labor Cost
Indirect Cost Related to Production
Cost of Goods Sold (COGS)

© Copyright 2006 Supply-Chain Council, Inc. 504 June 2006
Performance Attribute: Supply Chain Asset Management Level 1 Metric: Cash-to-Cash Cycle Time Metric Definition
The time it takes for an investment made to flow back into a company after it has been spent for raw materials. For services, this represents the time from the point where a company pays for the resources consumed in the performance of a service to the time that the company received payment from the customer for those services. Hierarchical Metric Structure
Level 1
Level 2
Qualitative Relationship Description The longer the cash-to-cash cycle, the more current assets needed (relative to current liabilities) since it takes longer to convert inventories and receivables into cash. In other words, the longer the cash-to-cash cycle, the more net working capital required.
Quantitative Relationship (optional, if calculable) The Cash-to-Cash Cycle time is measured by converting into days the supply of inventory in stock and the number of days outstanding for accounts receivable and accounts payable. The inventory days of supply is added to the days outstanding for accounts receivable. The accounts payable days outstanding is subtracted from this total to determine the cash-to-cash cycle time. Calculation Cash-to-Cash Cycle Time = Inventory Days of Supply + Days Sales Outstanding – Days Payable Outstanding Level 2 Metrics: Inventory Days of Supply = the amount of inventory (stock) expressed in days of sales. The [5 point rolling average of gross value of inventory at standard cost] / [annual cost of goods sold (COGS) / 365] Example: If 2 items a day are sold and 20 items are held in inventory, this represents 10 days’ (20/2) sales in inventory. (Other names: Days cost-of-sales in inventory, Days’ sales in inventory) Days Sales Outstanding = the length of time from when a sale is made until cash for it is received from customers. The amount of sales outstanding expressed in days. The [5 point rolling average of gross accounts receivable (AR)] / [total gross annual sales / 365]. Example: If $5000 worth of sales were made per day and $50,000 worth of sales were outstanding, this would represent 10 days’ ($50,000/$5000) of sales outstanding. (Other names: Days sales in Accounts receivables)
Cash-to-Cash Cycle Time
Days Sales Outstanding
Inventory Days of Supply
Days Payable Outstanding
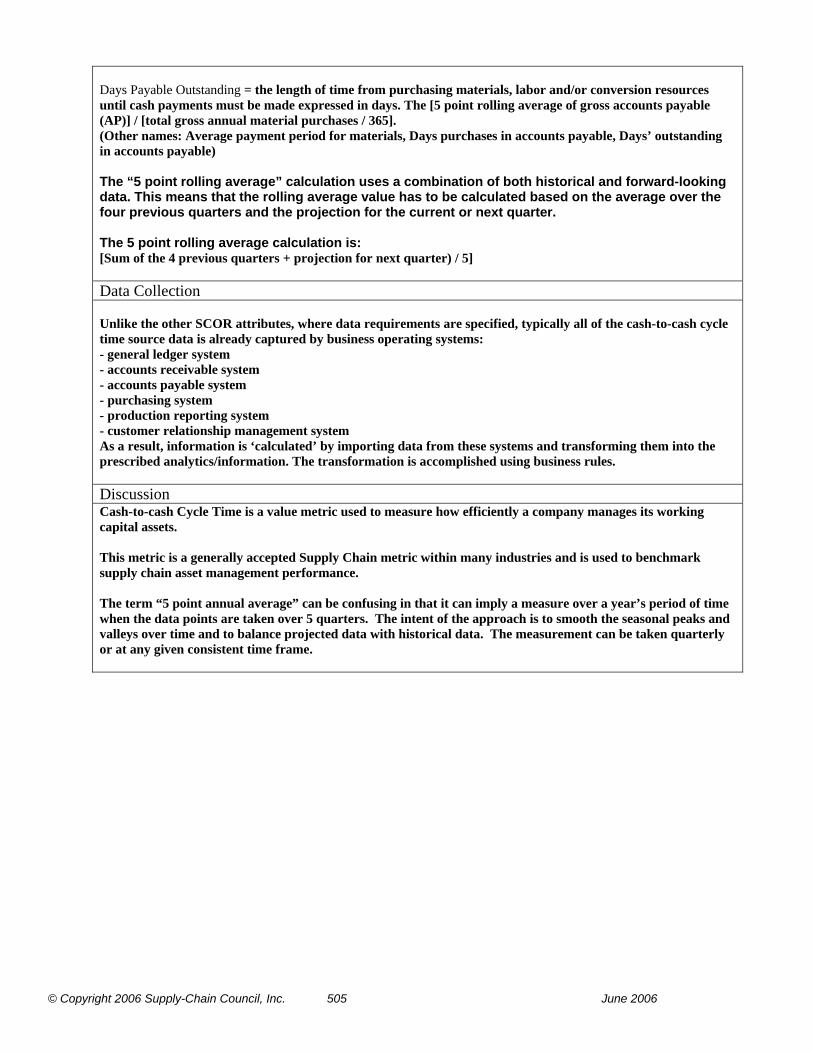
© Copyright 2006 Supply-Chain Council, Inc. 505 June 2006
Days Payable Outstanding = the length of time from purchasing materials, labor and/or conversion resources until cash payments must be made expressed in days. The [5 point rolling average of gross accounts payable (AP)] / [total gross annual material purchases / 365]. (Other names: Average payment period for materials, Days purchases in accounts payable, Days’ outstanding in accounts payable) The “5 point rolling average” calculation uses a combination of both historical and forward-looking data. This means that the rolling average value has to be calculated based on the average over the four previous quarters and the projection for the current or next quarter. The 5 point rolling average calculation is: [Sum of the 4 previous quarters + projection for next quarter) / 5] Data Collection Unlike the other SCOR attributes, where data requirements are specified, typically all of the cash-to-cash cycle time source data is already captured by business operating systems: - general ledger system - accounts receivable system - accounts payable system - purchasing system - production reporting system - customer relationship management system As a result, information is ‘calculated’ by importing data from these systems and transforming them into the prescribed analytics/information. The transformation is accomplished using business rules. Discussion Cash-to-cash Cycle Time is a value metric used to measure how efficiently a company manages its working capital assets. This metric is a generally accepted Supply Chain metric within many industries and is used to benchmark supply chain asset management performance. The term “5 point annual average” can be confusing in that it can imply a measure over a year’s period of time when the data points are taken over 5 quarters. The intent of the approach is to smooth the seasonal peaks and valleys over time and to balance projected data with historical data. The measurement can be taken quarterly or at any given consistent time frame.

© Copyright 2006 Supply-Chain Council, Inc. 506 June 2006
Performance Attribute: Supply Chain Asset Management Level 1 Metric: Return on Supply Chain Fixed Assets Metric Definition Return on Supply Chain Fixed Assets measures the return an organization receives on its invested capital in supply chain fixed assets. This includes the fixed assets used in Plan, Source, Make, Deliver, and Return.
Hierarchical Metric Structure
Level 1
Level 2
Level 3
Qualitative Relationship Description
Quantitative Relationship (optional, if calculable) The return on supply chain fixed assets is measured by monetizing the supply chain revenue, cost of goods sold and supply chain management costs to determine the profit from the respective supply chain. This amount is divided by the supply chain fixed assets to determine the return generated from the respective supply chain. Calculation Return on Supply Chain Fixed Assets = (Supply Chain Revenue – COGS – Supply Chain Management Costs) / Supply-Chain Fixed Assets "Supply Chain Revenue" is used in the metric rather than just Net Revenue. SC Revenue is calculated as: Supply Chain Revenue - COGS - Total Supply Chain Management Costs. This provides the revenue generated through the supply chain less the total costs associated with the supply chain. There is a need for a more specific “revenue” number than “Net Revenue” for use in the “Supply Chain
Return on Supply Chain Fixed Assets
Supply Chain Revenue Supply Chain Management Costs
Supply Chain Fixed Assets
Make Fixed Asset Value
Source Fixed Asset Value
Deliver Fixed Asset Value
Return Fixed Asset Value
Plan Fixed Asset Value
Cost of Goods Sold

© Copyright 2006 Supply-Chain Council, Inc. 507 June 2006
Revenue" level 2 metric. Net Revenue could include revenue from sources other than the supply chain, such as investments, leasing real estate, court settlements, etc... Supply Chain Revenue will be used and will be only the portion of Net Revenue that is generated by the specific supply chain being measured and analyzed. Level 2 Metrics Supply-Chain Revenue Operating revenue generated from a supply chain. This does not include non-operating revenue, such as leasing real estate, investments, court settlements, sale of office buildings, etc... COGS Calculation - Refer to the section for COGS in the Attribute for Costs. Supply Chain Management Costs Calculation - refer to the section for Supply-Chain Management Costs in the Attribute for Costs. Supply Chain Fixed Assets Source Fixed Asset Value + Make Fixed Asset Value + Deliver Fixed Asset Value + Return Fixed Asset Value + Plan Fixed Asset Value Level 3 Metrics Plan Fixed Asset Value- The current value of the supply chain assets used in supply chain integration (See EP.5) Source Fixed Asset Value - The current value of the supply chain assets used in the Source process. (See ES.5) Make Fixed Asset Value- The current value of the supply chain assets used in the Make process. (See EM.5) Deliver Fixed Asset Value - The current value of the supply chain assets used in the Deliver process. (See ED.5) Return Fixed Asset Value - The current value of the supply chain assets used in the Return process. (See ER.5) A Revised Capital Plan is an output of the Manage Integrated Supply Chain Fixed Assets (EP.5) process element and would contain supply chain capital asset information that could be used in measuring the Supply Chain Fixed Assets. Data Collection Unlike the other SCOR attributes, where data requirements are specified, typically all of the return on working capital’s source data is already captured by business operating systems: - general ledger system - fixed asset system - purchasing system - labor reporting system - production reporting system - customer relationship management system As a result, information is ‘calculated’ by importing data from these systems and transforming them into the prescribed analytics/information. The transformation is accomplished using business rules. In order to measure Return on Supply Chain Fixed Assets, the investment in supply chain capital assets needs to be known. This requires a clear understanding of what is a “supply chain fixed asset”. SCOR Ex.5 process elements were used since these are all focused on managing SC capital assets. It is the assets managed in these Enable processes that comprise Supply Chain Fixed Assets. The value of these assets is the denominator of the metric.

© Copyright 2006 Supply-Chain Council, Inc. 508 June 2006
Discussion Range of fixed assets used in an organization that have the character of permanency rather than being rapidly replaced (or expensed); examples include land, warehouse, trucks, buildings, investments, and plant and machinery. Fixed assets used to operate the Supply Chain in each of the categories (P, S, M, D, R) are tracked within the Ex.5 process elements. A Revised Capital Plan is an output of the Manage Integrated Supply Chain Fixed Assets (EP.5) process element and would contain supply chain capital asset information that could be used in measuring the Supply Chain Fixed Asset Value.
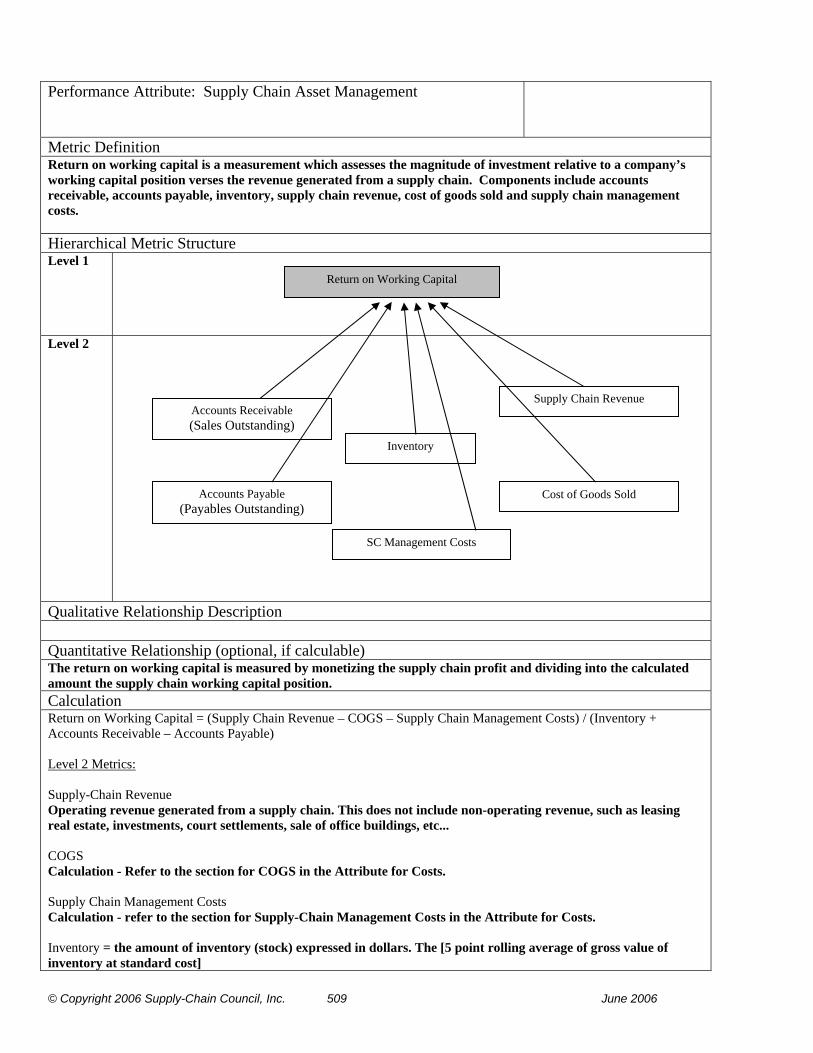
© Copyright 2006 Supply-Chain Council, Inc. 509 June 2006
Performance Attribute: Supply Chain Asset Management Level 1 Metric: Return on Working Capital
P1, P2, P3, P4, S1, S2, S3, M1, M2, M3, D1, D2, D3, D4
Metric Definition Return on working capital is a measurement which assesses the magnitude of investment relative to a company’s working capital position verses the revenue generated from a supply chain. Components include accounts receivable, accounts payable, inventory, supply chain revenue, cost of goods sold and supply chain management costs. Hierarchical Metric Structure Level 1
Level 2
Qualitative Relationship Description
Quantitative Relationship (optional, if calculable) The return on working capital is measured by monetizing the supply chain profit and dividing into the calculated amount the supply chain working capital position. Calculation Return on Working Capital = (Supply Chain Revenue – COGS – Supply Chain Management Costs) / (Inventory + Accounts Receivable – Accounts Payable) Level 2 Metrics: Supply-Chain Revenue Operating revenue generated from a supply chain. This does not include non-operating revenue, such as leasing real estate, investments, court settlements, sale of office buildings, etc... COGS Calculation - Refer to the section for COGS in the Attribute for Costs. Supply Chain Management Costs Calculation - refer to the section for Supply-Chain Management Costs in the Attribute for Costs. Inventory = the amount of inventory (stock) expressed in dollars. The [5 point rolling average of gross value of inventory at standard cost]
Return on Working Capital
Accounts Payable (Payables Outstanding)
Accounts Receivable (Sales Outstanding)
Inventory
Supply Chain Revenue
Cost of Goods Sold
SC Management Costs

© Copyright 2006 Supply-Chain Council, Inc. 510 June 2006
Sales Outstanding = the amount of accounts receivable outstanding expressed in dollars. The [5 point rolling average of gross accounts receivable (AR)] Payables Outstanding = expressed in dollars, the amount of purchased materials, labor and/or conversion resources that are to be paid (accounts payable). The [5 point rolling average of gross accounts payable (A/P)] The “5 point rolling average” calculation uses a combination of both historical and forward-looking data. This means that the rolling average value has to be calculated based on the average over the four previous quarters and the projection for the current or next quarter. The 5 point rolling average calculation is: [Sum of the 4 previous quarters + projection for next quarter) / 5] Data Collection Unlike the other SCOR attributes, where data requirements are specified, typically all of the return on working capital’s source data is already captured by business operating systems: - general ledger system - accounts receivable system - accounts payable system - purchasing system - labor reporting system - production reporting system - customer relationship management system As a result, information is ‘calculated’ by importing data from these systems and transforming them into the prescribed analytics/information. The transformation is accomplished using business rules. Discussion "Supply Chain Revenue" is used in the metric rather than just Net Revenue. SC Revenue is calculated as: Supply Chain Revenue - COGS - Total Supply Chain Management Costs. This provides the revenue generated through the supply chain less the total costs associated with the supply chain. There is a need for a more specific “revenue” number than “Net Revenue” for use in the “Supply Chain Revenue" level 2 metric. Net Revenue could include revenue from sources other than the supply chain, such as investments, leasing real estate, court settlements, etc... Supply Chain Revenue will be used and will be only the portion of Net Revenue that is generated by the specific supply chain being measured and analyzed.
© Copyright 2006 Supply-Chain Council, Inc. 511 June 2006
APPENDIX B Best Practices
Definition of a Best Practice A current, structured, proven and repeatable method for making a positive impact on desired operational results. Current - Must not be emerging (bleeding edge) and must not be antiquated Structured - Has clearly stated Goal, Scope, Process, and Procedure Proven - Success has been demonstrated in a working environment. Repeatable - The practice has been proven in multiple environments. Method Used in a very broad sense to indicate: business process, practice, organizational strategy, enabling technology, business relationship, business model, as well as information or knowledge management.
Positive impact on desired operational results The practice shows operational improvement related to the stated goal and could be linked to Key Metric(s). The impact should show ether as gain (increase in speed, revenues, quality) or reduction (resource utilizations, costs, loss, returns, etc.).
(Defined by SCC Best Practices Team, 2003)
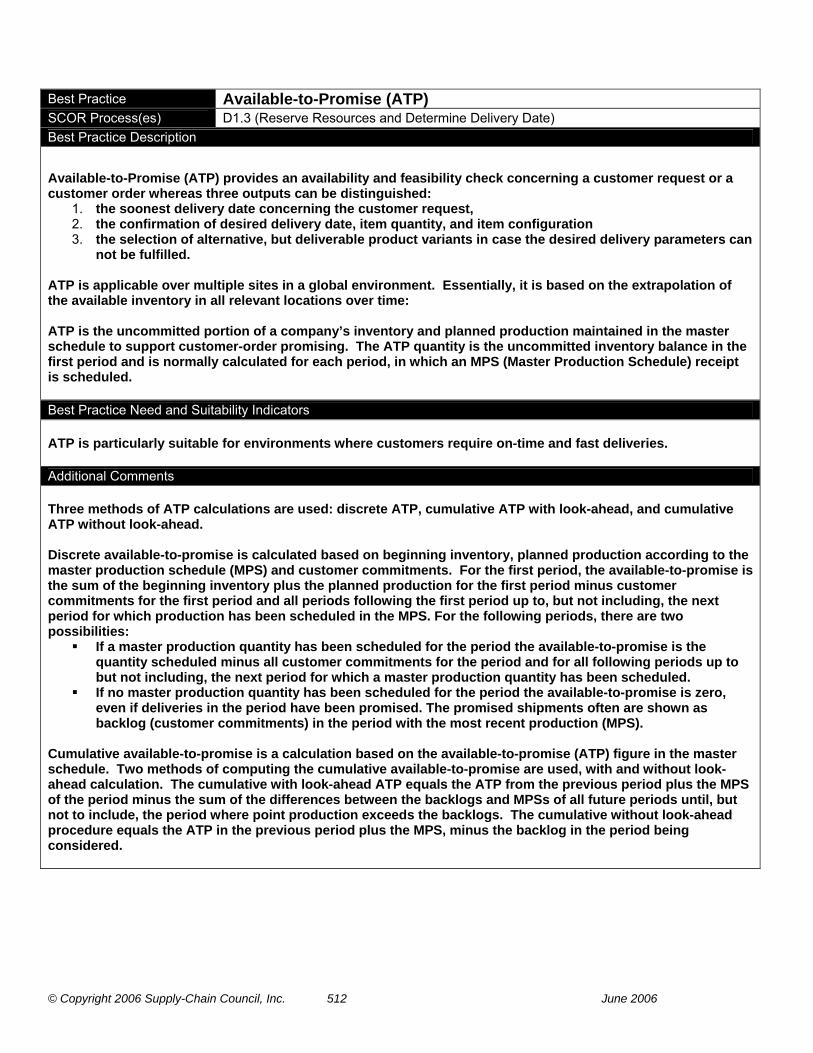
© Copyright 2006 Supply-Chain Council, Inc. 512 June 2006
Best Practice Available-to-Promise (ATP) SCOR Process(es) D1.3 (Reserve Resources and Determine Delivery Date) Best Practice Description
Available-to-Promise (ATP) provides an availability and feasibility check concerning a customer request or a customer order whereas three outputs can be distinguished:
1. the soonest delivery date concerning the customer request, 2. the confirmation of desired delivery date, item quantity, and item configuration 3. the selection of alternative, but deliverable product variants in case the desired delivery parameters can
not be fulfilled. ATP is applicable over multiple sites in a global environment. Essentially, it is based on the extrapolation of the available inventory in all relevant locations over time: ATP is the uncommitted portion of a company’s inventory and planned production maintained in the master schedule to support customer-order promising. The ATP quantity is the uncommitted inventory balance in the first period and is normally calculated for each period, in which an MPS (Master Production Schedule) receipt is scheduled. Best Practice Need and Suitability Indicators ATP is particularly suitable for environments where customers require on-time and fast deliveries. Additional Comments Three methods of ATP calculations are used: discrete ATP, cumulative ATP with look-ahead, and cumulative ATP without look-ahead. Discrete available-to-promise is calculated based on beginning inventory, planned production according to the master production schedule (MPS) and customer commitments. For the first period, the available-to-promise is the sum of the beginning inventory plus the planned production for the first period minus customer commitments for the first period and all periods following the first period up to, but not including, the next period for which production has been scheduled in the MPS. For the following periods, there are two possibilities:
If a master production quantity has been scheduled for the period the available-to-promise is the quantity scheduled minus all customer commitments for the period and for all following periods up to but not including, the next period for which a master production quantity has been scheduled.
If no master production quantity has been scheduled for the period the available-to-promise is zero, even if deliveries in the period have been promised. The promised shipments often are shown as backlog (customer commitments) in the period with the most recent production (MPS).
Cumulative available-to-promise is a calculation based on the available-to-promise (ATP) figure in the master schedule. Two methods of computing the cumulative available-to-promise are used, with and without look-ahead calculation. The cumulative with look-ahead ATP equals the ATP from the previous period plus the MPS of the period minus the sum of the differences between the backlogs and MPSs of all future periods until, but not to include, the period where point production exceeds the backlogs. The cumulative without look-ahead procedure equals the ATP in the previous period plus the MPS, minus the backlog in the period being considered.

© Copyright 2006 Supply-Chain Council, Inc. 513 June 2006
Impact on Supply Chain Performance Attributes/Metrics
Attribute Experienced Impact
Reliability improves on-time delivery resulting in a higher service level (to commit date).
Responsiveness reduces cycle times of certain administrative processes (e.g. definition of delivery date, order placement)
Flexibility allows to determine whether flexibility is appropriate to cover future demand fluctuations and to prioritize activities accordingly.
Costs None (except for less contract penalties caused by late deliveries)
Asset Management Visibility of demand vs. production schedule and available inventory can result in better inventory planning and lower inventory levels.
Key Best Practice Success Factors
Technology Features Available-to-promise requires implementation in an ERP-/SCM-/APS-software solution.
Other Success Factors Appropriate data management guarantees exact ATP quantities.
Additional Resources Cox, J. F.; Blackstone J. H. (2004): American Production and Inventory Control Society (APICS) Dictionary, 11th edition, APICS – The Educational Society for Resource Management, Alexandria, VA Schönsleben, P. (2003): Integral Logistics Management – Planning & Control of Comprehensive Supply Chains, St. Lucie Press, Boca Raton, FL, p. 233-235
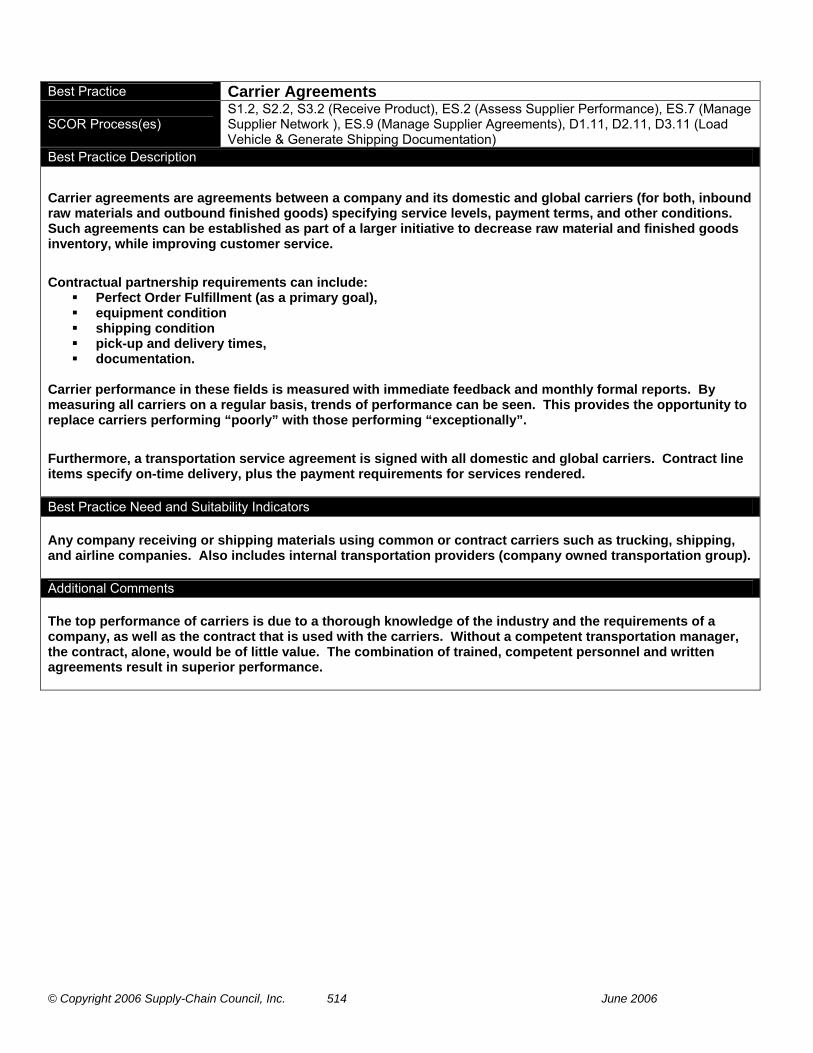
© Copyright 2006 Supply-Chain Council, Inc. 514 June 2006
Best Practice Carrier Agreements
SCOR Process(es) S1.2, S2.2, S3.2 (Receive Product), ES.2 (Assess Supplier Performance), ES.7 (Manage Supplier Network ), ES.9 (Manage Supplier Agreements), D1.11, D2.11, D3.11 (Load Vehicle & Generate Shipping Documentation)
Best Practice Description
Carrier agreements are agreements between a company and its domestic and global carriers (for both, inbound raw materials and outbound finished goods) specifying service levels, payment terms, and other conditions. Such agreements can be established as part of a larger initiative to decrease raw material and finished goods inventory, while improving customer service.
Contractual partnership requirements can include:
Perfect Order Fulfillment (as a primary goal), equipment condition shipping condition pick-up and delivery times, documentation.
Carrier performance in these fields is measured with immediate feedback and monthly formal reports. By measuring all carriers on a regular basis, trends of performance can be seen. This provides the opportunity to replace carriers performing “poorly” with those performing “exceptionally”.
Furthermore, a transportation service agreement is signed with all domestic and global carriers. Contract line items specify on-time delivery, plus the payment requirements for services rendered. Best Practice Need and Suitability Indicators Any company receiving or shipping materials using common or contract carriers such as trucking, shipping, and airline companies. Also includes internal transportation providers (company owned transportation group). Additional Comments The top performance of carriers is due to a thorough knowledge of the industry and the requirements of a company, as well as the contract that is used with the carriers. Without a competent transportation manager, the contract, alone, would be of little value. The combination of trained, competent personnel and written agreements result in superior performance.

© Copyright 2006 Supply-Chain Council, Inc. 515 June 2006
Impact on Supply Chain Performance Attributes/Metrics
Attribute Experienced Impact
Reliability Better partnerships with and management of carriers typically results in improved on time deliveries.
Responsiveness Carrier agreements often improve the ability to quickly book and execute transportation, reducing lead times.
Flexibility Partnerships tend to work both ways, leading carriers to make additional capacity available to partners when needed, improving the ability to respond quickly to demand increases.
Costs Carrier agreements provide a tool for both shipper and carrier to identify and take advantage of mutual cost savings.
Asset Management More efficient use of transportation assets to move customer orders.
Key Best Practice Success Factors
Technology Features
From the carrier side, their tracking systems support performance measurement to a different degree (EDI, web-enabled carriers). Continuous on line tracking of shipment would be beneficial.
Other Success Factors
Anyone interfacing with the carrier needs to be familiar with the carrier agreement specifications. Formal recognition of carriers, for example, they can be certified on basis of six months reliability/compliance to the agreement. Formal feedback on monthly performance and immediate feedback on failures to comply with specifications.
Additional Resources None

© Copyright 2006 Supply-Chain Council, Inc. 516 June 2006
Best Practice Collaborative Planning, Forecasting and Replenishment (CPFR) SCOR Process(es) P1 (Plan Supply Chain) Best Practice Description
The CPFR reference model provides a general framework for the collaborative aspects of planning, forecasting and replenishment processes. The model is considered a “guideline” for trading partner collaboration, which should be tailored specially for the industry and company readiness and maturity.
CPFR defines eight collaboration tasks:
Collaboration Arrangement is the process of setting the business goals for the relationship, defining the scope of collaboration and assigning roles, responsibilities, checkpoints and escalation procedures.
The Joint Business Plan then identifies the significant events that affect supply and demand in the planning period, such as promotions, inventory policy changes, store openings/closings, and product introductions.
Sales Forecasting projects consumer demand at the point of sale. Order Planning/Forecasting determines future product ordering and delivery requirements based upon
the sales forecast, inventory positions, transit lead times, and other factors. Order Generation transitions forecasts to firm demand. Order Fulfillment is the process of producing, shipping, delivering, and stocking
products for consumer purchase. Exception Management is the active monitoring of planning and operations for out-of-bounds
conditions. Performance Assessment calculates key metrics to evaluate the achievement of business goals,
uncover trends or develop alternative strategies.
Based on this general framework, CPFR discusses collaboration scenarios (like replenishment collaboration or collaborative assortment planning), collaboration roles (who of the two partners involved is responsible for collaboration tasks), and organizational implications within partner companies.
The CPFR industry standard is sponsored by VICS, the Voluntary Inter-industry Standards body and the Uniform Code Council, UCC. The standard has also been adopted by the Global Commerce Initiative, GCI.
Best Practice Need and Suitability Indicators Companies that heavily rely on demand forecast accuracy and high volume replenishment are primary beneficiaries of the standard. Additional Comments CPFR has primarily been adopted by the retail and consumer package goods industry. Wal-Mart was the founding company of the process and recently announced adoption by 1,200 of its suppliers. The process has also been adopted by the grocery industry as well as the chain drug store industry.
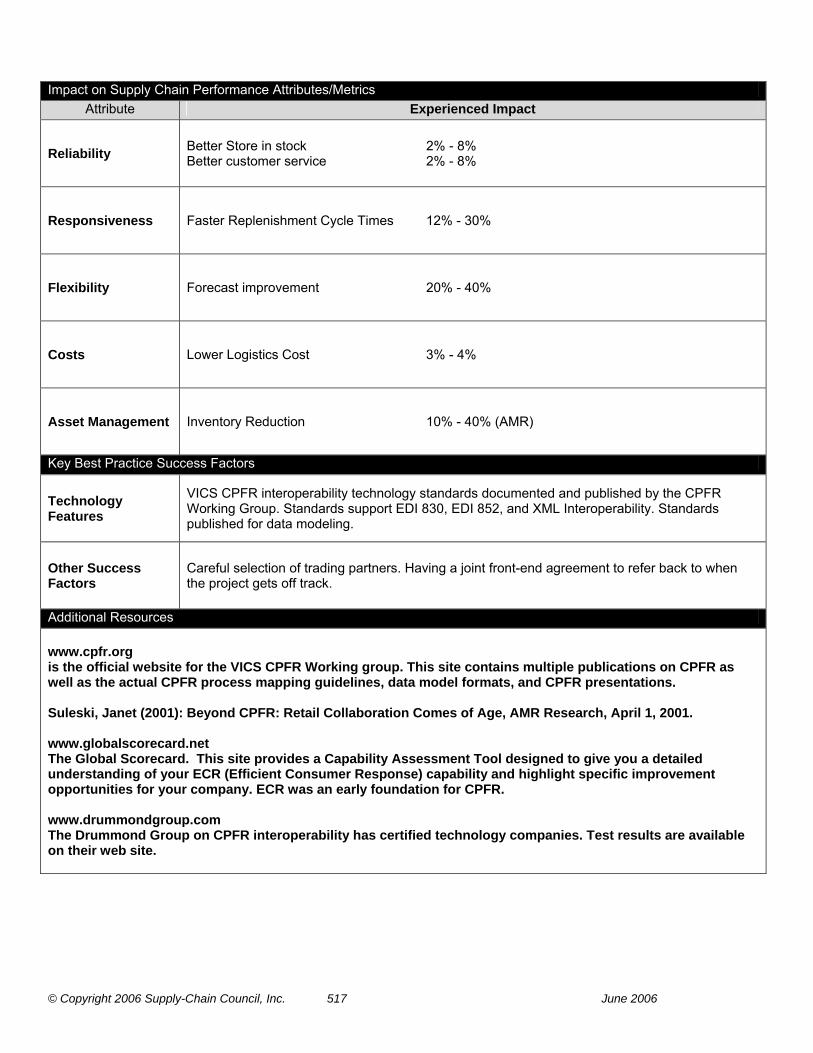
© Copyright 2006 Supply-Chain Council, Inc. 517 June 2006
Impact on Supply Chain Performance Attributes/Metrics
Attribute Experienced Impact
Reliability Better Store in stock 2% - 8% Better customer service 2% - 8%
Responsiveness Faster Replenishment Cycle Times 12% - 30%
Flexibility Forecast improvement 20% - 40%
Costs Lower Logistics Cost 3% - 4%
Asset Management Inventory Reduction 10% - 40% (AMR)
Key Best Practice Success Factors
Technology Features
VICS CPFR interoperability technology standards documented and published by the CPFR Working Group. Standards support EDI 830, EDI 852, and XML Interoperability. Standards published for data modeling.
Other Success Factors
Careful selection of trading partners. Having a joint front-end agreement to refer back to when the project gets off track.
Additional Resources www.cpfr.org is the official website for the VICS CPFR Working group. This site contains multiple publications on CPFR as well as the actual CPFR process mapping guidelines, data model formats, and CPFR presentations. Suleski, Janet (2001): Beyond CPFR: Retail Collaboration Comes of Age, AMR Research, April 1, 2001. www.globalscorecard.net The Global Scorecard. This site provides a Capability Assessment Tool designed to give you a detailed understanding of your ECR (Efficient Consumer Response) capability and highlight specific improvement opportunities for your company. ECR was an early foundation for CPFR. www.drummondgroup.com The Drummond Group on CPFR interoperability has certified technology companies. Test results are available on their web site.
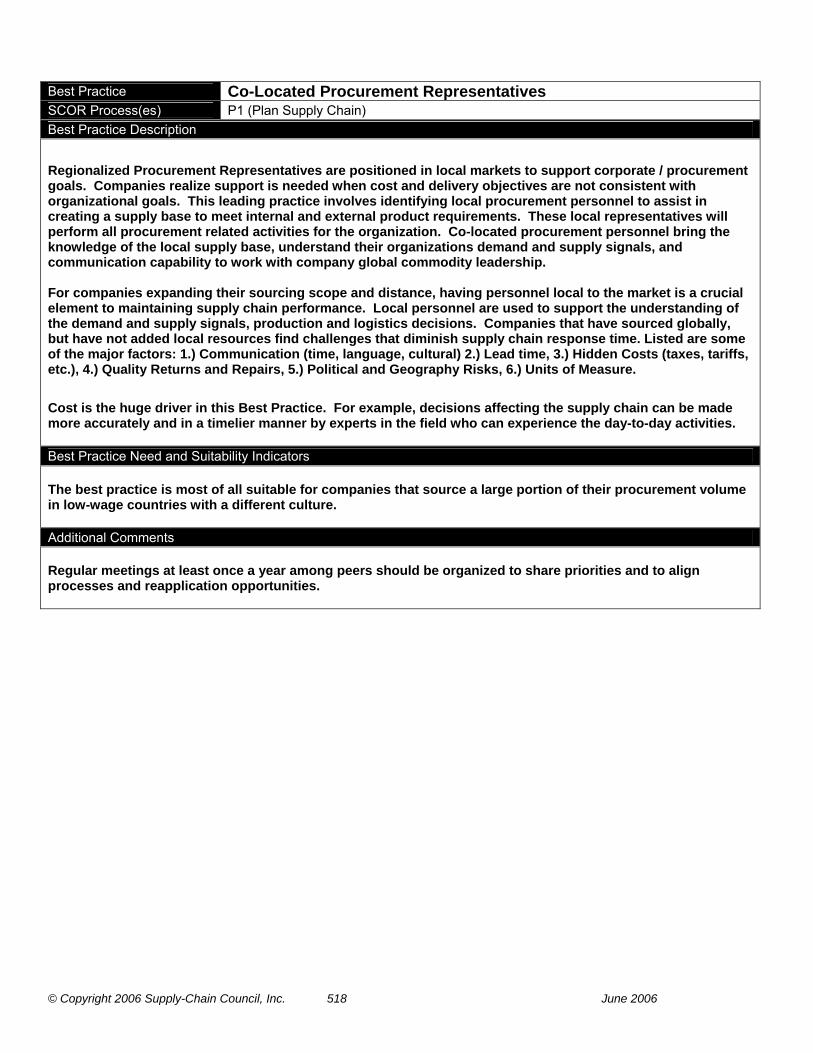
© Copyright 2006 Supply-Chain Council, Inc. 518 June 2006
Best Practice Co-Located Procurement Representatives SCOR Process(es) P1 (Plan Supply Chain) Best Practice Description
Regionalized Procurement Representatives are positioned in local markets to support corporate / procurement goals. Companies realize support is needed when cost and delivery objectives are not consistent with organizational goals. This leading practice involves identifying local procurement personnel to assist in creating a supply base to meet internal and external product requirements. These local representatives will perform all procurement related activities for the organization. Co-located procurement personnel bring the knowledge of the local supply base, understand their organizations demand and supply signals, and communication capability to work with company global commodity leadership. For companies expanding their sourcing scope and distance, having personnel local to the market is a crucial element to maintaining supply chain performance. Local personnel are used to support the understanding of the demand and supply signals, production and logistics decisions. Companies that have sourced globally, but have not added local resources find challenges that diminish supply chain response time. Listed are some of the major factors: 1.) Communication (time, language, cultural) 2.) Lead time, 3.) Hidden Costs (taxes, tariffs, etc.), 4.) Quality Returns and Repairs, 5.) Political and Geography Risks, 6.) Units of Measure.
Cost is the huge driver in this Best Practice. For example, decisions affecting the supply chain can be made more accurately and in a timelier manner by experts in the field who can experience the day-to-day activities. Best Practice Need and Suitability Indicators The best practice is most of all suitable for companies that source a large portion of their procurement volume in low-wage countries with a different culture. Additional Comments Regular meetings at least once a year among peers should be organized to share priorities and to align processes and reapplication opportunities.

© Copyright 2006 Supply-Chain Council, Inc. 519 June 2006
Impact on Supply Chain Performance Attributes/Metrics
Attribute Experienced Impact
Reliability Increase Order Fill Rates
Responsiveness Reduction in Product Lead-Time Improved Supply Chain Response Time Improved Source/Make Cycle Time
Flexibility Improved Production Plan Achievement Reduced Inventory Obsolescence
Costs Impacts Purchase Order Costs Reduced Quality Returns
Asset Management Increase Capacity Utilization Decrease Inventory Obsolescence
Key Best Practice Success Factors
Technology Features Accessibility, accuracy, timeliness and visibility of enterprise-wide procurement information. Commercial software (of varying degrees of sophistication) is available to support the procurement and planning processes.
Other Success Factors None
Additional Resources None

© Copyright 2006 Supply-Chain Council, Inc. 520 June 2006
Best Practice Convergence of SCOR, Six Sigma and Lean Methodology SCOR Process(es) affects any SCOR process Best Practice Description
SCOR, a cross-industry top-down standardized process analysis model, enables the efficient and effective end-to-end evaluation of supply chains. By capturing operational baselines and comparing to industry peers and competitors, SCOR level one metrics provide a balanced measure of performance linked to the bottom line. Metrics and Best Practices steer teams to proven solutions, and the building block design provides a common language for both internal and external elements of a supply chain. SCOR therefore serves as a strategic project identification and prioritization engine for Lean and Six Sigma teams and provides the means to measure business impact. The strength of Six Sigma and Lean is producing results. These powerful methodologies can be used to gain efficiency and construct valuable processes because these disciplines, by their nature, look down at finite areas, cells, or processes to improve. They cannot look upward at organizational goals and select the best project on which to work. SCOR also helps introduce the concepts of Six Sigma and Lean to transactional (non manufacturing) areas not normally associated with productivity or quality initiatives. With its cross functional makeup a SCOR project team will focus on reducing variability and eliminate waste in areas such as accounting, customer service, and sales. Best Practice Need and Suitability Indicators Need to prioritize lean and six sigma project according to their effects on organizational goals. Additional Comments This Venn Diagram highlights tools of each methodology:
SIX SIGMA
LEAN SCOR
Control Plans7 Basic Quality Tools:
ParetoCause & Effect
HistogramsControl Charts
Scatter DiagramsGraphs
Check sheetsPDCA/SDCA
SIPOCProject Mgmt
Process Mapping/Value Stream Mapping/Geographic Mapping/
Thread DiagramQFD (Quality Function
Deployment)Standardized Work/
Best Practices
KaizenKanban
Single MinuteExchange of Die (SMED)Takt TimePoke Yoke
PFMEA ANOVAGage R&R SPC Process Simulation
Multi-Vari Analysis Regression AnalysisDOE (Design of Experiments)
COPQ/Financial AnalysisProgram Mgmt
Multi-LevelPareto Analysis/
DecomposingMetrics
GAP Analysis Voice of theCustomer
Reference ModelOrganization Map
SCORcard – Level OneOperational ProcessMetrics – Level Two
Diagnostic Metrics – Level Three
7 Mgmt Tools:Relations Diagram
Affinity DiagramTree Diagram
Matrix DiagramMatrix Data-Analysis
Arrow DiagramPDPC
Supplier/CustomerPerformance Scorecards
Inter-Company KanbanCPFR
TOOLS (Examples
only)
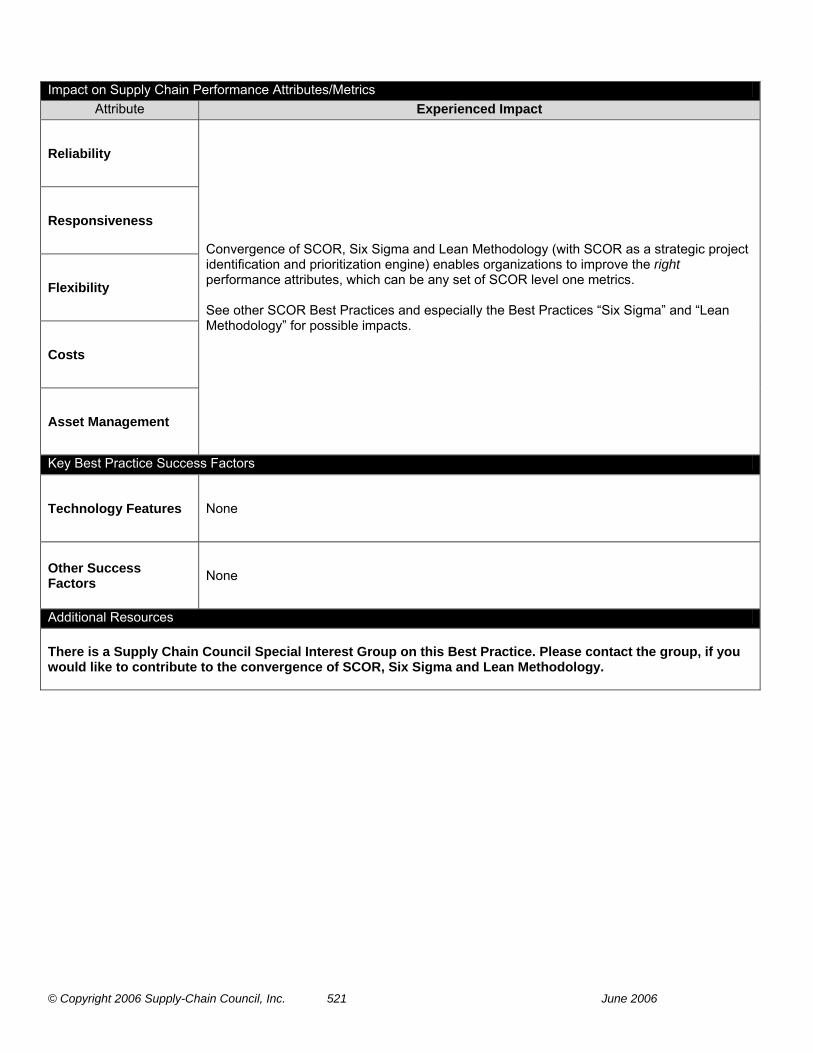
© Copyright 2006 Supply-Chain Council, Inc. 521 June 2006
Impact on Supply Chain Performance Attributes/Metrics
Attribute Experienced Impact
Reliability
Responsiveness
Flexibility
Costs
Asset Management
Convergence of SCOR, Six Sigma and Lean Methodology (with SCOR as a strategic project identification and prioritization engine) enables organizations to improve the right performance attributes, which can be any set of SCOR level one metrics. See other SCOR Best Practices and especially the Best Practices “Six Sigma” and “Lean Methodology” for possible impacts.
Key Best Practice Success Factors
Technology Features None
Other Success Factors None
Additional Resources There is a Supply Chain Council Special Interest Group on this Best Practice. Please contact the group, if you would like to contribute to the convergence of SCOR, Six Sigma and Lean Methodology.
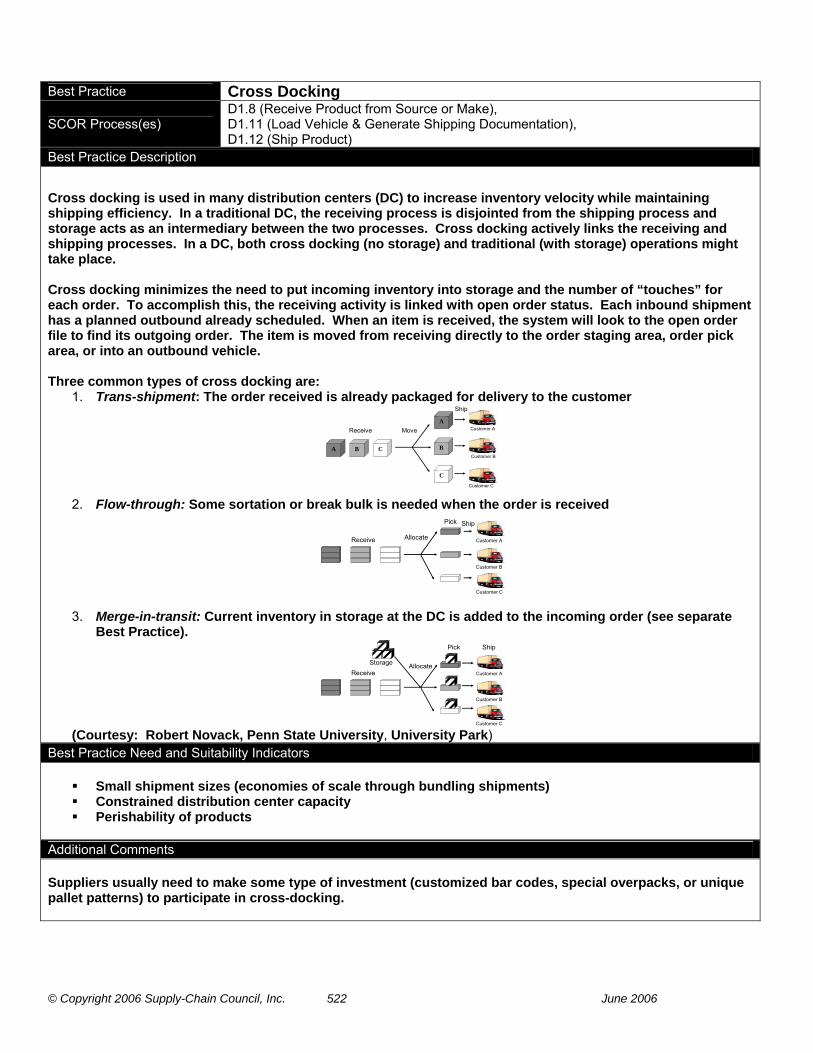
© Copyright 2006 Supply-Chain Council, Inc. 522 June 2006
Best Practice Cross Docking
SCOR Process(es) D1.8 (Receive Product from Source or Make), D1.11 (Load Vehicle & Generate Shipping Documentation), D1.12 (Ship Product)
Best Practice Description
Cross docking is used in many distribution centers (DC) to increase inventory velocity while maintaining shipping efficiency. In a traditional DC, the receiving process is disjointed from the shipping process and storage acts as an intermediary between the two processes. Cross docking actively links the receiving and shipping processes. In a DC, both cross docking (no storage) and traditional (with storage) operations might take place. Cross docking minimizes the need to put incoming inventory into storage and the number of “touches” for each order. To accomplish this, the receiving activity is linked with open order status. Each inbound shipment has a planned outbound already scheduled. When an item is received, the system will look to the open order file to find its outgoing order. The item is moved from receiving directly to the order staging area, order pick area, or into an outbound vehicle. Three common types of cross docking are:
1. Trans-shipment: The order received is already packaged for delivery to the customer
A CB
A
B
C
Receive Move
Ship
Customer A
Customer B
Customer C
2. Flow-through: Some sortation or break bulk is needed when the order is received
Receive Allocate
Pick Ship
Customer B
Customer A
Customer C
3. Merge-in-transit: Current inventory in storage at the DC is added to the incoming order (see separate Best Practice).
ReceiveAllocate
Pick Ship
Customer B
Customer A
Customer C
Storage
(Courtesy: Robert Novack, Penn State University, University Park)
Best Practice Need and Suitability Indicators
Small shipment sizes (economies of scale through bundling shipments) Constrained distribution center capacity Perishability of products
Additional Comments Suppliers usually need to make some type of investment (customized bar codes, special overpacks, or unique pallet patterns) to participate in cross-docking.

© Copyright 2006 Supply-Chain Council, Inc. 523 June 2006
Impact on Supply Chain Performance Attributes/Metrics
Attribute Experienced Impact
Reliability None
Responsiveness None
Flexibility None
Costs Reduces transportation costs (compared to transportation without cross-dock), because de-consolidation at cross-dock for multiple receivers allows shippers to deliver larger shipments
Asset Management Reduces average inventory level and (as a consequence) working capital invested in inventory
Key Best Practice Success Factors
Technology Features
Cross docking requires the use of a Warehouse Management System (WMS), which needs to interface with the order management system. Bar codes and RF scanners will allow the receiving function at the DC to become more productive. The use of EDI messages, especially of ASN´s (Advance Ship Notices) is highly beneficial. The shipper sends an ASN to the receiver as a notice that a shipment has been sent, allowing the receiving facility to more productively schedule order picking and outbound deliveries.
Other Success Factors None
Additional Resources None

© Copyright 2006 Supply-Chain Council, Inc. 524 June 2006
Best Practice Drum-Buffer-Rope Scheduling Technique SCOR Process(es) M1.1 (Schedule Production Activities) , M2.1 (Schedule Production Activities), M3.2
(Schedule Production Activities) Best Practice Description
Drum-Buffer-Rope (DBR, also referred to as Synchronous Manufacturing, or Constraint Management) is, in the Theory of Constraints (TOC), a technique used to manage resources to maximize throughput.
The Drum is the system’s constraint (or bottleneck) that sets the pace for the entire organization. Such a bottleneck determines the final output of the system regardless of the excess capacity that might be available on the other resources. (In DBR terminology, the drum is also the schedule of the constraint.)
The Drum Buffer is a time offset (raw material will be released earlier than expected by the conventional lead time) that helps exploit the drum’s capacity. Placing the buffer in front of the drum we reduce/absorb the impact of uncertainty along the production chain from the gating operations all the way to the constraint. The drum buffer can be seen as a powerful tool in helping us prevent the drum from starving.
The Rope is the material release schedule tied to the drum. With the rope we make sure that no material is released to the shop floor without the “prior approval” of the drum. The shop floor has a virtual rope tying the drum to the gating operations, each time the drum finishes a lot it will pull this rope to ask for more material to be released. This powerful concept (global management vs. localized approach) has an immediate impact on both lead time and WIP. Release only what is needed when it is needed! Best Practice Need and Suitability Indicators
High Work-in-progress (WIP) with deteriorating throughput Unpredictable manufacturing lead times (e.g. due to many prioritized production orders) Mature serial or mass production running at a fixed rate The technique is mainly suitable for machine-limited capacities.

© Copyright 2006 Supply-Chain Council, Inc. 525 June 2006
Additional Comments In the application of Drum-Buffer-Rope (DBR), the effectiveness of the pace setting operation (drum) is critical for maximizing throughput. The Overall Equipment Effectiveness (OEE) is the single metric that reflects that effectiveness. OEE is the result of multiplying
Availability (up-time) Run time divided by scheduled time (also 1 minus downtime)
Quality Rate (first pass yield) First-pass good units produced divided by total units produced
Performance Efficiency Theoretical cycle time by the actual cycle time. Theoretical cycle time should be that, which was promised by the production equipment’s manufacturer. (In practice theoretical cycle time often is “downgraded” by industrial engineers applying factors such as personal fatigue and delay to derive a “standard cycle time”, which is used to cost the product and provide planning an attainable capacity quantity.)
The difference between the OEE value and 1.0 indicates the percentage of production lost to ineffective operations. Examining the components of OEE will enable root cause analysis and direct corrective action.
Impact on Supply Chain Performance Attributes/Metrics
Attribute Experienced Impact
Reliability Increases perfect order fulfillment, as manufacturing lead time gets more predictable
Responsiveness Increases with decreasing manufacturing lead time
Flexibility None
Costs Higher equipment effectiveness reduces cost of goods sold
Asset Management Reduces WIP, leads to a higher equipment effectiveness
Key Best Practice Success Factors
Technology Features None
Other Success Factors None
© Copyright 2006 Supply-Chain Council, Inc. 526 June 2006
Additional Resources Cox, J. F.; Blackstone J. H. (2004): American Production and Inventory Control Society (APICS) Dictionary, 11th edition, APICS – The Educational Society for Resource Management, Alexandria, VA, USA Goldratt, E. M., Cox, J. (1992): The Goal – A Process of Ongoing Improvement”, North River Press, Norwich, CT, USA Spencer, M. S.; Cox, J. F. (1997): The Constraints Management Handbook, The St. Lucie Press/APICS Series on Constraints Management. Umble, M.; Mokshagundam L. S. (1995): Synchronous Manufacturing – Principles for World Class Excellence, Spectrum Publishing Company. Hansen, R. C. (2002): Overall Equipment Effectiveness, Industrial Press, New York, NY, USA. Mondher, B.-H.: Synchronous Manufacturing Quick Reference Guide, Supply Chain Strategy and Solutions, BearingPoint, Inc.

© Copyright 2006 Supply-Chain Council, Inc. 527 June 2006
Best Practice Lean Methodology SCOR Process(es) affects any SCOR process Best Practice Description
"Lean" is a term coined in 1990 in the book "The Machine that Changed the World" by MIT researchers to describe the effectiveness and efficiency of the Toyota Production System in comparison to the traditional mass production approach to manufacturing. "Lean" practices actually date back to the early 1900's when Sakichi Toyoda introduced jidoka (autonomation) into his loom operations. The modern understanding of "lean" comes from the Toyota Production System developed by Taiichi Ohno, which was inspired by Henry Ford's River Rouge moving assembly line. "Lean" thinking is a focus on creating process "flow" through the reduction of waste. The waste reduction in production environments is typically targeted at the seven wastes: overproduction, waiting, transportation, inappropriate processes, inventory levels, unnecessary motion, and defects. Lean Thinking is applicable to all processes.
The typical enabler for lean improvement is through the use of Value Stream Mapping (VSM). VSM is the process of walking and drawing the process steps (material and information) for one product family from beginning to end, typically within a single facility, to create a current state map. Current state maps are designed to highlight the process flow of an item through the value stream. Following the current state map, a future state map is created. Future state maps are then developed to identify process improvements that eliminate waste. Finally, a detailed implementation plan is developed to transition from the current state to the future state, typically within an 8-12 month period. VSM can also be applied similarly across suppliers to create supply chain value stream maps.
While lean excels at improving process efficiency, there are some limitations to lean application. Lean implementations are typically limited by the inability to systematically identify and prioritize lean projects, measure the effects of changes on the supply chain system’s bottom line, and align and communicate activities across organizations. See the Best Practice on “Convergence of SCOR, Six Sigma and Lean Methodology” to overcome this limitation.
Best Practice Need and Suitability Indicators
Need for process cycle efficiency improvements Need to reduce process cycle times Elimination of non-value added process steps Need to build a culture of lean thinking throughout
Additional Comments Lean is a methodology and way of thinking to transform organizations into new levels of efficiency, supported by a toolset for executing improvement projects that reduce process cycle time and increase process cycle efficiencies. Execution is enabled through people, and must become the way work is done within the organization. Application of lean tools is based on the effective use of value stream mapping. This methodology relies heavily on the ability to record all steps throughout processes and to determine value added versus non-value added activities. Lean is a methodology supported by a toolset that is generally limited by the inability to strategically select projects that provide the greatest value to the overall organization.

© Copyright 2006 Supply-Chain Council, Inc. 528 June 2006
Impact on Supply Chain Performance Attributes/Metrics
Attribute Experienced Impact
Reliability enables organizations to determine how current process steps and cycle efficiencies affect overall supply chain reliability. Details can be displayed through value stream mapping.
Responsiveness Process cycle-time decreases (typically by around 70%) through eliminating non-value added process steps. Lean organizations have the worker flexibility and adaptability to respond to surges and shocks in production.
Flexibility Lean creates process flow and allows for quick changeover between functions, tools, and processes. Lean facilities typically have considerable cross training, which creates highly flexible teams of people and organizational layouts.
Costs Cost reduction is a typical impact of lean as non-value added processes are removed and efficiency increases. Response times are also reduced which result in faster cash flow cycles.
Asset Management Lean typically reduces inventory levels and ensures the efficient use of assets with regard to customer demand. Suppliers are likewise encouraged to improve cycle efficiencies to increase their available inventory for customers to pull from.
Key Best Practice Success Factors
Technology Features Lean is people-oriented and can be successfully employed with minimal technological requirements. Some technology (e.g. a data warehouse with data extracted from an ERP source system) could potentially support an organization’s application of lean.
Other Success Factors
The successful transformation to lean is marked by the change in the way people address their work. Lean thinking must become a part of how work is done within an organization to be have sustainable continuous improvement.
Additional Resources Womack, J. P., Jones, D. T. (1996): Lean Thinking – Banish Waste and Create Wealth in Your Corporation, Simon & Schuster, New York, NY Suzaki, K. (1987): The New Manufacturing Challenge – Techniques for Continuous Improvement, Simon & Schuster, New York, NY Keyte, B., Locher, D. (2004): The Complete Lean Enterprise – Value Stream Mapping for Administrative and Office Processes, Productivity Press, New York, NY Liker, J. (2004): The Toyota Way – 14 Management Principles From The World's Greatest Manufacturer, McGraw-Hill, New York, NY Marchwinski, C., Shook, J., (2004): Lean Lexicon – A Graphical Glossary for Lean Thinkers, Lean Enterprise Institute, Brookline, MA http://www.lean.org (Lean Enterprise Institute), http://www.lean.mit.edu (Lean Aerospace Initiative), http://www.superfactory.com (Superfactory)
© Copyright 2006 Supply-Chain Council, Inc. 529 June 2006
Best Practice Merge-in-Transit SCOR Process(es) D1.8 (Receive Product from Source or Make), D1.9 (Pick Product) Best Practice Description
Merge-in-transit is a practice to combine items from multiple sources into a single customer shipment. This includes items on stock in the distribution center, from which the shipment is sent, items on stock in other distribution centers, items on stock elsewhere (e.g. at a plant or a supplier) as well as make-to-order items. The items to be merged are cross-docked from inbound receipt to outbound shipping (see Best Practice on Cross-Docking, type three). Merging is usually performed in a shipper’s distribution center (DC) or in a carrier’s terminal.
Merge-in-transit allows the shipper to reduce its inventory levels on selected items in its DC’s while still maintaining complete order integrity and reliable delivery. The practice increases overall delivery times, though. To keep delivery reliability to customers, supply chain information systems are required, which integrate among the shipper, its suppliers, and its carriers.
For make-to-order (MTO) products, the order lead time should be greater than the manufacturing lead time. Otherwise, the products should be manufactured and stocked prior to the shipment. The point is emphasized here to ensure that the proper business policy is adopted around defining MTO versus MTS (make-to-stock) products.
Best Practice Need and Suitability Indicators
Customer orders require commingling of products from different sources into a single shipment Order lead time is sufficient to allow collect products from their source locations
Additional Comments Merge-in-transit is a “Place Postponement” (see Best Practice on Postponement) for parts of the supply chain.
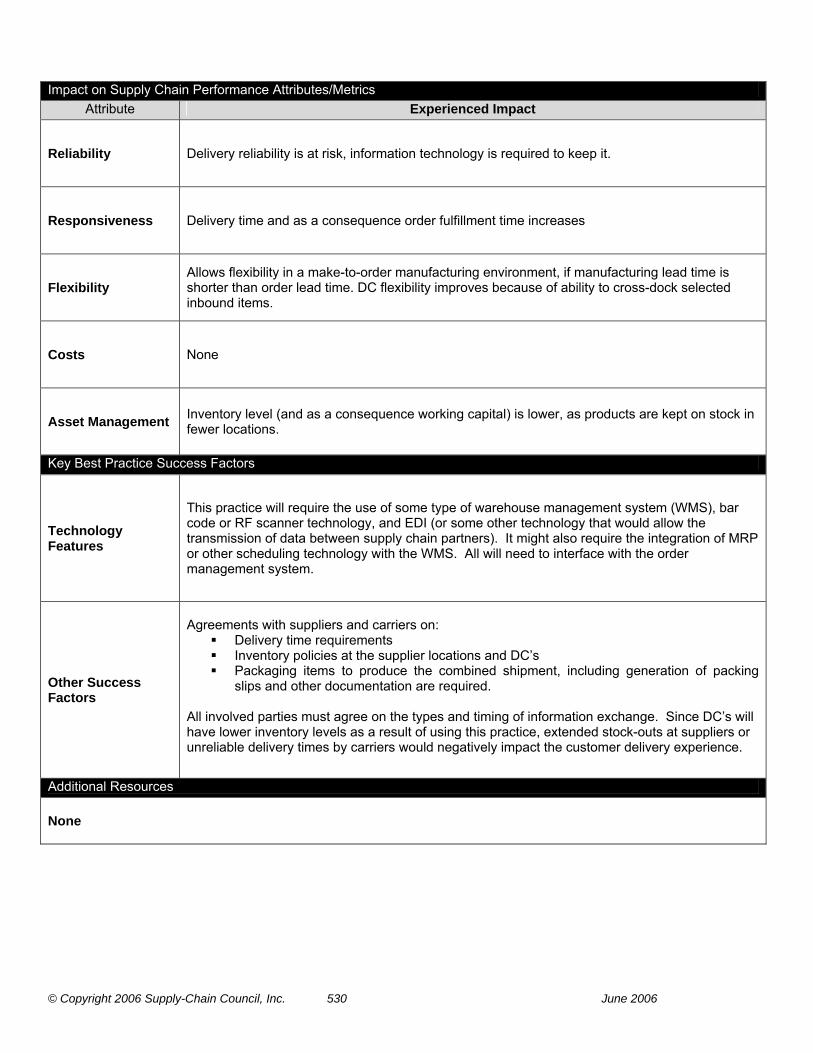
© Copyright 2006 Supply-Chain Council, Inc. 530 June 2006
Impact on Supply Chain Performance Attributes/Metrics
Attribute Experienced Impact
Reliability Delivery reliability is at risk, information technology is required to keep it.
Responsiveness Delivery time and as a consequence order fulfillment time increases
Flexibility Allows flexibility in a make-to-order manufacturing environment, if manufacturing lead time is shorter than order lead time. DC flexibility improves because of ability to cross-dock selected inbound items.
Costs None
Asset Management Inventory level (and as a consequence working capital) is lower, as products are kept on stock in fewer locations.
Key Best Practice Success Factors
Technology Features
This practice will require the use of some type of warehouse management system (WMS), bar code or RF scanner technology, and EDI (or some other technology that would allow the transmission of data between supply chain partners). It might also require the integration of MRP or other scheduling technology with the WMS. All will need to interface with the order management system.
Other Success Factors
Agreements with suppliers and carriers on:
Delivery time requirements Inventory policies at the supplier locations and DC’s Packaging items to produce the combined shipment, including generation of packing
slips and other documentation are required. All involved parties must agree on the types and timing of information exchange. Since DC’s will have lower inventory levels as a result of using this practice, extended stock-outs at suppliers or unreliable delivery times by carriers would negatively impact the customer delivery experience.
Additional Resources None

© Copyright 2006 Supply-Chain Council, Inc. 531 June 2006
Best Practice Postponement SCOR Process(es) S1 (Source Stocked Product) , M1 (Make to Stock),
D1 (Deliver Stocked Product) Best Practice Description
Postponement (delayed differentiation) is a supply chain concept where a product is kept as long as possible in a generic state. Differentiation of the generic product into a specific end-product is shifted closer to the consumer by postponing identity changes, such as assembly or packaging, to the last possible supply chain location.
This allows keeping safety stock of one generic product instead of multiple specific end-products. Especially
in cases where the split of demand into specific end-products is uncertain, postponement with its risk pooling
effect leads to less safety stock required and to a lower risk of obsolescence of end-products. Furthermore, as
less value has been added to the generic product than to the specific end-product, less capital is bound in
each stocked unit.
There are three ways to implement postponement:
Product postponement A modular structure of the product allows late differentiation, e.g. adding country-specific power plugs shortly before shipment.
Place postponement Safety stock is kept in one central warehouse instead of regional warehouses.
Time postponement Processes which let the product become differentiated (e.g. coloring, flashing an EPROM with software) take place as late as possible.
Best Practice Need and Suitability Indicators
Significant number of variants of an end product with an uncertain split of demand on variants. Delivery time requested by customers must allow value-adding steps after receipt of
customer orders (or reliable demand forecast).
Additional Comments Product postponement leads to economies of scale in procurement and production as well, since the generic product will be produced in larger amounts than its variants.

© Copyright 2006 Supply-Chain Council, Inc. 532 June 2006
Impact on Supply Chain Performance Attributes/Metrics
Attribute Experienced Impact
Reliability With the same safety stock, fill rate will typically increase.
Responsiveness Order fulfillment cycle time increases, if value-adding steps are carried out after receipt of a customer order (see need indicators)
Flexibility Increases, because a wide range of specific end-products can be derived from the stocked generic product.
Costs None (except from economies of scale, see additional comment)
Asset Management A lower safety stock level (without effect on fill rate) reduces fixed assets.
Key Best Practice Success Factors
Technology Features None
Other Success Factors
For product postponement, an intelligent, modular product structure is a pre-requisite, so that logistics and/or supply chain management have to be involved in the product development process. To support the development process, logistics/supply chain management has to provide a clear estimation of the effects of product design (especially the number of variants) on production and logistics costs.
Additional Resources Cox, J. F.; Blackstone J. H. (2004): American Production and Inventory Control Society (APICS) Dictionary, 11th edition, APICS – The Educational Society for Resource Management, Alexandria, VA, USA Simchi-Levi, D.; Kaminsky, P.; Simchi-Levi, E. (1999): Designing and Managing the Supply Chain: Concepts, Strategies, and Cases, McGraw-Hill/Irwin, p. 56

© Copyright 2006 Supply-Chain Council, Inc. 533 June 2006
Best Practice Sales and Operations Planning (S&OP) SCOR Process(es) P1 (Plan Supply Chain) Best Practice Description
Sales and operations planning (S&OP) is a process to develop tactical plans that provide management the ability to strategically direct its businesses by integrating customer-focused marketing plans for new and existing products with the management of the supply chain.
The process brings together all the plans for the business (sales, distribution, inventory, production, procurement) into one integrated set of plans. This set of plans typically covers – at an aggregate (product family) level – a period of 8 to 18 months with monthly periods and further years with half-year periods. S&OP is revised on a regular basis, most commonly monthly, but at least twice a year. The process must reconcile all supply, demand, and new-product plans at both the detail and aggregate levels and tie to the business plan. It is the definitive statement of the company’s plans for the near to intermediate term, covering a horizon sufficient to plan for resources and to support the annual business planning process. Typically, Sales and Operations Planning includes four key monthly meetings:
1. Demand review (to align the sales forecasts for the next months) 2. Rough cut capacity planning review (to determine the available facilities and assess the feasibility of the
production plans) 3. Pre-top Management review (to agree upon points to be escalated to top management) 4. Top Management review (to get plans authorized, issues fixed and financial plans committed).
Best Practice Need and Suitability Indicators
Variability or misbalance in demand and/or supply, need to balance supply and demand across the supply chain.
Conflicting measures and behavior in various departments Inventory unbalanced across the supply chain Asset Utilization below industry norms Especially important if operations are to a large extend planned to forecasts
Additional Comments None.

© Copyright 2006 Supply-Chain Council, Inc. 534 June 2006
Impact on Supply Chain Performance Attributes/Metrics
Attribute Experienced Impact
Reliability Effective S&OP plans will allocate resources such that inventory is in place at the correct locations at the correct time so that when customer orders come in they can be fulfilled within normal procedures/processes
Responsiveness S&OP points out where the supply chain has lead-time issues. It raises the visibility of lead-time problems.
Flexibility The S&OP process makes potential issues visible early, so that changes can be made to accommodate the dynamics of the supply chain.
Costs In particular, S&OP helps reduce the number and impact of expedites and “rush production orders” – both of which have a negative impact on supply chain costs.
Asset Management S&OP allows an enterprise to operate much closer to target production and inventory plans, and thus leads to lower inventory levels and more efficient use of assets.
Key Best Practice Success Factors
Technology Features
S&OP is essentially a PEOPLE process that can be achieved with minimal technology support. In some cases, Excel spreadsheets are adequate. Accessibility, accuracy and timeliness of aggregate enterprise-wide data are critical, though. Ideally strategic external data (e.g. customer forecasts, co-packer capacity/costs) would be an important asset to the S&OP process.
Other Success Factors
Managers should have visibility to the plans of all departments. They should also understand the impact of their deviations from plan on the other departments and the enterprise as a whole. Performance to plan should be measured. Top Management sponsorship and involvement is essential for the success of S&OP.
Additional Resources Civerolo, J.; Rice, D.: Sales and Operations Planning Handbook, Gray Research.

© Copyright 2006 Supply-Chain Council, Inc. 535 June 2006
Best Practice Six Sigma SCOR Process(es) affects any SCOR process Best Practice Description
Six Sigma is based on a philosophy of driving for near perfect process performance (3.4 defects per million opportunities for a defect) in order to satisfy customer needs and improve financial performance. Individuals can be trained in the various roles of Six Sigma, including Deployment Champions, Black, Green, and Yellow Belts. These practitioners then lead project teams made up of people from the operation through the use of the methodology to define and solve problems.
Six Sigma improvements are enabled through a rigorous methodology referred to as DMAIC (named for the phases of Define, Measure, Analyze, Improve, and Control). The DMAIC methodology for problem solving utilizes both process and statistical analyses to improve product/process quality and drive reduction of defects and variation. The methodology generally provides a systematic way to define the problem being addressed from both a process and financial impact perspective, identify potential factors impacting performance, narrow to the critical few root causes of defects or variation, and then establish procedures to implement sustained performance improvements.
A couple of apparent limitations with Six Sigma are the lack of alignment of priorities, understanding the interdependency between projects, i.e., incremental process improvements versus process redesign, and the lack of methods to develop future projects once the "initial hit lists" (pet-pains) become exhausted. See the Best Practice on “Convergence of SCOR, Six Sigma and Lean” to overcome this limitation.
Best Practice Need and Suitability Indicators
Need for significant improvements for Product Quality or defect reduction Need to reduce process variability
Additional Comments Six Sigma provides a standard toolset for executing improvement projects to increase product quality and reduce defects and process variability. Execution is enabled based on the Six Sigma steps of Define, Measure, Analyze, Improve, and Control (DMAIC). Relies heavily on statistical data gathering and root cause analysis. Six Sigma is a toolset and generally lacks an organized method for project identification. Training in this methodology generally requires a costly investment.

© Copyright 2006 Supply-Chain Council, Inc. 536 June 2006
Impact on Supply Chain Performance Attributes/Metrics
Attribute Experienced Impact
Reliability Suppliers and customers focusing on defect and variability reductions will increase product quality product and perfect order fulfillment as a consequence.
Responsiveness Improve order fulfillment cycle time by reducing number of defective products produced, held in inventory or shipped and returned for warranty. Very important for new Product development deliveries.
Flexibility None.
Costs Reduces cost as process variability is minimized or removed. Reduces product return due to defects.
Asset Management None.
Key Best Practice Success Factors
Technology Features
A data warehouse (with data extracted from ERP source system) and electronic exchange of quality data with suppliers is useful.
Other Success Factors
Teams should be set up with strong participation of the people directly working in the examined process. Six Sigma implementation should start with a small, controllable scope. Incremental learning prepares the organization for larger projects.
Additional Resources Tennant, Geoff (2000), “Six Sigma: SPC and TQM in Manufacturing and Services” Pande, Peter S., Neuman, Robert P., Cavanagh, Roland R. (2000), “The Six Sigma Way: How GE, Motorola, and Other Top Companies are Honing Their Performance” Pande, Peter S., Holpp, Lawrence (2001), “What Is Six Sigma?” Snee, Ronald D., Hoerl, Roger (2002), “Leading Six Sigma: A Step-By-Step Guide Based on Experience with GE and Other Six SIGMA Companies” Eckes, George (2003), “Six Sigma for Everyone” http://www.isssp.com/ International Society of Six Sigma Professionals (ISSSP)
© Copyright 2006 Supply-Chain Council, Inc. 537 June 2006
Best Practice Statistical Test Count
SCOR Process(es) ES.4 (Manage Product Inventory), ES.5 (Manage Capital Assets), ED.4 (Manage Finished Product Inventories), ED.5 (Manage Deliver Capital Assets)
Best Practice Description
The Statistical Test Count (STC) process is a method of validating inventory on-hand values by physically counting and reconciling a statistical sample of the entire inventory population. This sample is then extrapolated, which provides an indicative measure of entire inventory population. Furthermore, with extrapolation the net and gross percentage of error is determined.
One of the primary benefits of this process is a significant reduction in the time and manpower required to perform an audit – control over data gained with STC meets or exceeds all requirements of both internal and external auditors. In contrast to physical inventory and cycle count methods STC creates virtually no disruption to receiving/shipping. Interim reporting allows for monitoring of early results.
STC provides a snapshot of piece count and inventory value accuracy level. Measurable results on both are achieved that can be benchmarked year-to-year, facility-to-facility, and network-to-network. Benchmarking is a proactive driver for inventory accuracy improvement.
Best Practice Need and Suitability Indicators Statistical Test Count is particularly beneficial in high SKU count environments. Additional Comments The Statistical Test Count process is based on validated statistical theorems that meet independent auditor annual inventory validation requirements.

© Copyright 2006 Supply-Chain Council, Inc. 538 June 2006
Impact on Supply Chain Performance Attributes/Metrics
Attribute Experienced Impact
Reliability Through constant measurement and root cause analysis, use of the STC process promotes greater inventory accuracy to support perfect order fulfillment.
Responsiveness Unlike cycle count and physical inventory methods, STC does not impede daily operations and does not require warehouse shut-down.
Flexibility The STC process requires a low volume of counts that can be executed during off-peak times as resource availability allows.
Costs Significant cost avoidance as a result of decreased time and manpower to perform a physical audit – implementing STC typically delivers up to a 90% cost reduction over physical inventory/cycle count methods.
Asset Management The diagnostic capabilities of Statistical Test Count identify opportunities to recover against previous inventory shrinkage (balance sheet implications).
Key Best Practice Success Factors
Technology Features
STC uses part cost and other SKU characteristics to select a statistical sample that is indicative of the entire inventory population. STC also uses confidence intervals and other statistical tools to manage application of the program over time. STC does not require high investments in technology. It can be implemented with common spreadsheet software, for example.
Other Success Factors
The STC process delivers the greatest value in an environment of strong process discipline and commitment to continuous improvement. Results of the STC process should embedded in established process disciplines to address any unexpected deficiencies through adjusted sample size and root cause analysis.
Additional Resources Statistical Test Count is currently not well documented in literature. The following books deal with inventory accuracy in general: Wild, T. (2004): Improving Inventory Record Accuracy: Getting your stock information right. Brooks, R.B.; Wilson, L.W. (1995): Inventory Record Accuracy: Unleashing the Power of Cycle Counting
© Copyright 2006 Supply-Chain Council, Inc. 539 June 2006
Best Practice Supplier Performance Assessment System SCOR Process(es) ES2 (Assess Supplier Performance) Best Practice Description
“Assess Supplier Performance” is the process of measuring actual supplier performance against internal and/or external standards, providing feedback to achieve and maintain the performance required to meet the customers’ business and/or competitive needs.
The supplier management program at a representative company has six elements:
1. Viability of supplier Financial credit rating via D & B, Risk rating associate with overall financial health.
2. Supplier Capability Quality of supplier deliveries in PPM for Engineering programs and Production parts
3. Dependability On time delivery for Engineering programs and Production deliveries, number of stock outs, average days of stock out
4. Responsiveness Part lead time, inventory turns
5. Competitiveness YTD part cost savings, number of parts on pull processes (JIT), electronic data exchange
6. Technical ability Global reach, Engineering ability, Technology roadmaps
Each month, the source data is extracted from an ERP software for each supplier. A report card is created and communicated to suppliers. Performance data is monitored by commodity managers with the expectation that supplier responds to any variance to goals or expected results.
This supplier performance data can be used to select suppliers for a preferred supplier program. Preferred suppliers are given preference for all new business awards and supporting Engineering development programs.
Best Practice Need and Suitability Indicators
Significant expenses for raw material and semi-finished products (compared to own value-add)
Need to reduce number of suppliers Additional Comments Suppliers are an external extension of the manufacturing process. In today’s competitive environment, processes rely on dependable supply streams that react quickly to variability in demand.

© Copyright 2006 Supply-Chain Council, Inc. 540 June 2006
Impact on Supply Chain Performance Attributes/Metrics
Attribute Experienced Impact
Reliability
Source data is from transactions logged in ERP system. No arguments concerning their data vs. our data. Variance to goals is trigger for supplier to present corrective actions. Supplier and customer can focus on performance vs. data integrity. Detail data on delivery and quality are used to identify chronic performance issues for improvement.
Responsiveness Improve reaction time for demand inside of lead-time. Mind share is maintained due to monthly performance scorecard. Very important for New Product development deliveries.
Flexibility Since new business is awarded to suppliers that perform well, suppliers are in a continuous improvement mode.
Costs Not an event, but expected throughout the year.
Asset Management Suppliers are encouraged to improve inventory turns by implementing pull systems for their parts.
Key Best Practice Success Factors
Technology Features
A data warehouse (with data extracted from ERP source system) and electronic exchange of performance data with suppliers is useful.
Other Success Factors
Supplier Management Process, Supplier Survey and Evaluation process, and Supplier Performance Measurement process have to be defined; Source of data, and performance expectations need to be communicated to suppliers and stakeholders in the company (buyers, engineers). For critical suppliers, a qualification process is recommended to align the operational standards with the company’s requirements.
Additional Resources None

© Copyright 2006 Supply-Chain Council, Inc. 541 June 2006
Best Practice Vendor Managed Inventory (VMI) SCOR Process(es) P1, P2, P4, S1.1, S2.1, S3.3, ES.7, D1, D1.5, D1.6, D2.5, D2.6, D3.5, D3.6 Best Practice Description
VMI is a concept for planning and control of inventory, in which the supplier has access to the customer’s inventory data and is responsible for maintaining the inventory level required by the customer. Re-supply is performed by the vendor through regularly scheduled reviews of the on-site inventory. The on-site inventory is counted, damaged or outdated goods are removed, and the inventory is restocked to predefined levels.
The supplier takes responsibility for the operational management of the inventory within a mutually agreed framework of performance targets, which are constantly monitored and updated to create an environment of continuous improvement.
Different styles of VMI agreements exist.
Re-supply need not be on a scheduled basis. It can be more flexible to occur within defined conditions, e.g. any day normal business hours.
The customer can be included in the “approval” process: The supplier could propose a replenishment (quantity, date) and the customer has to approve the order.
Often (but not necessarily) VMI is combined with consignment. The supplier owns items until they are taken from the VMI and used, i.e. items are to be paid when they are used.
Best Practice Need and Suitability Indicators
Similar to conventional MRP planning of inventory, VMI implies manual planning and control tasks, but shifts these tasks to the supplier. This manual effort should be invested in such items, which are valuable and for
which demand is unsteady or sporadic. For less valuable items with a continuous demand order point technique and kanban are more suitable.
Additional Comments VMI works well, where demand and inventory data is readily available, systems are integrated, and economies of scale exist with large customers. Jointly Managed Information (JMI) is a derivation of VMI to use when and where VMI is not operationally or commercially practicable. Jointly-Managed Information is the automated collection, management, and integration of POS and inventory data into supplier inventory/materials management algorithms, independent of physical movements into the retail channel. This achieves many of the same benefits as VMI when there exists a free flow of information among retail channel partners, without introducing what can be sensitive financial relations between the parties. Retail partners often cannot or will not allow a vendor to automatically replenish them.
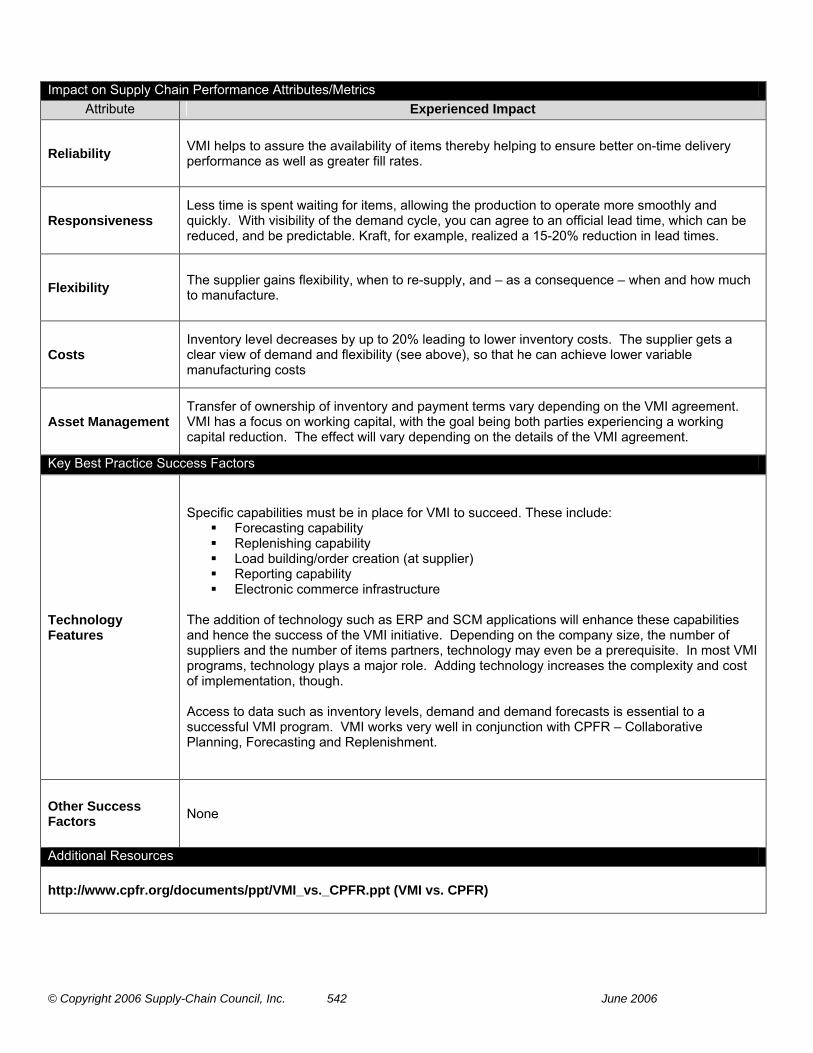
© Copyright 2006 Supply-Chain Council, Inc. 542 June 2006
Impact on Supply Chain Performance Attributes/Metrics
Attribute Experienced Impact
Reliability VMI helps to assure the availability of items thereby helping to ensure better on-time delivery performance as well as greater fill rates.
Responsiveness Less time is spent waiting for items, allowing the production to operate more smoothly and quickly. With visibility of the demand cycle, you can agree to an official lead time, which can be reduced, and be predictable. Kraft, for example, realized a 15-20% reduction in lead times.
Flexibility The supplier gains flexibility, when to re-supply, and – as a consequence – when and how much to manufacture.
Costs Inventory level decreases by up to 20% leading to lower inventory costs. The supplier gets a clear view of demand and flexibility (see above), so that he can achieve lower variable manufacturing costs
Asset Management Transfer of ownership of inventory and payment terms vary depending on the VMI agreement. VMI has a focus on working capital, with the goal being both parties experiencing a working capital reduction. The effect will vary depending on the details of the VMI agreement.
Key Best Practice Success Factors
Technology Features
Specific capabilities must be in place for VMI to succeed. These include:
Forecasting capability Replenishing capability Load building/order creation (at supplier) Reporting capability Electronic commerce infrastructure
The addition of technology such as ERP and SCM applications will enhance these capabilities and hence the success of the VMI initiative. Depending on the company size, the number of suppliers and the number of items partners, technology may even be a prerequisite. In most VMI programs, technology plays a major role. Adding technology increases the complexity and cost of implementation, though. Access to data such as inventory levels, demand and demand forecasts is essential to a successful VMI program. VMI works very well in conjunction with CPFR – Collaborative Planning, Forecasting and Replenishment.
Other Success Factors None
Additional Resources http://www.cpfr.org/documents/ppt/VMI_vs._CPFR.ppt (VMI vs. CPFR)
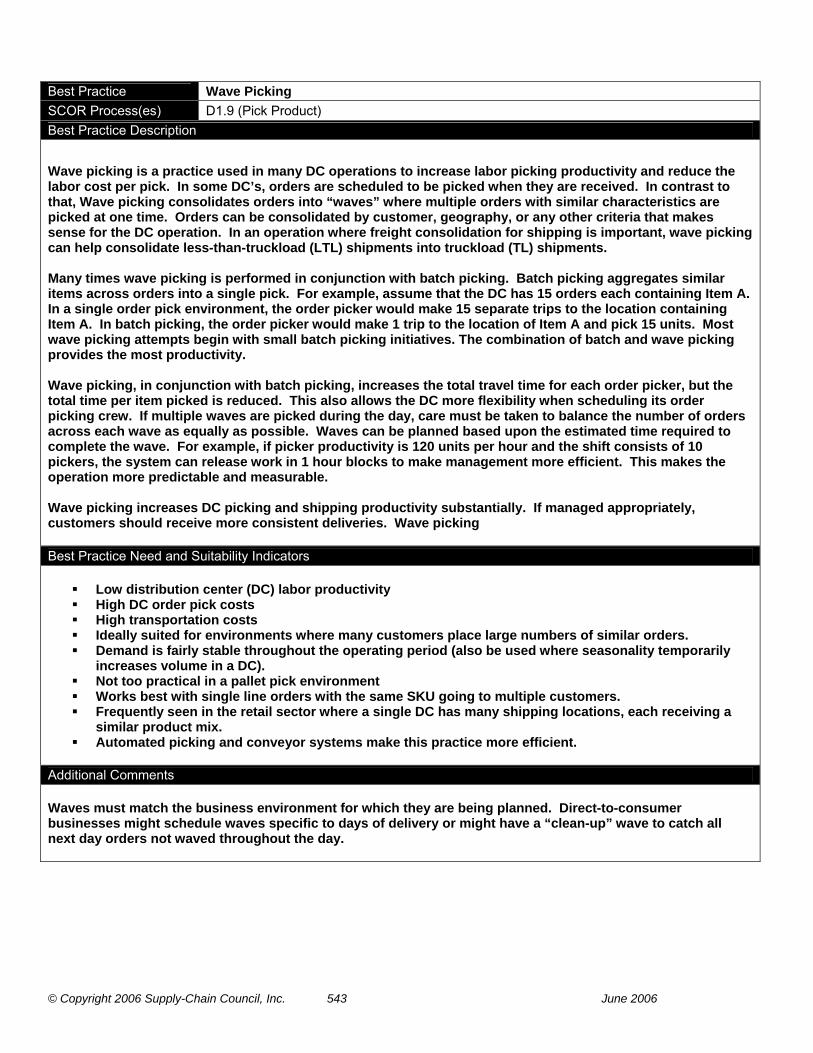
© Copyright 2006 Supply-Chain Council, Inc. 543 June 2006
Best Practice Wave Picking SCOR Process(es) D1.9 (Pick Product) Best Practice Description
Wave picking is a practice used in many DC operations to increase labor picking productivity and reduce the labor cost per pick. In some DC’s, orders are scheduled to be picked when they are received. In contrast to that, Wave picking consolidates orders into “waves” where multiple orders with similar characteristics are picked at one time. Orders can be consolidated by customer, geography, or any other criteria that makes sense for the DC operation. In an operation where freight consolidation for shipping is important, wave picking can help consolidate less-than-truckload (LTL) shipments into truckload (TL) shipments. Many times wave picking is performed in conjunction with batch picking. Batch picking aggregates similar items across orders into a single pick. For example, assume that the DC has 15 orders each containing Item A. In a single order pick environment, the order picker would make 15 separate trips to the location containing Item A. In batch picking, the order picker would make 1 trip to the location of Item A and pick 15 units. Most wave picking attempts begin with small batch picking initiatives. The combination of batch and wave picking provides the most productivity. Wave picking, in conjunction with batch picking, increases the total travel time for each order picker, but the total time per item picked is reduced. This also allows the DC more flexibility when scheduling its order picking crew. If multiple waves are picked during the day, care must be taken to balance the number of orders across each wave as equally as possible. Waves can be planned based upon the estimated time required to complete the wave. For example, if picker productivity is 120 units per hour and the shift consists of 10 pickers, the system can release work in 1 hour blocks to make management more efficient. This makes the operation more predictable and measurable. Wave picking increases DC picking and shipping productivity substantially. If managed appropriately, customers should receive more consistent deliveries. Wave picking Best Practice Need and Suitability Indicators
Low distribution center (DC) labor productivity High DC order pick costs High transportation costs Ideally suited for environments where many customers place large numbers of similar orders. Demand is fairly stable throughout the operating period (also be used where seasonality temporarily
increases volume in a DC). Not too practical in a pallet pick environment Works best with single line orders with the same SKU going to multiple customers. Frequently seen in the retail sector where a single DC has many shipping locations, each receiving a
similar product mix. Automated picking and conveyor systems make this practice more efficient.
Additional Comments Waves must match the business environment for which they are being planned. Direct-to-consumer businesses might schedule waves specific to days of delivery or might have a “clean-up” wave to catch all next day orders not waved throughout the day.

© Copyright 2006 Supply-Chain Council, Inc. 544 June 2006
Impact on Supply Chain Performance Attributes/Metrics
Attribute Experienced Impact
Reliability Wave picking can increase perfect order fulfillment since there are fewer opportunities to mis-pick product.
Responsiveness Delivery times to customer might increase (consolidation of orders into waves requires holding them for a period of time before they are picked).
Flexibility Increases, because a wide range of specific end-products can be derived from the stocked generic product.
Costs None (except from economies of scale, see additional comment)
Asset Management A lower safety stock level (without effect on fill rate) reduces fixed assets.
Key Best Practice Success Factors
Technology Features
Efficient wave picking requires some type of Warehouse Management System (WMS) software to prioritize orders and allocate them to an appropriate wave. This practice also requires some type of interface with the firm’s order management system and its Transportation Management System (TMS). Batch picking is best accomplished with an integrated sortation device that takes the results of the batch pick and creates individual orders. This is more costly from a capital investment perspective but greatly reduces operating cost and increases the consistency of throughput.
Other Success Factors
Acceptable lead times must be defined between the DC and its customers. This will facilitate the allocation of orders into waves. Training of DC workers is necessary to implement the wave picking process. Also, training will be required for sortation as a result of the batch picking process. Most implementations begin with a small group of customers or geographic locations. Normally, these groups should provide some level of stable demand.
Additional Resources None